Peter N. Golder, Debanjan Mitra, & Christine Moorman …moorman/Publications/What is... · Peter N....
23
Peter N. Golder, Debanjan Mitra, & Christine Moorman What Is Quality? An Integrative Framework of Processes and States Quality is a central element in business strategy and academic research. Despite important research on quality, an opportunity for an integrative framework remains. The authors present an integrative framework of quality that captures how firms and customers produce quality (the quality production process), how firms deliver and customers experience quality (the quality experience process), and how customers evaluate quality (the quality evaluation process). The framework extends the literature in several ways. First, the authors describe important linkages between the three processes, including links reflecting the role of co-production. Second, they point to overlooked aspects of the quality processes that influence how quality is conceptualized and should be managed. These include customer heterogeneity in measurement knowledge and motivation; the role of emotion in quality production, experience, and evaluation; and a new typology of attributes. Third, they propose a quality state residing within each quality process and describe what gives rise to these states, which will enhance decision makers’ ability to measure and manage quality processes. Finally, they offer theoretical and managerial implications derived from their integrative quality framework including 20 strategies to increase customer satisfaction. Keywords: quality, service quality, perceived quality, satisfaction, expectations, emotion, co-production Peter N. Golder is Professor of Marketing, Tuck School of Business, Dart- mouth College (e-mail: [email protected]). Debanjan Mitra is Associate Professor of Marketing, Warrington College of Business Administration, University of Florida (e-mail: [email protected]). Christine Moorman is T. Austin Finch, Sr. Professor of Business Adminis- tration, Fuqua School of Business, Duke University (e-mail: moorman@ duke.edu). The authors thank Kusum Ailawadi, Joel Cohen, Kim Corfman, John Czepiel, Ed Holub, Jack Jacoby, Praveen Kopalle, Don Lehmann, Rich Lutz, Bob Shoemaker, Rick Staelin, Gerry Tellis, Bart Weitz, Russ Winer, Valarie Zeithaml, and, especially, Ajay Kohli and three anonymous JM reviewers for their insightful comments on previous versions of the article. © 2012, American Marketing Association ISSN: 0022-2429 (print), 1547-7185 (electronic) Journal of Marketing Volume 76 (July 2012), 1–23 1 Q uality is perhaps the most important and complex component of business strategy. Firms compete on quality, customers search for quality, and markets are transformed by quality. It is a key force leading to delighted customers, firm profitability, and the economic growth of nations (Deming 1982; Kennedy 1987; Rust, Zahorik, and Keiningham 1995). Given this breadth, quality has roots in business practice and in many disciplines including marketing, management, economics, engineering, operations, strategy, and consumer research. In business practice, views of quality have evolved over the past 30 years through programs such as Total Quality Management, the Baldrige Awards, and Six Sigma, all of which have helped firms improve quality, particularly in manufactured goods (Deming 1982; Powell 1995). Acade- mic research has also contributed to our understanding of quality. 1 For example, marketing’s explication of service quality has enhanced our understanding of perceived qual- ity, customer expectations, and satisfaction (e.g., Boulding et al. 1993; Cronin and Taylor 1994; Oliver 1980; Parasura- man, Zeithaml, and Berry 1985, 1988; Zeithaml 1988). Quality continues to be a frequent focus of research in mar- keting and other disciplines. In fact, over the last five years, 79 articles on quality have been published in Journal of Marketing and Management Science. Despite these advances, we believe that different per- spectives on quality have resulted in an academic literature that is field-specific (Holbrook and Corfman 1985). For example, economics and industrial organization researchers view quality in terms of vertical product differentiation (e.g., Sutton 1986), whereas management researchers study quality in terms of organizational processes such as quality circles and total quality management (e.g., Powell 1995). In marketing, customers’ perceptions of quality are paramount (Buzzell and Gale 1987; Parasuraman, Zeithaml, and Berry 1985). For example, Zeithaml (1988) defines “price, qual- ity, and value from the customer’s perspective” (p. 2) and notes that “objective quality may not exist because all qual- ity is perceived by someone” (p. 5). In contrast, thought leaders in the quality management literature believe that perceived quality is just one of many dimensions of quality (Garvin 1984). Finally, in operations and engineering, qual- ity means conformance to design specifications or the relia- bility of internal processes, even though many customers do not find these processes meaningful (Feigenbaum 1991; Juran 1992; Shewhart 1986). We believe that these different disciplinary perspectives hinder the development of a coherent body of knowledge, minimize knowledge transfer across disciplines, and cloud contributions to practice. Different perspectives pervade research within market- ing as well (Rust, Moorman, and Dickson 2002). As one 1 Seminal contributions include how statistical quality control and process design improve production processes while reducing costs (e.g., Juran 1992; Shewhart 1986) and how customers’ quality uncer- tainty and valuation may explain important market equilibria and determine optimal regulation levels (Akerlof 1970; Spence 1975).
Transcript of Peter N. Golder, Debanjan Mitra, & Christine Moorman …moorman/Publications/What is... · Peter N....

Peter N. Golder, Debanjan Mitra, & Christine Moorman
What Is Quality? An IntegrativeFramework of Processes and StatesQuality is a central element in business strategy and academic research. Despite important research on quality, anopportunity for an integrative framework remains. The authors present an integrative framework of quality thatcaptures how firms and customers produce quality (the quality production process), how firms deliver and customersexperience quality (the quality experience process), and how customers evaluate quality (the quality evaluationprocess). The framework extends the literature in several ways. First, the authors describe important linkagesbetween the three processes, including links reflecting the role of co-production. Second, they point to overlookedaspects of the quality processes that influence how quality is conceptualized and should be managed. These includecustomer heterogeneity in measurement knowledge and motivation; the role of emotion in quality production,experience, and evaluation; and a new typology of attributes. Third, they propose a quality state residing withineach quality process and describe what gives rise to these states, which will enhance decision makers’ ability tomeasure and manage quality processes. Finally, they offer theoretical and managerial implications derived fromtheir integrative quality framework including 20 strategies to increase customer satisfaction.
Keywords: quality, service quality, perceived quality, satisfaction, expectations, emotion, co-production
Peter N. Golder is Professor of Marketing, Tuck School of Business, Dart-mouth College (e-mail: [email protected]). DebanjanMitra is Associate Professor of Marketing, Warrington College of BusinessAdministration, University of Florida (e-mail: deb.mitra@warrington. ufl. edu).Christine Moorman is T. Austin Finch, Sr. Professor of Business Adminis-tration, Fuqua School of Business, Duke University (e-mail: [email protected]). The authors thank Kusum Ailawadi, Joel Cohen, Kim Corfman,John Czepiel, Ed Holub, Jack Jacoby, Praveen Kopalle, Don Lehmann, RichLutz, Bob Shoemaker, Rick Staelin, Gerry Tellis, Bart Weitz, Russ Winer,Valarie Zeithaml, and, especially, Ajay Kohli and three anonymous JMreviewers for their insightful comments on previous versions of the article.
© 2012, American Marketing AssociationISSN: 0022-2429 (print), 1547-7185 (electronic)
Journal of MarketingVolume 76 (July 2012), 1–231
Quality is perhaps the most important and complexcomponent of business strategy. Firms compete onquality, customers search for quality, and markets
are transformed by quality. It is a key force leading todelighted customers, firm profitability, and the economicgrowth of nations (Deming 1982; Kennedy 1987; Rust,Zahorik, and Keiningham 1995). Given this breadth, qualityhas roots in business practice and in many disciplinesincluding marketing, management, economics, engineering,operations, strategy, and consumer research.
In business practice, views of quality have evolved overthe past 30 years through programs such as Total QualityManagement, the Baldrige Awards, and Six Sigma, all ofwhich have helped firms improve quality, particularly inmanufactured goods (Deming 1982; Powell 1995). Acade-mic research has also contributed to our understanding ofquality.1 For example, marketing’s explication of service
quality has enhanced our understanding of perceived qual-ity, customer expectations, and satisfaction (e.g., Bouldinget al. 1993; Cronin and Taylor 1994; Oliver 1980; Parasura-man, Zeithaml, and Berry 1985, 1988; Zeithaml 1988).Quality continues to be a frequent focus of research in mar-keting and other disciplines. In fact, over the last five years,79 articles on quality have been published in Journal ofMarketing and Management Science.
Despite these advances, we believe that different per-spectives on quality have resulted in an academic literaturethat is field-specific (Holbrook and Corfman 1985). Forexample, economics and industrial organization researchersview quality in terms of vertical product differentiation(e.g., Sutton 1986), whereas management researchers studyquality in terms of organizational processes such as qualitycircles and total quality management (e.g., Powell 1995). Inmarketing, customers’ perceptions of quality are paramount(Buzzell and Gale 1987; Parasuraman, Zeithaml, and Berry1985). For example, Zeithaml (1988) defines “price, qual-ity, and value from the customer’s perspective” (p. 2) andnotes that “objective quality may not exist because all qual-ity is perceived by someone” (p. 5). In contrast, thoughtleaders in the quality management literature believe thatperceived quality is just one of many dimensions of quality(Garvin 1984). Finally, in operations and engineering, qual-ity means conformance to design specifications or the relia-bility of internal processes, even though many customers donot find these processes meaningful (Feigenbaum 1991;Juran 1992; Shewhart 1986). We believe that these differentdisciplinary perspectives hinder the development of acoherent body of knowledge, minimize knowledge transferacross disciplines, and cloud contributions to practice.
Different perspectives pervade research within market-ing as well (Rust, Moorman, and Dickson 2002). As one
1Seminal contributions include how statistical quality control andprocess design improve production processes while reducing costs(e.g., Juran 1992; Shewhart 1986) and how customers’ quality uncer-tainty and valuation may explain important market equilibria anddetermine optimal regulation levels (Akerlof 1970; Spence 1975).
example, scholars have proposed alternative quality frame-works for goods or services but not an integrated view ofboth (Brady and Cronin 2001; Brucks, Zeithaml, and Nay-lor 2000; Parasuraman, Zeithaml, and Berry 1988). Inanother example, quality has been operationalized as orused interchangeably with customer satisfaction (Fornell1995; Karmarkar 1996) even though these concepts are dis-tinct (Oliver 2009).
Given the lack of a common understanding across andwithin disciplines, it is not surprising that conceptual ambigu-ity about quality persists. On the basis of an exhaustive reviewof the quality literature, Reeves and Bednar (1994) concludethat “no universal, parsimonious, or all-encompassing defi-nition or model of quality exists” (p. 436) and that “differ-ent definitions of quality are appropriate under different cir-cumstances” (p. 419). More recently, Karmarkar and Apte(2007, p. 451) lament that “quality measurement and defini-tion is a particularly complex issue.... A few specializedexamples do exist. But is there a general template thatwould work for quality?” In some respects, these conclu-sions leave the study of quality at a crossroads not muchdifferent from Pirsig’s (1974, pp. 260–1) observation madeover 30 years ago in the cult novel Zen and the Art ofMotorcycle Maintenance, “even though Quality cannot bedefined, you know what Quality is!” (italics in original).
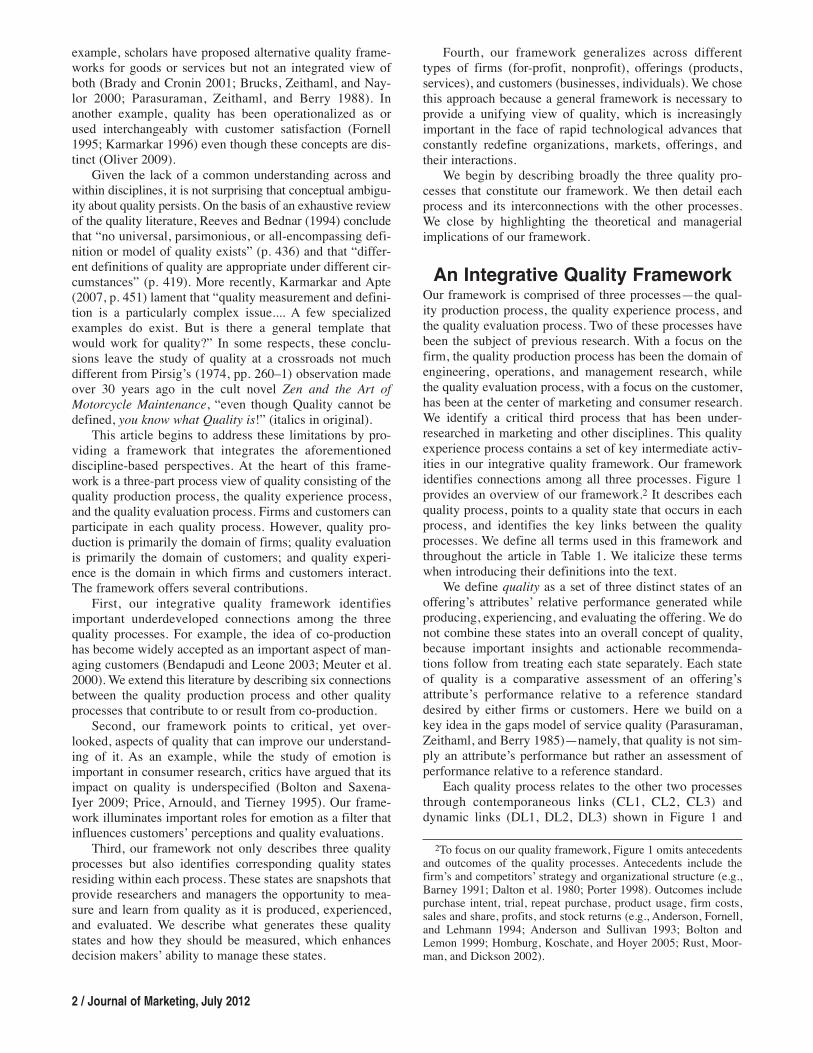
This article begins to address these limitations by pro-viding a framework that integrates the aforementioned discipline-based perspectives. At the heart of this frame-work is a three-part process view of quality consisting of thequality production process, the quality experience process,and the quality evaluation process. Firms and customers canparticipate in each quality process. However, quality pro-duction is primarily the domain of firms; quality evaluationis primarily the domain of customers; and quality experi-ence is the domain in which firms and customers interact.The framework offers several contributions.
First, our integrative quality framework identifiesimportant underdeveloped connections among the threequality processes. For example, the idea of co-productionhas become widely accepted as an important aspect of man-aging customers (Bendapudi and Leone 2003; Meuter et al.2000). We extend this literature by describing six connectionsbetween the quality production process and other qualityprocesses that contribute to or result from co-production.
Second, our framework points to critical, yet over-looked, aspects of quality that can improve our understand-ing of it. As an example, while the study of emotion isimportant in consumer research, critics have argued that itsimpact on quality is underspecified (Bolton and Saxena-Iyer 2009; Price, Arnould, and Tierney 1995). Our frame-work illuminates important roles for emotion as a filter thatinfluences customers’ perceptions and quality evaluations.
Third, our framework not only describes three qualityprocesses but also identifies corresponding quality statesresiding within each process. These states are snapshots thatprovide researchers and managers the opportunity to mea-sure and learn from quality as it is produced, experienced,and evaluated. We describe what generates these qualitystates and how they should be measured, which enhancesdecision makers’ ability to manage these states.
2 / Journal of Marketing, July 2012
Fourth, our framework generalizes across differenttypes of firms (for-profit, nonprofit), offerings (products,services), and customers (businesses, individuals). We chosethis approach because a general framework is necessary toprovide a unifying view of quality, which is increasinglyimportant in the face of rapid technological advances thatconstantly redefine organizations, markets, offerings, andtheir interactions.
We begin by describing broadly the three quality pro-cesses that constitute our framework. We then detail eachprocess and its interconnections with the other processes.We close by highlighting the theoretical and managerialimplications of our framework.
An Integrative Quality FrameworkOur framework is comprised of three processes—the qual-ity production process, the quality experience process, andthe quality evaluation process. Two of these processes havebeen the subject of previous research. With a focus on thefirm, the quality production process has been the domain ofengineering, operations, and management research, whilethe quality evaluation process, with a focus on the customer,has been at the center of marketing and consumer research.We identify a critical third process that has been under -researched in marketing and other disciplines. This qualityexperience process contains a set of key intermediate activ-ities in our integrative quality framework. Our frameworkidentifies connections among all three processes. Figure 1provides an overview of our framework.2 It describes eachquality process, points to a quality state that occurs in eachprocess, and identifies the key links between the qualityprocesses. We define all terms used in this framework andthroughout the article in Table 1. We italicize these termswhen introducing their definitions into the text.
We define quality as a set of three distinct states of anoffering’s attributes’ relative performance generated whileproducing, experiencing, and evaluating the offering. We donot combine these states into an overall concept of quality,because important insights and actionable recommenda-tions follow from treating each state separately. Each stateof quality is a comparative assessment of an offering’sattribute’s performance relative to a reference standarddesired by either firms or customers. Here we build on akey idea in the gaps model of service quality (Parasuraman,Zeithaml, and Berry 1985)—namely, that quality is not sim-ply an attribute’s performance but rather an assessment ofperformance relative to a reference standard.
Each quality process relates to the other two processesthrough contemporaneous links (CL1, CL2, CL3) anddynamic links (DL1, DL2, DL3) shown in Figure 1 and
2To focus on our quality framework, Figure 1 omits antecedentsand outcomes of the quality processes. Antecedents include thefirm’s and competitors’ strategy and organizational structure (e.g.,Barney 1991; Dalton et al. 1980; Porter 1998). Outcomes includepurchase intent, trial, repeat purchase, product usage, firm costs,sales and share, profits, and stock returns (e.g., Anderson, Fornell,and Lehmann 1994; Anderson and Sullivan 1993; Bolton andLemon 1999; Homburg, Koschate, and Hoyer 2005; Rust, Moor-man, and Dickson 2002).

What Is Q
uality?/ 3
aCL refers to contemporaneous links that occur in the current time period, and DL refers to dynamic links that either draw on information from a previous period or feed information to the next period.
FIGURE 1Overview of Integrative Quality Framework: Key Processes, States, and Linksa
Customers’ perceived attributes are used to form
evaluated aggregate quality and satisfaction (CL2)
Customers’ expectations influence
perceived attributes (DL2)
Customers’ perceived attributes and emotions influence attribute design (DL1)
Firms’ produced attributes are delivered by the firm in order to be perceived by customers (CL1)
Customers’ evaluated aggregate quality and satisfaction influence attribute design (DL3)
Customers co-producing or observing production processes gather information that influences attribute expectations (CL3)
The Quality Production Process
• Process Description: Firms’ attribute design and process design specify conversion of resource inputs into produced attributes.
• Quality State: Produced attribute quality
The Quality Experience Process
• Process Description: Customers experience all of the firm’s delivered attributes while perceiving some of them.
• Quality State: Experienced attribute quality
The Quality Evaluation Process
• Process Description: Customers compare an offering’s perceived attributes with their expectations to form evaluated aggregate quality and satisfaction.
• Quality State: Evaluated aggregate quality

4 / Journal of Marketing, July 2012
TABLE 1Definitions Used in the Integrative Quality Framework
Quality1. Quality is a set of three distinct states of an offering’s attributes’ relative performance generated while producing,experiencing, and evaluating the offering.
2. Offerings are products, services, or a combination of both.3. Attributes are components, properties, or features that comprise an offering.4. Attribute characteristics•Performance is the extent or level of an attribute’s functionality.•Reliability is the probability of an attribute performing at its intended level of functionality.
The Quality Production Process1. The quality production process occurs when firms use attribute design and process design specifications to convert theirresource inputs and those from customers into produced attributes.
2. Within this process, the state of produced attribute quality is an offering’s produced attribute performance relative to thefirm’s attribute design specification.•Attribute design specifies the resource inputs (from firms, customers, or both), attribute performance, and attribute relia-bility that an offering must deliver.•Process design implements the attribute design by specifying how resource inputs are converted into produced attributes.
3. Quality control methods consist of a set of procedures for monitoring produced attribute quality and maintaining or improvingthe process design specifications.•Offline methods use experiments and simulations to improve produced attribute quality through changes in processdesign.•Online methods monitor produced attribute quality and make necessary adjustments to the production process while it isin progress.•Inspection methods measure resource inputs or produced attributes and reject those that do not meet specifications.
4. Resource inputs are the material and human resources used to generate produced attributes. Material resources includeraw materials and intermediate offerings provided by the firm’s suppliers. Human resources include physical labor,knowledge and insights provided by the firm’s employees, suppliers, and, in cases of co-production, its customers.
The Quality Experience Process1. The quality experience process occurs when firms (alone or with customers) deliver attributes for customers to experienceand customers perceive these attributes through the lens of their measurement knowledge and motivation, emotions, andexpectations.
2. Within this process, the state of experienced attribute quality is an offering’s delivered attribute performance relative to acustomer’s ‘ideal’ expectation.
3. Attribute types•Universal attributes are those for which customer preferences are homogeneous and measurement is unambiguous.•Preference attributes are those for which customer preferences are heterogeneous and measurement is unambiguous.•Idiosyncratic attributes are those for which customer preferences are heterogeneous and measurement is ambiguous.
4. Measurement knowledge is the customer’s ability to assess attribute performance with minimal bias and variance relativeto more objective measures.
5. Measurement motivation is the customer’s desire to assess attribute performance with minimal bias and variance relativeto more objective measures.
6. Emotion is the set of feelings evoked in customers during the quality experience process.The Quality Evaluation Process1. The quality evaluation process occurs when customers compare an offering’s perceived attributes with their expectationsto form summary judgments of quality and then satisfaction.
2. Within this process, the state of evaluated aggregate quality is the aggregation across attributes of an offering’s perceivedattribute performance relative to a customer’s ‘ideal’ expectation.
3. Expectations are attribute performance reference levels a customer uses when perceiving and evaluating individualattributes.•‘Will’ expectations are the attribute performance levels a customer predicts or believes an offering is going to deliver.•‘Ideal’ expectations are the attribute performance levels that reflect a customer’s ideal preferences across all offerings ina category.•‘Should’ expectations are the attribute performance levels a customer believes competing offerings in a category ought todeliver.
4. Expectation uncertainty is the variance in a customer’s expectation of an attribute’s performance. Each type of expectationshas a corresponding uncertainty: ‘will’ uncertainty, ‘ideal’ uncertainty, and ‘should’ uncertainty.
5. Accumulated information consists of stored customer knowledge accrued from a customer’s own experiences, othercustomers’ experiences, firm strategies (e.g., customer relationship and brand strategies), media reports, and qualitysignals associated with each attribute.
6. Quality disconfirmation is the aggregation across attributes of an offering’s perceived attribute performance relative to acustomer’s ‘should’ expectation.
7. Customer satisfaction is a postconsumption judgment that compares an offering’s evaluated aggregate quality with itsquality disconfirmation.

described in subsequent sections. Contemporaneous linksoccur in the current time period, whereas dynamic linkseither draw on information from a previous period or feedinformation to the next period.
The quality production process occurs when firms useattribute design and process design specifications to converttheir resource inputs and those from customers into producedattributes. Attribute design specifies the resource inputs(from firms, customers, or both), attribute performance, andattribute reliability that an offering must deliver. Processdesign implements the attribute design by specifying howresource inputs are converted into produced attributes.Within this process, the state of produced attribute qualityis an offering’s produced attribute performance relative tothe firm’s attribute design specification. The quality produc-tion process receives multiple sources of feedback, whichfirms can use to improve attribute design.
The quality experience process occurs when firms(alone or with customers) deliver attributes for customers toexperience and customers perceive these attributes throughthe lens of their measurement knowledge and motivation,emotions, and expectations.3 In this process, there is trans-lation from what the customer experiences (delivered attri -butes) to what the customer perceives.4 Customers will notperceive accurately all attributes they experience and willoverlook some attributes entirely. Within this process, thestate of experienced attribute quality is an offering’s deliv-ered attribute performance relative to a customer’s ‘ideal’expectation. Although customers and firms can both mea-sure experienced attribute quality, we argue that firms aremore able and motivated to do so.
The quality evaluation process occurs when customerscompare an offering’s perceived attributes with their expec-tations to form summary judgments of quality and then sat-isfaction. These expectations are determined by accumulatedinformation consisting of stored customer knowledge accruedfrom a customer’s own experiences, other customers’ expe-riences, firm strategies (e.g., customer relationship andbrand strategies), media reports, and quality signals associ-ated with each attribute (Kirmani and Rao 2000; Woodruff,Cadotte, and Jenkins 1983). Within this process, the state ofevaluated aggregate quality is the aggregation across attri -butes of an offering’s perceived attribute performance rela-tive to a customer’s ‘ideal’ expectation.5 Although this stateresides in customers, firms benefit from measuring it.
Our framework adopts a novel stance on the nature ofquality. Specifically, quality occurs as three distinct andmeasurable states (produced attribute quality, experiencedattribute quality, and evaluated aggregate quality). These
What Is Quality? / 5
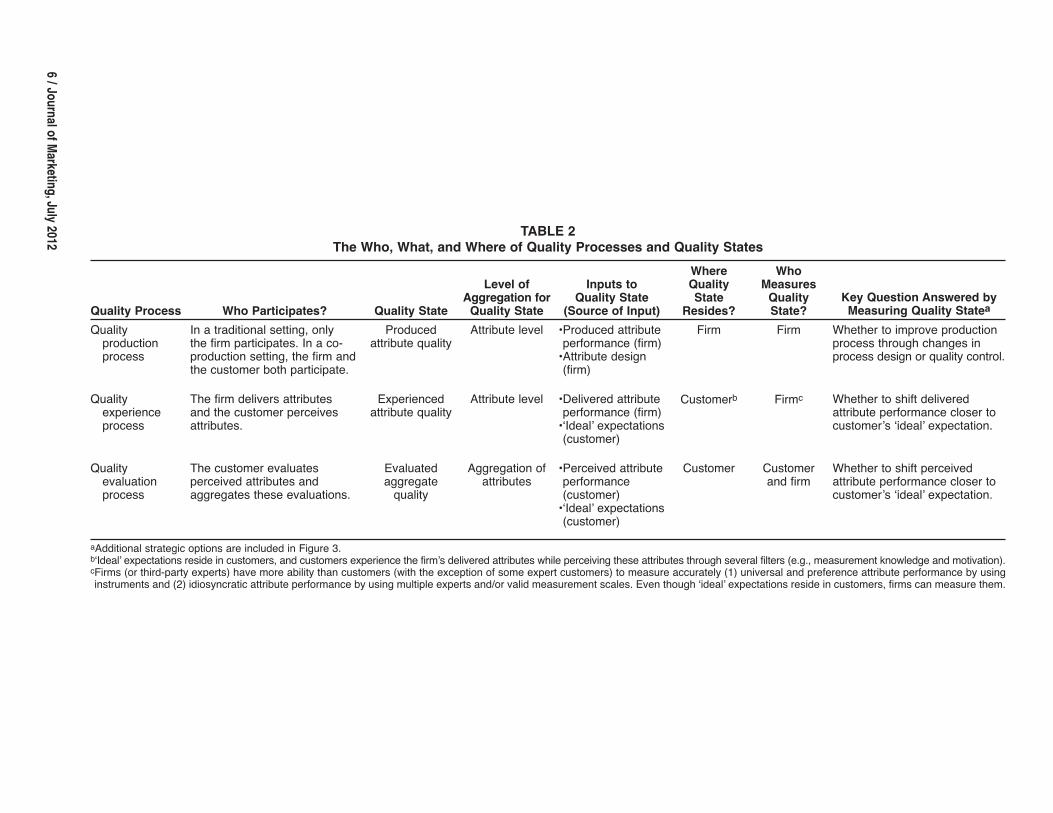
quality states are generated within the three quality pro-cesses. Articulating and integrating the quality processesand corresponding quality states offers several importantadvantages for conceptualizing, measuring, and managingthese processes and states. For example, by measuringexperienced attribute quality, firms can better understandwhether poor evaluated aggregate quality is due to deliv-ered attributes or customer limitations in perceiving thoseattributes. This decomposition offers firms several strate-gies for dealing with poor evaluated aggregate qualitybeyond changing produced attributes. In Table 2, wedescribe the roles of firms and customers in the three qual-ity processes and states. We elaborate on these roles in ourdiscussion of each quality process.
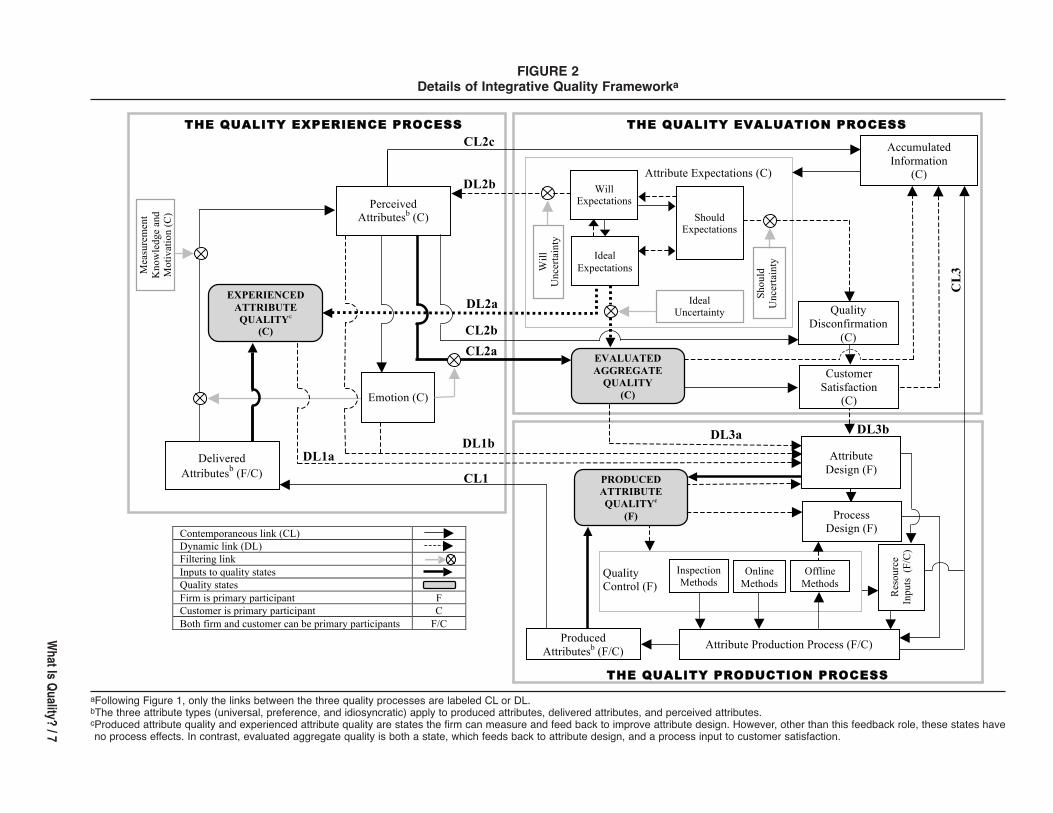
The next three sections detail the three quality processesand associated quality states as depicted in Figure 2. Webegin with the quality experience process because key ideasare introduced here that are important to the other processes.We then discuss the quality evaluation and quality produc-tion processes. Our framework’s closed-loop, dynamicnature means that each quality process is an antecedent anda consequence of the other two processes.
The Quality Experience ProcessThe quality experience process occurs when attributesdelivered by firms are perceived by customers. As shown inFigure 2, we differentiate between delivered attributes andperceived attributes because what is delivered to customersand what customers perceive is often not the same (Boltonand Drew 1991; Mitra and Golder 2006; Parasuraman, Zeit-haml, and Berry 1985). The degree of correspondencebetween delivered and perceived attributes is determined bythe nature of an attribute and customers’ measurementknowledge and motivation, emotions, and ‘will’ expecta-tions. Thus, an experience provides the opportunity for cus-tomers to perceive an attribute but does not necessarilymean they will perceive each attribute or perceive it accu-rately. Within the quality experience process, the state ofexperienced attribute quality is the performance of a deliv-ered attribute relative to a customer’s ‘ideal’ expectation ofthat attribute’s performance. Therefore, experiencedattribute quality will vary across customers depending ontheir ‘ideal’ expectations. Relative to a typical customer,firms are more capable of measuring attribute performanceaccurately because firms have greater access to measure-ment instruments. Firms also have the ability to measurecustomers’ ‘ideal’ expectations and benefit by comparingthose expectations with delivered attribute performance.
We offer four advances in the quality experience process:(1) experienced attribute quality as one state of quality, (2) atypology of an offering’s attributes, (3) customer hetero-geneity in measurement knowledge and measurement moti-vation, and (4) the impact of customer emotion.Experienced Attribute QualityExperienced attribute quality is the performance of a deliv-ered attribute relative to a customer’s ‘ideal’ expectation ofthat attribute. We define an attribute’s performance as theextent or level of its functionality. Functionality varies
3Our conceptualization of a customer’s role in the qualityexperience process is partially grounded on the classic learningmodels that distinguish between experience and evaluation(Dewey 1938; Kolb 1984).4Hoch and Deighton (1989, p. 1) refer to this as a meeting of
“objective truth” and subjective observation.5Evaluated aggregate quality is similar to previous researchers’
conceptualization of perceived quality (e.g., Zeithaml 1988).However, as we will show, our framework distinguishes betweenattribute perceptions and quality evaluations to expose moreopportunities for theory development and managerial insight.
6/ Journal of M
arketing, July 2012
Quality Process Who Participates? Quality State
Level of Aggregation forQuality State
Inputs to Quality State
(Source of Input)
Where QualityState
Resides?
Who MeasuresQualityState?
Key Question Answered byMeasuring Quality Statea
Quality productionprocess
In a traditional setting, only the firm participates. In a co-production setting, the firm andthe customer both participate.
Producedattribute quality
Attribute level •Produced attributeperformance (firm)•Attribute design(firm)
Firm Firm Whether to improve productionprocess through changes inprocess design or quality control.
Quality experienceprocess
The firm delivers attributes and the customer perceivesattributes.
Experiencedattribute quality
Attribute level •Delivered attributeperformance (firm)•‘Ideal’ expectations(customer)
Customerb Firmc Whether to shift deliveredattribute performance closer tocustomer’s ‘ideal’ expectation.
Quality evaluationprocess
The customer evaluates perceived attributes and aggregates these evaluations.
Evaluatedaggregate quality
Aggregation ofattributes
•Perceived attributeperformance (customer)•‘Ideal’ expectations(customer)
Customer Customerand firm
Whether to shift perceivedattribute performance closer tocustomer’s ‘ideal’ expectation.
TABLE 2The Who, What, and Where of Quality Processes and Quality States
aAdditional strategic options are included in Figure 3.b‘Ideal’ expectations reside in customers, and customers experience the firm’s delivered attributes while perceiving these attributes through several filters (e.g., measurement knowledge and motivation).cFirms (or third-party experts) have more ability than customers (with the exception of some expert customers) to measure accurately (1) universal and preference attribute performance by usinginstruments and (2) idiosyncratic attribute performance by using multiple experts and/or valid measurement scales. Even though ‘ideal’ expectations reside in customers, firms can measure them.
What Is Q
uality?/ 7
FIGURE 2Details of Integrative Quality Frameworka
DL3a DL3b
TTHHEE QQUUAALLIITTYY PPRROODDUUCCTTIIOONN PPRROOCCEESSSS
CL2c
TTHHEE QQUUAALLIITTYY EEXXPPEERRIIEENNCCEE PPRROOCCEESSSS TTHHEE QQUUAALLIITTYY EEVVAALLUUAATTIIOONN PPRROOCCEESSSS
Contemporaneous link (CL) Dynamic link (DL) Filtering link Inputs to quality states Quality states Firm is primary participant F Customer is primary participant C Both firm and customer can be primary participants F/C
DL2a
CL2a
DL1b DL1a
CL1
Attribute Expectations (C)
EVALUATED AGGREGATE
QUALITY (C)
Attribute Design (F)
Ideal Uncertainty
Will Expectations
Quality Disconfirmation
(C)
Mea
sure
men
t K
now
ledg
e an
d M
otiv
atio
n (C
)
Will
U
ncer
tain
ty
Delivered Attributesb (F/C)
Emotion (C)
EXPERIENCED ATTRIBUTE QUALITYc
(C)
Shou
ld
Unc
erta
inty
Process Design (F)
Should Expectations
Perceived Attributesb (C)
CL
3
PRODUCED ATTRIBUTE QUALITYc
(F)
Ideal Expectations
Accumulated Information
(C)
Customer Satisfaction
(C)
CL2b
Quality Control (F)
Online Methods
Inspection Methods
Offline Methods
Res
ourc
e In
puts
(F/
C)
Produced Attributesb (F/C) Attribute Production Process (F/C)
DL2b
aFollowing Figure 1, only the links between the three quality processes are labeled CL or DL.bThe three attribute types (universal, preference, and idiosyncratic) apply to produced attributes, delivered attributes, and perceived attributes. cProduced attribute quality and experienced attribute quality are states the firm can measure and feed back to improve attribute design. However, other than this feedback role, these states haveno process effects. In contrast, evaluated aggregate quality is both a state, which feeds back to attribute design, and a process input to customer satisfaction.

across offerings. For example, automobile brakes differ inbraking distance (in units of feet), which is a measure of abrake’s performance, while restaurants differ in order ful-fillment time (in units of seconds), which is a measure ofresponsiveness performance. Performance alone is not qual-ity; quality assessments require comparison standards to con-vert attribute performance into quality states. For example,even if the braking distances of a sports car and a familysedan are identical, produced attribute quality will differ whenthe firm-specified braking distance for sports cars is shorter.An attribute’s reliability is the probability of an attribute per-forming at its intended level of functionality.6 An attributeis unreliable when its performance falls outside the range ofits design specification. For example, different automobileswith the same braking distance may fall outside their speci-fied braking performance ranges with different frequencies.
Experienced attribute quality is important for firms tomeasure because it typically reflects a more accurate assess-ment of attribute performance than customers’ perceivedattributes (an input to evaluated aggregate quality). This isbecause perceived attributes are viewed through severalcustomer filters that can prevent or bias their perception.Experienced attribute quality can be an elusive state to mea-sure because it requires firms to accurately measure eachattribute’s performance and each customer’s ‘ideal’ expec-tation. However, the firm’s attribute performance designcould bias its assessment of delivered attribute perfor-mance, and the firm’s ideal attribute performance could biasits assessment of a customer’s ‘ideal’ expectation.7 Giventhe potential for biased assessments, firms may want to sup-plement their own measures of experienced attribute qualitywith third-party assessments (e.g., a Consumer Reports rat-ing relative to target segment preference). Furthermore, it isimportant to note that experienced attribute quality willvary as customers’ ‘ideal’ expectations vary. Despite this, itis possible for firms to learn from experienced attribute qual-ity. For example, customers have heterogeneous preferencesfor room temperature in a restaurant, so managers can usecustomers’ average ideal temperature to maximize experi-enced attribute quality for temperature across customers.A Two-Dimensional Typology of AttributesWe propose that the nature of an attribute will influencehow accurately customers are able to perceive and evaluateits performance. To extend the literature, we offer a typol-ogy of attribute types based on two key dimensions. Thefirst dimension, customer preference, describes whethercustomers have homogenous or heterogeneous attributepreferences. Derived from economic theory, this dimension
8 / Journal of Marketing, July 2012
differentiates between attributes with homogeneous prefer-ences (e.g., a longer-lasting light bulb) and attributes withheterogeneous preferences (e.g., sweet vs. savory taste)(Desai 2001; Hotelling 1929; Salop 1979; Sutton 1986).Customer preferences are homogeneous for vector attri -butes, which are attributes for which all customers prefereither higher performance (e.g., airplane seat legroom) orlower performance (e.g., cabin noise). Customer prefer-ences are heterogeneous for ideal-point attributes, whichare attributes for which each customer has an individualideal point (e.g., cabin temperature).
The second dimension, measurement ambiguity, refers towhether an attribute’s performance can be measured unam-biguously or ambiguously. Unambiguous attributes (e.g., seatwidth) can be measured with instruments such as measuringtapes, watches, odometers, thermometers, dynamometers,seismometers, measuring cups, scales, and so forth. Ambigu-ous attributes (e.g., aesthetics of an airline lounge) are mea-sured through human senses (Kahn and Wansink 2004).
We combine our two dimensions of customer prefer-ence (homogeneous, heterogeneous) and measurementambiguity (unambiguous, ambiguous) to derive the four-celled typology of attributes depicted in Web Appendix A(http://www.marketingpower.com/jm_webappendix). Wenext describe each attribute type.8
Universal attributes are those for which customer prefer-ences are homogeneous and measurement is unambiguous.For an airline, universal attributes include flight delay inci-dence, legroom, seat width, and cabin noise. Preferenceattributes are those for which customer preferences are het-erogeneous and measurement is unambiguous. For an air-line, preference attributes include arrival and departuretimes, meal cuisine type, cabin temperature, locations ofexits and lavatories, and seating configuration and material(cloth or leather). Idiosyncratic attributes are those forwhich customer preferences are heterogeneous and mea-surement is ambiguous. Idiosyncratic attributes include ele-ments of art, beauty, and social interaction. For an airline,idiosyncratic attributes include the aesthetics of an airlinelounge, appearance of agents and flight attendants, andinteractions with fellow passengers.
The fourth cell of the typology is empty because wecould not uncover any attribute for which customers havehomogeneous preferences and measurement is ambiguous.Some may argue that constructs like helpfulness belong inthe fourth cell (i.e., it is measured with the senses and cus-tomers prefer more helpfulness). We contend that such con-structs are a combination of individual attributes, and evenwhen customers agree about the construct, they disagreeabout which attributes provide it. For example, helpfulnesscan be decomposed into universal attributes (e.g., waittime), preference attributes (e.g., time taken to explain), andidiosyncratic attributes (e.g., talkative demeanor). There-fore, any construct that fits into the empty fourth cell repre-sents a higher-level construal that does not help us under-stand quality at the attribute level.
6For simplicity, our definitions of quality and quality states use“performance” to capture both the level of performance and theprobability of performing at that level.7Two confirmatory biases are possible. First, managers may see
the firm’s attribute performance design, not the actual level ofdelivered attribute performance. Second, managers may infer thatcustomers have the same ideal attribute performance as the firm.These biases are more likely with attributes that cannot be mea-sured with instruments or when customers are unfamiliar withinstrument measures.
8We house our discussion of attribute types in the qualityexperience process. However, these types occur across all threequality processes.

Customer Measurement Knowledge andMotivationHow accurately a customer translates delivered attributesinto perceived attributes is influenced by both customermeasurement knowledge and measurement motivation (seeFigure 2). Measurement knowledge is the customer’s abilityto assess attribute performance with minimal bias and vari-ance relative to more objective measures. The objectivemeasure for universal and preference attributes is an instru-ment reading (e.g., thermometer, stopwatch), while anexpert consensus (e.g., Delphi method, jury method) is usedfor idiosyncratic attributes. In general, higher measurementknowledge leads to a more direct translation from deliveredattributes to perceived attributes. Prior literature suggeststhe important role of customers’ measurement knowledgeby describing attributes as “imperfectly observable” (Erdemand Keane 1996, p. 5). Measurement knowledge may beless important for universal attributes and preference attri -butes because they can be measured unambiguously andcommunicated to customers via third-party publications(e.g., Consumer Reports), firm strategies (e.g., advertising,packaging), and word of mouth (Tellis and Johnson 2007).
Measurement motivation is the customer’s desire toassess attribute performance with minimal bias and vari-ance relative to more objective measures (MacInnis, Moor-man, and Jaworski 1991; Petty and Cacioppo 1986). Highmeasurement motivation means that customers will devoteresources to assess attribute performance. Like measure-ment knowledge, motivation may be less (more) importantwhen attribute information is easier (more difficult) toassess.9
Customer EmotionCustomer emotion is a third intervening factor between deliv-ered attributes and perceived attributes. Emotion is alreadyin our framework as an idiosyncratic attribute (e.g., joy)delivered by a firm and perceived by customers (Hennig-Thurau et al. 2006). However, emotion in Figure 2 refers tothe set of feelings evoked in customers during the qualityexperience process (e.g., Arnould and Price 1993). Theseemotions are not attributes; they are an outcome of perceiv-ing attributes and a filter in both subsequent attribute per-ceptions and evaluations.10 Emotion can be evoked by anyattribute. Long waits can be frustrating and attentive carecan be heartwarming.
Once customer emotions are generated, we predict threeeffects on the quality experience process. First, emotionmay generate a confirmatory bias, which leads customers toperceive and to evaluate attributes that validate their feel-ings and to neglect disconfirming attributes (Cohen, Pham,and Andrade 2008). Second, negative emotion can make
What Is Quality? / 9
customers’ observations myopic, resulting in failure to per-ceive attributes delivered by the firm (Loewenstein 1996).Third, positive emotion can lead to holistic assessmentswherein customers may underweight some attributes informing quality evaluations. This can occur, for example, inwhite-water rafting when dirt and hard work are discountedwhile feelings of renewal and authenticity drive qualityevaluations (Arnould and Price 1993). A final factor influ-encing the relationship between delivered attributes andperceived attributes is ‘will’ expectations, which are formedin the quality evaluation process. We discuss this in the nextsection.
The Quality Evaluation ProcessOur depiction of the quality evaluation process in Figure 2builds on an extensive literature (e.g., Anderson, Fornell,and Lehmann 1994; Bolton and Drew 1991; Bolton,Lemon, and Verhoef 2008; Price and Arnould 1999; Steen-kamp 1990; Zeithaml 1988). The core feature of the qualityevaluation process is the conversion of perceived attributesinto an aggregated evaluation of quality, which is a sum-mary judgment of the customer’s experience of the firm’soffering. This conversion is influenced by the customer’semotion during the quality experience and evaluation pro-cesses. Evaluated aggregate quality is formed by the cus-tomer because summary judgments are easier to store,retrieve, use, and share than individual attribute judgments.It is also more comprehensive and thus more suitable as aninput to customer satisfaction.
Following the literature (Cronin and Taylor 1994; Para-suraman, Zeithaml, and Berry 1994), the quality evaluationprocess captures the formation of both transactional andglobal judgments. In the former case, perceived attributesfrom a transaction help determine evaluated aggregate qual-ity and satisfaction for that specific consumption experi-ence. These transaction-specific judgments are stored inmemory as part of a customer’s accumulated information.Over time, we expect customers to aggregate transaction-specific memories into global judgments of evaluatedaggregate quality and satisfaction. Both transactional andglobal judgments may persist long after consumption hasoccurred. For example, customers will continue to holdjudgments of evaluated aggregate quality and satisfactionfor a car for years after owning it.
This section presents details about the quality evalua-tion process and makes four advances. First, we introducethe concept of evaluated aggregate quality, which allows usto bridge the focus on individual attributes (e.g., Cronin andTaylor 1992; Parasuraman, Zeithaml, and Berry 1988) withglobal judgments of evaluated quality and satisfaction(Anderson, Fornell, and Lehmann 1994; Tellis and Johnson2007). Second, extending past research, we argue that emo-tion influences how perceived attributes form evaluatedaggregate quality (see Figure 2). Third, we show distinctroles for three types of expectations. Fourth, we add a set ofuncertainty filters that moderate the impact of each type ofexpectations on quality perceptions or judgments (see Rustet al. 1999). These filters are related to prior research on thezone of tolerance (e.g., Coyne 1989; Parasuraman, Berry,
9Measurement motivation can, over time, improve measure-ment knowledge. However, in our framework, we focus on theirindependent effects.10Our focus is on “integral” emotions, which are linked to the
offering. However, emotions may also be “incidental” when theyare not linked to the offering or when they are “anticipated” andstored as cognitions in accumulated information (Cohen, Pham,and Andrade 2008).

and Zeithaml 1991; Zeithaml, Berry, and Parasuraman1993, 1996) because higher uncertainty is associated withhigher tolerance of inferior attribute performance.Evaluated Aggregate QualityEvaluated aggregate quality is formed by aggregating com-parisons of a customer’s perceived attributes relative to thecorresponding ‘ideal’ expectations for those attributes. Theaggregation level is determined by two factors—customerexpertise and attribute characteristics. First, experts’ knowl-edge allows them to hold multiple judgments of evaluatedaggregate quality, whereas novices may form one summaryjudgment. For example, experts may judge a wine’s“appearance” on the basis of color and clarity attributes andits “balance” on the basis of attributes of sweetness, acidity,alcohol level, and tannin content. In contrast, novices mightdescribe the same wine as being only sweet or dry. Second,two attribute characteristics influence the level of attributeaggregation. To begin, judgments of idiosyncratic attributesare more likely to be aggregated because these attributescannot be measured precisely with instruments; universaland preference attributes can be measured precisely, and sothey are more likely to remain disaggregated. For example,with airlines, a judgment of overall cabin comfort is easierto keep disaggregated into cabin noise and cabin tempera-ture than a judgment of the flight attendants’ overall socialinteraction, which includes difficult-to-measure attributessuch as empathy and courtesy. In addition, some attributesmay be aggregated because they group together naturally inthe customer’s mind. For example, customers may judge anairline’s timeliness on the basis of departure time, arrivaltime, and baggage handling time.
Figure 2 offers two reasons why ‘ideal’ expectationsprovide the reference level for forming evaluated aggregatequality. First, ‘ideal’ expectations are customer-specific ref-erence levels, which means that customers with differentideal points form different judgments of evaluated aggre-gate quality. Second, ‘ideal’ expectations enable evaluatedaggregate quality to have ecological validity, meaning thatit reflects the natural quality tiers customers hold for offer-ings. For example, while Motel 6 and Four Seasons bothmeet customers ‘will’ and ‘should’ expectations, customersdo not judge these hotels as having the same evaluatedaggregate quality. Instead, attributes are judged relative toeach customer’s ‘ideal’ expectations. Four Seasons’ perfor-mance on multiple attributes leads to smaller gaps with‘ideal’ expectations, resulting in a higher judgment of evalu -ated aggregate quality compared with Motel 6.
When combining perceptions of individual attributesinto an aggregated judgment, customers are heterogeneousin the importance attached to each attribute. Importanceweights are influenced by other factors in our framework(e.g., attribute type, ‘ideal’ uncertainty). Furthermore, ourframework also allows customer emotion to influence eval-uated aggregate quality. This effect may occur when thecustomer’s processing resources are constrained (e.g., timepressure, cognitive load), the customer’s motivation toprocess is low, or the customer lacks expertise in the targetdomain (Cohen, Pham, and Andrade 2008).
10 / Journal of Marketing, July 2012
In addition to being a state of quality, evaluated aggre-gate quality is also an input to customer satisfaction. Thisdual role is different from the other two quality states. Pro-duced attribute quality and experienced attribute quality arestates, which can be measured by the firm and used toimprove attribute design through feedback (see Figure 2).In contrast, evaluated aggregate quality is not only a statebut also a key determinant of customer satisfaction. Wenow discuss customer expectations, which are also animportant precursor of customer satisfaction.Customer ExpectationsExpectations are attribute performance reference levels acustomer uses when perceiving and evaluating individualattributes. Individual attribute evaluations are aggregated toform evaluated aggregate quality and quality disconfirma-tion, which determine customer satisfaction (Churchill andSuprenant 1982; Kopalle and Lehmann 2001). Attributeexpectations are adaptive to customer learning and changeover time (Erdem and Keane 1996). This learning may besuperficial or deep. Information can emanate from the cus-tomer’s experiences or external sources such as third parties,competitors’ offerings, and the firm itself. Firm informationincludes signals or cues correlated with an attribute’s per-formance or reliability, such as price, advertising, marketshare, and reputation (Helloffs and Jacobson 1999; Kirmaniand Rao 2000; Tellis and Wernerfelt 1987).
Customers use accumulated information to form threedistinct but interrelated types of expectations about attributeperformance—‘will,’ ‘ideal,’ and ‘should’ expectations.Previous researchers have described these customer expec-tations but have not included all three in a single frame-work. Some research focuses on one expectation (e.g.,‘will’ in Oliver 1980; ‘ideal’ in Tse and Wilton 1988;‘should’ in Cadotte, Woodruff, and Jenkins 1987) and oth-ers focus on two expectations (e.g., ‘will’ and ‘should’ inBoulding et al. 1993; ‘will’ and ‘ideal’ in Fornell et al.1996). In addition, customers have confidence ranges foreach expectation; therefore, our framework includes ‘will’uncertainty, ‘ideal’ uncertainty, and ‘should’ uncertainty.Following Rust et al. (1999), we view expectation uncer-tainty as the variance in a customer’s expectation of anattribute’s performance.
‘Will’ expectations. A customer’s ‘will’ expectations arethe attribute performance levels a customer predicts orbelieves an offering is going to deliver (Boulding et al.1993; Zeithaml, Berry, and Parasuraman 1993). ‘Will’expectations are the result of a customer’s prior experiencewith the offering and/or prior beliefs based on any of theinformation sources noted above. These expectations havebeen shown to “influence [customers’] perceptions of thedata” (Boulding, Kalra, and Staelin 1999, p. 463; Hoch andDeighton 1989). We refer to these perceptions as “perceivedattributes” in Figure 2. ‘Will’ expectations shape perceivedattributes in three key ways. First, ‘will’ expectations shiftcustomers’ observations toward their expectations as part ofa confirmatory bias (Boulding, Kalra, and Staelin 1999).Second, when measurement knowledge or motivation islow, customers retrieve ‘will’ expectations instead of
directly observing delivered attributes. Third, when ‘will’uncertainty is high because of exposure to divergentattribute performance levels, customers emphasize per-ceived attributes instead of their stored expectations toresolve their uncertainty (Rust et al. 1999).
‘Ideal’ expectations. ‘Ideal’ expectations are the attributeperformance levels that reflect a customer’s ideal prefer-ences across all offerings in a category. Perceived attributesare assessed relative to a customer’s ‘ideal’ expectations informing a judgment of evaluated aggregate quality (see Fig-ure 2; Tse and Wilton 1988; Zeithaml, Berry, and Parasura-man 1993). For universal attributes, customers’ ‘ideal’expectations are identical because customer preferences arehomogeneous. However, for preference and idiosyncraticattributes, customers have different ‘ideal’ expectations.‘Ideal’ uncertainty will be zero (or close to zero) for univer-sal attributes because all customers share a common prefer-ence and higher for preference and idiosyncratic attributesbecause preferences are heterogeneous. When customershave high ‘ideal’ uncertainty for an attribute, the influenceof ‘ideal’ expectations for that particular attribute on evalu-ated aggregate quality is lower than when customers havemore certain preferences.
‘Should’ expectations. ‘Should’ expectations are theattribute performance levels a customer believes competingofferings in a category ought to deliver (Boulding, Kalra,and Staelin 1999; Boulding et al. 1993; Cadotte, Woodruff,and Jenkins 1987; Tse and Wilton 1988). ‘Should’ expecta-tions are based on a normative expectation related to theconcepts of perceived equity and fairness, in which anoffering is assessed relative to the price paid, the offeringpurchased by other customers, or competitive offeringsavailable in the market (Bolton and Lemon 1999; Bouldinget al. 1993; Oliver and Swan 1989).11 As a result, while‘ideal’ expectations are the same for all offerings in a cate-gory (e.g., hotels), ‘should’ expectations are the same for anarrower set of competing offerings within the category(e.g., 5-star hotels). ‘Should’ expectations are the referencelevels against which perceived attributes are compared indetermining quality disconfirmation (Figure 2; Kumar,Kalwani, and Dada 1997; Oliver 2009).
For universal attributes, we view a ‘should’ expectationas the lower bound establishing the performance level thatought to be provided by competing offerings in the cate-gory. For example, customers believe an airline ‘should’provide legroom of 15 inches, while their ‘ideal’ expecta-tion for legroom is typically greater than that level. Forpreference and idiosyncratic attributes, customer preferencediminishes as performance deviates from the ideal point(e.g., cabin temperature). Therefore, a ‘should’ expectationcontains both a lower bound and an upper bound, with theattribute’s ‘ideal’ expectation falling in between. For exam-ple, a customer with an ‘ideal’ cabin temperature expecta-tion of 72°F may believe an airline ‘should’ provide a cabintemperature of at least 70°F and at most 75°F. Finally,
What Is Quality? / 11
‘should’ uncertainty is a filter for ‘should’ expectations.When ‘should’ uncertainty is high, as with novices or whenservice quality is highly variable, customers will weightthose attributes less in their aggregation of quality discon-firmation (see Figure 2).
Relationships among three types of expectations. Fol-lowing Oliver (2009), we view the three types of expecta-tions as distinct but related to one another (see Figure 2).We conceptualize ‘will’ expectations as the most elementalexpectation because ‘will’ expectations are formed at theattribute level and are distinct for each offering. ‘Ideal’expectations are also formed at the attribute level but arethe same for all offerings in a category. This is logical toensure that customers’ judgments of evaluated aggregatequality are in sync with their perceived attribute perfor-mance. ‘Ideal’ expectations may change when customerslearn about new products and update their ‘will’ expecta-tions. Moreover, ‘should’ expectations are distinct from‘ideal’ expectations because ‘should’ expectations are influ-enced, in part, by a customer’s ‘will’ expectations for offer-ings in the competitive set, whereas ‘ideal’ expectations arebased on a customer’s most preferred attribute performancelevels in the broader category. Furthermore, ‘should’ expec-tations are distinct from a specific offering’s ‘will’ expecta-tions because ‘should’ expectations cut across the competi-tive set of offerings within a category, whereas ‘will’expectations are specific to a particular offering.Quality DisconfirmationQuality disconfirmation is the aggregation across attributesof an offering’s perceived attribute performance relative toa customer’s ‘should’ expectation. For universal attri butes,quality disconfirmation is positive when perceived attributeperformance exceeds a ‘should’ expectation and negativewhen perceived attribute performance falls below a ‘should’expectation. For example, if the ‘should’ expectation forlegroom is 15 inches, legroom above (below) 15 inches willresult in positive (negative) quality disconfirmation, while15 inches will have no quality disconfirmation. For prefer-ence and idiosyncratic attributes, quality disconfirmation ispositive when perceived attribute performance is within thelower and upper bounds of a ‘should’ expectation. Return-ing to our cabin temperature example, positive (negative)quality disconfirmation occurs for temperatures above(below) 70°F and below (above) 75°F and no quality dis-confirmation occurs for temperatures of 70°F or 75°F.
We use ‘should’ expectations as the reference level fordetermining quality disconfirmation because ‘should’expectations capture additional norms such as perceivedequity and fairness. These norms are important to customersatisfaction and extend beyond the product-based norms in‘will’ and ‘ideal’ expectations. Moreover, ‘should’ expecta-tions enhance the impact of quality disconfirmation on cus-tomer satisfaction because an offering’s attribute’s perfor-mance is more likely to deviate from ‘should’ expectationsof competing offerings in a category than from an offering-specific ‘will’ expectation.
11These concepts are similar to the concept of value in theAmerican Customer Satisfaction Index (i.e., quality given priceand price given quality) (Fornell et al. 1996).

Customer SatisfactionCustomer satisfaction is a postconsumption judgment thatcompares an offering’s evaluated aggregate quality with itsquality disconfirmation.12 Thus, customer satisfaction is acomparison between quality (i.e., evaluated aggregate qual-ity) and a quality standard (i.e., quality disconfirmation),whereas each quality state is a comparison of attribute per-formance with a performance standard (i.e., attribute designor ‘ideal’ expectations). A customer’s aggregation level forquality disconfirmation will match the aggregation level forevaluated aggregate quality, so these two concepts can becompared easily in forming customer satisfaction. How-ever, attribute importance weights used in these aggrega-tions do not need to be the same (Oliver 2009).
Positive quality disconfirmation increases satisfaction;negative quality disconfirmation decreases satisfaction. Whenperceived attributes equal ‘should’ expectations, there is“no change in customer satisfaction beyond the effect of the[evaluated aggregate] quality level that already exists”(Oliver 1996, p. 112).
Across offerings, different judgments of evaluatedaggregate quality can lead to the same level of satisfactionwhen ‘should’ expectations are different. Returning to theexample of Motel 6 and Four Seasons, ‘should’ expecta-tions are more stringent for Four Seasons because it is in thecompetitive set of 5-star hotels (Woodruff, Cadotte, andJenkins 1983). As a result, a customer’s judgment of evalu-ated aggregate quality must be higher for Four Seasons toresult in the same satisfaction level as Motel 6. A similarpoint is made by previous researchers who suggest “thatcustomer satisfaction is dependent on … the ratio of bene-fits received relative to costs incurred” (Anderson, Fornell,and Lehmann 1994, p. 55; see also Zeithaml 1988).
We now move to the quality production process inwhich firms strive to produce attributes, sometimes withcustomer co-production, that conform to the attributedesign specifications set by the firm based on input fromcustomers.
The Quality Production ProcessThe quality production process is primarily the domain ofresearchers and managers in operations and engineering whoestablish standards for and then generate goods and services(e.g., Feigenbaum 1991; Montgomery 2008). This literaturetends to focus on specifications for attributes that can bemeasured easily and for which customers have homogeneouspreferences (i.e., universal attributes). For example, Shewhart(1986, p. 1, italics added) defines specifications as a “statis-tical state constituting a limit … in improving the unifor-mity of quality.” Thus, giving more attention to preferenceand idiosyncratic attributes as well as production processes
12 / Journal of Marketing, July 2012
for services will offer deeper insights. In this section, webegin by conceptualizing the subprocesses within qualityproduction. We then focus on how these subprocesses linkto our broader conceptualization of quality, including therole of co-production.Key Subprocesses in Quality ProductionFigure 2 indicates that producing an offering is a functionof attribute design, process design, resource inputs, andvarious methods of controlling the production process.Attribute design levels are established by the firm, ideallybased on input from customers (Green and Srinivasan 1990;Griffin and Hauser 1993; Hauser and Clausing 1988). In ourframework, customer input to attribute design comes fromcustomers’ prior perceptions of attributes, their resultingemotion, the three quality states, and customer satisfaction.
Once attribute design (i.e., resource inputs and attributeperformance) has been specified, process design and qualitycontrol are the remaining inputs to the attribute productionprocess (Hamada, Mackay, and Whitney 1993; Woodall andMontgomery 1999). Process design specifies the productionprocess that will produce the attribute design specifications.Firms rely on a set of quality control methods—offline,online, and inspection—for monitoring produced attributequality and maintaining or improving the process designspecifications.13
The success of the attribute production process can beassessed by the resulting state of produced attribute quality.Produced attributes will be the same as delivered attributeswhen offerings are produced and consumed simultaneously(e.g., many services) or when offerings do not change overtime and distance (e.g., many durable goods). In other cases,produced attributes may change between production andconsumption (e.g., food loses freshness or metal rusts). There-fore, we use delivered attributes to distinguish attributes thecustomer experiences from attributes the firm produces.
Three quality control methods can be used to improveproduced attribute quality. Offline methods use experimentsand simulations to improve produced attribute qualitythrough changes in process design (e.g., Kackar 1985).Offline methods can be used in services by training employ-ees, installing superior equipment, and increasing processefficiency. Online methods monitor produced attribute qual-ity and make necessary adjustments to the productionprocess while it is in progress (e.g., Gong, Jwo, and Tang1997). For customized services, like medical services, onlineprocess controls can be implemented by training providersto monitor and modify service delivery as it occurs. Inspec-tion methods measure resource inputs (e.g., Ding, Green-berg, and Matsuo 1998) or produced attributes (e.g., Mayer,Nickerson, and Owan 2004) and reject those that do notmeet specifications. These methods do not apply to servicesthat are produced and consumed simultaneously. However,they could apply when there is a delay between productionand consumption (e.g., auto repairs, tax preparation).12Oliver (2009, p. 8) offers a more conceptual definition of sat-
isfaction as “the consumer’s fulfillment response. It is a judgmentthat a product/service feature, or the product or service itself, pro-vided (or is providing) a pleasurable level of consumption-relatedfulfillment, including levels of under- or overfulfillment.” Consis-tent with our approach in this article, our definition of satisfactionis more operational in nature.
13The terms “offline” and “online” are used in the operations lit-erature in the production line context and do not refer to the Inter-net. Although these methods were developed primarily for goods,they can also be applied to services.
Each quality control method may be more or less usefulfor producing certain types of attributes. For example,offline methods are especially relevant for universal attri -butes because attribute performance does not need to becustomized to individual preferences. In contrast, onlinemethods take on greater prominence with preference andidiosyncratic attributes because firms need to matchattribute performance with heterogeneous customer prefer-ences. Inspection methods could be employed with all typesof attributes.Co-Production of an Offering’s AttributesStandard notions of the quality production process tend toseparate it from the quality experience and quality evalua-tion processes. In this view, an offering’s attributes are pro-duced by firms and then delivered to customers whose post-consumption feedback is used to update attribute design.However, customers sometimes observe production pro-cesses (e.g., many services are produced and consumedsimultaneously) and store these observations (see the“Accumulated Information” box in Figure 2). More impor-tant, customers can play a role with firms in the productionof many goods and services (Bitner et al. 1997; Kelley,Donnelly, and Skinner 1990). Our framework examines co-production in six ways.
First, when customers contribute to produced attributes(e.g., bagging groceries or providing goals to a financialplanner), delivered attributes are more likely to approximatewhat customers want. Second, involvement in co-productionshould increase customer measurement knowledge andmotivation. When this happens, customers will place moreemphasis on perceived attributes and less emphasis on‘will’ expectations because they are more likely to perceiveaccurately the attributes firms deliver. Third, co-productionenables firms to monitor customers’ emotions, which allowsmanagers to adjust produced attributes in real time (Menonand Dubé 2007).14 This may involve changing the level ofan existing attribute (e.g., faster service) or adding newattributes (e.g., free wine with dinner) to accommodate acustomer.
Fourth, when customers provide resource inputs or par-ticipate in the production process, the resulting accumulatedinformation has a positive impact on ‘will’ expectations(Bettencourt 1997; Kelley, Donnelly, and Skinner 1990),which improves attribute perceptions. Fifth, co-productionmay shift ‘ideal’ expectations toward what customers per-ceive. Finally, co-production reduces ‘will’ uncertaintybecause customers have more knowledge of a co-producedattribute’s performance. This increases the influence of‘will’ expectations.
These positive impacts of co-production provideinsights into why evaluated aggregate quality oftenincreases through co-production (Bettencourt 1997; Kelley,Donnelly, and Skinner 1990; Lengnick-Hall 1996). Unfor-
What Is Quality? / 13
tunately, firms may not benefit when customers believe thisincrease is due to their own efforts (Bendapudi and Leone2003). However, when service quality is poor, customersmay also accept some of the blame (Bitner et al. 1997).
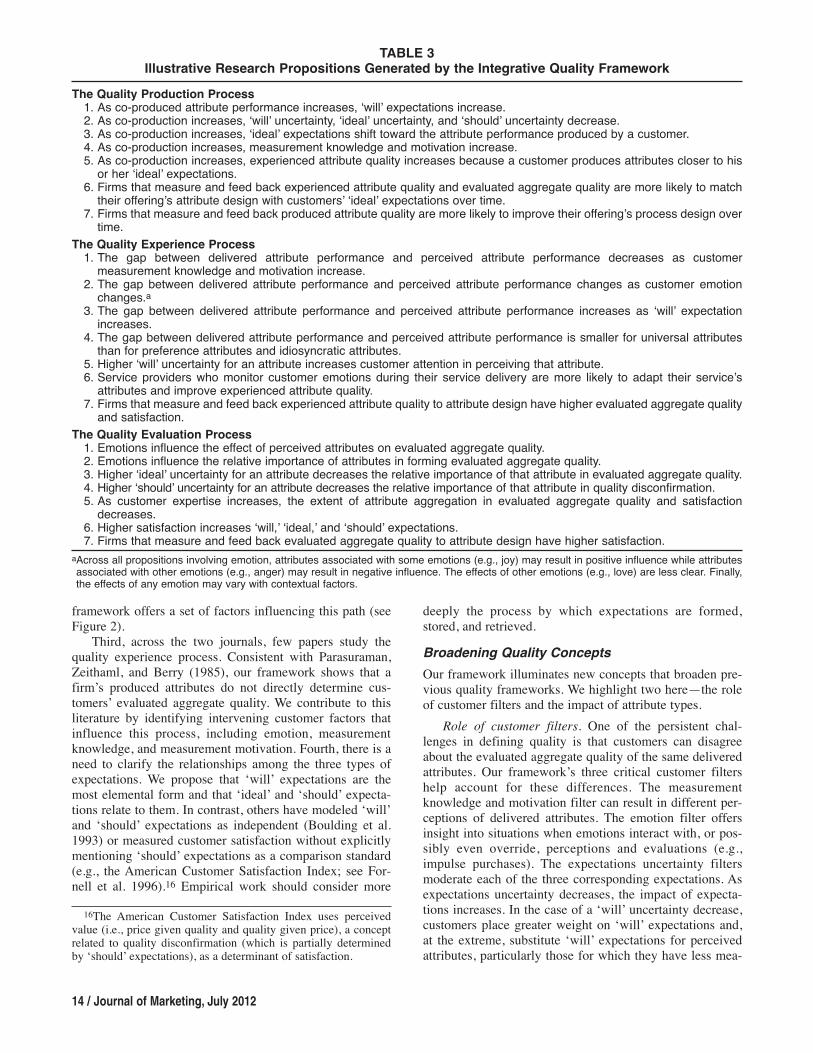
Implications for TheoryOur framework offers two sets of theoretical implications: (1)integrating three quality processes into a single frameworkand (2) broadening the range of concepts included in thatframework. Empirical research is necessary to establish thevalidity of these ideas. To facilitate, Table 3 offers 21 testablepropositions derived from our integrative framework.Integrating the Quality Processes
Opportunities for knowledge transfer across disciplines.By identifying and defining the three quality processes, thethree quality states, and their points of interconnection,researchers should see more opportunities for cross-fertilization. To facilitate this, Web Appendix B (see http://www. marketingpower.com/jm_webappendix) organizes the252 quality articles published in Journal of Marketing andManagement Science from 1988 to 2010 according to Fig-ure 1.15 This Appendix reveals that Journal of Marketinghas many articles on the quality evaluation process and onlytwo on the quality production process. Conversely, Man-agement Science has many articles on the quality produc-tion process and only one on the quality evaluation process.
Our framework also enhances knowledge transfer byproviding definitions that apply to both goods and services(see Table 1) and recommendations for measure develop-ment in future research. The Appendix provides operationaldefinitions of our key concepts, illustrative measures, andadvice for researchers tackling this challenge. Finally, ourintegrative quality framework may be useful outside ofproduct consumption experiences. Like Oliver (2009), whoidentifies opportunities to study satisfaction across domainsas diverse as job satisfaction, family satisfaction, and lifesatisfaction, we believe that our quality framework is usefulin other areas as well. While some terms may need to beoperationalized for different contexts, the generic qualityprocesses and states are likely to transfer to other fields.Future empirical research should determine the boundariesof this applicability.
Identification of underexplored research areas. Ourframework highlights four areas not addressed sufficientlyin the literature. First, as we noted above, the quality pro-duction process has not received much attention in Journalof Marketing because this process traditionally has beenviewed as not involving customers. Our framework expandson recent research to describe six ways co-production playsa role in all three quality processes. Second, the qualityevaluation process has not received much attention amongoperations or engineering scholars in Management Sciencebecause the path from produced attributes to evaluatedaggregate quality has not been elucidated previously. Our14Arnould and Price (1993) describe how companies such as
Disney and McDonald’s train employees to display enthusiasm orhumor to improve the customer experience. Other research showshow employees’ emotions have a positive effect on customers’emotions (Hennig-Thurau et al. 2006).
15Articles on quality topics outside the bounds of Figure 1 (e.g.,the impact of quality on firm financial performance) are groupedinto several additional links in Web Appendix B.
framework offers a set of factors influencing this path (seeFigure 2).
Third, across the two journals, few papers study thequality experience process. Consistent with Parasuraman,Zeithaml, and Berry (1985), our framework shows that afirm’s produced attributes do not directly determine cus-tomers’ evaluated aggregate quality. We contribute to thisliterature by identifying intervening customer factors thatinfluence this process, including emotion, measurementknowledge, and measurement motivation. Fourth, there is aneed to clarify the relationships among the three types ofexpectations. We propose that ‘will’ expectations are themost elemental form and that ‘ideal’ and ‘should’ expecta-tions relate to them. In contrast, others have modeled ‘will’and ‘should’ expectations as independent (Boulding et al.1993) or measured customer satisfaction without explicitlymentioning ‘should’ expectations as a comparison standard(e.g., the American Customer Satisfaction Index; see For-nell et al. 1996).16 Empirical work should consider more
14 / Journal of Marketing, July 2012
deeply the process by which expectations are formed,stored, and retrieved.Broadening Quality ConceptsOur framework illuminates new concepts that broaden pre-vious quality frameworks. We highlight two here—the roleof customer filters and the impact of attribute types.
Role of customer filters. One of the persistent chal-lenges in defining quality is that customers can disagreeabout the evaluated aggregate quality of the same deliveredattributes. Our framework’s three critical customer filtershelp account for these differences. The measurementknowledge and motivation filter can result in different per-ceptions of delivered attributes. The emotion filter offersinsight into situations when emotions interact with, or pos-sibly even override, perceptions and evaluations (e.g.,impulse purchases). The expectations uncertainty filtersmoderate each of the three corresponding expectations. Asexpectations uncertainty decreases, the impact of expecta-tions increases. In the case of a ‘will’ uncertainty decrease,customers place greater weight on ‘will’ expectations and,at the extreme, substitute ‘will’ expectations for perceivedattributes, particularly those for which they have less mea-
TABLE 3Illustrative Research Propositions Generated by the Integrative Quality Framework
The Quality Production Process1. As co-produced attribute performance increases, ‘will’ expectations increase.2. As co-production increases, ‘will’ uncertainty, ‘ideal’ uncertainty, and ‘should’ uncertainty decrease.3. As co-production increases, ‘ideal’ expectations shift toward the attribute performance produced by a customer.4. As co-production increases, measurement knowledge and motivation increase.5. As co-production increases, experienced attribute quality increases because a customer produces attributes closer to hisor her ‘ideal’ expectations.
6. Firms that measure and feed back experienced attribute quality and evaluated aggregate quality are more likely to matchtheir offering’s attribute design with customers’ ‘ideal’ expectations over time.
7. Firms that measure and feed back produced attribute quality are more likely to improve their offering’s process design overtime.
The Quality Experience Process1. The gap between delivered attribute performance and perceived attribute performance decreases as customermeasurement knowledge and motivation increase.
2. The gap between delivered attribute performance and perceived attribute performance changes as customer emotionchanges.a
3. The gap between delivered attribute performance and perceived attribute performance increases as ‘will’ expectationincreases.
4. The gap between delivered attribute performance and perceived attribute performance is smaller for universal attributesthan for preference attributes and idiosyncratic attributes.
5. Higher ‘will’ uncertainty for an attribute increases customer attention in perceiving that attribute.6. Service providers who monitor customer emotions during their service delivery are more likely to adapt their service’sattributes and improve experienced attribute quality.
7. Firms that measure and feed back experienced attribute quality to attribute design have higher evaluated aggregate qualityand satisfaction.
The Quality Evaluation Process1. Emotions influence the effect of perceived attributes on evaluated aggregate quality.2. Emotions influence the relative importance of attributes in forming evaluated aggregate quality.3. Higher ‘ideal’ uncertainty for an attribute decreases the relative importance of that attribute in evaluated aggregate quality.4. Higher ‘should’ uncertainty for an attribute decreases the relative importance of that attribute in quality disconfirmation.5. As customer expertise increases, the extent of attribute aggregation in evaluated aggregate quality and satisfactiondecreases.
6. Higher satisfaction increases ‘will,’ ‘ideal,’ and ‘should’ expectations.7. Firms that measure and feed back evaluated aggregate quality to attribute design have higher satisfaction.
aAcross all propositions involving emotion, attributes associated with some emotions (e.g., joy) may result in positive influence while attributesassociated with other emotions (e.g., anger) may result in negative influence. The effects of other emotions (e.g., love) are less clear. Finally,the effects of any emotion may vary with contextual factors.
16The American Customer Satisfaction Index uses perceivedvalue (i.e., price given quality and quality given price), a conceptrelated to quality disconfirmation (which is partially determinedby ‘should’ expectations), as a determinant of satisfaction.
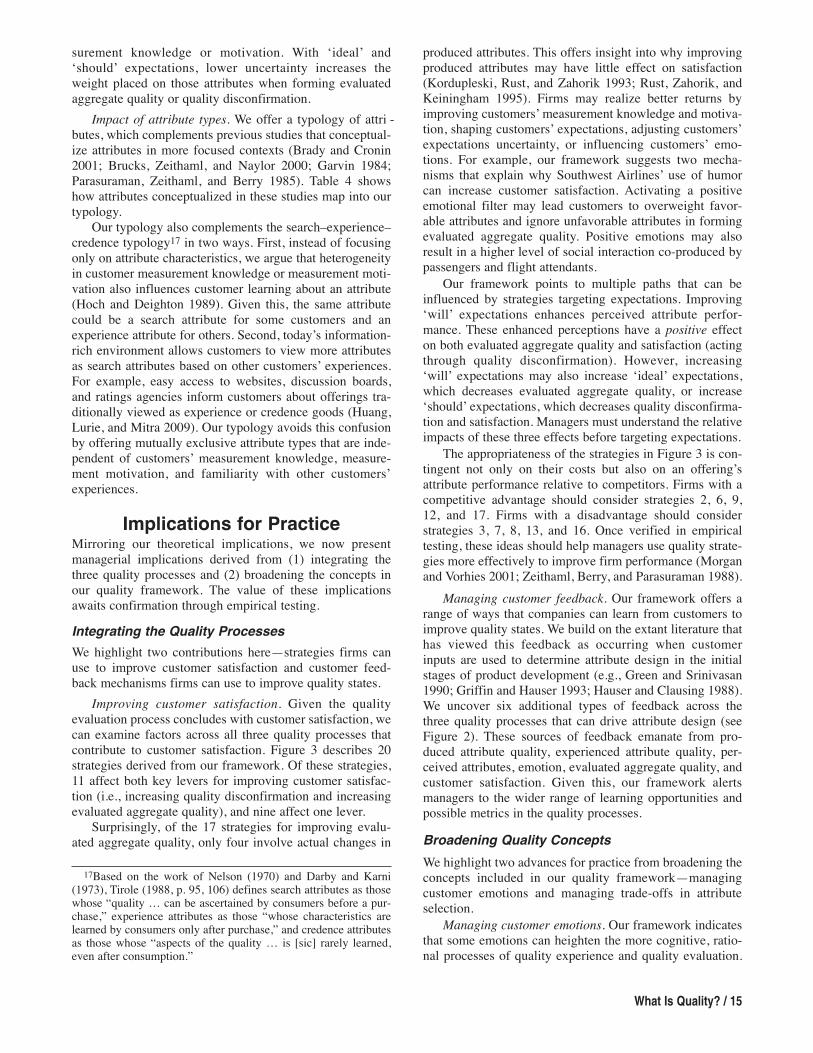
surement knowledge or motivation. With ‘ideal’ and‘should’ expectations, lower uncertainty increases theweight placed on those attributes when forming evaluatedaggregate quality or quality disconfirmation.
Impact of attribute types. We offer a typology of attri -butes, which complements previous studies that conceptual-ize attributes in more focused contexts (Brady and Cronin2001; Brucks, Zeithaml, and Naylor 2000; Garvin 1984;Parasuraman, Zeithaml, and Berry 1985). Table 4 showshow attributes conceptualized in these studies map into ourtypology.
Our typology also complements the search–experience–credence typology17 in two ways. First, instead of focusingonly on attribute characteristics, we argue that heterogeneityin customer measurement knowledge or measurement moti-vation also influences customer learning about an attribute(Hoch and Deighton 1989). Given this, the same attributecould be a search attribute for some customers and anexperience attribute for others. Second, today’s information-rich environment allows customers to view more attributesas search attributes based on other customers’ experiences.For example, easy access to websites, discussion boards,and ratings agencies inform customers about offerings tra-ditionally viewed as experience or credence goods (Huang,Lurie, and Mitra 2009). Our typology avoids this confusionby offering mutually exclusive attribute types that are inde-pendent of customers’ measurement knowledge, measure-ment motivation, and familiarity with other customers’experiences.
Implications for PracticeMirroring our theoretical implications, we now presentmanagerial implications derived from (1) integrating thethree quality processes and (2) broadening the concepts inour quality framework. The value of these implicationsawaits confirmation through empirical testing.Integrating the Quality ProcessesWe highlight two contributions here—strategies firms canuse to improve customer satisfaction and customer feed-back mechanisms firms can use to improve quality states.
Improving customer satisfaction. Given the qualityevaluation process concludes with customer satisfaction, wecan examine factors across all three quality processes thatcontribute to customer satisfaction. Figure 3 describes 20strategies derived from our framework. Of these strategies,11 affect both key levers for improving customer satisfac-tion (i.e., increasing quality disconfirmation and increasingevaluated aggregate quality), and nine affect one lever.
Surprisingly, of the 17 strategies for improving evalu-ated aggregate quality, only four involve actual changes in
What Is Quality? / 15
produced attributes. This offers insight into why improvingproduced attributes may have little effect on satisfaction(Kordupleski, Rust, and Zahorik 1993; Rust, Zahorik, andKeiningham 1995). Firms may realize better returns byimproving customers’ measurement knowledge and motiva-tion, shaping customers’ expectations, adjusting customers’expectations uncertainty, or influencing customers’ emo-tions. For example, our framework suggests two mecha-nisms that explain why Southwest Airlines’ use of humorcan increase customer satisfaction. Activating a positiveemotional filter may lead customers to overweight favor-able attributes and ignore unfavorable attributes in formingevaluated aggregate quality. Positive emotions may alsoresult in a higher level of social interaction co-produced bypassengers and flight attendants.
Our framework points to multiple paths that can beinfluenced by strategies targeting expectations. Improving‘will’ expectations enhances perceived attribute perfor-mance. These enhanced perceptions have a positive effecton both evaluated aggregate quality and satisfaction (actingthrough quality disconfirmation). However, increasing‘will’ expectations may also increase ‘ideal’ expectations,which decreases evaluated aggregate quality, or increase‘should’ expectations, which decreases quality disconfirma-tion and satisfaction. Managers must understand the relativeimpacts of these three effects before targeting expectations.
The appropriateness of the strategies in Figure 3 is con-tingent not only on their costs but also on an offering’sattribute performance relative to competitors. Firms with acompetitive advantage should consider strategies 2, 6, 9,12, and 17. Firms with a disadvantage should considerstrategies 3, 7, 8, 13, and 16. Once verified in empiricaltesting, these ideas should help managers use quality strate-gies more effectively to improve firm performance (Morganand Vorhies 2001; Zeithaml, Berry, and Parasuraman 1988).
Managing customer feedback. Our framework offers arange of ways that companies can learn from customers toimprove quality states. We build on the extant literature thathas viewed this feedback as occurring when customerinputs are used to determine attribute design in the initialstages of product development (e.g., Green and Srinivasan1990; Griffin and Hauser 1993; Hauser and Clausing 1988).We uncover six additional types of feedback across thethree quality processes that can drive attribute design (seeFigure 2). These sources of feedback emanate from pro-duced attribute quality, experienced attribute quality, per-ceived attributes, emotion, evaluated aggregate quality, andcustomer satisfaction. Given this, our framework alertsmanagers to the wider range of learning opportunities andpossible metrics in the quality processes.Broadening Quality ConceptsWe highlight two advances for practice from broadening theconcepts included in our quality framework—managingcustomer emotions and managing trade-offs in attributeselection.
Managing customer emotions. Our framework indicatesthat some emotions can heighten the more cognitive, ratio-nal processes of quality experience and quality evaluation.
17Based on the work of Nelson (1970) and Darby and Karni(1973), Tirole (1988, p. 95, 106) defines search attributes as thosewhose “quality … can be ascertained by consumers before a pur-chase,” experience attributes as those “whose characteristics arelearned by consumers only after purchase,” and credence attributesas those whose “aspects of the quality … is [sic] rarely learned,even after consumption.”
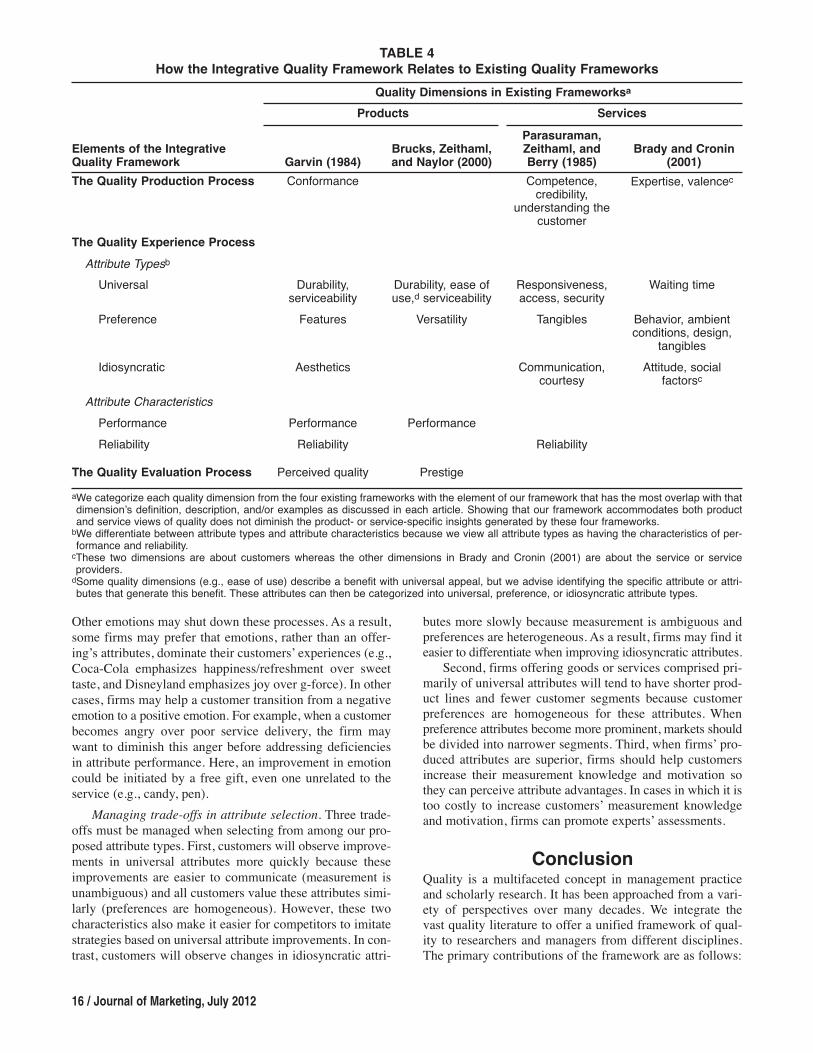
Other emotions may shut down these processes. As a result,some firms may prefer that emotions, rather than an offer-ing’s attributes, dominate their customers’ experiences (e.g.,Coca-Cola emphasizes happiness/refreshment over sweettaste, and Disneyland emphasizes joy over g-force). In othercases, firms may help a customer transition from a negativeemotion to a positive emotion. For example, when a customerbecomes angry over poor service delivery, the firm maywant to diminish this anger before addressing deficienciesin attribute performance. Here, an improvement in emotioncould be initiated by a free gift, even one unrelated to theservice (e.g., candy, pen).
Managing trade-offs in attribute selection. Three trade-offs must be managed when selecting from among our pro-posed attribute types. First, customers will observe improve-ments in universal attributes more quickly because theseimprovements are easier to communicate (measurement isunambiguous) and all customers value these attributes simi-larly (preferences are homogeneous). However, these twocharacteristics also make it easier for competitors to imitatestrategies based on universal attribute improvements. In con-trast, customers will observe changes in idiosyncratic attri -
16 / Journal of Marketing, July 2012
butes more slowly because measurement is ambiguous andpreferences are heterogeneous. As a result, firms may find iteasier to differentiate when improving idiosyncratic attributes.
Second, firms offering goods or services comprised pri-marily of universal attributes will tend to have shorter prod-uct lines and fewer customer segments because customerpreferences are homogeneous for these attributes. Whenpreference attributes become more prominent, markets shouldbe divided into narrower segments. Third, when firms’ pro-duced attributes are superior, firms should help customersincrease their measurement knowledge and motivation sothey can perceive attribute advantages. In cases in which it istoo costly to increase customers’ measurement knowledgeand motivation, firms can promote experts’ assessments.
ConclusionQuality is a multifaceted concept in management practiceand scholarly research. It has been approached from a vari-ety of perspectives over many decades. We integrate thevast quality literature to offer a unified framework of qual-ity to researchers and managers from different disciplines.The primary contributions of the framework are as follows:
Quality Dimensions in Existing FrameworksaProducts Services
Elements of the Integrative Quality Framework Garvin (1984)
Brucks, Zeithaml,and Naylor (2000)
Parasuraman, Zeithaml, andBerry (1985)
Brady and Cronin(2001)
The Quality Production Process Conformance Competence, credibility,
understanding thecustomer
Expertise, valencec
The Quality Experience ProcessAttribute TypesbUniversal Durability,
serviceabilityDurability, ease ofuse,d serviceability
Responsiveness,access, security
Waiting time
Preference Features Versatility Tangibles Behavior, ambientconditions, design,
tangiblesIdiosyncratic Aesthetics Communication,
courtesyAttitude, socialfactorsc
Attribute CharacteristicsPerformance Performance PerformanceReliability Reliability Reliability
The Quality Evaluation Process Perceived quality Prestige
TABLE 4How the Integrative Quality Framework Relates to Existing Quality Frameworks
aWe categorize each quality dimension from the four existing frameworks with the element of our framework that has the most overlap with thatdimension’s definition, description, and/or examples as discussed in each article. Showing that our framework accommodates both productand service views of quality does not diminish the product- or service-specific insights generated by these four frameworks.bWe differentiate between attribute types and attribute characteristics because we view all attribute types as having the characteristics of per-formance and reliability.cThese two dimensions are about customers whereas the other dimensions in Brady and Cronin (2001) are about the service or serviceproviders.dSome quality dimensions (e.g., ease of use) describe a benefit with universal appeal, but we advise identifying the specific attribute or attri -butes that generate this benefit. These attributes can then be categorized into universal, preference, or idiosyncratic attribute types.

What Is Q
uality?/ 17
aThe appropriateness of some of these alternative strategies is contingent on a firm’s delivered attribute’s performance relative to competitors. For example, firms with a competitive advantage onan attribute’s performance may consider the strategies numbered 2, 6, 9, 12, and 17. In contrast, firms with a competitive disadvantage on an attribute’s performance may consider strategies num-bered 3, 7, 8, 13, and 16.
FIGURE 3Strategies to Improve Customer Satisfactiona
Strategies in the quality experience process Strategies in the quality evaluation process Strategies in the quality production process
Improve Customer Satisfaction
Increase Evaluated Aggregate Quality
Decrease ‘should’
expectation (1)
Change ‘ideal’ expectation
Evoke positive emotion
(4)
Decrease ‘should’
uncertainty (2)
Increase ‘should’
uncertainty (3)
Change attribute importance
Change ‘will’
expectation
Decrease attribute
importance (7)
Increase attribute
importance (6)
Move ‘ideal’ expectation
closer to perceived attribute
(10)
Decrease ‘ideal’
uncertainty (9)
Increase ‘will’
expectation (14)
Increase ‘will’
uncertainty (16)
Increase measurement
knowledge and/or motivation
(12)
Decrease measurement knowledge
and/or motivation (13)
Decrease competitor
‘will’ expectation
(15)
Decrease ‘will’
uncertainty (17)
Change process design
Change attribute design (11)
Increase Quality Disconfirmation
Increase ‘ideal’
uncertainty (8)
Change measurement knowledge
Evoke relevant
emotion (5)
Improve delivered attribute
Improve perceived attribute
Improve produced
attribute through inspection control
(20)
Improve production process
through online control
(19)
Improve process design specification
through offline control
(18)

1. Developing a comprehensive conceptual framework ofquality that integrates the vast, multidisciplinary literature(see Figures 1 and 2 and Tables 1 and 2);
2. Illustrating the usefulness of our framework by offeringnew directions for theoretical and empirical research (seethe “Implications for Theory” section, as well as Table 3and the Appendix), proposing 20 strategies to improve cus-tomer satisfaction (Figure 3), and classifying Journal ofMarketing and Management Science articles on qualitypublished between 1988 and 2010 (Web Appendices B andC; http://www.marketingpower.com/jm_webappendix);
3. Postulating a quality experience process that occurs whenfirms deliver and customers perceive attributes as well as aset of customer-based factors that influence this process;
4. Offering a more complete view of the relationships betweenthe three quality processes;
5. Describing three associated quality states that can be mea-sured and managed by the firm;
6. Classifying an offering’s attributes into three general types(universal, preference, idiosyncratic) based on measure-ment ambiguity and customer preference (Web AppendixA; http://www.marketingpower.com/jm_webappendix);
7. Linking‘will,’‘ideal,’ and‘should’expectations within our pro-posed framework; and
8. Bringing customer emotion and co-production into a gen-eral framework of quality.
Although researchers and managers may disagree withsome elements of our framework, we hope that any dis-agreements will lead to revising and building on our con-ceptualization. Quality is too important, and perhaps thetopic most in need of a broad, integrative framework.
AppendixMeasuring Key Constructs in theIntegrative Quality Framework
Our framework integrates several quality concepts devel-oped in different research streams. Researchers havealready developed valid and robust measures for some con-cepts: service quality (SERVQUAL; Parasuraman, Zeit-haml, and Berry 1988), emotion (PANAS; Watson, Clark,and Tellegen 1988), and the production quality of engineer-ing processes (Signal to Noise Ratio; Taguchi and Konishi1993). In other cases, new scales should be developed. Tothat end, we offer both general and specific measurementadvice.
In terms of general advice, researchers should typicallyprovide information to the customer about the question’sreference to attribute x of offering y in category z. Exactlywhich of these elements will be relevant to any one ques-tion will vary. All measures examine “attribute x.” If themeasure varies across offerings within a category, we rec-ommend examining “attribute x for offering y.” However, ifthe measure varies across categories but not across offer-ings within a category, we recommend examining “attributex in category z.”18 Table A1 offers illustrative measures of
18 / Journal of Marketing, July 2012
each concept. Next, while we use seven-point scales, thelevels of these scales can be presented with descriptiveanchors (e.g., 1 = 12-inch seat vs. 7 = 24-inch seat) orexemplars (e.g., relative to a card-table chair) to help cus-tomers calibrate their responses. Finally, there are someconcepts that can be directly measured (e.g., attributeexpectation), while others need to be computed or con-structed based on two measures (e.g., experienced attributequality = the difference between ‘ideal’ expectation anddelivered attribute performance).
In terms of specific advice, we suspect that researcherswill have the greatest challenge developing measures forexperienced attribute quality. One challenge with experi-enced attribute quality is that experts’ assessments of deliv-ered attribute performance may use one scale while cus-tomers’ assessments of their ideal performance may use adifferent scale. For universal and preference attributes,experts may use a quantitative scale based on instrumentmeasures. In contrast, customers may assess performanceon a subjective scale (e.g., 1–7 scale). One approach to thischallenge is to use measurement scales anchored by thelowest, middle, and highest instrument readings across therange of an attribute’s performance. This approach wouldclarify the computation of the gap between deliveredattribute performance and ‘ideal’ expectation. A secondapproach is for experts to convert their instrument measuresto a 1–7 scale and then compute the gap with each cus-tomer’s 1–7 ‘ideal’ expectation rating. A third approach isto ask experts to evaluate the gap directly. This wouldrequire that experts are informed about each segment’s‘ideal’ expectation. Experts could then answer a questionabout how large the gap is between their assessment ofdelivered attribute performance and each segment’s (orindividual customer’s) ‘ideal’ expectation. This approach issimilar to Consumer Reports describing which offerings arebest for certain types of customers or usage occasions. Weadvocate the first approach as best for understanding theinputs used to determine experienced attribute quality.However, we caution that this approach will face additionalchallenges when measuring idiosyncratic attributes.
The challenges of measuring idiosyncratic attributes arethat (1) performance can be assessed only through humanperceptions, thus using the anchored rating scales with per-formance levels based on instrument readings advocatedabove is not possible and (2) ideal performance levels varyacross customers and experts. However, these challengesare not unique, and researchers may find inspiration in thelarge number of scales measuring constructs with thesesame characteristics. For example, researchers have mea-sured personality (Kassarjian 1971), some dimensions ofwhich could be viewed as idiosyncratic attributes of serviceproviders (e.g., aggressiveness, sociability, emotional sta-bility, personal relations, gregariousness). More recently,Aaker (1997) developed a brand personality scale measur-ing brand characteristics that could also be viewed as idio-syncratic attributes (e.g., sincerity, sophistication).
More broadly, to measure experienced attribute quality,we recommend that researchers develop scale items that canbe used to assess both delivered attribute performance andcustomers’ ‘ideal’ expectations. For example, using our air-
18For some measures, such as ‘should’ expectations, relativeattribute importance, and importance of attribute information,category z refers to the set of competing offerings (e.g., 5-starhotels) rather than the overall category (e.g., hotels).
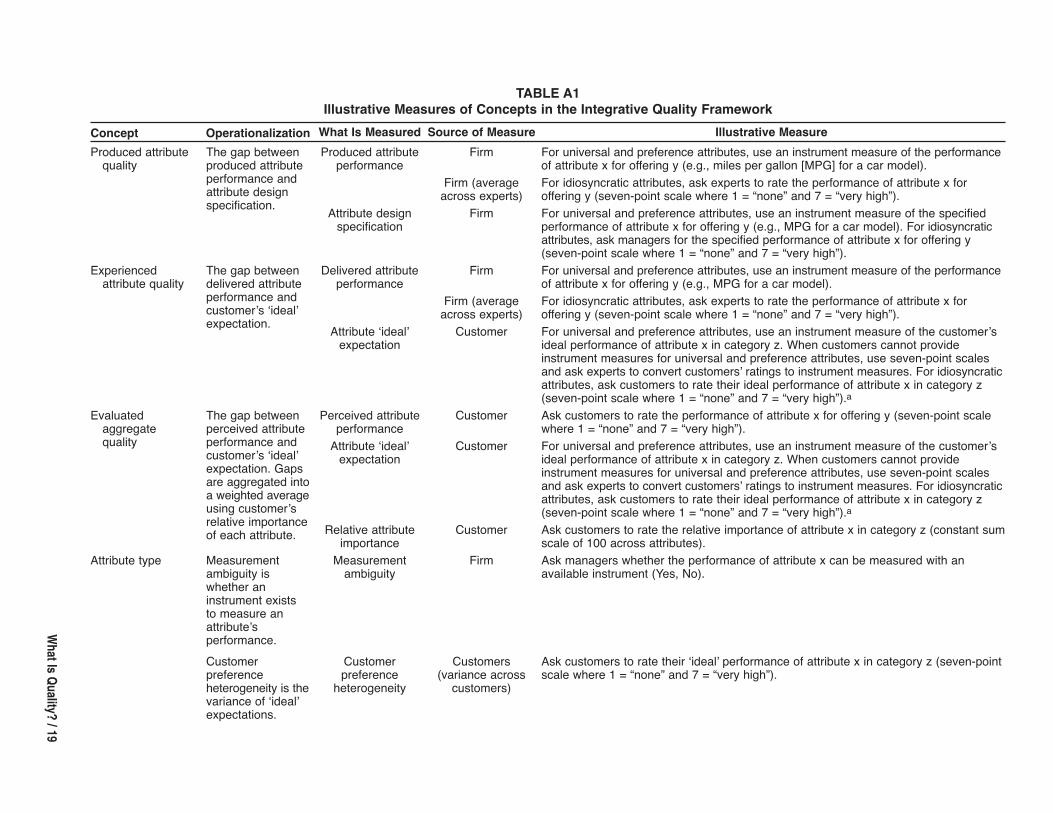
What Is Q
uality?/ 19
Concept Operationalization What Is Measured Source of Measure Illustrative MeasureProduced attributequality
The gap betweenproduced attributeperformance andattribute designspecification.
Produced attributeperformance
Firm For universal and preference attributes, use an instrument measure of the performanceof attribute x for offering y (e.g., miles per gallon [MPG] for a car model).
Firm (averageacross experts)
For idiosyncratic attributes, ask experts to rate the performance of attribute x for offering y (seven-point scale where 1 = “none” and 7 = “very high”).
Attribute designspecification
Firm For universal and preference attributes, use an instrument measure of the specifiedperformance of attribute x for offering y (e.g., MPG for a car model). For idiosyncraticattributes, ask managers for the specified performance of attribute x for offering y(seven-point scale where 1 = “none” and 7 = “very high”).
Experiencedattribute quality
The gap betweendelivered attributeperformance andcustomer’s ‘ideal’expectation.
Delivered attributeperformance
Firm For universal and preference attributes, use an instrument measure of the performanceof attribute x for offering y (e.g., MPG for a car model).
Firm (averageacross experts)
For idiosyncratic attributes, ask experts to rate the performance of attribute x for offering y (seven-point scale where 1 = “none” and 7 = “very high”).
Attribute ‘ideal’expectation
Customer For universal and preference attributes, use an instrument measure of the customer’sideal performance of attribute x in category z. When customers cannot provide instrument measures for universal and preference attributes, use seven-point scalesand ask experts to convert customers’ ratings to instrument measures. For idiosyncraticattributes, ask customers to rate their ideal performance of attribute x in category z(seven-point scale where 1 = “none” and 7 = “very high”).a
Evaluated aggregate quality
The gap betweenperceived attributeperformance andcustomer’s ‘ideal’expectation. Gapsare aggregated intoa weighted averageusing customer’srelative importanceof each attribute.
Perceived attributeperformance
Customer Ask customers to rate the performance of attribute x for offering y (seven-point scalewhere 1 = “none” and 7 = “very high”).
Attribute ‘ideal’expectation
Customer For universal and preference attributes, use an instrument measure of the customer’sideal performance of attribute x in category z. When customers cannot provide instrument measures for universal and preference attributes, use seven-point scalesand ask experts to convert customers’ ratings to instrument measures. For idiosyncraticattributes, ask customers to rate their ideal performance of attribute x in category z(seven-point scale where 1 = “none” and 7 = “very high”).a
Relative attributeimportance
Customer Ask customers to rate the relative importance of attribute x in category z (constant sumscale of 100 across attributes).
Attribute type Measurementambiguity iswhether an instrument existsto measure anattribute’s performance.
Measurementambiguity
Firm Ask managers whether the performance of attribute x can be measured with an available instrument (Yes, No).
Customer preference heterogeneity is thevariance of ‘ideal’expectations.
Customer preference heterogeneity
Customers (variance acrosscustomers)
Ask customers to rate their ‘ideal’ performance of attribute x in category z (seven-pointscale where 1 = “none” and 7 = “very high”).
TABLE A1Illustrative Measures of Concepts in the Integrative Quality Framework
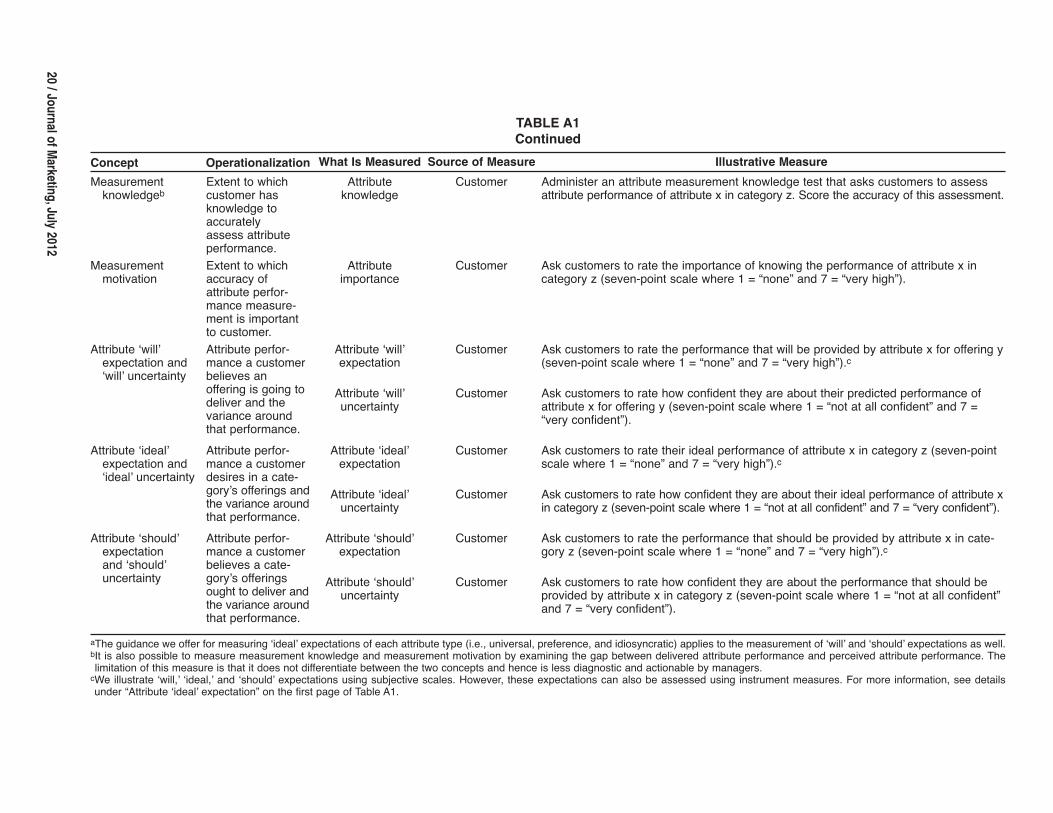
20/ Journal of M
arketing, July 2012
Concept Operationalization What Is Measured Source of Measure Illustrative MeasureMeasurementknowledgeb
Extent to whichcustomer hasknowledge toaccurately assess attributeperformance.
Attribute knowledge
Customer Administer an attribute measurement knowledge test that asks customers to assessattribute performance of attribute x in category z. Score the accuracy of this assessment.
Measurement motivation
Extent to whichaccuracy ofattribute perfor-mance measure-ment is importantto customer.
Attributeimportance
Customer Ask customers to rate the importance of knowing the performance of attribute x incategory z (seven-point scale where 1 = “none” and 7 = “very high”).
Attribute ‘will’expectation and‘will’ uncertainty
Attribute perfor-mance a customerbelieves an offering is going todeliver and thevariance aroundthat performance.
Attribute ‘will’expectation
Customer Ask customers to rate the performance that will be provided by attribute x for offering y(seven-point scale where 1 = “none” and 7 = “very high”).c
Attribute ‘will’uncertainty
Customer Ask customers to rate how confident they are about their predicted performance ofattribute x for offering y (seven-point scale where 1 = “not at all confident” and 7 =“very confident”).
Attribute ‘ideal’expectation and‘ideal’ uncertainty
Attribute perfor-mance a customerdesires in a cate-gory’s offerings andthe variance aroundthat performance.
Attribute ‘ideal’expectation
Customer Ask customers to rate their ideal performance of attribute x in category z (seven-pointscale where 1 = “none” and 7 = “very high”).c
Attribute ‘ideal’uncertainty
Customer Ask customers to rate how confident they are about their ideal performance of attribute xin category z (seven-point scale where 1 = “not at all confident” and 7 = “very confident”).
Attribute ‘should’expectation and ‘should’uncertainty
Attribute perfor-mance a customerbelieves a cate-gory’s offeringsought to deliver andthe variance aroundthat performance.
Attribute ‘should’expectation
Customer Ask customers to rate the performance that should be provided by attribute x in cate-gory z (seven-point scale where 1 = “none” and 7 = “very high”).c
Attribute ‘should’uncertainty
Customer Ask customers to rate how confident they are about the performance that should beprovided by attribute x in category z (seven-point scale where 1 = “not at all confident”and 7 = “very confident”).
TABLE A1Continued
aThe guidance we offer for measuring ‘ideal’ expectations of each attribute type (i.e., universal, preference, and idiosyncratic) applies to the measurement of ‘will’ and ‘should’ expectations as well.bIt is also possible to measure measurement knowledge and measurement motivation by examining the gap between delivered attribute performance and perceived attribute performance. Thelimitation of this measure is that it does not differentiate between the two concepts and hence is less diagnostic and actionable by managers.cWe illustrate ‘will,’ ‘ideal,’ and ‘should’ expectations using subjective scales. However, these expectations can also be assessed using instrument measures. For more information, see detailsunder “Attribute ‘ideal’ expectation” on the first page of Table A1.

line example, the courtesy of fellow passengers could beassessed by developing an inventory of traits and behaviorsassociated with passenger courtesy. Experts could thenmeasure the levels of these traits and behaviors and assesscustomers’ ideal levels. One challenge occurs when expertevaluations of passenger courtesy are influenced by experts’own ideal preferences. Therefore, firms should ensure theirexperts are aware of the range of customers’ ideal courtesylevels. Firms could also average across experts who holddifferent ideal courtesy levels. An alternative direct approachfor evaluating courtesy is to ask experts to assess the gaps
What Is Quality? / 21
between customers’ ‘ideal’ expectations and delivered attri -bute performance. However, when the gap changes, it willnot be clear whether a change in ‘ideal’ expectation ordelivered attribute performance is driving the change. Fur-thermore, this approach will lose validity when experts sub-stitute their own ideal for customers’ ideals.
Table A1 provides a starting point for scale develop-ment of the three quality states and related concepts. Itoffers an operationalization of each concept, a descriptionof what is measured, the source of each measure, and illus-trative measures.
Brucks, Merrie, Valarie A. Zeithaml, and Gillian Naylor (2000),“Price and Brand Name as Indicators of Quality Dimensionsfor Consumer Durables,” Journal of the Academy of MarketingScience, 28 (3), 359–74.
Buzzell, Robert D. and Bradley T. Gale (1987), The PIMS Princi-ples: Linking Strategy to Performance. New York: The FreePress.
Cadotte, Ernest R., Robert B. Woodruff, and Roger L. Jenkins(1987), “Expectations and Norms in Models of Consumer Sat-isfaction,” Journal of Marketing Research, 24 (August),305–314.
Churchill, Gilbert A., Jr., and Carol Surprenant (1982), “An Inves-tigation into the Determinants of Customer Satisfaction,” Jour-nal of Marketing Research, 19 (November), 491–504.
Cohen, Joel, Michael Tuan Pham, and Eduardo Andrade (2008),“The Nature and Role of Affect in Consumer Behavior,” inHandbook of Consumer Psychology, Curtis P. Haugtvedt, PaulM. Herr, and Frank R. Kardes, eds. New York: Lawrence Erl-baum Associates, 297–348.
Coyne, Kevin (1989), “Beyond Service Fads—Meaningful Strate-gies for the Real World,” Sloan Management Review, 30 (4),69–76.
Cronin, J. Joseph, Jr., and Steven A. Taylor (1992), “MeasuringService Quality: A Reexamination and Extension,” Journal ofMarketing, 56 (July), 55–68.
——— and ——— (1994), “SERVPERF Versus SERVQUAL: Recon-ciling Performance-Based and Perceptions-Minus-ExpectationsMeasurement of Service Quality,” Journal of Marketing, 58(January), 125–31.
Dalton, Dan R., William D. Todor, Michael J. Spendolini, GordonJ. Fielding, and Lyman W. Porter (1980), “Organization Struc-ture and Performance: A Critical Review,” Academy of Man-agement Review, 5 (1), 49–64.
Darby, Michael R. and Edi Karni (1973), “Free Competition andthe Optimal Amount of Fraud,” Journal of Law and Econom-ics, 16 (1), 67–88.
Deming, W. Edwards (1982), Quality, Productivity, and Competi-tive Position. Cambridge, MA: MIT Press.
Desai, Preyas S. (2001), “Quality Segmentation in Spatial Markets:When Does Cannibalization Affect Product Line Design?”Marketing Science, 20 (3), 265–83.
Dewey, John (1938), Experience and Education. New York: Col-lier Books.
Ding, Jie, Betsy S. Greenberg, and Hirofumi Matsuo (1998),“Repetitive Testing Strategies When the Testing Process IsImperfect,” Management Science, 44 (10), 1367–78.
Erdem, Tülin and Michael P. Keane (1996), “Decision-MakingUnder Uncertainty: Capturing Dynamic Brand Choice Pro-cesses in Turbulent Consumer Goods Markets,” Marketing Sci-ence, 15 (1), 1–20.
Feigenbaum, Armand V. (1991), Total Quality Control, 3d ed.New York: McGraw-Hill.
REFERENCESAaker, Jennifer L. (1997), “Dimensions of Brand Personality,”
Journal of Marketing Research, 34 (August), 347–56.Akerlof, George A. (1970), “The Market for ‘Lemons’: QualityUncertainty and the Market Mechanism,” Quarterly Journal ofEconomics, 84 (3), 488–500.
Anderson, Eugene W., Claes Fornell, and Donald R. Lehmann(1994), “Customer Satisfaction, Market Share, and Profitabil-ity: Findings from Sweden,” Journal of Marketing, 58 (July),53–66.
——— and Mary W. Sullivan (1993), “The Antecedents and Con-sequences of Customer Satisfaction for Firms,” Marketing Sci-ence, 12 (2), 125–43.
Arnould, Eric J. and Linda L. Price (1993), “River Magic: Extra-ordinary Experience and the Extended Service Encounter,”Journal of Consumer Research, 20 (1), 24–45.
Barney, Jay (1991), “Firm Resources and Sustained CompetitiveAdvantage,” Journal of Management, 17 (1), 99–120.
Bendapudi, Neeli and Robert P. Leone (2003), “PsychologicalImplications of Customer Participation in Co-Production,”Journal of Marketing, 67 (January), 14–28.
Bettencourt, Lance A. (1997), “Customer Voluntary Performance:Customers as Partners in Service Delivery,” Journal of Retail-ing, 73 (3), 383–406.
Bitner, Mary Jo, William T. Faranda, Amy R. Hubbert, and ValarieZeithaml (1997), “Customer Contributions and Roles in Ser-vice Delivery,” International Journal of Service Industry Man-agement, 8 (3), 193–205.
Bolton, Ruth N. and James H. Drew (1991), “A LongitudinalAnalysis of the Impact of Service Changes on Customer Atti-tudes,” Journal of Marketing, 55 (January), 1–9.
——— and Katherine N. Lemon (1999), “A Dynamic Model ofCustomers’ Usage of Services: Usage as an Antecedent andConsequence of Satisfaction,” Journal of Marketing Research,36 (May), 171–86.
———, ———, and Peter C. Verhoef (2008), “Expanding Business-to-Business Customer Relationships: Modeling the Customer’sUpgrade Decision,” Journal of Marketing, 72 (January),46–64.
——— and S. Saxena-Iyer (2009), “Interactive Services: A Frame-work, Synthesis and Research Directions,” Journal of Interac-tive Marketing, 23 (1), 91–104.
Boulding, William, Ajay Kalra, and Richard Staelin (1999), “TheQuality Double Whammy,” Marketing Science, 18 (4), 463–84.
———, ———, ———, and Valarie A. Zeithaml (1993), “ADynamic Process Model of Service Quality: From Expecta-tions to Behavioral Intentions,” Journal of MarketingResearch, 30 (February), 7–27.
Brady, Michael K. and Joseph Cronin Jr. (2001), “Some NewThoughts on Conceptualizing Perceived Service Quality: AHierarchical Approach,” Journal of Marketing, 65 (July),34–49.
Fornell, Claes (1995), “The Quality of Economic Output: Empiri-cal Generalizations about Its Distribution and Relationship toMarket Share,” Marketing Science, 14 (3), Part 2 of 2: SpecialIssue on Empirical Generalizations in Marketing (1995), pp.G203–G211.
———, Michael D. Johnson, Eugene W. Anderson, Jaesung Cha,and Barbara Everitt Bryant (1996), “The American CustomerSatisfaction Index: Nature, Purpose, and Findings,” Journal ofMarketing, 60 (October), 7–18.
Garvin, David A. (1984), “What Does ‘Product Quality’ ReallyMean?” Sloan Management Review, 26 (1), 25–43.
Gong, Linguo, Wushong Jwo, and Kwei Tang (1997), “Using On-line Sensors in Statistical Process Control,” Management Sci-ence, 43 (7), 1017–28.
Green, Paul E. and V. Srinivasan (1990), “Conjoint Analysis inMarketing: New Developments with Implications for Researchand Practice,” Journal of Marketing, 54 (October), 3–19.
Griffin, Abbie and John R. Hauser (1993), “The Voice of the Cus-tomer,” Marketing Science, 12 (1), 1–27.
Hamada, Michael, Robert J. Mackay, and James B. Whitney(1993), “Continuous Process Improvement with ObservationalStudies,” Journal of Quality Technology, 25 (2), 77–84.
Hauser, John R. and Don Clausing (1988), “The House of Qual-ity,” Harvard Business Review, 66 (3), 63–73.
Hellofs, Linda L. and Robert Jacobson (1999), “Market Share andCustomers’ Perceptions of Quality: When Can Firms GrowTheir Way to Higher Versus Lower Quality?” Journal of Mar-keting, 63 (January), 16–25.
Hennig-Thurau, Thorsten, Markus Groth, Michael Paul, andDwayne D. Gremler (2006), “Are All Smiles Created Equal?How Emotional Contagion and Emotional Labor Affect Ser-vice Relationships,” Journal of Marketing, 70 (July), 58–73.
Hoch, Stephen J. and John Deighton (1989), “Managing WhatConsumers Learn from Experience,” Journal of Marketing, 53(April), 1–20.
Holbrook, Morris B. and Kim P. Corfman (1985), “Quality andValue in the Consumption Experience: Phaedrus Rides Again,”in Perceived Quality, Jacob Jacoby and Jerry C. Olson, eds.Lexington, MA: Lexington Books, 31–57.
Homburg, Christian, Nicole Koschate, and Wayne D. Hoyer(2005), “Do Satisfied Customers Really Pay More? A Study ofthe Relationship Between Customer Satisfaction and Willing-ness to Pay,” Journal of Marketing, 69 (April), 84–96.
Hotelling, Harold (1929), “Stability in Competition,” The Eco-nomic Journal, 39 (153), 41–57.
Huang, Peng, Nicholas H. Lurie, and Sabyasachi Mitra (2009),“Searching for Experience on the Web: An Empirical Examina-tion of Consumer Behavior for Search and Experience Goods,”Journal of Marketing, 73 (March), 55–69.
Juran, Joseph M. (1992), Juran on Quality by Design: The NewSteps for Planning Quality into Goods and Services. NewYork: The Free Press.
Kackar, R.N. (1985), “Off-Line Quality Control, ParameterDesign, and the Taguchi Method,” Journal of Quality Technol-ogy, 17 (October), 176–88.
Kahn, Barbara E. and Brian Wansink (2004), “The Influence ofAssortment Structure on Perceived Variety and ConsumptionQuantities,” Journal of Consumer Research, 30 (4), 519–33.
Karmarkar, Uday S. (1996), “Integrative Research in Marketingand Operations Management,” Journal of Marketing Research,33 (May), 125–33.
——— and Uday M. Apte (2007), “Operations Management in theInformation Economy: Information Products, Processes, andChains,” Journal of Operations Management, 25 (2), 438–53.
Kassarjian, Harold H. (1971), “Personality and Consumer Behav-ior: A Review,” Journal of Marketing Research, 8 (November),409–420.
22 / Journal of Marketing, July 2012
Kelley, Scott W., James H. Donnelly Jr., and Steven J. Skinner(1990), “Customer Participation in Service Production andDelivery,” Journal of Retailing, 66 (3), 315–35.
Kennedy, Paul (1987), The Rise and Decline of Great Powers:Economic Change and Military Conflict from 1500–2000. NewYork: Random House.
Kirmani, Amna and Akshay R. Rao (2000), “No Pain, No Gain: ACritical Review of the Literature on Signaling UnobservableProduct Quality,” Journal of Marketing, 64 (April), 66–79.
Kolb, David A. (1984), Experiential Learning: Experience as theSource of Learning and Development. Upper Saddle River, NJ:Prentice Hall.
Kopalle, Praveen K. and Donald R. Lehmann (2001), “StrategicManagement of Expectations: The Role of DisconfirmationSensitivity and Perfectionism,” Journal of Marketing Research,38 (August), 386–94.
Kordupleski, Raymond E., Roland T. Rust, and Anthony J.Zahorik (1993), “Why Improving Quality Doesn’t ImproveQuality (or Whatever Happened to Marketing?),” CaliforniaManagement Review, 35 (3), 82–95.
Kumar, Piyush, Manohar U. Kalwani, and Maqbool Dada (1997),“The Impact of Waiting Time Guarantees on Customers’ Wait-ing Experiences,” Marketing Science, 16 (4), 295–314.
Lengnick-Hall, Cynthia A. (1996), “Customer Contributions toQuality: A Different View of the Customer-Oriented Firm,”Academy of Management Review, 21 (3), 791–824.
Loewenstein, George (1996), “Out of Control: Visceral Influenceson Behavior,” Organizational Behavior and Human DecisionProcesses, 65 (3), 272–92.
MacInnis, Deborah J., Christine Moorman, and Bernard Jaworski(1991), “Enhancing and Measuring Consumers’ Motivation,Opportunity to Process Brand Information from Ads,” Journalof Marketing, 55 (October), 32–53.
Mayer, Kyle J., Jack A. Nickerson, and Hideo Owan (2004), “AreSupply and Plant Inspections Complements or Substitutes? AStrategic and Operational Assessment of Inspection Practicesin Biotechnology,” Management Science, 50 (8), 1064–81.
Menon, Kalyani and Laurette Dubé (2007), “The Effect of Emo-tional Provider Support on Angry Versus Anxious Consumers,”International Journal of Research in Marketing, 24 (3),268–75.
Meuter, Matthew L., Amy L. Ostrom, Robert I. Roundtree, andMary Jo. Bitner (2000), “Self-Service Technologies: Under-standing Customer Satisfaction with Technology-Based ServiceEncounters,” Journal of Marketing, 64 (July), 50–64.
Mitra, Debanjan and Peter N. Golder (2006), “How Does Objec-tive Quality Affect Perceived Quality? Short-Term Effects,Long-Term Effects, and Asymmetries,” Marketing Science, 25(3), 230–47.
Montgomery, Douglas C. (2008), Introduction to Statistical Qual-ity Control, 6th ed. New York: John Wiley & Sons.
Morgan, Neil A. and Douglas W. Vorhies (2001), “Product QualityAlignment and Business Unit Performance,” Journal of Prod-uct Innovation Management, 18 (6), 396–407.
Nelson, Philip (1970), “Information and Consumer Behavior,”Journal of Political Economy, 78 (2), 311–29.
Oliver, Richard L. (1980), “A Cognitive Model of the Antecedentsand Consequences of Satisfaction Decisions,” Journal of Mar-keting Research, 17 (November), 460–69.
——— (1996), Satisfaction: A Behavioral Perspective on the Con-sumer. New York: McGraw-Hill.
——— (2009), Satisfaction: A Behavioral Perspective on the Con-sumer. New York: M.E. Sharpe.
——— and John E. Swan (1989), “Equity and DisconfirmationPerceptions as Influences on Merchant and Product Satisfac-tion,” Journal of Consumer Research, 16 (3), 372–83.

Parasuraman, A., Leonard L. Berry, and Valarie A. Zeithaml(1991), “Understanding Customer Expectations of Service,”Sloan Management Review, 32 (3), 39–48.
———, Valarie A. Zeithaml, and Leonard L. Berry (1985), “A Con-ceptual Model of Service Quality and Its Implications forFuture Research,” Journal of Marketing, 49 (October), 41–50.
———, ———, and ——— (1988), “SERVQUAL: Multiple-ItemScale for Measuring Consumer Perceptions of Service Qual-ity,” Journal of Retailing, 64 (1), 12–40.
———, ———, and ——— (1994), “Reassessment of Expectationsas a Comparison Standard in Measuring Service Quality:Implications for Further Research,” Journal of Marketing, 58(January), 111–24.
Petty, Richard E. and John T. Cacioppo (1986), Communicationand Persuasion: Central and Peripheral Routes to AttitudeChange. New York: Springer-Verlag.
Pirsig, Robert M. (1974), Zen and the Art of Motorcycle Mainte-nance: An Inquiry into Values. New York: HarperTorch.
Porter, Michael E. (1998), Competitive Advantage: Creating andSustaining Superior Performance. New York: The Free Press.
Powell, Thomas C. (1995), “Total Quality Management asCompetitive Advantage: A Review and Empirical Study,”Strategic Management Journal, 16 (1), 15–37.
Price, Linda L. and Eric J. Arnould (1999), “Commercial Friend-ships: Service Provider-Client Relationships in Context,” Jour-nal of Marketing, 63 (October), 38–56.
———, ———, and Patrick Tierney (1995), “Going to Extremes:Managing Service Encounters and Assessing Provider Perfor-mance,” Journal of Marketing, 59 (April), 83–97.
Reeves, Carol A. and David A. Bednar (1994), “Defining Quality:Alternatives and Implications,” Academy of ManagementReview, 19 (3), 419–45.
Rust, Roland T., J. Jeffrey Inman, Jianmin Jia, and Anthony Zahorik(1999), “What You Don’t Know About Customer-PerceivedQuality: The Role of Customer Expectation Distributions,”Marketing Science, 18 (1), 77–92.
———, Christine Moorman, and Peter R. Dickson (2002), “GettingReturn on Quality: Revenue Expansion, Cost Reduction, orBoth?” Journal of Marketing, 66 (October), 7–24.
———, Anthony J. Zahorik, and Timothy L. Keiningham (1995),“Return on Quality (ROQ): Making Service Quality Finan-cially Accountable,” Journal of Marketing, 59 (April), 58–70.
Salop, Steven C. (1979), “Monopolistic Competition with OutsideGoods,” Bell Journal of Economics, 10 (1), 141–56.
What Is Quality? / 23
Shewhart, Walter A. (1986), Statistical Method from the Viewpointof Quality Control. New York: Dover.
Spence, A. Michael (1975), “Monopoly, Quality, and Regulation,”Bell Journal of Economics, 6 (2), 417–29.
Steenkamp, Jan-Benedict E.M. (1990), “Conceptual Model of theQuality Perception Process,” Journal of Business Research, 21(4), 309–333.
Sutton, John (1986), “Vertical Product Differentiation: SomeBasic Themes,” American Economic Review, 76 (2), 393–98.
Taguchi, G. and S. Konishi (1993), Taguchi Methods: Signal-to-Noise Ratio for Quality Evaluation, Quality EngineeringSeries, Vol. 3. Homewood, IL: Richard D. Irwin.
Tellis, Gerard J. and Joseph Johnson (2007), “The Value of Qual-ity,” Marketing Science, 26 (6), 758–73.
——— and Birger Wernerfelt (1987), “Competitive Price andQuality Under Asymmetric Information,” Marketing Science, 6(3), 240–53.
Tirole, Jean (1988), The Theory of Industrial Organization. Cam-bridge, MA: MIT Press.
Tse, David K. and Peter C. Wilton (1988), “Models of ConsumerSatisfaction Formation: An Extension,” Journal of MarketingResearch, 25 (May), 204–212.
Watson, David, Lee Anna Clark, and Auke Tellegen (1988),“Development and Validation of Brief Measures of Positiveand Negative Affect: The PANAS Scales,” Journal of Person-ality and Social Psychology, 54 (6), 1063–70.
Woodall, William H. and Douglas C. Montgomery (1999),“Research Issues and Ideas in Statistical Process Control,”Journal of Quality Technology, 31 (4), 376–86.
Woodruff, Robert B., Ernest R. Cadotte, and Roger L. Jenkins(1983), “Modeling Consumer Satisfaction Processes UsingExperience-Based Norms,” Journal of Marketing Research, 20(August), 286–304.
Zeithaml, Valarie A. (1988), “Consumer Perceptions of Price,Quality, and Value: A Means-End Model and Synthesis of Evi-dence,” Journal of Marketing, 52 (July), 2–22.
———, Leonard L. Berry, and A. Parasuraman (1988), “Communi-cation and Control Processes in the Delivery of Service Qual-ity,” Journal of Marketing, 52 (April), 35–48.
———, ———, and ——— (1993), “The Nature and Determinantsof Customer Expectations of Service,” Journal of the Academyof Marketing Science, 21 (1), 1–12.
———, ———, and ——— (1996), “The Behavioral Consequencesof Service Quality,” Journal of Marketing, 60 (April), 31–46.