Pesticide Use in the Rice Bowl of Kerala: Health Costs and...
46
Pesticide Use in the Rice Bowl of Kerala: Health Costs and Policy Options P. INDIRA DEVI Department of Agricultural Economics, Kerala Agricultural University India SANDEE Working Paper No. 20-07 South Asian Network for Development and Environmental Economics (SANDEE) PO Box 8975, EPC 1056 Kathmandu, Nepal February 2007
Transcript of Pesticide Use in the Rice Bowl of Kerala: Health Costs and...

SANDEE Working Paper No. 20-07 41
Pesticide Use in the Rice Bowl of Kerala:Health Costs and Policy Options
P. INDIRA DEVI
Department of Agricultural Economics, Kerala Agricultural UniversityIndia
SANDEE Working Paper No. 20-07
South Asian Network for Development and Environmental Economics (SANDEE)PO Box 8975, EPC 1056
Kathmandu, Nepal
February 2007
lmantha
Text Box
This work is used with the permission of South Asian Network for Development and Environmental Economics (SANDEE). © 2007, South Asian Network for Development and Environmental Economics (SANDEE).

Published by the South Asian Network for Development and Environmental Economics(SANDEE)PO Box 8975, EPC 1056 Kathmandu, Nepal.Telephone: 977-1-552 8761, 552 6391 Fax: 977-1-553 6786
SANDEE research reports are the output of research projects supported by the SouthAsian Network for Development and Environmental Economics. The reports have beenpeer reviewed and edited. A summary of the findings of SANDEE reports are alsoavailable as SANDEE Policy Briefs.
National Library of Nepal Catalogue Service:
P. Indira Devi
Pesticide Use in the Rice Bowl of Kerala: Health Costs and Policy Options
(SANDEE Working Papers, ISSN 1893-1891; 2007- WP 20)
ISBN: 978-99946-810-9-9
Key words:
1. Pesticide Exposure
2. Dose-Response Functions
3. Cost-of-Illness
4. India
The views expressed in this publication are those of the author and do not necessarilyrepresent those of the South Asian Network for Development and EnvironmentalEconomics or its sponsors unless otherwise stated.
II SANDEE Working Paper No. 20-07

The South Asian Network for Development and
Environmental Economics
The South Asian Network for Development and Environmental Economics (SANDEE)is a regional network that brings together analysts from different countries in SouthAsia to address environment-development problems. SANDEE’s activities includeresearch support, training, and information dissemination. SANDEE is supported bycont r ibut ions f rom in terna t ional donors and i t s members . P lease seewww.sandeeonline.org for further information about SANDEE.
SANDEE is financially supported by International Development Research Centre(IDRC), The Ford Foundation, Swedish International Development CooperationAgency (SIDA) and Norwegian Agency for Development Cooperation (NORAD).
Technical EditorPriya Shyamsundar
English EditorCarmen Wickramagamage
Comments should be sent to P. Indira Devi, Department of Agricultural Economics,Kerala Agricultural University, India Email: [email protected]
SANDEE Working Paper No. 20-07 III

TABLE OF CONTENTS
1. INTRODUCTION 1
2. PESTICIDE USE IN INDIA 2
3. STUDY AREA AND DATA 3
4. METHODS 74.1 DOSE-RESPONSE MODEL 74.2 THE COST-OF-ILLNESS 10
5. RESULTS 125.1 DOSE-RESPONSE FUNCTION 125.2 THE WELFARE LOSS 13
6. CONCLUSIONS 14
7. ACKNOWLEDGEMENT 15
8. REFERENCES 16APPENDIX A 26APPENDIX B 27APPENDIX C 30APPENDIX D 33APPENDIX E 36APPENDIX F 39
LIST OF TABLES
Table 1 : Socio-Economic Profile of the Respondents 20
Table 2 : Pesticides in Rice Production in Kuttanad 21
Table 3 : Health Damage Symptoms of Pesticide Exposure 22
Table 4 : The Dose-Response Function and Determinants of Health Damage 23
Table 5 : Summary Statistics of Variables Used in Dose-Response Function 24
Table 6 : Binomial Probit Estimates of the Determinants of Health Damage 24
Table 7 : Average Expected Health Cost of Pesticide Exposure 25
SANDEE Working Paper No. 20-07 V

Abstract This study examines pesticide use in Kuttanad, India, an economically sensitive area often referred to as the rice bowl of Kerala. Using primary data collected from pesticide applicators and farm labor, the study assesses short-term health costs associated with pesticide exposure. The study finds that the toxicity level and dose of pesticides can exert a significant effect on the health of pesticide applicators. The average expected health costs from pesticide exposure are Rs. 38 (US $ 0.86) per day or 24% approximately a quarter of the average daily earnings of the applicator. The study finds that health costs can be mitigated considerably by reducing the dose of pesticides used. For examples, a 25% reduction in either the does of the most toxic chemical used, or in all pesticide doses, results in a 16% and 24% reduction in health costs respectively. A 24% reduction in costs can be realized if all pesticide doses are reduced by 25%. Dose reduction is a desirable and feasible strategy that can be achieved either by restricting the quantity of pesticide used or by diluting the amount sprayed with the recommended levels of water. Less than 2% of the applicators understood the toxicity levels of the pesticides they used. Thus, there is ample scope for reducing pesticide exposure through training and agricultural extension services. Key Words: Pesticide Exposure, Dose-response functions, cost-of-illness, India

48 SANDEE Working Paper No. 20-07

SANDEE Working Paper No. 20-07 1
Pesticide Use in the Rice Bowl of Kerala:Health Costs and Policy Options
P. Indira Devi
1. Introduction
According to World Health Organization estimates, pesticides cause 30,00,000 cases of poisoningand 2,20,000 deaths annually across the globe, the majority of which are reported from developingcountries. These numbers, even more alarmingly, show a rising trend (WHO, 1990; DTE, 2001;Rosenstock, et al., 1991; Pimental, 1992; Kishi, et al., 1995; WRI, 1998). While indiscriminateuse and unscientific handling of toxic chemicals are very common, the extent, severity and frequencyof associated health problems are often unknown.
Pesticide-related health damages are difficult to identify, particularly in developing countries,because of inherent problems of poverty, inadequate health care facilities, poor training supportto health-care personnel, and unsatisfactory access to the health care system. Furthermore, themajor victims are the most vulnerable sections of the population. The farm workers, small andmarginal farmers and women, who are the most often exposed owing to occupational factors,neglect the health hazards of pesticide exposure due to either lack of awareness and/or due tofinancial reasons. This may perhaps explain the lack of research on the impacts of pesticideexposure. There have of course been attempts on a limited scale in some developing countries tovalue the health damage due to pesticide exposure (Jeyaretnam, 1990; Ngowi, 2002; Wilson,2002). Such studies, however, have not been reported in India thus far. This study was undertakento fill this existing gap in knowledge.
Both media and scientific attention to pesticide use and its effects gained momentum in India onlyvery recently. Moreover, a review of studies on this topic suggests that it is heavily loaded withresearch from the physical sciences with little contribution from economics. Many scientistsreport the presence of insecticide residues in soil, water bodies, air, food materials and thebodies of living beings (Mencher, 1991; Brahmaprakash and Sethunathan, 1987; Gangammaand Satyanarayana, 1991) but few evaluate impacts in economic terms. This study looks at thepesticide use pattern in an ecologically-sensitive rice ecosystem of Kerala, India, and assessesthe value of health damage among farm workers. The main objectives are to understand a) thepattern of pesticide use and the precautions taken in handling pesticides in Kerala; b) the acutehealth effects of pesticide exposure among the different types of agricultural labor; and c) themonetary health costs associated with exposure.
The effect of pesticide exposure may be of three types, namely, short-term high-dose exposure(to applicators, workers in production centers, stockists at sales outlets, and in attempted suicides);long-term high-dose exposure (workers in production centers and applicators); and long-termlow-dose exposure (all population groups). This naturally has both morbidity and mortalityeffects. This study focuses on short-term exposure to applicators.

2 SANDEE Working Paper No. 20-07
While pesticide exposure has many long-term chronic effects, assessing these impacts is beyondthe scope of this study. The morbidity effects of pesticide exposure are discussed in detail inForget, 1991; Rola and Pingali, 1993; Antle and Pingali, 1994; Crissman, et al., 1998; Antle, etal., 1998; Cole, et al., 1998; Wilson, 2002; and Dasgupta, 2005. However, Dasgupta (2005)reports very weak association between the farmers’ self-reported symptoms of pesticide exposureand actual poisoning (blood test results). Hence studies, which depend on self-reported symptoms,may reflect a lower estimate than that which might be said to prevail in actual fact.
The paper is presented in six sections. Section 2 provides an overview of pesticide use in Indianagriculture while Section 3 gives an account of the data, study-site and sample characteristics.Section 4 describes the analytical approach and explains the statistical models used in the work.Section 5 describes the findings on the probability of getting sick and the expenses when it comesto health damages. Section 6 discusses policy measures.
2. Pesticide Use in India
Pesticide use in India dates back to the year 1948 when DDT and BHC were imported formalaria and locust control. Currently, India is the No. 1 manufacturer of basic pesticides in Asiaand ranks 12th globally. Among the predominant classes of pesticides used in India are insecticides,which account for 75 per cent of total consumption, followed by fungicides (at 12 per cent) andherbicides (at 10 per cent). Furthermore, 54 percent of the total quantity of pesticides used inthe country is used in cotton, with 17 per cent in rice and 13 per cent in vegetables and fruits.
The pesticide residues in food in India, especially vegetables, are the highest in the world. Thisis mainly due to the unregulated use of pesticides. Persistent pesticides like BHC and DDTremain in the ecosystem for longer periods and pose great danger to the soil/water bodies andthe dependent life-systems. Chemical pesticide residues have often been detected in food grains,vegetables, fruits, oils, cattle feed and fodder in most parts of the country. About 72 per cent offood samples in India have shown the presence of pesticide residues within tolerance levels whilein 28 per cent samples they were above the tolerance level as compared to 1.25 per cent globally.On a comparative basis, very high levels of organic chlorine compounds have been reported inhuman blood, fat and milk samples in India (Bhatnagar, 2001). As a consequence, India accountsfor one-third of the total pesticide poisoning cases in the world (Puri, 1998).
However, pesticide consumption in India has recorded a decline in recent years. The pattern isthe same for Kerala too. But the intensity of use (quantity per hectare) in the state has increased(Appendix F: Figs.1, 2, 3 and 4). In contrast to the national pattern, however, the fungicide usein Kerala is much higher (at 57%) when compared with the use of insecticides. This is generallyattributed to the higher proportion of plantation crops in the state.
The Department of Agriculture, Government of Kerala, is the implementing agency for theInsecticides Control Order. The Agricultural Officers (one officer each for every panchayat) aredesignated as the insecticide inspectors. In addition, there are separate quality control laboratoriesin various parts of the state. However, the quality control arrangements by the departmentappear to fall far short of desired standards. Though sub-standard pesticide samples are oftenreported, until recently, little action was taken on such reports. The only action taken was to stop

SANDEE Working Paper No. 20-07 3
the sale of the particular substandard batch of pesticide—however, by the time such decisionswere implemented, most of the pesticides were already sold. Similarly, the statistics provided bythe Health Services Department of the State show that there are no cases of health hazard due tooccupational exposure to pesticides, which is quite unrealistic. What all this goes to show areserious inadequacies in data at all levels.
There have been multiple episodes of pesticide poisoning reported in Kerala. The Kerala Statebecame the focus of pesticide literature following the death of more than 100 people in the year1958 after consuming wheat flour contaminated with pesticides during transportation. The state-owned Plantation Corporation of Kerala began the aerial spraying of Endrin (later Endosulphan)way back in the 1970s in their cashew plantations, which has been associated with the outbreak,among local people, of severe health problems such as cancer. In each household, at least oneperson has been found to work in cashew plantations and 156 cases of disorders from 123households were noted during the period 1990–2001 (Rajendran, 2003). Pesticide residuesare detected in fruits and vegetables, bottled drinking water, soft drinks, milk and other fooditems. Furthermore, cases of cancer observed in a village near the cardamom plantations in theState have been attributed to the high pesticide use.
A study undertaken by the Thiruvananthapuram Medical College has reported very frequentcases of cancer of the lip, stomach, skin and brain, lymphoma, leukemia and multiple mylomafrom the Kuttanad rice area of Kerala, linking the same to high pesticide use in the area (Dinham,1993). A recent survey conducted by a volunteer group makes a similar observation regardingthe rising trend in cancer patients in Kuttanad, identifying pollution as one of the reasons. Reportson the reduction in the fish population and massive deaths due to ulceration in fish in Kuttanadalso appear very frequently in the local media.
Rakhesh, (1999) studying the externalities associated with pesticides, has found that pesticidepoisoning leads to both explicit and implicit costs for the applicator/ farmer. In his study, majorityof farmers (60%) reported that they were suffered from health problems caused by pesticides.In another study, Krishna (2001) has found skin allergy and headaches to be, among the healthhazards induced by pesticides, skin allergy and headaches were found to be the most prominentpesticide-induced health hazards. Krishna reports that most farmers were aware of these negativeimpacts and were willing to incur an additional cost of Rs 138 per hectare of rice farm for analternate eco-friendly agricultural practices.
3. Study Area and Data
Kuttanad is a low-lying area near the coast of Kerala, India, with a total population of 1.4 million(Census, 2001). It is called the rice bowl of Kerala. Rice cultivation in Kuttanad is however ofa special type, as the land is on average three meters below the Mean Sea Level (MSL). Paddyis virtually the only crop grown and the poor drainage conditions make most of the land in thearea unsuitable for other crops. Coconut is grown on the bunds and on the higher areas. Themain rice crop of the area is the punja (summer crop). In some areas, a second crop (viruppu)is possible. The punja season is generally the period from October/November to March/April,i.e., after the cessation of the North-East monsoon and before the ingression of saline waterduring the summer months. This study was conducted during the punja crop of 2004-05.

4 SANDEE Working Paper No. 20-07
The paddy fields in Kuttanad are classified into three types as Karapadom, Kayal and Kari landsbased on physiographic and soil characteristics. Rice fields are usually demarcated aspadasekharams. A contiguous stretch of wetlands bounded by waterways or other natural featuresis called a padasekharam, which is a homogeneous physical entity.
For the purposes of this study we collected pesticide-related information from a sample of pesticideapplicators and agricultural laborers. To select our sample, two Community Development Blockswere randomly selected from each of the three districts which form the Kuttanad area. Fromeach block two panchayats were identified. From each selected panchayat, three padasekharamswere chosen on a random basis and these padasekharams formed the study area.
As noted earlier, the respondents for this study belong to two groups: Pesticide Applicators andAgricultural Laborers. Pesticide applicators are those who generally undertake the pesticide-spraying job during the peak season of spraying. They are considered skilled labor for this typeof work. During the off-season period when spraying operations are limited, they engage inother types of agricultural and non-agricultural work. We collected data from 280 applicators.The agricultural laborers are those who engage in farm operations such as ploughing, fertilizerapplication, land preparation, etc., but do not undertake pesticide spraying. They also opt fornon-agricultural work during the off-season. We surveyed a total of 101 agricultural laborers forthis study.
Data collection was through a structured pre-tested questionnaire, by the personal interviewmethod, and through a farm diary maintained by the respondents, which was closely monitoredby the research team (Appendix B, C, D& E). The data included both qualitative and quantitativeattributes. Direct observations were also made wherever possible.
The data set for the study consisted of three components:
i) Pesticide applicators during pesticide application work (n= 280): Each applicator wascontacted four times during the spraying season, which lasted for five weeks. During thesevisits data on the spraying details and the health status after the spray operations (within aperiod of 24 hours) were gathered. Hence, on average, for each respondent four dose-response observations data are available and the total data set includes 1135 observations.However, some of the respondents were interviewed 5 times while others could be metonly two times due to their work schedules.
ii) ) Pesticide applicators when they undertake work other than pesticide application during theoff-season (n= 212): The applicators undertake wage labor in farms or other sectors whenspraying operations are not available. The same applicator was contacted again during theoff-season (when it comes to spraying) and data was gathered. The data set here includesobservations from 212 respondents.
iii) Agricultural laborers: This group comprises the farm workers who do not undertake pesticideapplications (n=101). The data on them includes responses related to both types of work—agricultural and non- agricultural work. Here the data set includes responses from 101laborers.

SANDEE Working Paper No. 20-07 5
Data collectors were hired locally with the help of local Agricultural Officers. Their familiaritywith local conditions and access added much to the quality of the data collected. The datacollectors were either graduates in science or diploma holders in agriculture. Generally, the visitsfor the dose-response part of the data were undertaken during the morning hours before theworkers left for work. During these interviews details were gathered on the previous day’sspraying operations and its health response during these visits. Spraying operations were alsodirectly observed on a random basis. Help from family members was also sought when estimatingthe cost incurred on account of sickness.
Table 1 furnishes the socio-economic profile of the respondents. The average age of applicatorsin the sample was 45 years, the minimum being 23 and the maximum 70. The mean age wasslightly higher in the agricultural labor group. It is possible that the more risky jobs are taken upby younger people. Though some of the respondents in the applicator group have studied up touniversity level, most of them had studied only up to the 7th standard. On the other hand, theeducation level of agricultural laborers was only up to the 4th standard.
Pesticide application, as a general practice, is of shorter duration than other wage labor in theagricultural and non-agricultural sectors. The average work period is 2.18 a day when it comesto pesticide application work. However, the same group of respondents spent 6.3 hours at otheragricultural work and 3.84 hours on average on non-agricultural work.
Pesticide applicators are paid more than twice the wages in the agricultural sector. While thepayment for pesticide applications is Rs 73 per hour, wages for other agricultural work isapproximately Rs.30 per hour. In the non-agricultural sector, however, payments are slightlyhigher — but not as high as in pesticide application work. The non-agricultural work taken up bythe applicator group is generally of a skilled nature (electrical work, machinery handling, driving,etc.). The non-agricultural wages were on average Rs 52 per hour. Interestingly enough, theaverage earnings per day for pesticide application is Rs 159, which is lower than the daily earningsof agriculture workers and applicators via other work. When applicators opt for agriculturalwork, their earnings go up by 20% and it is 24 % higher in the case of non-agricultural work.Nonetheless, further exploratory analysis is required before a conclusion can be arrived at as towhether the applicators were properly compensated for the risk they face.
Rice cultivation in Kuttanad is of an intensive nature compared to many other parts of the state.Nearly 90% of the farmers sow high-yielding varieties, necessitating the use of high levels ofchemical inputs. Moreover, the area is prone to pests such as Brown Plant Hopper. The KeralaAgricultural University restricts the use of certain chemicals for rice in the area (methyl parathionand BHC). Interestingly, the most commonly used chemicals in the region were methyl parathion,followed by monocrotophos. Some of the chemicals used however are not among therecommended chemicals.
Table 2 gives the list of chemicals used in the area and its use level. Among the 19 used twelverinsecticides, four fungicides and three weedicides. The majority are systemic in action whiletwelve belong to the organic phosphorous group of chemicals. Compared to organo-chlorines(which are more persistent), organo- phosphates and carbamates are less persistent but moretoxic. Organo- phosphorous pesticides are found to be responsible for death in more than 70%of the cases of pesticide-poisoning in India .

6 SANDEE Working Paper No. 20-07
The dose of the spray fluid used in the study area was found to be much higher than therecommended level in all cases. This conclusion was arrived at through a comparison with therecommended dose suggested by the Kerala Agricultural University in the case of those chemicalswhere a recommendation exists. In the case of the other chemicals, the manufacturer’s prescriptionwas used as a guide. More often than not, the quantity of the formulation was well in excess ofthe recommendation while the water used was below the recommended level.
Our study shows that 40% of the spraying is undertaken to protect the crop against the pestBrown Plant Hopper, 17% against the rice bug, and 16% to control against leaf folder. Sprayingis done with a knapsack sprayer that is either owned by the farmer or hired from other sources.Most owners (88%) buy the chemical to be sprayed and entrust the applicator with the spraying.Generally, spraying operations were not supervised. The mixing of the chemical with water isgenerally done in a separate container using water from local water bodies. Sometimes thewater and the chemical are poured together into the sprayer and shaken (22%), which is againstscientific good practice.
Extremely toxic chemicals, marked red, are seen in use in 21% of spraying events in the studyarea. The frequency of use of highly toxic chemicals (marked yellow) is 51.25%, the use ofmoderately toxic chemicals (marked blue) is 22.55% while the rest are comparatively saferchemicals. More often than not, applicators perceive the toxicity levels to be lower than theactual toxicity levels. Only 33% of the applicators read the label on the bottle while only 2.5%took steps to follow the instructions. A mere 1.5 % understands the toxicity level associated withthe color code.
Many potential health damages and acute symptoms of exposure to different chemical groups ofpesticides are reported in the epidemiological literature. Following these findings and on thebasis of the major groups of pesticides used, 17 major symptoms were identified prior to undertakingour survey. Based on responses from the survey, in 71% of spray events, the pesticide applicatorsreported some form of health impact relative to 45% of the times when they engaged in otherwork. In the case of agricultural laborers, it was 32% (Table 3).
Skin problems were reported as the most common symptom and itching was more frequent thanhives. Eye-irritation and vision problems were also very common. However, these were regardedas minor ailments that were often managed by the workers themselves. Home remedies ortraditional ayurvedic treatment were resorted to in these cases. Allopathic treatment was resortedto in only the more serious cases. Though the frequency of symptoms like nausea, giddiness,breathing problems, dehydration, vomiting, cramps, convulsions, diarrhea, etc., were comparativelyless, they are more life-threatening and hence formal medical advice was sought more often insuch instances.
The severe symptoms are breathing problems, dehydration, vomiting, cramps and diarrhea whichoften manifest themselves soon after spraying and result in hospitalization. In a majority of casesthe person is taken directly from the farm to the hospital. In such cases people preferred to go toprivate hospitals owing to better care and facilities. This is also reflected in macro-level datawhere we find that the public health care system reports no cases of occupational health damagedue to pesticide exposure.

SANDEE Working Paper No. 20-07 7
In our study, we found 76 cases of hospitalization among the 894 cases of sickness related topesticide exposure. The expenditure on hospitals ranged from Rs.450 to Rs. 3780 with a meanof Rs.1536. Where there is hospitalization, the days spent in the hospital range from one day toone week. In the other two groups there were no cases of hospitalization consequent towork hours.1
The majority of the respondents were aware of the potential health hazard due to exposure andthe need for personal protective gadgets. Jeyaratnam, et al., (1987) and Sivayoganathan, et al.,(1995) have also attested to this situation in the case of Sri Lanka. However, none of theapplicators used the suggested protective gadgets, which include a face-mask with replaceablefilters, goggles, head-cover, rubber gloves, full-sleeved shirts and full pants, and boots. The costfactor, general lethargy, and the discomfort associated with the use of protective devices underhot and humid climatic conditions and in water-logged paddy areas were reported as the reasonsfor non-adoption. Moreover, there exists no mechanism to ensure their use.2
Nonetheless, some form of protective covering of body parts was adopted by 71% of therespondents while spraying. In 21% of the cases, it was mainly full- sleeved shirts. However,many rolled up their sleeves while spraying/mixing. Thirty one percent of applicators tied a pieceof cloth around the nose. A mere 1% used some form of eye protection (e.g., ordinary spectacles,which are in use even otherwise). These unscientific methods for avertive action often fail toachieve the desired objectives.
4. Methods
In order to estimate the economic impact of pesticides on human health, two types of informationare required. First, the physical health impacts of the exposure need to be identified; second, themonetary health cost associated with this exposure need to be assessed (Freeman, 2003). Inthis study, we estimate a dose-response model for quantifying the physical impact and then weestimate the cost-of-illness.
4.1. Dose-Response Model
A dose–response function presents a statistical relationship between exposure to pollutants andhealth risks. Dose-response functions frequently form the physical basis of economic modelsused to estimate the health costs of pollution. They involve the estimation of a relationshipbetween illness and the ambient pollution levels while controlling for other variables (socio-economic and behavioral) that affect health status (Cropper and Freeman, 1991).
1 The private health care system in Kerala is often reported to be very costly. A recent study by KeralaShastra Sahithya Parishad, a noted NGO in the state, estimates the annual per capita treatment costin the state as Rs.1722 and the cost per event of treatment as Rs.830.70. This amounts to 1.9 % of familyexpenditure. On average 64.4 % of the people depend on private medical systems .The averageexpenditure per hospitalization is Rs. 9680. In the case of the private system it is as high as Rs. 10445(A ravindan, 2006).
2 In the plantation sector, employers are provided these gadgets as part of labor welfare measures.

8 SANDEE Working Paper No. 20-07
In this study, following studies by other scholars (Dasgupta, 2004; Huang, et al., 2001; Jalan, etal., 2003; Dasgupta, et al., 2005) the dose-response function, is estimated where the dependentvariable is a binary variable. This function gives the probability of getting sick after an event ofpesticide spray after controlling for other factors. The reason the dose-response function isestimated as a probability function is because the data does not permit the estimation of a continuoussickness function. There were hardly any sick days when work stopped as a result of pesticideexposure. Thus, it is not possible to estimate a regular sickness function with sick days as acontinuous dependent variable.
The use of probability models is conceptually preferable to conventional linear regression modelswhen the dependent variable is dichotomous. The probability models provide parameter estimates,which are asymptotically consistent and efficient. In this section, a Probit model is used to studythe determinants of the probability of getting sick. The general model is a binary choice modelinvolving estimation of the probability of falling sick (y) as a function of a vector of explanatoryvariables (x). It is assumed that there is an underlying response variable y*
i defined by the regression
relationship (Gujarati, 2004).
iii uxy += '* β …………………… (1)
In practice, y*i is unobservable and , what is observed is a dummy variable y defined by
y= 1 if y*i>0 (SICK = YES)
=0 otherwise (NOT SICK =NO) .............................. (2)
From the above relations, we get Prob (y
i= SICK) = Prob (u
i>-β’x
i) = 1-F(-β’x
i) ……………………(3)
Where F is the cumulative distribution function. Hence, we obtain the following likelihoodfunction
∏=
−=0
'(y
FL β ……………………..(4)
Taking the logarithm of L and maximizing with respect to β , which gives us the maximumlikelihood estimator of the slope coefficients from which we can estimate the impact of differentdoses of pesticides on the probability of falling sick. The explanatory variables used in the Probitmodel and the expected signs are presented in Table 4 and described below. The dataset forestimating the dose-response variable includes 1448 observations from applicators (both duringdays when they were exposed to pesticides and when they did other work) as well as otheragricultural laborers when they were doing field work.
Y (1= sick or 0=not sick): The health effects of pesticide exposure are manifested as specificsymptoms or a combination of a few symptoms. Building on scientific information as well as apreliminary pilot study, 17 types of symptoms were first identified. Based on whether or notpesticide-related symptoms were reported, a sickness dummy variable was created. This is thedependent variable in the dose-response function.

SANDEE Working Paper No. 20-07 9
Body Mass Index : The Body Mass Index (BMI) gives a measure of the general health status ofthe individual. A BMI value between 18.5 and 25 is reported to be the desirable value and anyvalue below or above is undesirable. The lower values represent the risks due to malnutritionwhile the higher values reflect the danger of obesity. Malnutrition is a possibility with our sampleand hence the expected sign of this variable is negative. (see Appendix E for further details)
Pesticide Dose: These variables captures the dilution of spray fluid and the toxicity of the chemicalused. WHO has prescribed a color code for chemical pesticides according to the toxicity level.This is based on their LD
50 value. The Lethal Dose (LD) is the quantity required to kill 50% of
the target population. The lower the value, the more toxic the chemical is. Extremely toxicchemicals are marked red (LD
50 less than 50), highly toxic chemicals as yellow (LD
50 value 50-
500), the moderately toxic as Blue (with LD 50
500-5000) and the slightly toxic as Green (LD50
value greater than 5000). In our study, the dose variable captures the effect of the dilution of thespray fluid. It is a function of the quantity of the chemical used, the concentration of the formulationand the quantity of water used. Based on data on spray dilution, pesticide used and concentration,we created four variables that represent the pesticide dose: DRed (Dose of RED category),DYellow (Dose of YELLOW category), DBlue (Dose of BLUE category) and DGreen (Doseof GREEN category). We expected a positive sign for all the four variables. These variablestook the value zero for workers who were agricultural laborers or for applicators on non-applyingdays.
Duration of Exposure: This variable represents the total time taken for preparing the spray fluidand actual application by the pesticide applicator. For non-application days and for agriculturalworkers, this is the duration they engage in work. This variable is expected to have have apositive sign.
Temperature in degree Celsius: In tropical countries the temperature gradient during the sprayhas an influence both on the general health status of the worker as well as the decomposition ofthe chemical. We collected the maximum day temperature on the day of the spraying fromthe records maintained by the Rice Research Station, Alappuzha, which is the nearest stationrecording meteorological observation for the Kuttanad area. We expected a positive sign forthis variable.
Personal Habits: The primary data showed smoking and alcohol consumption as the key personalhabits that pose a health danger to farm workers. These two variables were included as twoseparate dummy variables and we expected a positive health risk to be associated with smokingand alcohol consumption.
Education: Education was expected to have a negative impact. The more educated people wereexpected to be at a lower risk owing to better awareness. The respondents were grouped intothree groups based on the education level— from 1 year of schooling upto 4 years, from 5years up to the 7 years and above 7 years . Two dummy variables were used to estimate theeffect of education on the probability of sickness. The first group (upto 4 years) was the defaultgroup and the next two, i.e. from 5 years to 7 years and above 7 years were taken as twodummy variables.

10 SANDEE Working Paper No. 20-07
In the initial part of the analyses, dummy variables were also included to control for the frequencyof visits made for data collection. But these did not have any significant influence and hence weredropped in the final regressions shown.
The dose-response function allows us to estimate predicted individual probabilities of sickness.The expected mean probability of sickness was then estimated for each group of pesticideapplicators on applying days, pesticide applicators while doing other type of work and agriculturallaborers.
Undertaking sensitivity analyses, the probabilities of sickness under four policy contexts for thefirst group were also estimated: a) the probability of sickness if there is a decline in dose of allchemicals by 10% from the current level; b) the probability of sickness if there is a decline in doseof all chemicals by 25% from the current level; c) the probability of sickness if there is a declinein dose of the most toxic chemical (Red) by 25% from the current level; d) the probability ofsickness if the most toxic chemicals (Red) are fully replaced by safe chemicals (Green).
4.2. The Cost of Illness
The next step of the analysis was to identify the monetary costs associated with sickness thatresulted from pesticide exposure. In general, estimation of economic value of health damages isundertaken using three major approaches (Wilson, 1998): Avertive / defensive expenditure method,cost-of-illness method and contingent valuation method.
The cost-of-illness method (COI) is perhaps the most widely used approach and involvesestimating the medical expenditure associated with illness, lost earnings due to lost work days or,value of productivity losses, the value of leisure hours lost, travel costs and special dietaryexpenses associated with medical treatment. Thus, the cost-of-illness estimates provide anaccount of the money spent in all direct and indirect aspects of illness, which includes the directprivate costs (medical expenses) and indirect costs (loss of work days due to poor health, timespent on seeking medical help and losses due to poor efficiency). However, a wide variation canbe observed in the literature in terms of what is considered under costs in COI studies. Forexample, Harrington and Portney (1987) takes only medical costs and wage loss into account,whereas Hodgson and Meiners (1982) includes transportation, special dietary costs,certain household expenses and certain property losses. In a more recent study, Maumbe andSwinton, (2003) exclude the travel and leisure time value as well as the cost of traditional andhome remedies.
This study followed the method adopted by Wilson (1998). The cost- of- illness estimates thusinclude the doctor’s fee, cost of medicines, laboratory expenses, transportation expenses (forthe applicator and companion), hospital fees, dietary expenses, and earnings from lost workdays (wages multiplied by time lost on account of sickness and time taken to travel to seekmedical help).
Cost-of-illness estimates are considered a lower bound of the actual costs incurred as the estimatedoes not include the social costs incurred (Drummond, 1992; Jefferson, et al., 1996; Wilson,2000). Apart from this, the estimate excludes the value of leisure time, disutility due to illness,

SANDEE Working Paper No. 20-07 11
losses due to poor work efficiency and productivity losses due to poor supervision or work inown farm.
Estimation of cost-of-illness in developing countries can pose several challenges. Poor countries,seeking medical help is rare among the low-income groups, unless the symptoms are very severe.If the symptoms are not acute, they are often neglected or home remedies are adopted, forexample, bathing in water boiled with neem or tulsi leaves. In this study, it was found that it waseasy to gather data when there was hospitalization or when the respondents sought formal medicalhelp. However, when the symptoms were not considered very serious, formal medical advicewas not sought and the respondents depended on self-medication or ‘over-the-counter’ medicinesthat are available without formal medical prescription. They also, adopted local practices (drinkingtender coconut water), or consulted local ayurvedic practitioners (vaidyas). In such cases, themarket value of the drugs/nutrition supplement and the opportunity cost of labor were imputed .In many cases, it was possible to obtain a clearer account of the expenses by talking to womenfolk in the house.
In this study, because of the high variability in the cost-of-illness, obtaining a simple averageestimate of the cost-of-illness (as is often done in similar studies) is not justified. Hence, basedon the medical advice, the health damages for each individual were categorized as as mild,moderate and severe. The average cost of illness (C) for each category is estimated as
(
=∑=
N
ij
MEC 1
……………….. (5)
Where,
jC is the average cost-of-illness in the j th group, with j = 1, 2, 3 reflecting mild, moderate and
severe symptomsME ij is medical expenditure incurred by the i th individual in the in the jth groupWij is the wage rate of i th individual in the j th group andTij is the work-time losttime unable to work of by the i th individual in the j th groupandNj is total number of times the respondents reported sick in j th group.
The overall cost of illness ore welfare loss (Wj) due to sickness for individuals in each group isgiven by group is:
= ∑
=
ˆ1
N
ijj PCW
j
………………(6)
Nj○ ○ ○ ○ ○ ○ ○ ○ ○ ○ ○ ○ ○ ○

12 SANDEE Working Paper No. 20-07
where,Wj is the welfare loss in j th groupCj is the average health cost in the j th groupP is the estimated probability of Y=1 in jth groupNj is total number of times the respondents reported sick
Finally, we estimated the welfare loss due to pesticide exposure as the difference between thewelfare loss of pesticide applicators during application days and that of the applicators duringnon-application days. We found that the estimated health cost for the two groups, applicators onnon-applying days and agricultural laborers, to be the same.
Further the analysis is extended to assess the welfare gain through four management options asexplained earlier.
5. Results
5.1. Dose response Function
The summary statistics of the variables used in the dose-response function and the results of theanalysis are furnished in Tables 5 and 6. The dose-response model, which was estimated toassess the influence of the independent variables on the probability of sickness confirmed most ofthe assumptions and the signs of the significant coefficients were as expected. The dose of red,yellow and blue category chemicals, smoking, Body Mass Index and education levels recordeda significant influence on the dependent variable.
The dose of the toxic chemicals (red, yellow and blue), which captures the dilution of spray fluidand the concentration of formulation, exerts a strong positive effect on the health risk. We haveobserved that a majority of the sprayings (70 %) used red and yellow category of the pesticidesand these have a significant effect on the probability of sickness. The safer dose (green) has aninsignificant effect.
Smokers are more likely to fall ill after spraying compared to non-smokers and smoking appearsto be more harmful than alcohol consumption. Alcohol consumption, which was expected tohave a positive effect on health damage, shows a negative sign. However this coefficient is notsignificant.
The more educated experience fewer chances of falling sick after spraying, apparently due tobetter care in handling the chemical. However, this is not reflected in the adoption of scientificprotection gadgets. None of the respondents used the recommended protective gears.
Lower values of the Body Mass Index reflect the health risks due to malnutrition whereas thehigher values reflect obesity problems. In our sample, the chances of the former are more likelythan that of the latter and hence an inverse relationship is expected between BMI and the probabilityof sickness. However, the coefficient on BMI has an unexpected positive sign and is significantat the 10% level. The effect of temperature is positive but not significant. Duration of exposureshows a negative sign and is contrary to expectations. However, since the coefficient is notsignificant, the perverse sign can be ignored.

SANDEE Working Paper No. 20-07 13
The expected predicted probabilities of illness estimated from the Probit model are presented inTable 7. The probability estimate for the applicator group (0.72) is significantly different statisticallyfrom that of the applicator group during the non-applying days (0.64) and from that of theagricultural labor group (0.63). The probability estimates in the latter two cases are the same. Areduction in dose of all chemicals by 10% or a 25% reduction in the dose of the most toxicchemical (red) yields the same effect, reducing the probability of sickness during application daysto 0.61. This probability reduces to 0.56 if all chemical doses are reduced by 25 %. Hence, ifpeople can be persuaded to substitute the safest chemical for the most toxic, the probability offalling sick as a result of exposure is again 0.64, which is identical to the probability of falling sickwhen not exposed.
5.2. The Welfare Loss
The adaptive response to sickness by exposure to pesticides varies depending upon the severityof the symptom and its type. The general practice, when the symptoms are mild, is to resort tohome remedies and to depend on self-medication of common allopathic drugs and rest. However,when the symptoms are moderate, physicians are formally consulted and their advice followed.When the symptoms are severe, workers are often admitted to hospital. The estimated averagehealth cost for the sample is presented in T able 7. The welfare losses recorded in this Tablereflect the costs of illness as well as the probability of falling sick.
Table 7 indicates that the health costs for the applicators during both non- applying days andagricultural laborers days are the same (Rs.33 per day ). Health costs for applicators are Rs. 41per day. The difference, (Rs.38 (US$ 0.86),) is the cost due to pesticide exposure. Thisamounts to 24 % of the average daily earnings from pesticide application. Health costs associatedwith other types of work amount to only 1.5% of their average daily earnings. Assuming 42spraying days per year, the average annual welfare loss to an applicator from pesticide exposureamounts to Rs.1596 (US$ 36) per applicator.
The total population of farm workers in Kerala is reported to be16,53,601 (according to the2001 Census) of which 11,03,317 are males. Only male workers undertake pesticide applicationwork. On the basis of this data, we could make the modest assumption that 10% of these maleworkers undertake pesticide application work and that the average spraying work days of aworker is 42 days per year. This would lead us to estimate that the welfare loss from total acutehealth damages from pesticide exposure is Rs 18 crores per year.
Our study results reinforce findings from other pesticide exposure studies. For example, Wilson(2002), following the cost-of-illness approach, estimated that a farmer in Sri Lanka on an averageincurs a cost equal to a month’s income every year due to exposure to pesticides. In our study,the annual welfare loss is equal to half a month’s income per year .(Assuming: 42 days ofspraying and 156 days of other work). In the Philippines, the health cost of farmers exposed topesticides is reported to be 61% higher than that of unexposed farmers (Pingali, et al., 1995). Inour study, this difference is much higher. It is 14 times more than that for those not exposed. Ourfindings are also rather high compared to some recent estimates from Nepal (Atreya,2007).This can be attributed to the generally high level of insecticide use in Kuttanad (more of organo-phosphates) compared to fungicides, the high temperature gradient, the longer work hours, thehigher wages and the higher expense associated with medical care.

14 SANDEE Working Paper No. 20-07
Through effective awareness creation programs or other policy measures , it is possible to reducethe concentration of spray fluid from the current level by 10%, which would reduce the thewelfare loss by 16%. The same effect can be generated by a concerted effort to reduce the doseof the most toxic category of chemicals (red) by 25%. If this is completely replaced by thesafest pesticides, the loss can be reduced by 13%. Dose reduction can be achieved either throughrestricting the quantity of formulation or by merely increasing the dilution of the spray fluid viamore water. In our sample, the quantity of water used was observed to be much below therecommended level while the quantity of chemicals used was above the scientifically recommendedlevels by 17-233%. An extension strategy focusing on this aspect alone would result in animprovement in the health of the applicator without incurring any additional private cost. Oneway of achieving this is through the targeted training of pesticide applicators. Our study indicatesthat none of the applicators have had any scientific training in pesticide handling and use. Thestudy also revealed that they had wrong perceptions about the toxicity of the pesticides theyhandled.
6. Conclusions
Occupational exposure to pesticides is very common among workers in the agricultural sector indeveloping countries. Our study suggests that pesticide use is often unscientific at all levels ofuse—from the selection of chemicals and handling practices to averting behavior. This results inhealth damages to the extent of Rs 38 per day (US$ 0.86) per individual. These costs can alsobe reduced by improving the spray fluid dilution, that is, by either using more water or going forsafer chemicals at a lesser quantity, or a combination of both. We note that these costs are aconservative estimate because they do not take into account long-term chronic illnesses, publicexpenditure on health care and are only based on self-reported symptoms.
Our study shows that any program with a Rs 18 crores investment for improving the welfare ofthis group of farm workers can be economically justified. Just as the State Factories and BoilersDepartment assures the safety and health of industrial workers handling hazardous materials inthe case of industries, the State Department of Agriculture could initiate programs with a similarobjective. The existing welfare fund board for agricultural laborers could also institute a specialcomponent for pesticide applicators.
Support could be provided by imparting training in safe-handling of pesticides and adoption ofscientific dose, subsidized supply of protective gear, and awareness-creation programs.
A labor bank of trained pesticide applicators could be maintained in each panchayat which canserve the farm sector in a better and more efficient manner while minimizing welfare losses.Simultaneously, insurance protection measures for pesticide applicators could be introduced.Insurance companies could use the results of this and other studies for estimating the premium.The state could also bear a part of the premium as the social savings accrued by way of healthdamages avoided.

SANDEE Working Paper No. 20-07 15
7. Acknowledgements
I acknowledge with gratitude the excellent support provided by Dr Priya Shyamsunder,Professor Enamul Haque and Professor M N Murty during all stages of the project implementation.The support provided by the research team (Srilakshmi, Geevar, Jishamol and Remya) toorequires special mention. I thank Dr. S. Madheswaran and Dr. K. R. Shanmugam for theirhelp with the statistical analysis. Above all, I gratefully acknowledge the financial and logisticssupport extended by SANDEE without which this research would not have been possible.

16 SANDEE Working Paper No. 20-07
References
Antle, John M and P L Pingali (1994), “Pesticides, Productivity, and Farmer Health: A PhilippineCase Study,” American Journal of Agricultural Economics, 76 (3): 418-430.
Antle, J M, D C Cole and C C Crissman (1998), “Further Evidence on Pesticides, Productivityand Farmer Health: Potato Production in Ecuador,” Agricultural Economics, 18: 199-207.
Aravindan, K P (ed) (2006), Kerala Padanam (A Study of Kerala), Kerala, Kerala ShastraSahitya Parishad, 203.
Atreya, K (2007), “Pesticide Use in Nepal: Understanding Health Costs from Short-TermExposure,” SANDEE Draft Manuscript. Kathmandu, Nepal.
Bhatnagar, V K (2001), “Pesticide Pollution Trends and Perspectives,” I C M R Bulletin, 31(9): 87-88.
Brahmaprakash, G P and N Sethunathan (1987), “Relative Persistence of Hexachloro CycloHexane, Methyl Parathion and Carbofuran in an Alluvial Soil under Flooded and Non-floodedConditions,” Agricultural Economics, 30: 71-80.
Cole, D C, F Carpio, J Julian and N Leon (1998), “Economic Burden of Illness from PesticidePoisonings in Highland Ecuador,” Pan American Review of Public Health, 8(3): 196-201.
Crissman, C C, J M Antle and S M Capalbo (1998), “Economics, Environmental and HealthTrade-offs in Agriculture: Pesticides and the Sustainability of Andean Potato Production,”International Potato Centre, Dordrecht: Kluwer Academic Publishers.
Cropper, M L and A M Freeman (1991), “Environmental Health Effects,” Measuring the Demandfor Environmental Quality, Ed. J B Braden and C D Kolstand, North Holland: Elsevier SciencePublishers.
Dinham, B (1993), The Pesticide Hazard: A Global Health and Environmental Audit, London:Zed Books.
Dasguptha, P (2004), “Valuing Health Damage from Water Pollution in Urban Delhi, India: AHealth Production Function Approach. Environment and Development Economics, 9(1): 83-106.
Dasgupta, S, N Mamingi and C Meisner (2001), “Pesticide Use in Brazil in the Era of AgroIndustrialization and Globalization,” Environment and Development Economics, 6 (4):459-482.
Dasgupta, S, C Meisner, D Wheeler, N T Lam, and K Xuyen (2005), “Pesticide Poisoning ofFarm Workers: Implication of Blood Test Results from Vietnam,” Policy Research WorkingPaper, 3624, Washington, DC: World Bank.

SANDEE Working Paper No. 20-07 17
Down to Earth (2001), “Editorial,” 9(19): 28-35.
Drummond, M F (1992), “Cost-of-illness Studies—A major headache,” Pharmacoeconomics,2 (1): 1-4.
Forget, G (1991), “Pesticides and the Third World,” Journal of Toxicology and EnvironmentalHealth, 32: 11-13.
Freeman III, M A (2003), The Measurement of Environmental and Resource Values—Theoryand Methods, 2nd Edition, Washington: Resources for Future.
Hodgson,T.A and Meiners,M.(1982)Cost of illness methodology:A guide to current practicesand procedures.Milbank Memorial Fund QuarterlyHealth and Society (Summer)pp.429-62.Gangamma, G N and B S Satyanarayana (1991), “Danger Posed by Pesticides,” SpiceIndia, 32(9): 7-9.
Gujarati, N D (2004), Basic Econometrics, 4 th Edition, New Delhi: Tata Mc Graw-Hill.
Harrington,W and P R Portney (1987), Valuing the Benefits of Health and Safety Regulations,Journal of Urban Economics, 221): 101-112.
Hodgson, T A and M Meiners (1982), “Cost of Illness Methodology: A Guide to Current Practicesand Procedures,” Health and Society, Milbank Memorial Fund Quarterly (Summer): 429-62.
Huang, J, F Qiao, L Zhang and S Rozelle (2001), “Farm Pesticides, Rice Production and HumanHealth in China,” Research Report, Singapore: Economy and Environment Program for SouthEast Asia, p.56.
Jalan, J, E Somanathan, S Chowdhari (2003), “Awareness and the Demand for EnvironmentalQuality: Drinking Water in Urban India,” SANDEE Working Paper No. 4-03, Katmandu, Nepal.
Jefferson, T, V Demicheli and M Mugford (1996), “Cost-of-Illness Studies,” ElementaryEconomic Evaluation in Health Care, London: BMJ Publishing Group, pp 17-29Jeyaretnam, J (1990), “Acute Pesticide Poisoning: A Major Global Health Problem,” WorldHealth Quarterly, 43(3): 139-144.
Jeyaratnam, J, K C Luw and W O Phoon (1987), “Survey of Acute Pesticide Poisoning amongAgricultural Workers in Four Asian Countries,” Bulletin of the World Health Organization,65(4): 521-527.
Krishna, Vijesh V (2001), “Sustainability and Economic Efficiency of Agro-Ecological ProblemArea Zone of Kerala,” M Sc Thesis (Unpublished), University of Agricultural Sciences, Bangalore,India.
Kishi, M, N Hirschhorn, M Djajadisastra, L N Satterlee, S Strowman, and R Dilts (1995),“Relationship of Pesticides Spraying to Sign and Symptoms in Indonesian Farmers,”

18 SANDEE Working Paper No. 20-07
Scandinavian Journal of Work, Environment and Health, 21: 124-133.
Maumbe, B M , M S Swinton (2003), “Hidden Health Costs of Pesticide Use in Zimbabwe’sSmall Holder Cotton Growers,” Social Science and Medicine, 57: 1559-1571.
Mencher, J P (1991), “Agricultural Labor and Pesticides in Rice Regions of India: Some HealthConsiderations,” Economic and Political Weekly, 26 (39): 2263-2268.Naidu, N A, J Neela and P N Rao (1991), “Maternal body mass index and birth weight,”Nutrition News, 12.2:Ngowi, A V (2002), “Health Impact of Exposure to Pesticides in Agriculture in Tanzania,” Ph DDissertation Submitted to the Faculty of Medicine of the University of Tampere, Tampere, Finland.
Pimentel, D (1992), “Environment and Human Cost of Pesticides Use,” Bioscience, 42: 740-760.
Pingali, P L, C B Marquez, F G Palis and A C Rola (1995), “The Impact of Pesticides onFarmers Health: A Medical and Economic Analysis in the Philippines,” Impact of Pesticides onFarmer Health and the Rice Environment, Ed. P L Pingali and P A Roger, Philippines:International Rice Research Institute (IRRI).
Puri, S N (1998), “Present Status of Integrated Pest Management in India,” Paper presented atthe Seminar on Integrated Pest Management, Bangkok: Asian Productivity Organization at ThailandProductivity Institute.
Rakhesh, D (1999), “Economic Analysis of Externalities in the Estuarine Ecosystem ofKuttanad in Kerala,” M Sc Thesis (Unpublished), University of Agricultural Sciences, Bangalore,India.
Rola, A C and P L Pingali (1993), “Pesticides, Rice Productivity, and Farmers’ Health: An EconomicAssessment”, Is this a Discussion/Working Paper? Include number too. Philippines: InternationalRice Research Institute and Washington, DC: World Resources Institute.
Rajendran, S (2003), “Environment and Health Aspects of Pesticides Use in Indian Agriculture,”Proceedings of the Third International Conference on Environment and Health, Ed. MartinJ Bunch, V Madha Suresh and T Vasantha Kumaran, Chennai, India: 353-373.
Rosenstock, L, M Keifer, W E Daniell, R McConnell and K Claypoole (1991), “Chronic CentralNervous System Effects of Acute Organophosphate Pesticide Intoxication,” Lancet, 338: 223-227.
Sivayoganathan, C, S Gnanachandran and J Lewis (1995), “Protective Measures Use andSymptoms among Agro Pesticide Applicators in Sri Lanka,” Social Science and Medicine, 40:431-436.
Thippaiah, P and R S Deshpande (1999), The Reform of Subsidy Regime in respect of allAgricultural Implements and Machinery including Drip and Sprinkler Irrigation, Bangalore:ADRT Unit, Institute for Social and Economic Change, Bangalore, India.

SANDEE Working Paper No. 20-07 19
World Resources Institute, UNEP, UNDP, World Bank (1998), Environmental Change andHuman Health, World Resources 1998-1999.W H O (1990), Public Health Impact of Pesticides used in Agriculture, Geneva: WorldHealth Organization.
Wilson, C (1998), “Cost and Policy Implications of Agricultural Pollution with special referenceto Pesticides,” PhD Thesis submitted to the Department of Economics, University of St Andrews,Scotland .
Wilson, C (2000), “, “Environmental and Human Costs of Commercial Agricultural Productionin South Asia,” International Journal of Social Economics, 27: 816-846.
Wilson, C (2002), “Private Cost and the Relation between Pesticide Exposure and Ill Health:Evidence from Sri Lanka,” Environmental Economic and Policy Studies, 5(3): 213-227.

20 SANDEE Working Paper No. 20-07
1 Age (years) 45 23 70 - - - 50 30 70
2 Education* 2.26 1 4 - - - 1.39 1 4
3 Body Mass Index 21.72 15.57 30.61 - - - 22.93 16.36 28.01
4 Duration of Work(hrs/day)a) Agricultural 2.18 0.5 5 6.3 1.5 8 5.7 2 9
Workb) Non Agrl. Work - - - 3.84 1 8 5.29 3 8
5 Wages (Rs/hour)a) Agricultural 73 20 200 30 14 107 30 13 125
Workb) Non Agricultural - - - 52 17 125 36 25 87.5
Work
6 Average earningsper day (Rs/hr)a) Agricultural Work 159 10 1000 192 21 856 170 27 1125b) Non Agricultural - - - 198 17 1000 192 75 700
Work
Table 1: Socio-Economic Profile of the Respondents
mean min max mean min max mean min max
SlNo.
DescriptionPesticide Applicators
Applicators Duringnon-applying days Agricultural Labor
*up to 4 years schooling =1, up to 7 years schooling = 2, up to and above 10 years schooling =3
Tables

SANDEE Working Paper No. 20-07 21
Table 2: Pesticides in Rice Production in Kuttanad
SLNo.
Tradename
ActiveIngredient
ChemicalGroup
Excess(%)
RecommendedDosage /per ha
Averagelevel of
application
Insecticide
1 Asataf Acephate O P 800 gm 1467 83.38
2 Ambush Synth.Pyrethroid SP 250 gm 553 121.20
3 Atom Imidaclorprid Neonicotinyles 150 ml 500 233.33
4 Dimecron Phosmamidon O P 250 ml 605 142.00
5 Ekalux Quinalphos O P 750 ml 1073 43.07
6 Hostathion Triazaphos O P 625 ml 878 40.48
7 Karate Lamdacyhalothrin SP 625 ml 1648 163.68
8 kargill 400 Hostathion O P 625 ml 1440 130.40
9 Lanite Acephate OC 800 ml 1482 85.25
10 Lindane BHC OC 2000 gm 2933 46.65
11 Malathion Mercaptothion O P 1000 ml 1527 52.70
12 Metacid Methyl parathion O P 500 ml 773 54.60
13 Monocrotophos Monocrotophos O P 600 ml 1535 155.83
14 Nuvacron Monocrotophos O P 600 ml 769 28.16
15 Rogor Dimethoate O P 1000 ml 1235 23.50
16 Sevin Carbaryl Carbamate 2000 gm 4199 109.95
17 Tatamida Imidachlorprid Neonicotinyles 150 ml 367 144.67
18 Tatareeva Lamdacyhalothrin SP 625 ml 1180 88.80
19 Trebone Ethophenprox SP 1500 ml 2109 40.60
Weedicide
20 2,4-D Fernoxone Phenoxy 1200 gm 680 -43.33
21 Almix Metsulfuron methyl Alkanoics
and Chlorimuron Sulphonyl Ureas 20 gm 62 210.00ethyl
22 Clincher Cyhalofop butyl Phenoxy 1000 ml 1342 34.20Alkanoics
Fungicide
23 Contaf Hexaconazol Triazole 800 ml 940 17.50
24 Bavistin Carbendazim Carbamate 500 gm 617 23.40
25 Hinosan Edephenphos O P 500 ml 869 73.80
26 Kitazin Kitazin O P 500 ml 765 53.00
OP- Organo Phosphates, OC-Organo Chlorines, SP- Synthetic Pyrethroids

22 SANDEE Working Paper No. 20-07
1. Eye irritation 147 2 3
2. Nausea 66 1 15
3 Giddiness 29 2 3
4. Breathing problems 87 5 3
5. Fever 20 9 2
6 Dehydration 5 0 0
7 Vomiting 40 0 0
8 Cramps 29 3 0
9 Itching 228 5 2
10 Convulsions 24 0 0
11 Burning sensation 51 0 1
12 Hives 134 13 2
13 Diarrhea 11 0 0
14 Excessive salivation 6 0 1
15 Vision problems 6 0 0
16 Tremor 11 0 0
17 Others 11 55 0
18 No symptom 239 117 69
19 Total sample 1135 212 101
Table 3: Health Symptoms as a Result of Pesticide Exposure (No. of cases)
Sl.No Type of sicknessPesticide applicators
during applyingdays
Pesticide applicatorsduring non-
applying days
Agriculturallabors

SANDEE Working Paper No. 20-07 23
Table 4: Dose Response Function and Determinants of Health Damage
Sl.No Variables Expansion Description Expected Sign
0= Not Sick1=Sick
,, +
,, +
,, +
Duration of work (mts) for all category +
Maximum Day temperature in the area +
0 = if non Smoker +1 = Smoker
0 = no consumption +1 = if consumption
Wt / Ht2 X 100 ?
From 5 years of schooling to 7 years -schooling
above 7 years of schooling -
Age in years +
Quantity of thepesticide applied
Quantity of water
Concentrationof the pesticide
formulationx
1 Y Sick or Not Sick
1 DRed DOSE of REDcategory chemical
2. DYellow DOSE of Yellowcategory chemical
3. DBlue DOSE of Bluecategory chemical
4. DGreen DOSE of Greencategory chemical
5. DUR Duration of exposure
6 TEMP Temperature (degreeCelsius)
7 SMOKE Smoking habits
8 ALCO Alcoholconsumption (0,1)
9 BMI Body Mass Index
10 EDU1 Education level
11 EDU2 ,,
12 AGE Age
Dependent Variables
Independent Variables
NA

24 SANDEE Working Paper No. 20-07
SL No. Variables Mean Min Max
1 Y .7048 0.00 1.00
2 DRed 61.05 0.00 1000.00
3 DYellow 131.73 0.00 1700.00
4 DBlue 140.47 0.00 1950.00
5 DGreen 1.18 0.00 125.00
6 DUR 284 30.00 540.00
7 TEMP 33.36 29.00 34.60
8 SMOKE 0.53 0.00 1.00
9 ALCO 0.23 0.00 1.00
10 BMI 21.83 15.81 30.61
11 EDU1 0.32 0.00 1.00
12 EDU2 0.02 0.00 1.00
Table 5: Summary Statistics of Variables used in the Dose-Response Function
Variables Coefficient Marginal Effect
Const -1.848698 (-1.13) -0.622529
DR .001423894*** (5.944) 0.000480
DY .0004482059*** (3.613) 0.000151
DB .0005624209*** (5.429) 0.000189
DG .001473520 (0.333) 0.000496
DUR -0.0005954632 (-1.488) -0.000201
TEMP 0.04112364 (0.869) 0.013848
SMOK 0.4181616*** (5.229) 0.140811
ALCO -0.06032019 (-0.642) - 0.020312
BMI 0.03076513 * (1.663) 0.010360
EDU1 0.09592683 (1.101) 0.032302
EDU2 -0.5834437*** (-2.344) -0.1964684
No. of observation 1448 -
Log Likelihood function -823.0797 -
Restricted Log function -879.7414 -
Chi square 113.3234 -
Table 6: Binomial Probit Estimates of Determinants of Health Damage
***significant at 1% level* significant at 10% level(Figures in brackets are ‘t’ values)

SANDEE Working Paper No. 20-07 25
Tabl
e 7:
Ave
rage
Hea
lth
Cos
t of P
esti
cide
Exp
osur
e
Sl.
No
Des
crip
tion
Est
imat
ion
deta
ils
App
l. N
onap
plyi
ngda
ys
App
licat
orA
pply
ing
Day
sA
pplic
ator
on
App
lyin
g D
ays
Avg
. AL
LD
oses
decr
ease
dby
10%
Avg
. AL
LD
oses
decr
ease
dby
25%
Avg
. RE
DD
ose
decr
ease
d by
25
%
Avg
. RE
D D
ose
repl
aced
by G
RE
EN
Dos
e
12
34
56
78
9
1P
roba
bili
ties
of i
llne
ss p
er d
ay
2.A
vera
ge h
ealt
h co
st (
MC
)per
epi
sode
of
illne
ss(R
s)
3.A
vera
ge e
xpec
ted
heal
th c
ost p
er e
vent
of s
pray
/ w
ork
(Rs)
4H
ealt
h co
st d
ue t
o pe
stic
ide
expo
sure
(Rs.
)
5To
tal e
xpec
ted
heal
th c
ost p
erap
plic
ator
per
yea
r@42
spr
ayin
gda
ys(R
s)
Fro
m th
e do
sere
spon
se f
unct
ion
- Row
1 x
Row
2
Col
.5-c
ol4
Row
4 x
42
0.64
0.72
0.61
0.56
0.61
0.64
4.00
57-
--
-
3.00
4135
3235
36
-38
3229
3233
-15
9613
4412
1813
4413
86

26 SANDEE Working Paper No. 20-07
Sl.No. BMI Class Presumptive Diagnosis
1 < 16.0 CED GRADE 2
2 16.0 – 17.0 CED GRADE 3
3 17.0 –- 18.5 CED GRADE 1
4 18.5 –-20.0 LOW WEIGHT
5 20.0 –-25.0 NORMAL
6 25.0 –-30.0 OBESE GRADE1
7 > 30.0 OBESE GRADE 2
APPENDIX A
Presumptive Diagnosis of Health Index Values
Source: Naidu, et al., (1991)

SANDEE Working Paper No. 20-07 27
APPENDIX B
PESTICIDE USE IN RICE PRODUCTION AND HUMAN HEALTH—A STUDY IN KERALA
Department of Agricultural EconomicsCollege of Horticulture
Kerala Agricultural University POThrissur 680 656, Kerala
MAIN SURVEY QUESTIONNAIRE
CODE: .................................................. DATE: ..................................................
Name & Address of the Respondent (contact information) :(give contact Tel. No./land mark)
Name of Padasekharam :
Total Area of Padasekharam :
1. GEOGRAPHIC INFORMATION
Sl.No Particulars Details
1 Village (Name, Ward)
2 Panchayat
3 Block
4 Taluk
5 District
7 Level of Pesticide Use (High, Medium, Low)
2. HOUSEHOLD INFORMATION
* self=1, spouse of head=2, married child=3, spouse of married child=4, unmarried child=5, grandchild=6, father/mother/in-laws=7, brother/sister/brother-in-law/sis-in-law/other relatives=8, servants/other non-relatives=9
*** 1=Farming, 2=Service, 3=Others.Others include petty works, construction sector, and other site-specific jobs
** 1. years in schooling: 4yrs; 2. years of schooling: 7 yrs; 3. years of schooling: 10 yrs; 4. pre-degree; 5.graduate; 6. post-graduate; 7. technical education / diploma.
Sl.No. * Family Members Sex Age(yrs) ***Education ***Occupation
Total
28 SANDEE Working Paper No. 20-07
What is the value if yousell it today(This questioncorresponds to the market
for second hand goods in the rural area.)
3. Please ask about the property (durable goods) that the respondent has in his/herhome
1 House along withhomestead
2 Livestock
3 Television
4 Radio
5 Bicycle
6 Motor cycle
7 Phone
8 Boats
9 Improved toilet
10 Biogas stove
11 Other pieces of landif any
SN Durable goodsSpecification if any(E.g., Mention thetype of livestock)
YES =1 orNO = 2
Number
1 Rice
2 Coconut
3 Arecanut
4 Vegetables (specify)
5 Others
4. Farm Information (This information is to assess the income from farm)
Sl.No
CropsPrice per Kg or No
Production(Kg/Year)
Season1 2 3*ownership Area
(Ha)
1. Area Owned 2. Area Leased in 3. Area Leased out

SANDEE Working Paper No. 20-07 29
5. Employment Details of the Respondent
1
2
3
4
Season(specify months)
No. of days ofwork/week
Duration ofwork /day (Hrs)
Averagewage rateType of workSl.
No:

30 SANDEE Working Paper No. 20-07
APPENDIX C
Field Diary for Data Collection in the Project “Pesticide Use in Rice Production andHuman Heath—A Study in Kerala”
South Asian Network for Development and Environmental Economics (SANDEE)Kerala Agricultural University
Date: ............................... Day: ....................... Name of data collector: ..............................
Name of Applicator: .......................................... Code No: ..................................................
Table 1: Pesticide use in Rice in the summer crop
It will cover all the pesticide application work he has done during the crop season in differentfields and the details thereof. The application no. corresponds to each application done by therespondent during that particular day
# 1. rice stem borer, 2. gall midge, 3. rice bug, 4. leaf folder, 5. BPH, 6. rice case worm, 7. rice swarmingcaterpillar, 8. rice hopper, 9. rice thrips, 10. whorl maggots, 11. leaf hopper, 12. rice mealy bug,13. rice root nematode, 14. rice cyst nematode, 15. blast, 16. brown spot, 17. narrow brown leaf spot,18. sheath blight, 19. stalk burn, 20. leaf scald, 21. BLB, 22. black leaf steak, 23. foot rot, 24. sheathrot, 25. viral disease, 26. tungro, 27. yellow dwarf. 28. grassery stunt, 29. ragger stunt, 30. false smut,31. udbatta, 32. Others (specify), 33. Prophylactic
##1. 2,4,D, 2. dimecran, 3. ekulex, 4. metacid, 5. nuvacron, 6. bavistin, 7. hinosan, 8. Others (specify)### 1=low, 2=medium, 3=high.
1
2
3
4
5
6
Who purchasedApplicator=1
Owner=2Others=3.
Cost(Rs)
Rs /Unit
Unitvalue
ApplicationNo:
Qty.purchased
(ml)
Source of purchaseCoop.soc=1
Private Dealer=2Others=3 Qty
Perceivedtoxicity
###
Pesticideused##
Type ofinfestation
#
OwnershipOwn=1
Hired=2
Variety ofpaddyTrad.Var=1
HYV=2
Areacovered
Period/crop stage
(Daysafter
planting)

SANDEE Working Paper No. 20-07 31
1
2
3
4
5
6
Table 2: Spraying Details
**Mix in a separate container and pour to the sprayer 2. Mix in the sprayer itself
Applicationno.
Type of sprayerType capacity (lt)
Source of sprayerHired=1Oowned=2
If hired,charge (Rs)
Time spent onpreparing
(Hrs)
Amt. ofwater used
(lit.)
Sourceo f
water
Method ofmixing**
Qty ofpesticide used
(ml.)
Table: 2 continued ...
* For mixing only=1, For spraying only=2, For both=
Applicationno.
Any one to assist youY=1 , N=0
If YType ofassistance*
Duration ofspray(hrs)
Wage receivedValue of wage in kind for
Appli/assistant (Rs)
Appl. Asst. Appl. Asst.
1
2
3
4
5
6
Table 3: Mitigating Behavior
Applicationno.
Did you use any protection gearY=1 , N=0
If yes, specifythe type#
Source Free-1,Purchased-2
If cost of that item
Year of purchase Cost
1
2
3
4
5
6
# 0=nothing; 1=leg care: boots/shoes/others, 2=Head cover: hat, helmet, others, 3=eye-care: glasses,others, 4=body cover: full sleeved shirt, others, 5=hand care: gloves, others, 6=face care: mask,others, 7=Leg care: Full length trousers, dhoti, others, 8= Others (specify)

32 SANDEE Working Paper No. 20-07
Table 4: Health Effects
Applicationno.
Did you feel anydiscomfort after your
spraying Y=1,N=2If 1, Specifythe type *
How long didthe symptom
last (hrs)
Did you adoptany treatment
for that ?Yes-1, No-2
If yes,system ofmedicine #
Whetherhospitalized ornot. If yes, no.
of days
Medical Expenses
Hospitalexpenses
Doctor’sfee Medicines
Lab.Tests
1
2
3
4
5
6
Table 5a: Health Cost
1
2
3
4
5
6
Estimatedloss
Applicationno.
Related travelingexpenses
Relateddietary
expenses
Loss of workdays
Substitution by familylabor and loss of time in
his/her work
Income lostdue to this
Approx: cropdamage due to
lack of supervisionspecify
Others ifany, specify
* 1. Eye irritation, 2. Nausea, 3.Giddiness, 4. Shortness of breath, 5. Fever, 6.Dehydration, 7.Vomitting,8.Cramps, 9.Itching, 10. Convulsion, 11. Burnt feel, 12. Skin irritation, 13. Diarrhea, 14. Excessivesalivation, 15.Blurred vision, 16.Tremor, 17. Others
# 1. Allopathic, 2.Ayurvedic, 3.Siddha, 4.Unani, 5. Home Remedies
Table 5 b: Health cost, if system of Home Remedies
Material used Fuel for cooking Market price Time spent on Total cost Local vaidyan’spreparing fee if any

SANDEE Working Paper No. 20-07 33
APPENDIX D
Field Diary for Data Collection in the Project “Pesticide Use in Rice Production andHuman Heath—A Study in Kerala”
South Asian Network for Development and Environmental Economics (SANDEE)
Kerala Agricultural University
(For applicators when they are engaged in other work, NOT spraying)
Name of Field Assistant
Part I
Name:
Address:
Location:
Code no:
PART II
Date Type of work Duration (hrs) Wages(Rs)
Table 1: Employment Details

34 SANDEE Working Paper No. 20-07
* 1.Eye irritation, 2. Nausea, 3. Giddiness, 4. Shortness of breath, 5. Fever, 6. Dehydration, 7.Vomitting,8.Cramps, 9. Itching, 10. Convulsion, 11.Burnt feel, 12. Skin irritation, 13. Diarrhea, 14. Excessivesalivation, 15. Blurred vision, 16. Tremor, 17. Others
# 1. Allopathic, 2. Ayurvedic, 3. Siddha, 4. Unani, 5. Home Remedies
Table 2: Health Effects
DateDid you feel anydiscomfort after
your sprayingY=1,N=2
If 1,Specify
the type *
How long didthe symptom
last (hrs)
Did you adoptany treatment
for that ?Yes-1, No-2
If yes,system of
medicine #
Whetherhospitalizedor not. If yes,no. of days
Medical Expenses
Hospitalexpenses
Doctor’sfee
medicines Lab.Tests
Table 3: Health Cost
DateRelated
travelingexpenses
Relateddietary
expenses
Loss ofwork days
Substitution by familylabor and loss of
time in his/her work
Income lostdue to this
Approx: cropdamage due to
lack of supervisionspecify
Estimatedloss
Others ifany, specify

SANDEE Working Paper No. 20-07 35
Table 4:
Health cost, if system of Home Remedies
Materialused
Fuel forcooking
Marketprice
Time spent onpreparing
Total cost Local vaidyan’sfee if any
36 SANDEE Working Paper No. 20-07
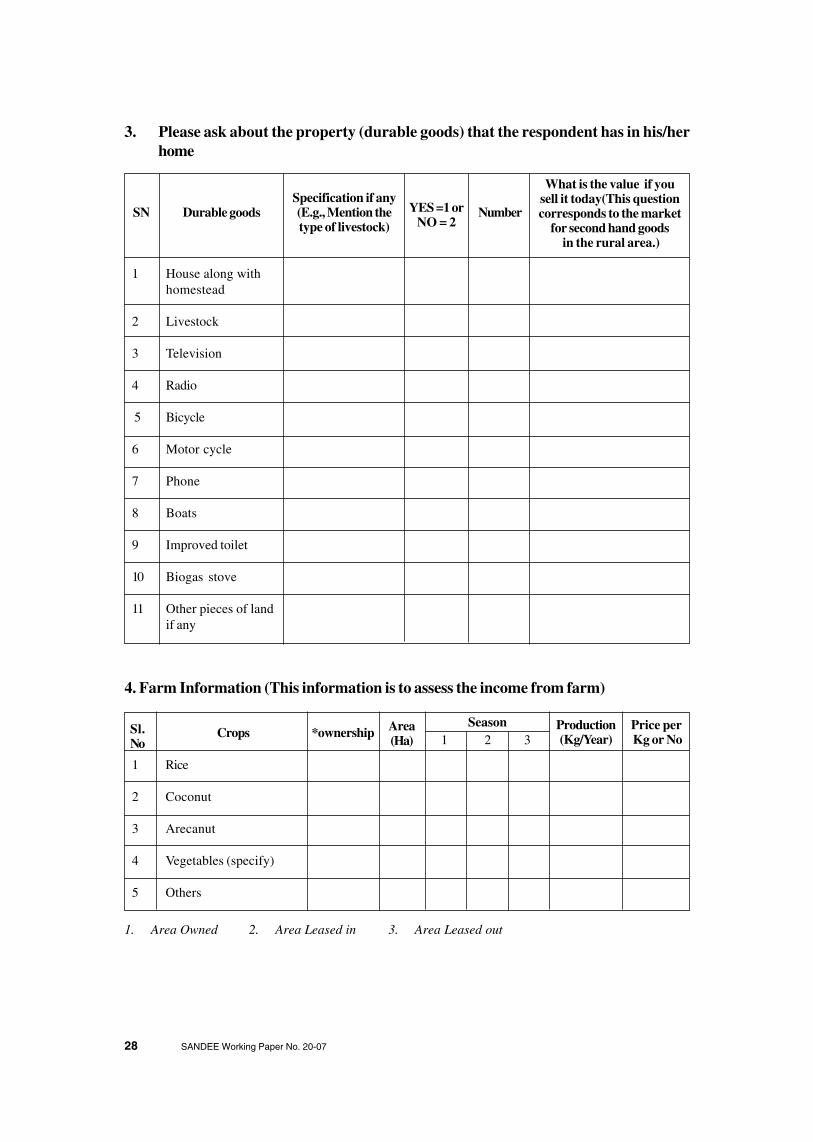
APPENDIX E
Field Diary for Data Collection in the Project “Pesticide Use in Rice Production andHuman Heath—A Study in Kerala”
South Asian Network for Development and Environmental Economics (SANDEE)Kerala Agricultural University
(Questionnaire for Data Collection from Agricultural laborers )
Part I Name of Field Assistant:
Name:
Address:
Location:
Code no:
Part II
Date Type of work Duration (hrs) Wages(Rs)
Table 1: Employment Details

SANDEE Working Paper No. 20-07 37
* 1.Eye irritation, 2. Nausea, 3. Giddiness, 4. Shortness of breath, 5. Fever, 6. Dehydration, 7.Vomitting,8.Cramps, 9. Itching, 10. Convulsion, 11.Burnt feel, 12. Skin irritation, 13. Diarrhea, 14. Excessivesalivation, 15. Blurred vision, 16. Tremor, 17. Others
# 1. Allopathic, 2. Ayurvedic, 3. Siddha, 4. Unani, 5. Home Remedies
Table 2: Health Effects
DateDid you feel anydiscomfort after
your sprayingY=1, N=2
If 1,Specify
the type *
How long didthe symptom
last (hrs)
Did you adoptany treatment
for that ?Yes-1, No-2
If yes,system of
medicine #
Whetherhospitalizedor not. If yes,no. of days
Medical Expenses
Hospitalexpenses
Doctor’sfee
medicines Lab.Tests
Table 3: Health Cost
DateRelated
travelingexpenses
Relateddietary
expenses
Loss ofwork days
Substitution by familylabor and loss of
time in his/her work
Income lostdue to this
Approx: cropdamage due to
lack of supervisionspecify
Estimatedloss
Others ifany, specify

38 SANDEE Working Paper No. 20-07
Table 4:
Health cost, if system of Home Remedies
Materialused
Fuel forcooking
Marketprice
Time spent onpreparing
Total cost Local vaidyan’sfee if any

SANDEE Working Paper No. 20-07 39
���
�����
��
���
��
��
�
�����
�����
�����
�����
�����
�����
�����
�����
���������
���������
���������
���������
���������
���������
���������
���������
���������
���������
���������
���������
���������
���������
���������
���������
���������
���������
����
Fig 1: Pesticide consumption pattern in India
Fig 2: Consumption of Pesticides in Kerala (tonnes)
���
��
������������� �!
�
���
���
���
���
����
����
����
����
����
���
����
�����
�����
�����
�����
�����
�����
�����
�����
�����
����
����
�
����
����
�
FIGURES

40 SANDEE Working Paper No. 20-07
Fig 3: Area covered by Pesticides in Kerala (lakh ha)
Fig 4: Intensity of use in Kerala (Kg/ha)
����
���
����
�
�
��
��
��
�������
�����
�����
�����
�����
�����
�����
�����
�����
�����
���������
���������
"��������������� #$%&�!
���
����
�
�'�
�
�'�
�
�'�
�
�'�
�������
�����
�����
�����
�����
�����
�����
�����
�����
�����
���������
���������
"��������������� #$%&�!
���
����
�
�'�
�
�'�
�
�'�
�
�'�
�������
�����
�����
�����
�����
�����
�����
�����
�����
�����
���������
���������