
PERPETUITY or LIMITED LIFESPAN - philanthropy.org by The Foundation Center in cooperation with...
46
Produced by The Foundation Center in cooperation with PERPETUITY or LIMITED LIFESPAN How Do Family Foundations Decide? April 2009
Transcript of PERPETUITY or LIMITED LIFESPAN - philanthropy.org by The Foundation Center in cooperation with...
Produced by The Foundation Center
in cooperation with
PERPETUITY orLIMITED LIFESPANHow Do Family Foundations Decide?
April 2009

Loren RenzSenior Researcher for Special Projects
David WolcheckResearch Associate
The Foundation Centerin cooperation with the
Council on Foundations
with special thanks to the Association of Small Foundations
PERPETUITY orLIMITED LIFESPANHow Do Family Foundations Decide?
Intentions, Practices, and Attitudes

CONTRIBUTING STAFF
Lawrence T. McGill ____________ Senior Vice President for ResearchTeri Maiorca Wade ____________ Vice President for CommunicationsRachel Lauer _________________ Research AssociateStacy Repetto _________________ Research AssistantThomas Provan _______________ ProgrammerChristine Innamorato __________ Production Manager
ABOUT THE REPORT
The original research upon with which this report is based was conducted by the Foundation Center with assistance from the Association of Small Foundations. Data from the report may not be cited or reproduced without attribution to Perpetuity or Limited Lifespan: How Do Family Foundations Decide?For a complete listing of current research reports produced by the Center, visit foundationcenter.org
ABOUT THE FOUNDATION CENTER
Established in 1956 and today supported by close to 600 foundations, the Foundation Center is the nation’s leading authority on philanthropy, connecting nonprofi ts and the grantmakers supporting them to tools they can use and information they can trust. The Center maintains the most comprehensive database on U.S. grantmakers and their grants—a robust, accessible knowledge bank for the sector. It also operates research, education, and training programs designed to advance knowledge of philanthropy at every level. Thousands of people visit the Center’s web site each day and are served in its fi ve regional library/learning centers and its network of more than 400 funding information centers located in public libraries, community foundations, and educational institutions in every U.S. state and beyond. For more information, please visit foundationcenter.org or call (212) 620-4230.
ABOUT THE COUNCIL ON FOUNDATIONS
Established in 1949, the Council on Foundations is an Arlington, Virginia-based nonprofit membership association of some 2,000 foundations and corporate giving programs. The Council is a voice of philanthropy at the national level and a valued partner globally. The Council provides the opportunity, leadership, and tools needed by philanthropic organizations to expand, enhance, and sustain their ability to advance the common good. For more information about the Council, visit its website at www.cof.org.
SUPPORTERS
Perpetuity or Limited Lifespan: How Do Family Foundations Decide? was made possible in part by support from the Aspen Institute’s Nonprofi t Sector and Philanthropy Program, with additional support from The Wallace Foundation.
Opinions represent those of the authors and not necessarily those of the funders.
The Foundation Center’s Research Institute is funded in part by The Wallace Foundation, which seeks to support and share effective ideas and practices that expand learning and enrichment opportunities for all people. Its three current objectives are:
Strengthen education leadership to improve student achievement ◆
Enhance out-of-school learning opportunities ◆
Build appreciation and demand for the arts ◆
For more information on these and other related topics, please visit the Knowledge Center at wallacefoundation.org.
© 2009 by the Foundation Center. All rights reserved. Printed and bound in the United States of America. ISBN 978-1-59542-258-3
Download Perpetuity or Limited Lifespan: How do Family Foundations Decide? at foundationcenter.org/gainknowledge/research/specialtrends.For more information contact David Wolcheck at (212) 807-2559 or [email protected].

TABLES AND FIGURES __________________________________________________________ v
EXECUTIVE SUMMARY _________________________________________________________ vii
INTRODUCTION _______________________________________________________________ ixAdvisory Committee x
1. FAMILY FOUNDATION LIFESPAN PLANNING OPTIONS: Limited Life, Perpetual, or Undecided __________________________________________ 1
2. LIMITED-LIFE FOUNDATIONS: Decision-making, Timeframe, Options, and Strategies ____________________________ 7
3. PERPETUAL FOUNDATIONS:Decision-making and Consideration of Alternatives to Perpetuity __________________ 15
4. UNDECIDED FOUNDATIONS: Consideration of Alternatives to Perpetuity _____________________________________ 19
5. ATTITUDES TOWARD LIFESPAN CHOICES:Limited Lifespan vs. Perpetuity _______________________________________________ 21
6. CONCLUSIONS ____________________________________________________________ 25
APPENDIX A: ADDITIONAL TABLES ______________________________________________ 29Regression Analysis 30
APPENDIX B: METHODOLOGY __________________________________________________ 31
SPECIAL FEATURESWhat Impact Will the Current Economic Crisis Have on Foundation Lifespan Planning? viii
How Do 2004 Survey Findings on Lifespan Planning Options Compare with 2008 Survey Findings? 4
To What Extent Do Family Foundation Charters Specify Perpetuity or Limited Lifespan? 6
Contents


v
CHAPTER 1. Family Foundation Lifespan Planning Options: Limited Life, Perpetual, or UndecidedFigure 1-1. Foundation Lifespan Plan: Limited Lifespan, Perpetuity, Undecided __________________ 1Figure 1-2. Foundation Lifespan Plan by Status of the Founder (Living or Deceased) _____________ 1Figure 1-3. Lifespan Plan of Foundations with Living Founders by Foundation Age
(Period of Establishment) ______________________________________________________ 2Figure 1-4. Lifespan Plan by Foundation Asset Size _________________________________________ 3Figure 1-5. Lifespan Plan by Foundation Age (Period of Establishment) _________________________ 3Figure 1-6. Foundation Lifespan Plan by Endowed vs. Pass-through Status _____________________ 4Figure 1-7. Lifespan Plan by Foundation Location ___________________________________________ 5Figure 1-8. Family Foundation Charters and Lifespan Plans ___________________________________ 6
CHAPTER 2. Limited-Life Foundations: Decision-making, Timeframe, Options, and StrategiesFigure 2-1. Decision Point for Limiting the Foundation’s Lifespan ______________________________ 7Figure 2-2. Decision Year of Foundations That Adopted a
Limited-Lifespan Policy After Inception __________________________________________ 7Figure 2-3. Factors Influencing the Decision Made at Inception to Spend Down _________________ 8Figure 2-4. Factors Influencing the Decision Made Later to Spend Down _______________________ 9Figure 2-5. External Factors Influencing the Decision Made Later to Spend Down _______________ 10Figure 2-6. Timeframe for Spending Down of Limited-Life Foundations ________________________ 10Figure 2-7. Options for Spending Down of Limited-Life Foundations ___________________________ 11Figure 2-8. Changes in Operational Strategies of Limited-Life Foundations _____________________ 12Figure 2-9. Actions Taken in Preparation for Spending Down by Limited-Life Foundations ________ 12
CHAPTER 3. Perpetual Foundations: Decision-making and Consideration of Alternatives to PerpetuityFigure 3-1. Percent of Perpetual Family Foundations That Made a Formal Decision to
Exist in Perpetuity by Asset Size _______________________________________________ 15Figure 3-2. Decision Point for Deciding to Exist in Perpetuity _________________________________ 15Figure 3-3. Factors Influencing the Decision to Exist in Perpetuity ____________________________ 16Figure 3-4. Foundations That Have Considered Alternatives to Perpetuity by Asset Size _________ 17
CHAPTER 4. Undecided Foundations: Consideration of Alternatives to PerpetuityFigure 4-1. Percent of Undecided vs. Perpetual Foundations That have
Considered Alternatives to Perpetuity __________________________________________ 19Figure 4-2. Factors That Led to the Consideration of Alternatives to
Perpetuity by Undecided Foundations __________________________________________ 20Figure 4-3. Future Plans of Undecided Foundations Regarding Alternatives to Perpetuity _________ 20
APPENDIX A: Additional TablesTable A-1. Lifespan Plan by Status of the Founder (Living or Deceased) and Establishment Period 29Table A-2. Lifespan Plan by Foundation Staffing ____________________________________________ 29Table A-3. Foundation Age (Establishment Period) by Region _________________________________ 29Table A-4. Founder(s)’ Involvement in Deciding to Adopt a Limited Lifespan When Made Later ____ 29Table A-5. Changes in Grantmaking Strategies of Limited-life Foundations _____________________ 29Table A-6. Linear Regression Model Coefficients ___________________________________________ 30
APPENDIX B: MethodologyTable B-1. Survey Respondents by Asset Size _____________________________________________ 32Table B-2. Survey Respondents by Establishment Period ____________________________________ 32Table B-3. Survey Respondents by Region ________________________________________________ 32Table B-4. Survey Respondents by Asset Size and Source Organization _______________________ 32Table B-5. Survey Respondents by Establishment Period and Source Organization ______________ 33Table B-6. Survey Respondents by Region and Source Organization __________________________ 33
Tables and Figures


Executive Summary vii
In recent years, foundation donors and leaders have engaged in an increasing number of conversations on the phenomenon of foundation “spend-down,” or limited lifespan. These discussions have been spurred by the heightened visibility of individual philanthropists who have announced their intention to limit their foundation’s lifespan and by the fact that many family foundations created in the 1980s and 1990s are now facing a transition in leadership that leads them to consider foundation lifespan options that may be open to them.
While awareness of lifespan planning options has grown, research to date on this topic has been sparse. To answer the basic question of how many active foundations are planning to spend down or exist in perpetuity (or have not yet made a decision), and to examine foundations’ motivations and decision-making, the Foundation Center, in collaboration with the Council on Foundations, launched a study of family foundations in 2008. Perpetuity or Limited Lifespan: How do Family Foundations Decide? presents the study’s fi ndings, which are based on survey responses from 1,074 family foundations.1
Key Findings:
The study’s most basic fi nding is ◆
that while perpetuity is the norm for most existing family foundations, a small segment plan to have a limited lifespan (12 percent) and a larger segment are undecided (25 percent), either because they have not yet discussed this issue or due to uncertainty about the
family’s future involvement in the foundation.
A number of foundation ◆
characteristics infl uence the lifespan choice of active family foundations: in general, small foundations established since 1980 that do not employ paid staff and whose founder is still living are the most likely to plan to limit their lifespan, though the percentage who expect to spend down is still modest.
Having a living donor is an especially ◆
strong determinant of lifespan planning choices: foundations with a living founder are three times more likely to expect to spend down than those whose founder is deceased and they are almost twice as likely to be undecided.
Most family foundations do not ◆
incorporate a decision about intended lifespan into their founding documents.
Foundations that plan to limit their ◆
lifespan are more likely to make a formal decision at some point after the foundation’s establishment, rather than at inception.
When the decision is made at ◆
inception, the leading factors that drive the decision to spend down are the desire of the founder(s) to have a greater impact during their lifetimes and to be involved in how the money was spent.
When the decision is made later, ◆
the most frequently cited reasons are a shift in the founder(s) attitude toward limited lifespan versus perpetuity, family issues, and a belief
that subsequent generations will create their own philanthropies.
Most foundations that plan to spend ◆
down have not yet started the process and have therefore made only limited changes in their operational and grantmaking strategies.
Foundations that have set a ◆
timeframe for spending down are more likely to have taken steps in preparation for closing the foundation.
Foundations that have made a ◆
formal decision to exist in perpetuity are much more likely to make the decision at inception.
The two leading reasons for deciding ◆
to exist in perpetuity are a desire to have a long-term impact on the community and a desire for family engagement across generations.
A large majority of foundations that ◆
plan to exist in perpetuity have never considered other options and are unlikely to do so in the future.
Unlike perpetual foundations, ◆
most family foundations that are undecided have considered alternatives to perpetuity in the past and expect to do so in the future.
Undecided foundations cite family ◆
issues and a shift in the donor(s)’ attitude toward perpetuity as the leading reasons for considering other lifespan options.
For foundations that plan to limit ◆
the foundation’s lifespan, the two leading advantages cited are the ability to honor donor intent and to preserve the founder(s)’ vision and level of engagement.
EXECUTIVE SUMMARY

viii Perpetuity or Limited Lifespan
Foundations that plan to exist ◆
in perpetuity are most likely to mention as advantages family-related reasons—such as engagement across generations, shared responsibility, and family unity—and a concern for the long-term needs of people and causes assisted by the foundation.
Undecided foundations are ◆
much more likely than perpetual foundations to see disadvantages to the perpetuity option.
While most respondents have “no ◆
opinion,” a substantial minority of all three types of respondents agree that attitudes toward limiting a foundation’s lifespan are changing in the foundation community.
Endnote1. These fi ndings are not intended to generalize about all
foundations nor should they be considered indicative of foundation practices during any time period other than the present.
When the Foundation Center surveyed family foundations in June 2008 about their lifespan plans, the U.S. economy was already rattled over bank failures, the credit crisis, and falling equity prices, but some of the worst shocks to the system—the demise of Lehman Brothers, the buyout of Merrill Lynch and the bailout of the American Insurance Group—were yet to come. In light of the fi nancial turmoil that prevailed in the second half of 2008 and that ravaged philanthropic endowments, it is fair to consider whether some foundations might have responded differently about their lifespan plans and intentions had they been asked six to nine months later.
To gain perspective on this question, we turned to our study advisors (listed on page x). Specifi cally, we asked them whether the steep decline in foundation assets might result in a greater proportion of foundations than were documented in the 2008 study deciding to spend down; and if so, what particular kinds of family foundations were likely to be affected.
While their opinions are not conclusive, the advisors who responded are largely in consensus: they believe that a good number of family foundations that had expected to remain autonomous may now consider spending down or folding their assets into donor-advised funds. Smaller and newer family foundations that have not had much time to grow are considered most at risk. According to one advisor, the economic crisis “is inevitably going to speed up [the] decision-making process.” With resources dramatically reduced, some families may not feel they are
having enough impact to justify the administrative costs of running a foundation. “It’s also worth noting,” added the advisor, “that many more of the community foundations have beefed up their family philanthropy services and are actively courting smaller foundations that might be interested in switching to a donor-advised fund.”
Even if the spend-down rate increases, however, the proportion of family foundations making this decision is still likely to be modest. The vast majority of larger endowed family foundations that wish to exist in perpetuity will weather the storm. And foundations with living donors have another option: the donors may decide to put more money into their foundation to make up for losses in the fi nancial markets. One family foundation respondent pointed to a particular case in which the donors “did not want to see the foundation cut back in these very challenging times.”
In summary, family foundations still have a range of lifespan options. It seems reasonable to think that in these diffi cult fi nancial times many foundations that have never before considered the issue of perpetuity or limited lifespan—or something in between—will at least consider their options deliberatively. Over the next few years, the Foundation Center will monitor changes in the birth and death rates of various types of foundations, including family foundations, to determine the impact of the current recession on the size and composition of the foundation community.
WHAT IMPACT WILL THE CURRENT ECONOMIC CRISIS HAVE ON FOUNDATION LIFESPAN PLANNING?

Introduction ix
In recent years, foundation donors and leaders have engaged in an increasing number of conversations and debates both regionally and at the national level on the phenomenon of “spend-down,” or limited lifespan.1 These discussions have been spurred in part by the heightened visibility of individual donors—notably Charles Feeney, Bill Gates, Warren Buffett, and Paul Brainerd—who have publicly announced their intention not to maintain a perpetual endowment but rather to set a limit on their foundation/philanthropy’s lifespan.2 The increased focus on this topic also refl ects a larger timing issue. Following the unprecedented growth of family foundations in the 1980s and 1990s3, many of these philanthropies are looking ahead to a transition in leadership from the fi rst to the second generation. As young family foundations mature, they begin to focus on the foundation’s future, which leads them to consider foundation lifespan options that may be open to them.
While awareness of lifespan planning options has grown, research to date on this topic has been sparse. As noted in the Aspen Institute’s 2007 request for proposal, “there is very little reliable empirical data on the practice of foundation spend-down.” In 2004, as part of its annual “Foundation Forecasting” survey, the Foundation Center asked more than 3,000 larger foundations whether they planned to exist in perpetuity. The fi ndings from that survey have provided up to now the only national-level data available on the lifespan planning intentions of existing foundations.4 While these
fi ndings are of value, they focus mainly on larger foundations and they fail to answer the broader and deeper questions on lifespan planning issues—such as motivation and decision-making—that are of great interest to the fi eld. To address these qualitative issues and to update our earlier quantitative research, the Foundation Center, in collaboration with the Council on Foundations, launched a study on “Foundation Spend-Down” in 2008.
This report focuses on the intentions, practices, and attitudes of family foundations
that were active in 2008. It is not intended to generalize about all foundations nor should the fi ndings be considered indicative of foundation practices during any time period other than the present, since any foundations that had already spent down by the time of the survey were by defi nition not included in the study. The Foundation Center has identifi ed close to 38,000 active independent foundations with measurable donor or donor-family involvement. These family foundations represent more than half of all independent foundations and account for similar shares of independent foundations’ giving, assets, and new gifts and bequests from donors. Many of these foundations were created in the late 1980s and the 1990s during stock market booms. As they mature and move into the second or third generation, it may become harder to sustain them. Grantmaking may become more complicated because of the family’s geographic dispersion, ideological differences, varying funding interests, or due to a lack of interest
on the part of family members in managing the foundation. All these reasons make family foundations an area ripe for research on lifespan planning intentions.
At the most basic level, this research seeks to answer the question, “How many active family foundations are planning to spend down or considering a limited-lifespan option? How many are planning to exist in perpetuity? How many have not yet made a decision?5
Through surveys tailored to these three distinct groups, we also address related questions, such as: do foundation size, age, location, and other variables relate in signifi cant ways to lifespan planning options? What factors infl uence the decision to adopt a spend-down strategy or the consideration of alternatives to perpetuity? What are the perceived pros and cons to spending down or existing in perpetuity?
For family foundations that have decided to limit their lifespan, questions include: When in the foundation’s life cycle was the decision made? Over what period of time will the foundation spend out its assets? How does the decision to spend down affect operational and grantmaking strategies? How do foundations approach issues of accountability and transparency as they prepare for spending down? We also seek to examine whether certain operating characteristics, such as age and size, infl uence spend-down practices and strategies.
To answer these and other questions, in 2008 the Foundation Center sent surveys to more than 5,800 active
INTRODUCTION

x Perpetuity or Limited Lifespan
family foundations. A total of 1,074 foundations (more than 18 percent) provided usable responses. The survey was conducted in collaboration with the Association of Small Foundations, which graciously offered to fi eld our survey questions to its members as part of ASF’s annual Operations and Management survey. This collaboration enabled us to reach an unprecedented number of small and large, staffed and unstaffed, new and old family foundations across the country. (For information on the survey sample and procedures and on how to access the survey questionnaires, see Appendix B: Methodology.) We are grateful to the many foundations that took the time to complete the survey and share their viewpoints with us. We are also indebted to the staff of ASF for bringing our study to the attention of their members and helping us improve the survey response rate.
The study was guided by an advisory committee composed of representatives of family foundations—both perpetual and limited life, national and regional infrastructure associations, a philanthropic consulting group, and a research center (see box on opposite page). We thank the advisors
for their assistance in designing the survey instrument, interpreting the survey fi ndings, and suggesting ways to frame the study and for their feedback on the study outcomes.
This report was written by researchers at the Foundation Center. It was prepared in collaboration with the Council on Foundations, which partnered with the Foundation Center in the design and execution of the research. At the Council, Judith Kroll deserves special recognition for her leadership role in this collaboration and for her substantive contributions to the survey design and throughout the study process.
The project partners and researchers who designed and executed this research take no position as to whether foundations ought to make a particular
lifespan choice. Our sole objective has been to collect reliable empirical data on a broad cross-section of active family foundations and to provide an objective and accurate analysis of their current intentions, practices, and attitudes.
ENDNOTES1. Examples of such discussions in recent years include
convenings and publications sponsored or organized by the Council on Foundations, the National Center on Family Philanthropy, the Philanthropic Roundtable, and regional associations of grantmakers across the country, such as the Association of Baltimore Area Grantmakers, Conference of Southwest Foundations, New York Regional Association of Grantmakers, and Northern California Grantmakers.
2. The infl uence of these highly visible philanthropists has been felt mainly in the latest decade. Nevertheless, some prominent donors imposed a limited term on their foundations in the 1980s and 1990s, including Lucille P. Markey, Aaron and Irene Diamond, and Brook Astor.
3. Fifty-three percent of active family foundations identifi ed by the Foundation Center in 2008 were established in the 1990s (40 percent) or the 1980s (13 percent). Just 11 percent of existing family foundations were formed in earlier decades. The remaining 27 percent were created since 2000. For more detailed information, see “Key Facts on Family Foundations” at http://foundationcenter.org/ gainknowledge/research/nationaltrends.html
4. Renz, L. and S. Lawrence, Foundation Growth and Giving Estimates: 2003 Preview, New York; Foundation Center, 2004, p. 10. http://foundationcenter.org/gainknowledge/research/pdf/fgge04.pdf
5. Separately, we compare the 2008 fi ndings on these lifespan options with the Foundation Center’s fi ndings on the intentions of active family foundations from our 2004 survey (see “How Do 2004 Survey Findings on Lifespan Planning Options Compare with 2008 Survey Findings?” on page 4).
Douglas BauerRockefeller Philanthropy Advisors
Susan V. BerresfordNew York Community Trust
Joseph W. ClarkEckerd Family Foundation
Diane FeeneyFACT Services, French American Charitable Trust
John HavensCenter on Wealth and Philanthropy, Boston College
Betsy NelsonThe Association of Baltimore Area Grantmakers
Susan C. PriceNational Center on Family Philanthropy
Vince StehleSurdna Foundation
Tim WalterAssociation of Small Foundations
Council on FoundationsJudith KrollSigurd Nilsen
The Foundation CenterLawrence T. McGillLoren RenzDavid Wolcheck
RESEARCH PARTNERAssociation of Small FoundationsCarmen WongKathryn Petrillo-Smith
ADVISORY COMMITTEE PROJECT PARTNERS
Family Foundation Lifespan Planning Options 1
Family Foundation Lifespan Planning Options: Limited Life, Perpetual, or Undecided
Family LifespaLimited L1
HOW PREVALENT ARE LIMITED-LIFE FOUNDATIONS TODAY?
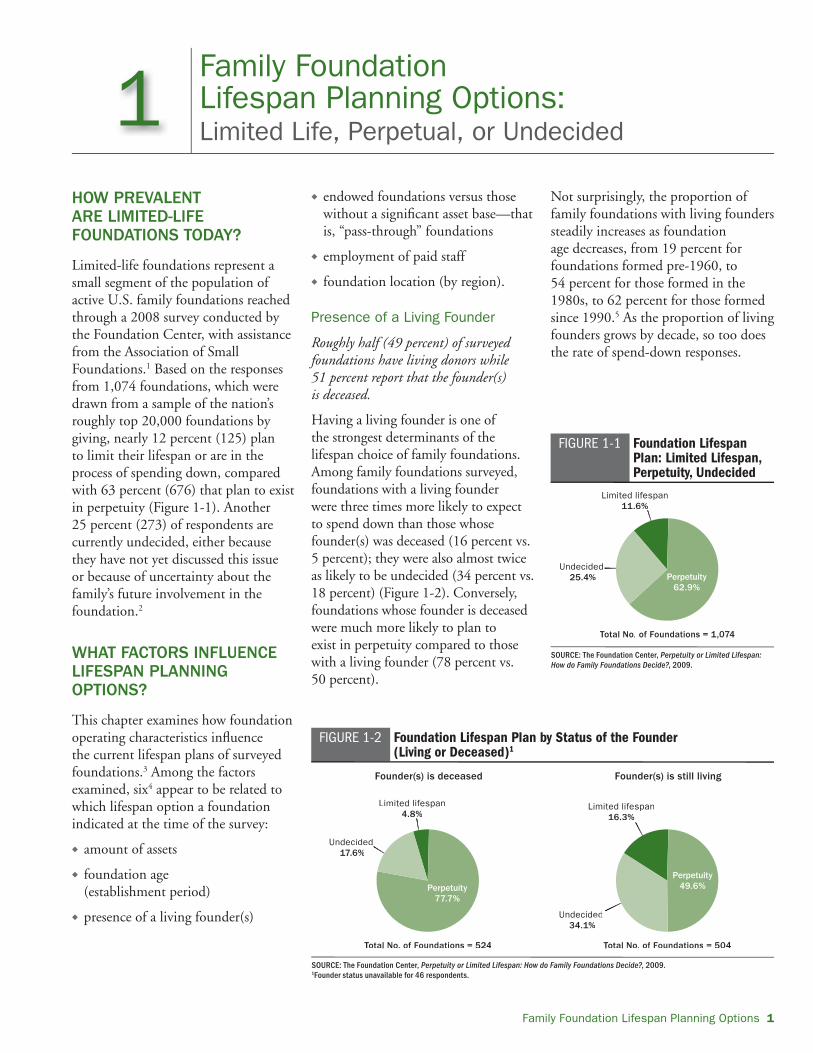
Limited-life foundations represent a small segment of the population of active U.S. family foundations reached through a 2008 survey conducted by the Foundation Center, with assistance from the Association of Small Foundations.1 Based on the responses from 1,074 foundations, which were drawn from a sample of the nation’s roughly top 20,000 foundations by giving, nearly 12 percent (125) plan to limit their lifespan or are in the process of spending down, compared with 63 percent (676) that plan to exist in perpetuity (Figure 1-1). Another 25 percent (273) of respondents are currently undecided, either because they have not yet discussed this issue or because of uncertainty about the family’s future involvement in the foundation.2
WHAT FACTORS INFLUENCE LIFESPAN PLANNING OPTIONS?
This chapter examines how foundation operating characteristics infl uence the current lifespan plans of surveyed foundations.3 Among the factors examined, six4 appear to be related to which lifespan option a foundation indicated at the time of the survey:
amount of assets◆
foundation age ◆
(establishment period)
presence of a living founder(s)◆
endowed foundations versus those ◆
without a signifi cant asset base—that is, “pass-through” foundations
employment of paid staff ◆
foundation location (by region). ◆
Presence of a Living Founder
Roughly half (49 percent) of surveyed foundations have living donors while 51 percent report that the founder(s) is deceased.
Having a living founder is one of the strongest determinants of the lifespan choice of family foundations. Among family foundations surveyed, foundations with a living founder were three times more likely to expect to spend down than those whose founder(s) was deceased (16 percent vs. 5 percent); they were also almost twice as likely to be undecided (34 percent vs. 18 percent) (Figure 1-2). Conversely, foundations whose founder is deceased were much more likely to plan to exist in perpetuity compared to those with a living founder (78 percent vs. 50 percent).
Not surprisingly, the proportion of family foundations with living founders steadily increases as foundation age decreases, from 19 percent for foundations formed pre-1960, to 54 percent for those formed in the 1980s, to 62 percent for those formed since 1990.5 As the proportion of living founders grows by decade, so too does the rate of spend-down responses.
FIGURE 1-1 Foundation Lifespan Plan: Limited Lifespan, Perpetuity, Undecided
SOURCE: The Foundation Center, Perpetuity or Limited Lifespan: How do Family Foundations Decide?, 2009.
Undecided 25.4%
Limited lifespan11.6%
Total No. of Foundations = 1,074
eed%
Limited lifespaspann11.1.66%%
Total No.o of of FoFoundundatiationsons = 1,074
Perpetuity62.9%
FIGURE 1-2 Foundation Lifespan Plan by Status of the Founder (Living or Deceased)1
SOURCE: The Foundation Center, Perpetuity or Limited Lifespan: How do Family Foundations Decide?, 2009.1Founder status unavailable for 46 respondents.
Undecided 17.6%
Limited lifespan4.8%
Total No. of Foundations = 524
cideded6%%
ted espa4 84.8%
Total No.No of o FoFoundundationsons = 524
Perpetuity77.7%
Founder(s) is deceased
Undecided 34.1%
Limited lifespan16.3%
Total No. of Foundations = 504
Founder(s) is still living
edd %
imited lifespan16.3%%
Total No.No of o FoFoundundationsons = 504
Perpetuity49.6%
2 Perpetuity or Limited Lifespan
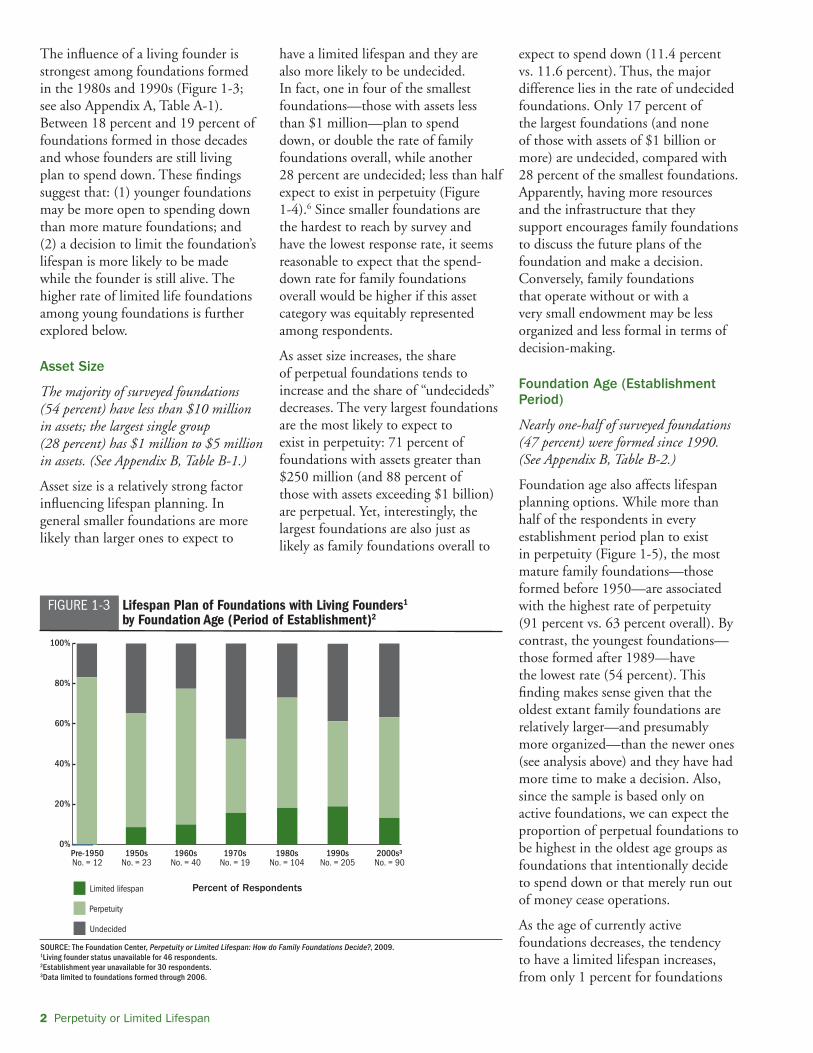
The infl uence of a living founder is strongest among foundations formed in the 1980s and 1990s (Figure 1-3; see also Appendix A, Table A-1). Between 18 percent and 19 percent of foundations formed in those decades and whose founders are still living plan to spend down. These fi ndings suggest that: (1) younger foundations may be more open to spending down than more mature foundations; and (2) a decision to limit the foundation’s lifespan is more likely to be made while the founder is still alive. The higher rate of limited life foundations among young foundations is further explored below.
Asset Size
The majority of surveyed foundations (54 percent) have less than $10 million in assets; the largest single group (28 percent) has $1 million to $5 million in assets. (See Appendix B, Table B-1.)
Asset size is a relatively strong factor infl uencing lifespan planning. In general smaller foundations are more likely than larger ones to expect to
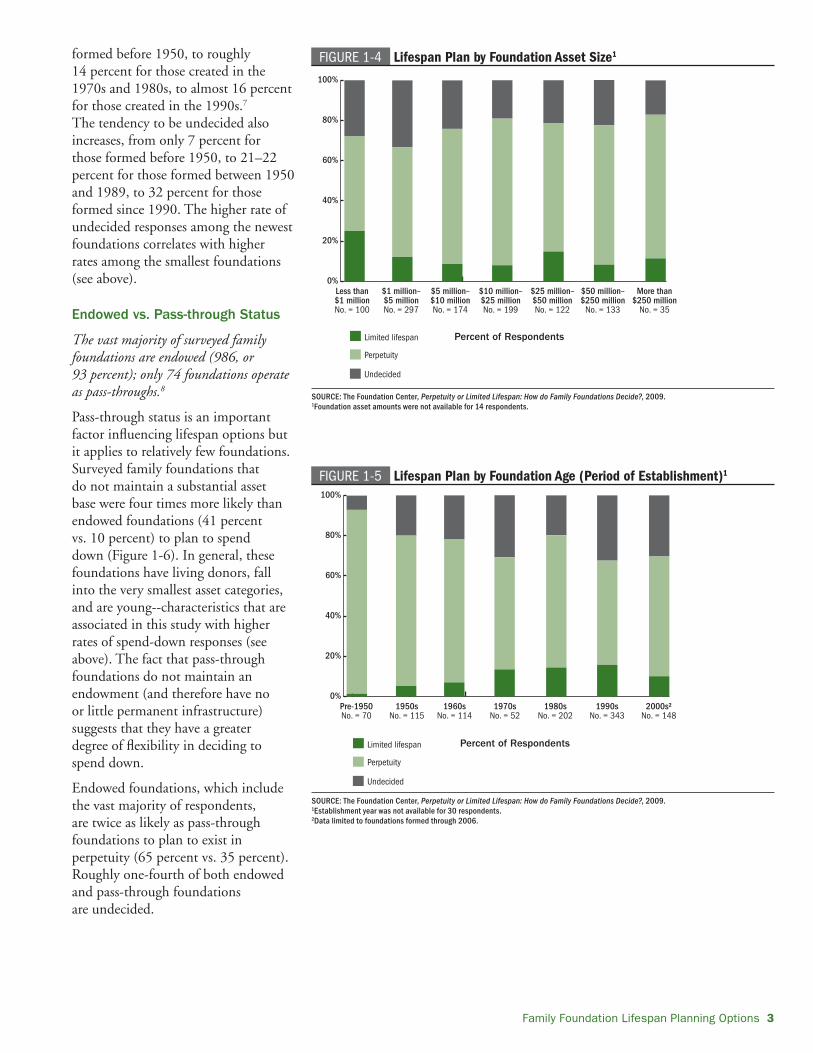
have a limited lifespan and they are also more likely to be undecided. In fact, one in four of the smallest foundations—those with assets less than $1 million—plan to spend down, or double the rate of family foundations overall, while another 28 percent are undecided; less than half expect to exist in perpetuity (Figure 1-4).6 Since smaller foundations are the hardest to reach by survey and have the lowest response rate, it seems reasonable to expect that the spend-down rate for family foundations overall would be higher if this asset category was equitably represented among respondents.
As asset size increases, the share of perpetual foundations tends to increase and the share of “undecideds” decreases. The very largest foundations are the most likely to expect to exist in perpetuity: 71 percent of foundations with assets greater than $250 million (and 88 percent of those with assets exceeding $1 billion) are perpetual. Yet, interestingly, the largest foundations are also just as likely as family foundations overall to
expect to spend down (11.4 percent vs. 11.6 percent). Thus, the major difference lies in the rate of undecided foundations. Only 17 percent of the largest foundations (and none of those with assets of $1 billion or more) are undecided, compared with 28 percent of the smallest foundations. Apparently, having more resources and the infrastructure that they support encourages family foundations to discuss the future plans of the foundation and make a decision. Conversely, family foundations that operate without or with a very small endowment may be less organized and less formal in terms of decision-making.
Foundation Age (Establishment Period)
Nearly one-half of surveyed foundations (47 percent) were formed since 1990. (See Appendix B, Table B-2.)
Foundation age also affects lifespan planning options. While more than half of the respondents in every establishment period plan to exist in perpetuity (Figure 1-5), the most mature family foundations—those formed before 1950—are associated with the highest rate of perpetuity (91 percent vs. 63 percent overall). By contrast, the youngest foundations—those formed after 1989—have the lowest rate (54 percent). This fi nding makes sense given that the oldest extant family foundations are relatively larger—and presumably more organized—than the newer ones (see analysis above) and they have had more time to make a decision. Also, since the sample is based only on active foundations, we can expect the proportion of perpetual foundations to be highest in the oldest age groups as foundations that intentionally decide to spend down or that merely run out of money cease operations.
As the age of currently active foundations decreases, the tendency to have a limited lifespan increases, from only 1 percent for foundations
FIGURE 1-3 Lifespan Plan of Foundations with Living Founders1 by Foundation Age (Period of Establishment)2
SOURCE: The Foundation Center, Perpetuity or Limited Lifespan: How do Family Foundations Decide?, 2009.1Living founder status unavailable for 46 respondents.2Establishment year unavailable for 30 respondents.3Data limited to foundations formed through 2006.
0%
20%
40%
60%
80%
100%
Undecided
Perpetuity
Limited lifespan
2000s³No. = 90
1990sNo. = 205
1980sNo. = 104
1970sNo. = 19
1960sNo. = 40
1950sNo. = 23
Pre-1950No. = 12
Percent of Respondents
Family Foundation Lifespan Planning Options 3
formed before 1950, to roughly 14 percent for those created in the 1970s and 1980s, to almost 16 percent for those created in the 1990s.7 The tendency to be undecided also increases, from only 7 percent for those formed before 1950, to 21–22 percent for those formed between 1950 and 1989, to 32 percent for those formed since 1990. The higher rate of undecided responses among the newest foundations correlates with higher rates among the smallest foundations (see above).
Endowed vs. Pass-through Status
The vast majority of surveyed family foundations are endowed (986, or 93 percent); only 74 foundations operate as pass-throughs.8
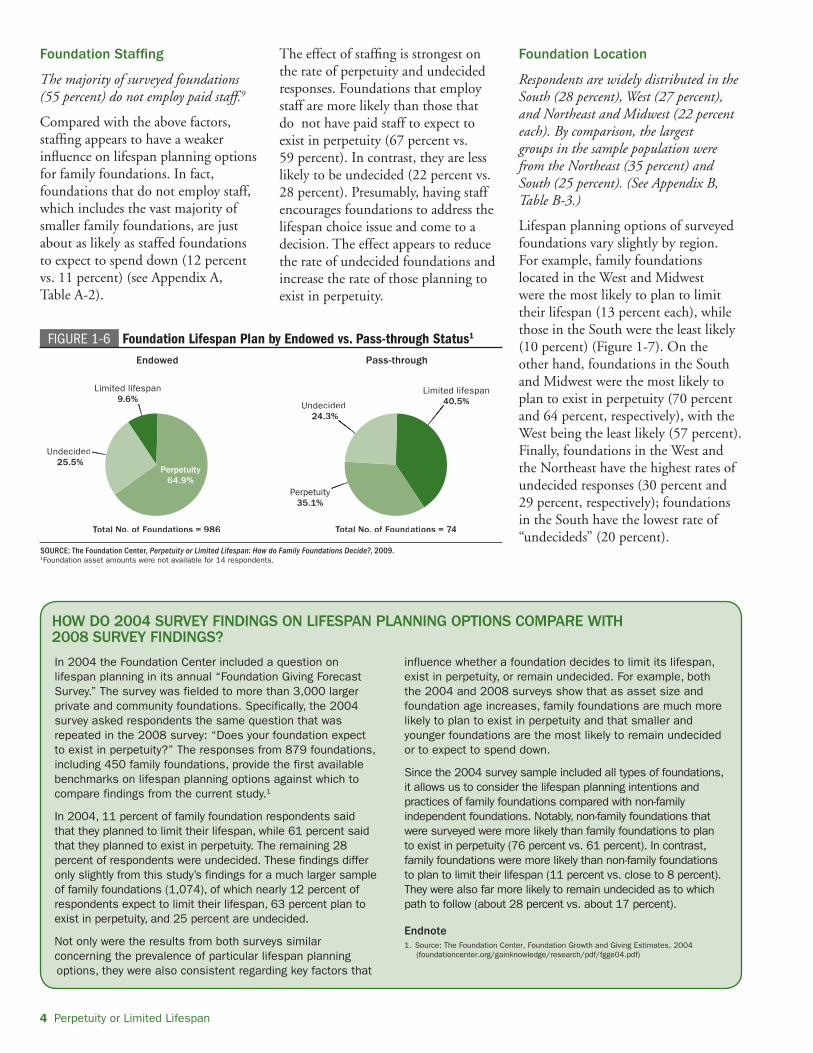
Pass-through status is an important factor infl uencing lifespan options but it applies to relatively few foundations. Surveyed family foundations that do not maintain a substantial asset base were four times more likely than endowed foundations (41 percent vs. 10 percent) to plan to spend down (Figure 1-6). In general, these foundations have living donors, fall into the very smallest asset categories, and are young--characteristics that are associated in this study with higher rates of spend-down responses (see above). The fact that pass-through foundations do not maintain an endowment (and therefore have no or little permanent infrastructure) suggests that they have a greater degree of fl exibility in deciding to spend down.
Endowed foundations, which include the vast majority of respondents, are twice as likely as pass-through foundations to plan to exist in perpetuity (65 percent vs. 35 percent). Roughly one-fourth of both endowed and pass-through foundations are undecided.
FIGURE 1-5 Lifespan Plan by Foundation Age (Period of Establishment)1
SOURCE: The Foundation Center, Perpetuity or Limited Lifespan: How do Family Foundations Decide?, 2009.1Establishment year was not available for 30 respondents.2Data limited to foundations formed through 2006.
Limited lifespan
Perpetuity
Undecided
0%
20%
40%
60%
80%
100%
Undecided
Perpetuity
Limited lifesp
2000s²No. = 148
1990sNo. = 343
1980sNo. = 202
1970sNo. = 52
1960sNo. = 114
1950sNo. = 115
Pre-1950No. = 70
Percent of Respondents
FIGURE 1-4 Lifespan Plan by Foundation Asset Size1
SOURCE: The Foundation Center, Perpetuity or Limited Lifespan: How do Family Foundations Decide?, 2009.1Foundation asset amounts were not available for 14 respondents.
Limited lifespan
Perpetuity
Undecided
0%
20%
40%
60%
80%
100%
More than$250 million
No. = 35
$50 million–$250 million
No. = 133
$25 million–$50 millionNo. = 122
$10 million–$25 millionNo. = 199
$5 million–$10 millionNo. = 174
$1 million–$5 millionNo. = 297
Less than$1 millionNo. = 100
Percent of Respondents
4 Perpetuity or Limited Lifespan
Foundation Staffi ng
The majority of surveyed foundations (55 percent) do not employ paid staff.9
Compared with the above factors, staffi ng appears to have a weaker infl uence on lifespan planning options for family foundations. In fact, foundations that do not employ staff, which includes the vast majority of smaller family foundations, are just about as likely as staffed foundations to expect to spend down (12 percent vs. 11 percent) (see Appendix A, Table A-2).
The effect of staffi ng is strongest on the rate of perpetuity and undecided responses. Foundations that employ staff are more likely than those that do not have paid staff to expect to exist in perpetuity (67 percent vs. 59 percent). In contrast, they are less likely to be undecided (22 percent vs. 28 percent). Presumably, having staff encourages foundations to address the lifespan choice issue and come to a decision. The effect appears to reduce the rate of undecided foundations and increase the rate of those planning to exist in perpetuity.
Foundation Location
Respondents are widely distributed in the South (28 percent), West (27 percent), and Northeast and Midwest (22 percent each). By comparison, the largest groups in the sample population were from the Northeast (35 percent) and South (25 percent). (See Appendix B, Table B-3.)
Lifespan planning options of surveyed foundations vary slightly by region. For example, family foundations located in the West and Midwest were the most likely to plan to limit their lifespan (13 percent each), while those in the South were the least likely (10 percent) (Figure 1-7). On the other hand, foundations in the South and Midwest were the most likely to plan to exist in perpetuity (70 percent and 64 percent, respectively), with the West being the least likely (57 percent). Finally, foundations in the West and the Northeast have the highest rates of undecided responses (30 percent and 29 percent, respectively); foundations in the South have the lowest rate of “undecideds” (20 percent).
FIGURE 1-6 Foundation Lifespan Plan by Endowed vs. Pass-through Status1
SOURCE: The Foundation Center, Perpetuity or Limited Lifespan: How do Family Foundations Decide?, 2009.1Foundation asset amounts were not available for 14 respondents.
Undecided 25.5%
Limited lifespan9.6%
Total No. of Foundations = 986
Endowed
edd %
Limited lifespan9.69.6%%
Total No.No of o FoFoundundationsons = 986
Perpetuity64.9%
Undecided 24.3%
Limited lifespan40.5%
Total No. of Foundations = 74
Pass-through
Perpetuity35.1%
ecided 4.3%
Limited lifes40.5%
Total No.No. off Fo Foundundatitionons = 74
ityy%
In 2004 the Foundation Center included a question on lifespan planning in its annual “Foundation Giving Forecast Survey.” The survey was fielded to more than 3,000 larger private and community foundations. Specifically, the 2004 survey asked respondents the same question that was repeated in the 2008 survey: “Does your foundation expect to exist in perpetuity?” The responses from 879 foundations, including 450 family foundations, provide the first available benchmarks on lifespan planning options against which to compare findings from the current study.1
In 2004, 11 percent of family foundation respondents said that they planned to limit their lifespan, while 61 percent said that they planned to exist in perpetuity. The remaining 28 percent of respondents were undecided. These findings differ only slightly from this study’s findings for a much larger sample of family foundations (1,074), of which nearly 12 percent of respondents expect to limit their lifespan, 63 percent plan to exist in perpetuity, and 25 percent are undecided.
Not only were the results from both surveys similar concerning the prevalence of particular lifespan planning options, they were also consistent regarding key factors that
influence whether a foundation decides to limit its lifespan, exist in perpetuity, or remain undecided. For example, both the 2004 and 2008 surveys show that as asset size and foundation age increases, family foundations are much more likely to plan to exist in perpetuity and that smaller and younger foundations are the most likely to remain undecided or to expect to spend down.
Since the 2004 survey sample included all types of foundations, it allows us to consider the lifespan planning intentions and practices of family foundations compared with non-family independent foundations. Notably, non-family foundations that were surveyed were more likely than family foundations to plan to exist in perpetuity (76 percent vs. 61 percent). In contrast, family foundations were more likely than non-family foundations to plan to limit their lifespan (11 percent vs. close to 8 percent). They were also far more likely to remain undecided as to which path to follow (about 28 percent vs. about 17 percent).
Endnote1. Source: The Foundation Center, Foundation Growth and Giving Estimates, 2004
(foundationcenter.org/gainknowledge/research/pdf/fgge04.pdf)
HOW DO 2004 SURVEY FINDINGS ON LIFESPAN PLANNING OPTIONS COMPARE WITH 2008 SURVEY FINDINGS?

Family Foundation Lifespan Planning Options 5
To some extent, these regional variations echo patterns by age group discussed earlier. For example, Western foundations, which are among the most likely to plan to limit their lifespan, tend to be younger than foundations in other regions (see Appendix A, Table A-3) and include the largest number of pass-through foundations. At the same time, foundations in the South, which are the most likely to expect to exist in perpetuity, are also the most likely to be endowed. Still, the study raises questions about regional variations that cannot easily be answered, such as why foundations in the Midwest are among both the most likely to expect to limit their lifespan and to exist in perpetuity and why foundations in the South are the most likely to have made a decision about their future plans. Perhaps regional associations of grantmakers can help to interpret these fi ndings in the context of local traditions and practices.
SUMMARY
A small proportion of the 1,074 family foundations surveyed—about one out of eight—expect to limit their lifespan, while nearly two out of three plan to exist in perpetuity. In general, small foundations established since 1980 that do not employ paid staff and whose founder is still living are the most likely to decide to limit their lifespan; those that do not fund their grants out of endowment are especially likely to expect spend down. In contrast, more mature, larger, staffed foundations whose founder is deceased are the most likely to plan to exist in perpetuity. Finally, one in four foundations in the study has not yet made a decision as to which path to follow. Smaller foundations formed in the past two decades are the most likely to be undecided.
The proportions of active family foundations in 2008 that have decided to limit their lifespan or exist in perpetuity appear to be substantially consistent with fi ndings from a 2004 study (see box on previous page).
Endnotes1. For detailed information on the survey universe, how
the survey was conducted, and the demographics of respondents, and for information on how to access the survey questionnaires, see Appendix B: Methodology.
2. Lifespan planning option rates of family foundations differed somewhat based on responses collected by the Association of Small Foundations (see Appendix B: Methodology).
3. For an additional quantitative comparison of the major characteristics, see “Regression Analysis” in Appendix A.
4. A seventh characteristic, foundation giving size, did not show a consistent effect on foundations’ lifespan planning choices.
5. The proportion of foundations with living donors increases as age decreases for limited-life, perpetual, and undecided foundations alike. Still, even among foundations formed in the last two decades, limited-life foundations are much more likely than perpetual foundations to have living founders (85 percent vs. 51 percent) and somewhat more likely than undecided foundations (72 percent).
6. A substantial share (43 percent) of surveyed foundations that hold less than $1 million in assets are not endowed and operate as pass-throughs. If these foundations are excluded, the spend-down rate for the smallest foundations decreases to a little over 12 percent while the undecided
and perpetuity rates increase to 33 percent and 54 percent, respectively. For more on the infl uence of the pass-through factor on lifespan planning options, see page x. For a defi nition of pass-through foundations, see endnote 7 below and see the “Endowed vs. Pass-through” section in Appendix B: Methodology.
7. Just over 14 percent of the 693 surveyed foundations formed since 1980 plan to limit their lifespan. It bears noting that the share falls to 10 percent for the relatively few (148) foundations formed in the latest decade (through approximately 2006). However, this fi nding will certainly change over time for two reasons: 1) information on foundation formation in the current decade will not be complete for many years; and 2) this study shows that the decision to limit the foundation’s lifespan is most often made later in the foundation’s life (19 years after creation, on average, or 13 years later based on the median or mid-point). Thus, respondents that were created recently are not likely to make a decision for several years.
8. In this study, pass-through foundations are defi ned as those whose total giving in the latest fi scal year represented more than 25 percent of their assets. In general, these are foundations that maintain relatively low assets and that fund their grants out of gifts made into the foundation periodically by the donor(s).
9. In the sampled foundation population overall, a much larger proportion (87 percent) do not have paid staff.
Undecided 29.0%
Limited lifespan11.2%
Total No. of Foundations = 241
Northeast
edd %
Limited lifespan11.1.2%2%
Total No.No off o Fo Foundund tationsons = 241
Perpetuity59.8%
Undecided 20.3%
Limited lifespan9.6%
Total No. of Foundations = 301
South
edd %
Limited lifespan9.69.6%%
Total No.No off o Fo Foundundationsons = 301
Perpetuity70.1%
Undecided 22.7%
Limited lifespan13.0%
Total No. of Foundations = 238
Midwest
deedd %%
Limited lifespan13.3.0%0%
Total No.No off o Fo Foundund tationsons = 238
Perpetuity64.3%
Undecided 29.9%
Limited lifespan12.9%
Total No. of Foundations = 294
West
deedd %%
Limited lifespan12.2.9%9%
Total No.No off o Fo Foundund tationsons = 294
Perpetuity57.1%
SOURCE: The Foundation Center, Perpetuity or Limited Lifespan: How do Family Foundations Decide?, 2009.
FIGURE 1-7 Lifespan Plan by Foundation Location

6 Perpetuity or Limited Lifespan
To understand at what point in their life cycles family foundations decide whether to exist in perpetuity or limit their lifespan and whether the decision is made formally, the survey asked a series of questions. The first question, which was addressed to all types of foundations, asked them to describe the foundation’s founding charter.
As shown in Figure 1-8, the majority of family foundations (55 percent) have a charter that neither specifies perpetuity nor includes a sunset clause. Among the other respondents, 24 percent have a charter that specifies perpetuity while for 4 percent it includes a sunset clause.1 Another 17 percent of respondents indicated that they have no formal charter. Together these data suggest that only about one in four family foundations surveyed (28 percent) made a formal decision about their lifespan planning intentions at inception that was incorporated in their charters. Of those that did, the vast majority planned to exist in perpetuity.
Limited-Life and Perpetual FoundationsComparing the charters of perpetual and limited-life foundations, we find that roughly half of the foundations in each group have a charter that neither specifies perpetuity nor includes a sunset clause. Still, 34 percent of perpetual foundations have a charter that specifies perpetuity, compared with just 21 percent of limited-life foundations whose charter includes a sunset clause. Also, a smaller proportion of perpetual foundations than of limited life foundations have no formal charter (15 percent vs. 19 percent).
It is worth noting that a handful of perpetual and limited-life foundations have a charter that specifies a contrary choice: twelve perpetual foundations (2 percent) have a charter that includes a sunset clause, while six limited-life foundations (6 percent) have a charter that specifies perpetuity. These findings suggest that the by-laws of family foundations may be written in a way that allows flexibility should the founder change his mind while still alive or should the decision no longer make sense.
Undecided FoundationsNot surprisingly, foundations that are undecided are the most likely to have a charter that neither specifies perpetuity nor includes a sunset clause (69 percent). They are also the mostly likely not to have a formal charter (20 percent). Of the remaining foundations, about 8 percent have a charter that specifies perpetuity, compared with 4 percent whose charter has a sunset clause. It seems likely that these foundations may have expected to follow the founder’s intent, but as family circumstances or resources change they are not sure what to do.
Endnote1. By region foundations in the South, which boasts the largest proportion of perpetual
foundations, are the most likely to have a charter that specifi es perpetuity (29 percent), followed by those in the West (25 percent), while foundations in the Northeast are the least likely (18 percent). By age group, foundations formed in the latest two decades (since 1990) are less likely than those formed in the preceding two decades to have a charter that either specifi es perpetuity or that includes a sunset clause.
FIGURE 1-8 Family Foundation Charters1 and Lifespan Plans
SOURCE: The Foundation Center, Perpetuity or Limited Lifespan: How do Family Foundations Decide?, 2009.1Foundation charter information was not available for 65 respondents.
0% 20% 40% 60% 80% 100%
Foundation has no formal charter
Charter neither specifies perpetuity nor has a sunset clause
Charter has a sunset clause
Charter specifies perpetuity
UndecidedNo. = 259
PerpetuityNo. = 644
Limited LifespanNo. = 106
All Family FoundationsNo. = 1009
Percent of Respondents
TO WHAT EXTENT DO FAMILY FOUNDATION CHARTERS SPECIFY PERPETUITY OR LIMITED LIFESPAN?
Limited-Life Foundations 7
Limited-Life Foundations: Decision-making, Timeframe, Options, and Strategies
LimitedDecisionand Stra2
This chapter discusses fi ndings from survey questions that were addressed specifi cally to limited-life foundations to learn more about when the decision was made, what factors infl uenced the decision, and whether a timeframe was set for spending down and how this was determined; and, looking ahead, what option(s) the foundation may follow for spending down, any changes it is making in its operations and grantmaking strategies, and any external actions it is taking in preparation for spending down.
DECISION-MAKING: TIMEFRAME AND FACTORS
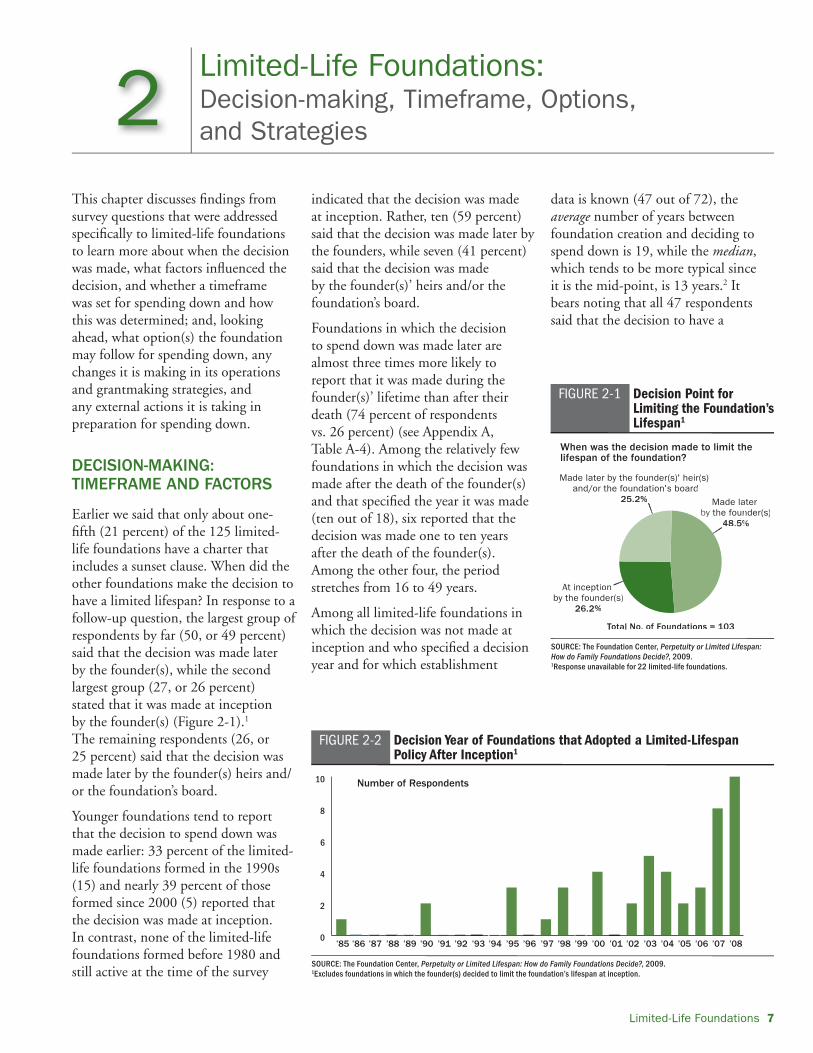
Earlier we said that only about one-fi fth (21 percent) of the 125 limited-life foundations have a charter that includes a sunset clause. When did the other foundations make the decision to have a limited lifespan? In response to a follow-up question, the largest group of respondents by far (50, or 49 percent) said that the decision was made later by the founder(s), while the second largest group (27, or 26 percent) stated that it was made at inception by the founder(s) (Figure 2-1).1 The remaining respondents (26, or 25 percent) said that the decision was made later by the founder(s) heirs and/or the foundation’s board.
Younger foundations tend to report that the decision to spend down was made earlier: 33 percent of the limited-life foundations formed in the 1990s (15) and nearly 39 percent of those formed since 2000 (5) reported that the decision was made at inception. In contrast, none of the limited-life foundations formed before 1980 and still active at the time of the survey
indicated that the decision was made at inception. Rather, ten (59 percent) said that the decision was made later by the founders, while seven (41 percent) said that the decision was made by the founder(s)’ heirs and/or the foundation’s board.
Foundations in which the decision to spend down was made later are almost three times more likely to report that it was made during the founder(s)’ lifetime than after their death (74 percent of respondents vs. 26 percent) (see Appendix A, Table A-4). Among the relatively few foundations in which the decision was made after the death of the founder(s) and that specifi ed the year it was made (ten out of 18), six reported that the decision was made one to ten years after the death of the founder(s). Among the other four, the period stretches from 16 to 49 years.
Among all limited-life foundations in which the decision was not made at inception and who specifi ed a decision year and for which establishment
data is known (47 out of 72), the average number of years between foundation creation and deciding to spend down is 19, while the median, which tends to be more typical since it is the mid-point, is 13 years.2 It bears noting that all 47 respondents said that the decision to have a
FIGURE 2-1 Decision Point for Limiting the Foundation’s Lifespan1
SOURCE: The Foundation Center, Perpetuity or Limited Lifespan: How do Family Foundations Decide?, 2009.1Response unavailable for 22 limited-life foundations.
Made later by the founder(s)' heir(s) and/or the foundation's board
25.2%
Total No. of Foundations = 103
When was the decision made to limit the lifespan of the foundation?
Made later by the founder(s)
48.5%
At inception by the founder(s)
26.2%
or the foundatioon sn s bo boarda25.5.2%2%
Total No.No. of o FoFoundundationsons = 103
MadM e laby yby bybyb thehet foun
488.4 5%
tioonn ndeer((s)s))s)%
FIGURE 2-2 Decision Year of Foundations that Adopted a Limited-Lifespan Policy After Inception1
SOURCE: The Foundation Center, Perpetuity or Limited Lifespan: How do Family Foundations Decide?, 2009.1Excludes foundations in which the founder(s) decided to limit the foundation’s lifespan at inception.
0
2
4
6
8
10
’85 ’86 ’87 ’88 ’89 ’90 ’91 ’92 ’93 ’94 ’95 ’96 ’97 ’98 ’99 ’00 ’01 ’02 ’03 ’04 ’05 ’06 ’07 ’08
Number of Respondents

8 Perpetuity or Limited Lifespan
limited lifespan was made after 1989 and the vast majority (38) said the decision was made after 1999 (Figure 2-2). (One additional foundation indicated the decision was made in 1985 and is included in the chart, but its establishment year is not known.) Moreover, in terms of an annual rate, the largest number of foundations by far made the decision in the two latest years—eight in 2007 and ten in the fi rst half of 2008—which suggests a growing trend.3
Factors Infl uencing the Decision to Limit the Foundation’s Lifespan
The survey asked foundations what motivated their decision to adopt a limited-lifespan policy. The responses differed depending on whether the decision was made at inception or at a later time.
When Made at Inception. When the limited-lifespan decision is made at inception, the factors that come into play largely refl ect the particular philosophy and desires of the founder(s). For example, among the 27 respondents in which the decision was made at inception, the two leading factors by far that drove the decision was the desire of the founder(s) to have
a greater impact during their lifetime(s) and to be directly involved in how the money is spent (Figure 2-3). More than nine out of ten respondents said that these factors infl uenced their decision, with more than three out of four indicating a very strong infl uence.
Other key factors cited widely by respondents include a desire to preserve philanthropic intent4 (89 percent), a belief that subsequent generations will create their own philanthropies (81 percent), and a belief that foundations are more effi cient when working within a limited lifespan (77 percent). Of these three factors, a desire to preserve philanthropic intent was cited by the largest proportion of respondents by far as having a strong infl uence (74 percent).
Interestingly, a majority of respondents indicated that two of the listed factors played no role in their decision to limit the foundation’s lifespan: a belief that tax-advantaged wealth should be given back faster (58 percent) and a belief that foundation dollars are worth more now than in the future (54 percent). Nevertheless, roughly one-sixth of respondents said that these factors infl uenced them a great deal.
When Made Later. When the decision to spend down is made later in the foundation’s life cycle, a wide range of family issues, personal beliefs of the founder(s) or their heirs and/or the board members, and internal and external factors may come
FIGURE 2-3 Factors Influencing the Decision Made at Inception to Spend Down
SOURCE: The Foundation Center, Perpetuity or Limited Lifespan: How do Family Foundations Decide?, 2009.
0% 20% 40% 60% 80% 100%
Not At All
Somewhat
Great Deal
Belief that tax-advantaged wealth should be given back fasterNo. = 26
Belief that foundation dollars are worth more now than in the futureNo. = 26
Belief that spending more foundation dollars now will have agreater impact than spending dollars more slowly over time
No. = 25
Belief that foundations are more efficientwhen working within a limited lifespan
No. = 26
Belief that subsequent generations will create theirown philanthropies to address future needs
No. = 26
Desire to preserve philanthropic intentNo. = 27
Desire to be directly involved in how the money is spentNo. = 26
Desire to have a greater impact during their lifetime(s)No. = 26
Percent of Respondents
❖ GRANTMAKERS ❖
SPEAK
“After a certain length of time, the donor’s wishes are so far in the past
that the organization needs to end.”
“Desire for founders and their children to make
direct impact.”
“Perpetual foundations become staff
bureaucracies.”
Limited-Life Foundations 9
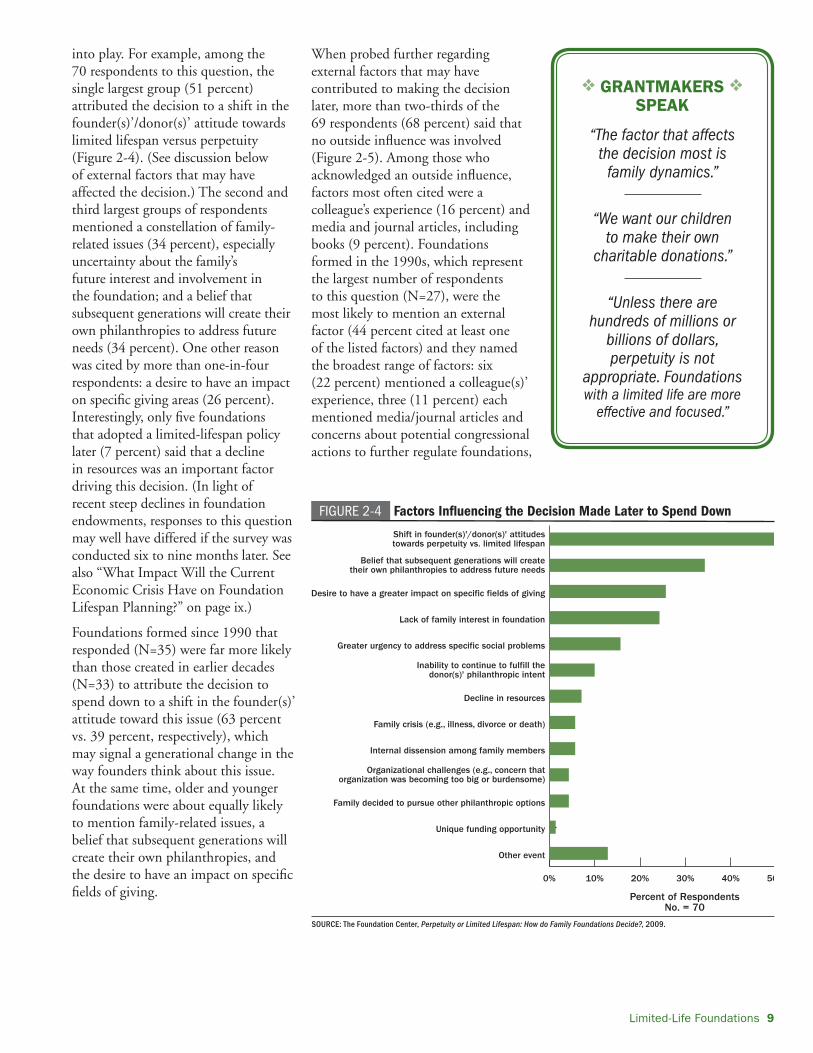
into play. For example, among the 70 respondents to this question, the single largest group (51 percent) attributed the decision to a shift in the founder(s)’/donor(s)’ attitude towards limited lifespan versus perpetuity (Figure 2-4). (See discussion below of external factors that may have affected the decision.) The second and third largest groups of respondents mentioned a constellation of family-related issues (34 percent), especially uncertainty about the family’s future interest and involvement in the foundation; and a belief that subsequent generations will create their own philanthropies to address future needs (34 percent). One other reason was cited by more than one-in-four respondents: a desire to have an impact on specifi c giving areas (26 percent). Interestingly, only fi ve foundations that adopted a limited-lifespan policy later (7 percent) said that a decline in resources was an important factor driving this decision. (In light of recent steep declines in foundation endowments, responses to this question may well have differed if the survey was conducted six to nine months later. See also “What Impact Will the Current Economic Crisis Have on Foundation Lifespan Planning?” on page ix.)
Foundations formed since 1990 that responded (N=35) were far more likely than those created in earlier decades (N=33) to attribute the decision to spend down to a shift in the founder(s)’ attitude toward this issue (63 percent vs. 39 percent, respectively), which may signal a generational change in the way founders think about this issue. At the same time, older and younger foundations were about equally likely to mention family-related issues, a belief that subsequent generations will create their own philanthropies, and the desire to have an impact on specifi c fi elds of giving.
When probed further regarding external factors that may have contributed to making the decision later, more than two-thirds of the 69 respondents (68 percent) said that no outside infl uence was involved (Figure 2-5). Among those who acknowledged an outside infl uence, factors most often cited were a colleague’s experience (16 percent) and media and journal articles, including books (9 percent). Foundations formed in the 1990s, which represent the largest number of respondents to this question (N=27), were the most likely to mention an external factor (44 percent cited at least one of the listed factors) and they named the broadest range of factors: six (22 percent) mentioned a colleague(s)’ experience, three (11 percent) each mentioned media/journal articles and concerns about potential congressional actions to further regulate foundations,
❖ GRANTMAKERS ❖
SPEAK
“The factor that affects the decision most is
family dynamics.”
“We want our children to make their own
charitable donations.”
“Unless there are hundreds of millions or
billions of dollars, perpetuity is not
appropriate. Foundations with a limited life are more
effective and focused.”
FIGURE 2-4 Factors Influencing the Decision Made Later to Spend Down
SOURCE: The Foundation Center, Perpetuity or Limited Lifespan: How do Family Foundations Decide?, 2009.
0% 10% 20% 30% 40% 50
Other event
Unique funding opportunity
Family decided to pursue other philanthropic options
Organizational challenges (e.g., concern thatorganization was becoming too big or burdensome)
Internal dissension among family members
Family crisis (e.g., illness, divorce or death)
Decline in resources
Inability to continue to fulfill thedonor(s)' philanthropic intent
Greater urgency to address specific social problems
Lack of family interest in foundation
Desire to have a greater impact on specific fields of giving
Belief that subsequent generations will createtheir own philanthropies to address future needs
Shift in founder(s)'/donor(s)' attitudestowards perpetuity vs. limited lifespan
Percent of RespondentsNo. = 70
10 Perpetuity or Limited Lifespan
and two (7 percent) each mentioned the recommendation of a consultant or advisor and participation in professional workshop(s). Incidentally, foundations in this age group were the only ones to mention participation in professional workshops or concerns about potential legislation.
TIMEFRAME FOR SPENDING DOWN
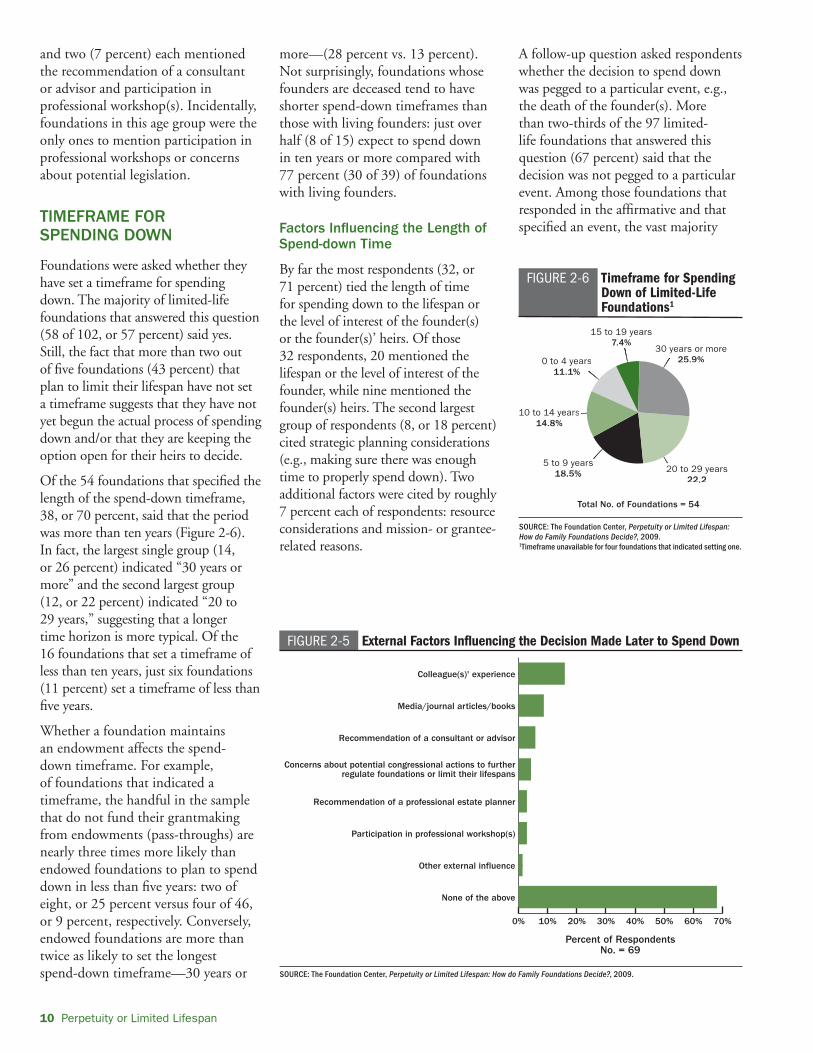
Foundations were asked whether they have set a timeframe for spending down. The majority of limited-life foundations that answered this question (58 of 102, or 57 percent) said yes. Still, the fact that more than two out of fi ve foundations (43 percent) that plan to limit their lifespan have not set a timeframe suggests that they have not yet begun the actual process of spending down and/or that they are keeping the option open for their heirs to decide.
Of the 54 foundations that specifi ed the length of the spend-down timeframe, 38, or 70 percent, said that the period was more than ten years (Figure 2-6). In fact, the largest single group (14, or 26 percent) indicated “30 years or more” and the second largest group (12, or 22 percent) indicated “20 to 29 years,” suggesting that a longer time horizon is more typical. Of the 16 foundations that set a timeframe of less than ten years, just six foundations (11 percent) set a timeframe of less than fi ve years.
Whether a foundation maintains an endowment affects the spend-down timeframe. For example, of foundations that indicated a timeframe, the handful in the sample that do not fund their grantmaking from endowments (pass-throughs) are nearly three times more likely than endowed foundations to plan to spend down in less than fi ve years: two of eight, or 25 percent versus four of 46, or 9 percent, respectively. Conversely, endowed foundations are more than twice as likely to set the longest spend-down timeframe—30 years or
more—(28 percent vs. 13 percent). Not surprisingly, foundations whose founders are deceased tend to have shorter spend-down timeframes than those with living founders: just over half (8 of 15) expect to spend down in ten years or more compared with 77 percent (30 of 39) of foundations with living founders.
Factors Infl uencing the Length of Spend-down Time
By far the most respondents (32, or 71 percent) tied the length of time for spending down to the lifespan or the level of interest of the founder(s) or the founder(s)’ heirs. Of those 32 respondents, 20 mentioned the lifespan or the level of interest of the founder, while nine mentioned the founder(s) heirs. The second largest group of respondents (8, or 18 percent) cited strategic planning considerations (e.g., making sure there was enough time to properly spend down). Two additional factors were cited by roughly 7 percent each of respondents: resource considerations and mission- or grantee-related reasons.
A follow-up question asked respondents whether the decision to spend down was pegged to a particular event, e.g., the death of the founder(s). More than two-thirds of the 97 limited-life foundations that answered this question (67 percent) said that the decision was not pegged to a particular event. Among those foundations that responded in the affi rmative and that specifi ed an event, the vast majority
FIGURE 2-5 External Factors Influencing the Decision Made Later to Spend Down
SOURCE: The Foundation Center, Perpetuity or Limited Lifespan: How do Family Foundations Decide?, 2009.
0% 10% 20% 30% 40% 50% 60% 70%
None of the above
Other external influence
Participation in professional workshop(s)
Recommendation of a professional estate planner
Concerns about potential congressional actions to furtherregulate foundations or limit their lifespans
Recommendation of a consultant or advisor
Media/journal articles/books
Colleague(s)' experience
Percent of RespondentsNo. = 69
FIGURE 2-6 Timeframe for Spending Down of Limited-Life Foundations1
SOURCE: The Foundation Center, Perpetuity or Limited Lifespan: How do Family Foundations Decide?, 2009.1Timeframe unavailable for four foundations that indicated setting one.
0 to 4 years11.1%
Total No. of Foundations = 54
15 to 19 years7.4%
10 to 14 years14.8%
5 to 9 years18.5% 20 to 29 years
22.2
30 years or more25.9%4 yearsrs
1.1%%
7.47.4%%
earrsss
9 yearsars8.5% 22020 toto 29 ye
22.2
30 03 yeayears or m25.5.9%

Limited-Life Foundations 11
cited the death of the founder(s) or their heir(s), followed by specifi c time or age limitations, such as “15 years from founding” or “age 75 of youngest member of 2nd generation.”
SPEND-DOWN PRACTICES: OPTIONS FOR SPENDING DOWN
The survey presented a broad range of possible options related to spending down—from closing down the foundation after spending out all assets to establishing endowments from which grantees could draw revenue—and asked respondents whether their foundation has decided which option(s) it will follow (Figure 2-7). (Several respondents mentioned more than one option.) Nearly half of the 102 respondents (48, or 47 percent) plan to close the foundation down after spending out all assets, while one-fourth (25, or 25 percent) plan to distribute the remaining assets to selected grantees. In addition, roughly 14 percent of respondents plan to distribute their assets directly to a donor-advised or other fund of a public charity and 9 percent plan to distribute their assets to a community foundation—mainly to donor-advised funds. A substantial 30 percent of respondents have not yet made a decision about how to spend down, presumably because they have not yet started the actual spend-down process. This fi nding on spend-down options supports an earlier fi nding that 43 percent of foundations have not yet set a timetable for spending down.
If foundations that responded “none” or “none yet” are excluded from the analysis, the response rates to the various options are stronger. For example, 64 percent of respondents plan to close the foundation down after spending out all assets, 33 percent plan to distribute the remaining assets to selected grantees, and 19 percent plan to distribute the remaining assets to a gift fund of a public charity.
SPEND-DOWN PRACTICES: CHANGES IN OPERATIONAL AND GRANTMAKING STRATEGIES
One of the main purposes of the survey was to learn how family foundations approach the process of spending down: that is, what changes are they making in operational and grantmaking strategies and what external actions are they taking in preparation for spending down. A series of questions addressed these issues. The relatively low response rate to these questions and the nature of the responses underscore the fact that many foundations that have made the decision to have a limited lifespan have not yet started the process of spending down.
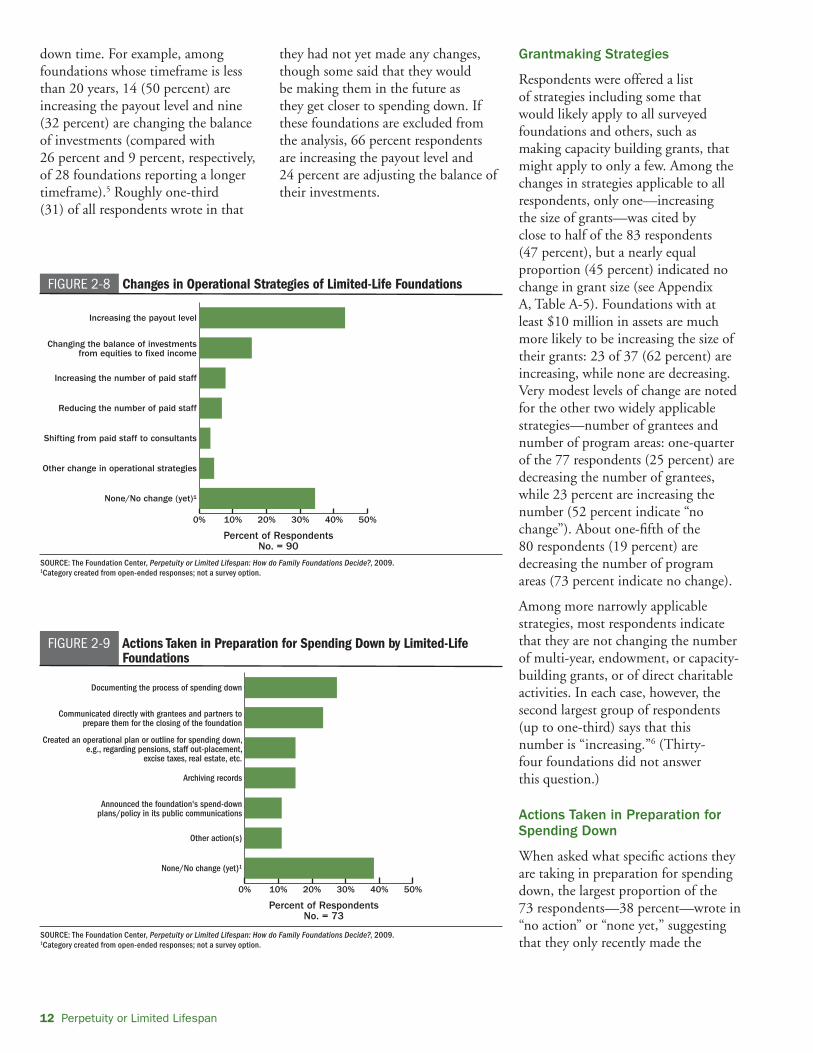
Operational Strategies
The most frequently cited change by far in the operations of limited-life foundations is increasing the payout level: of 90 respondents, 39 (more than four out of ten) are paying out at higher levels and the proportion increases to six-
in-ten foundations having at least $50 million in assets (Figure 2-8). The only other option cited by more than one-tenth of respondents (16 percent) is “changing the balance of investments from equities to fi xed income.” Response levels for these two options vary by length of spend-
FIGURE 2-7 Options for Spending Down of Limited-Life Foundations
SOURCE: The Foundation Center, Perpetuity or Limited Lifespan: How do Family Foundations Decide?, 2009.
0% 10% 20% 30% 40% 50% 60%
Other option
Distribute remaining assets to a public charity—donor-advised fund(s), e.g., charitable gift funds
established by commercial institutions
Distribute remaining assets to acommunity foundation—other/unrestricted funds
Establish endowments from which selected granteescould draw revenue
Distribute remaining assets to acommunity foundation—donor advised fund(s)
Distribute remaining assets into other private foundation
Distribute remaining assets to a public charity—other funds, e.g., university, religious organization, etc.
Distribute remaining assets to selected grantees
No decision has been made
Close foundation after spending out all assets
Percent of RespondentsNo. = 102
❖ GRANTMAKERS ❖
SPEAK
“[We are] more focused geographically and programmatically.”
“Much of the [director’s] time is spent in mentoring, convening, serving on community boards, and advising
nonprofits.”
“Too soon—ideas are just on the drawing board.”
12 Perpetuity or Limited Lifespan
down time. For example, among foundations whose timeframe is less than 20 years, 14 (50 percent) are increasing the payout level and nine (32 percent) are changing the balance of investments (compared with 26 percent and 9 percent, respectively, of 28 foundations reporting a longer timeframe).5 Roughly one-third (31) of all respondents wrote in that
they had not yet made any changes, though some said that they would be making them in the future as they get closer to spending down. If these foundations are excluded from the analysis, 66 percent respondents are increasing the payout level and 24 percent are adjusting the balance of their investments.
Grantmaking Strategies
Respondents were offered a list of strategies including some that would likely apply to all surveyed foundations and others, such as making capacity building grants, that might apply to only a few. Among the changes in strategies applicable to all respondents, only one—increasing the size of grants—was cited by close to half of the 83 respondents (47 percent), but a nearly equal proportion (45 percent) indicated no change in grant size (see Appendix A, Table A-5). Foundations with at least $10 million in assets are much more likely to be increasing the size of their grants: 23 of 37 (62 percent) are increasing, while none are decreasing. Very modest levels of change are noted for the other two widely applicable strategies—number of grantees and number of program areas: one-quarter of the 77 respondents (25 percent) are decreasing the number of grantees, while 23 percent are increasing the number (52 percent indicate “no change”). About one-fi fth of the 80 respondents (19 percent) are decreasing the number of program areas (73 percent indicate no change).
Among more narrowly applicable strategies, most respondents indicate that they are not changing the number of multi-year, endowment, or capacity-building grants, or of direct charitable activities. In each case, however, the second largest group of respondents (up to one-third) says that this number is “increasing.”6 (Thirty-four foundations did not answer this question.)
Actions Taken in Preparation for Spending Down
When asked what specifi c actions they are taking in preparation for spending down, the largest proportion of the 73 respondents—38 percent—wrote in “no action” or “none yet,” suggesting that they only recently made the
FIGURE 2-8 Changes in Operational Strategies of Limited-Life Foundations
SOURCE: The Foundation Center, Perpetuity or Limited Lifespan: How do Family Foundations Decide?, 2009.1Category created from open-ended responses; not a survey option.
0% 10% 20% 30% 40% 50%
None/No change (yet)¹
Other change in operational strategies
Shifting from paid staff to consultants
Reducing the number of paid staff
Increasing the number of paid staff
Changing the balance of investmentsfrom equities to fixed income
Increasing the payout level
Percent of RespondentsNo. = 90
FIGURE 2-9 Actions Taken in Preparation for Spending Down by Limited-Life Foundations
SOURCE: The Foundation Center, Perpetuity or Limited Lifespan: How do Family Foundations Decide?, 2009.1Category created from open-ended responses; not a survey option.
0% 10% 20% 30% 40% 50%
None/No change (yet)¹
Other action(s)
Announced the foundation's spend-downplans/policy in its public communications
Archiving records
Created an operational plan or outline for spending down,e.g., regarding pensions, staff out-placement,
excise taxes, real estate, etc.
Communicated directly with grantees and partners toprepare them for the closing of the foundation
Documenting the process of spending down
Percent of RespondentsNo. = 73

Limited-Life Foundations 13
decision to limit their lifespan and/or have not yet started the spend-down process (Figure 2-9).7 About a quarter of limited-life foundations are documenting the process of spending down (27 percent) and/or communicating with grantees and partners about their plans to prepare them for the closing of the foundation (23 percent). Just eight limited-life foundations (11 percent) have publicly announced their plans, while eleven (15 percent) have either created an operational plan for spending down or started archiving records. Not surprisingly, response rates to these options tend be higher for larger foundations, which have the infrastructure and staff needed to carry out these actions.
Because so many limited-life foundations have yet to set a timeframe for spending down, it is not surprising that relatively few of them have taken specifi c actions to prepare. But even among the 45 respondents that have set a timeframe for spending down, just 36 percent have communicated directly with grantees and partners about their plans and just 31 percent are documenting the process. More than one-quarter (29 percent) have taken no action yet and just 16 percent have announced the foundation’s spend-down plans.
Levels of response to nearly all options are higher for foundations that plan to spend down sooner. For example, of the 13 foundations whose spend-down timeframe is fewer than ten years, 54 percent have communicated directly with grantees and partners, 39 percent are documenting the process, 31 percent have created an operational plan, and 23 percent have announced the foundation’s plans to spend down. Yet, even with less than ten years to go, nearly one-in-four respondents (23 percent) have not yet taken any actions in preparation for spending down.
Endnotes1. This group includes the 13 foundations mentioned earlier
whose charters have a sunset clause and 14 others whose founding documents do not specify limited life.
2. Including those foundations in which the decision was made at inception—counted as zero years—the average number of years is twelve and the median is seven.
3. The fact that four foundations made the decision in 2000, which represents the peak year for foundation assets through 2004, that none made the decision in 2001—the year of the post-9-11 stock market meltdown, and that just two did so in 2002 when the market was still recovering, suggests that the status of the economy does not play a dominant role in deciding to limit the foundation’s lifespan.
4. Philanthropic intent includes donor intent broadly speaking and also intent to preserve mission.
5. Of the 51 foundations that answered this question and that also indicated a spend-down timeframe, 28 plan to spend out in less than 20 years while 23 plan to spend out over more than 20 years.
6. Of the 57 foundations that indicated whether they were changing the number of grants awarded to build capacity of grantees, 33 percent said that the number was increasing (61 percent said “no change”). Larger spend-down foundations are more likely to increase the number of capacity-building grants: 42 percent of the 27 responding foundations with assets of at least $10 million indicated an increase, compared with 27 percent of the 30 smaller foundations.
7. If the 28 foundations that indicated “no action” are excluded from the analysis, 44 percent of respondents are documenting the process of spending down, 38 percent have communicated directly with grantees and partners, and 24 percent each have created an operational plan and are archiving records.
❖ GRANTMAKERS ❖
SPEAK
“[We are] working with a lawyer who is well
versed in the process; [we] changed the
by-laws to reflect the termination plan.”
“[We developed] financial targets and projections.”
“We will not announce sunsetting prior to
termination and open the floodgates.”


Perpetual Foundations 15
Perpetual Foundations: Decision-making and Consideration of Alternatives to Perpetuity
PerpetuDecisionAlternati3
As reported earlier, 676 of the 1,074 active U.S. family foundations that responded to a 2008 survey (63 percent) plan to exist in perpetuity. In general, perpetual foundations are older and larger than limited-life foundations; they are more likely to be endowed and less likely to have living donors. While just 34 percent of perpetual foundations have a charter that specifi es perpetuity, roughly half have a charter that neither specifi es perpetuity nor includes a sunset clause and 15 percent have no formal charter. In this chapter, we examine the framework of lifespan decision-making in perpetual foundations, i.e., was a formal decision made, when was it made, and what factors infl uenced the decision to exist in perpetuity; and we probe whether the foundation has ever considered other options, what led to these considerations, and how likely is it that the foundation will explore alternatives in the future.
DECISION-MAKING1
Just a over half of perpetual foundations (349, or 57 percent) have made a formal decision to exist in perpetuity.2 Apparently, among the remaining 43 percent of respondents, perpetuity is considered the norm. The largest perpetual foundations—those with assets of $50 million or more—are the most likely to have made a formal decision: 71 percent of respondents with assets greater than $250 million and 65 percent of those with assets between $50 million and $250 million responded “yes” or indicated their charter specifi es perpetuity, compared with 55 percent of small- to mid-sized foundations (Figure 3-1).3
It is worth noting that the relatively few perpetual foundations formed since 2000 (83) are much more likely than those formed in earlier periods to have made a formal decision (74 percent vs. between 44 percent and 56 percent). Consistent with this fi nding, having a living donor also increases the likelihood that a perpetual foundation will have made a formal decision to exist in perpetuity (63 percent vs. 53 percent). Given the higher rates of foundation formation in the West and South in recent decades, it is not surprising that by region, Western respondents are the most likely to have made a formal decision (65 percent), followed by those in the South (60 percent). In contrast, about one-half of Midwestern and Northeastern foundations have made a formal decision.
Timing of the Decision
Perpetual foundations that made a formal decision to exist in perpetuity were asked when the decision was
made. Among the 341 respondents, 276 (81 percent) said that the decision was made at inception by the founder(s) (Figure 3-2).4 Of the 19 percent of foundations that made the decision later, 5 percent said that it was
FIGURE 3-1 Percent of Perpetual Family Foundations That Made a Formal Decision to Exist in Perpetuity by Asset Size1
SOURCE: The Foundation Center, Perpetuity or Limited Lifespan: How do Family Foundations Decide?, 2009.1Includes perpetual foundations that made a formal decision or whose charter specifies perpetuity; formal decision information unavailable for 61 foundations; asset amount unavailable for ten foundations.
0%
20%
40%
60%
80%
Less than$1 millionNo. = 40
$1 million–$5 millionNo. = 152
Percent of Respondents
$5 million–$10 millionNo. = 105
$10 million–$25 millionNo. = 139
$25 million–$50 million
No. = 69
$50 million–$250 million
No. = 76
More than$250 million
No. = 24
AllNo. = 615
FIGURE 3-2 Decision Point for Deciding to Exist in Perpetuity
SOURCE: The Foundation Center, Perpetuity or Limited Lifespan: How do Family Foundations Decide?, 2009.1Includes 212 foundations whose charter specifies perpetuity and 64 foundations whose charter does not specify perpetuity or that do not have a charter but who said that the decision was made at inception.
Made later by the founder(s)’
heir(s) and/or the foundation’s board
13.8%
Made later bythe founder(s)
5.3%
Total No. of Foundations = 341
At inception by the founder(s)¹
80.9%
nd/or then’s boardard.8%
Total No.No of o FoFoundundationsons = 341
At A inceptiotheeth fo f unde
8080.9%
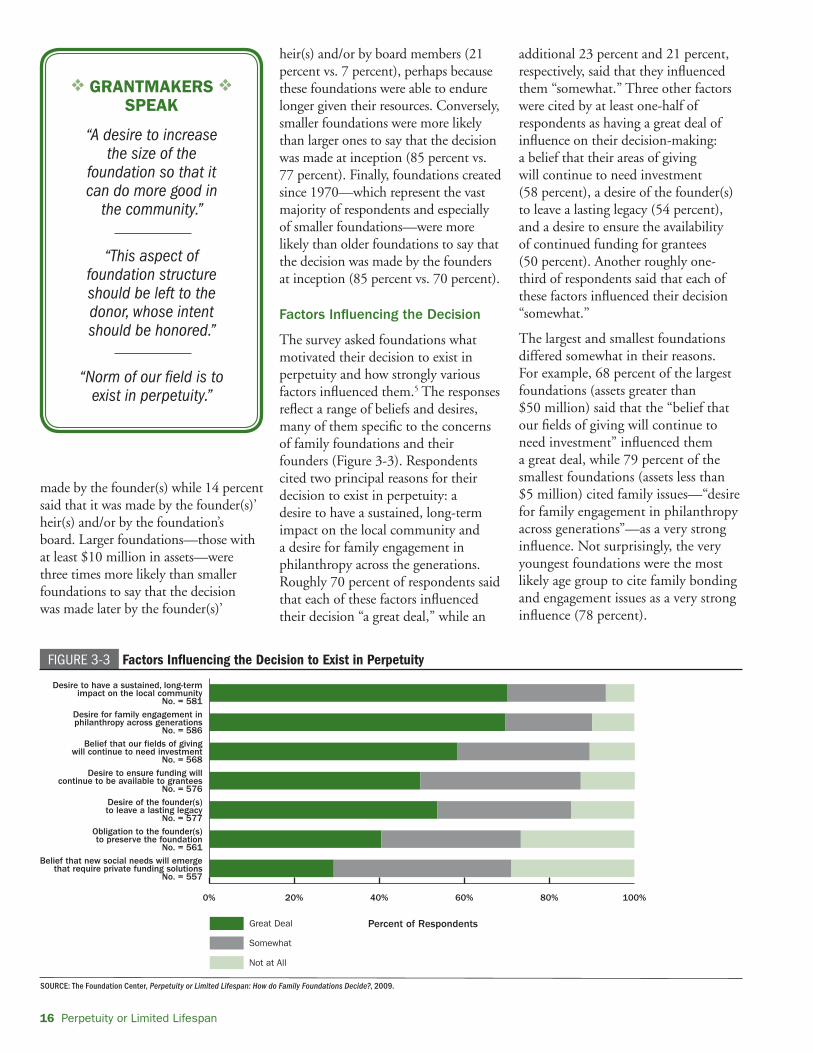
16 Perpetuity or Limited Lifespan
made by the founder(s) while 14 percent said that it was made by the founder(s)’ heir(s) and/or by the foundation’s board. Larger foundations—those with at least $10 million in assets—were three times more likely than smaller foundations to say that the decision was made later by the founder(s)’
heir(s) and/or by board members (21 percent vs. 7 percent), perhaps because these foundations were able to endure longer given their resources. Conversely, smaller foundations were more likely than larger ones to say that the decision was made at inception (85 percent vs. 77 percent). Finally, foundations created since 1970—which represent the vast majority of respondents and especially of smaller foundations—were more likely than older foundations to say that the decision was made by the founders at inception (85 percent vs. 70 percent).
Factors Infl uencing the Decision
The survey asked foundations what motivated their decision to exist in perpetuity and how strongly various factors infl uenced them.5 The responses refl ect a range of beliefs and desires, many of them specifi c to the concerns of family foundations and their founders (Figure 3-3). Respondents cited two principal reasons for their decision to exist in perpetuity: a desire to have a sustained, long-term impact on the local community and a desire for family engagement in philanthropy across the generations. Roughly 70 percent of respondents said that each of these factors infl uenced their decision “a great deal,” while an
additional 23 percent and 21 percent, respectively, said that they infl uenced them “somewhat.” Three other factors were cited by at least one-half of respondents as having a great deal of infl uence on their decision-making: a belief that their areas of giving will continue to need investment (58 percent), a desire of the founder(s) to leave a lasting legacy (54 percent), and a desire to ensure the availability of continued funding for grantees (50 percent). Another roughly one-third of respondents said that each of these factors infl uenced their decision “somewhat.”
The largest and smallest foundations differed somewhat in their reasons. For example, 68 percent of the largest foundations (assets greater than $50 million) said that the “belief that our fi elds of giving will continue to need investment” infl uenced them a great deal, while 79 percent of the smallest foundations (assets less than $5 million) cited family issues—“desire for family engagement in philanthropy across generations”—as a very strong infl uence. Not surprisingly, the very youngest foundations were the most likely age group to cite family bonding and engagement issues as a very strong infl uence (78 percent).
FIGURE 3-3 Factors Influencing the Decision to Exist in Perpetuity
SOURCE: The Foundation Center, Perpetuity or Limited Lifespan: How do Family Foundations Decide?, 2009.
0% 20% 40% 60% 80% 100%
Not at All
Somewhat
Great Deal
Belief that new social needs will emergethat require private funding solutions
No. = 557
Obligation to the founder(s)to preserve the foundation
No. = 561
Desire of the founder(s)to leave a lasting legacy
No. = 577
Desire to ensure funding willcontinue to be available to grantees
No. = 576
Belief that our fields of givingwill continue to need investment
No. = 568
Desire for family engagement inphilanthropy across generations
No. = 586
Desire to have a sustained, long-termimpact on the local community
No. = 581
Percent of Respondents
❖ GRANTMAKERS ❖
SPEAK
“A desire to increase the size of the
foundation so that it can do more good in
the community.”
“This aspect of foundation structure should be left to the donor, whose intent should be honored.”
“Norm of our field is to exist in perpetuity.”

Perpetual Foundations 17
CONSIDERATION OF ALTERNATIVES TO PERPETUITY
The vast majority of perpetual foundations (77 percent) have never considered options other than perpetuity. In this respect, they differ sharply from the majority of undecided foundations that have considered other options (see Chapter 4).6 As mentioned earlier, perpetuity appears to be considered the norm by many family foundations.
At least 70 percent of perpetual foundations of all sizes have never considered alternatives to perpetuity, with the very largest foundations—those with assets in excess of $250 million—the least likely to have considered other options (12 percent) (Figure 3-4). It bears noting that other characteristics examined such as age, geographic location, and whether a foundation employs paid staff have only a minor effect on whether a perpetual foundation has considered other options.7 For example, 79 percent of perpetual foundations formed before 1970 have never considered other options, compared with 74 percent formed over the past two decades.
Factors Leading to a Consideration of Alternatives
Although only 23 percent of perpetual foundations (151) have considered alternatives to perpetuity at some time, they provide an interesting perspective on the reasons why these family foundations might consider a limited lifespan. Uncertainty about the level of family interest in the foundation, desire to preserve the donor(s)’ philanthropic intent, and shift in donor(s)’ attitudes toward perpetuity versus limited lifespan are the three leading reasons cited, though only one-fi fth to one-fourth of respondents cited them.8 In addition, about one-sixth of respondents cited new foundation leadership (17 percent) and a decline in resources (16 percent).
Future Plans
Just as a large majority of perpetual foundations (77 percent) have never before considered alternatives to perpetuity, most are unlikely to do so in the future (73 percent). And among the 164 perpetual foundations that have left the door open to possible alternatives down the road, the response is fairly tepid: only 3 percent (19 foundations) are “very likely” to consider other options compared with 24 percent (155 foundations) that are “somewhat likely.” Nevertheless, these fi ndings suggest that, driven mainly by family issues and a desire to preserve donor intent, a small percentage of the foundations that currently expect to exist in perpetuity may decide to change their course in the future. These foundations may also perceive a shift in attitude toward the practice of spending down among family members.
Endnotes1. 615 of 676 perpetual foundations (91 percent) either
answered the question, “Was a formal decision made to exist in perpetuity?” or had responded in the preceding question that their charter specifi es perpetuity (the latter were instructed to skip the next question). In this analysis, the respondents who said that their charter specifi es perpetuity are included with those that said they had made a formal decision to exist in perpetuity and with those that answered “at inception” to a follow-up question about when the perpetuity decision was made (for information about how to access the survey questionnaires, see Appendix B: Methodology).
2. This group includes 216 foundations whose charter specifi es perpetuity and 131 foundations whose charter does not specify perpetuity but in which a formal decision was made to exist in perpetuity.
3. Interestingly, while smaller foundations overall were less likely to say that a formal decision was made, this did not hold true for the very smallest foundations in the sample: 68 percent of respondents with assets less than $1 million and 67 percent of those giving less than $100,000 in the latest year said that a formal decision was made to exist in perpetuity.
4. Includes 212 foundations whose charter specifi es perpetuity and 64 whose charter does not specify perpetuity or that do not have a charter.
5. For this question no distinction was made between perpetual foundations in which the decision was made at inception or later in their life cycle; only one set of responses was offered.
6. Sixty-one percent of undecided foundations have considered other options.
7. One exception is operating as a pass-through foundation: 39 percent of the 23 pass-through foundations that expect to exist in perpetuity and that responded to the “other options” question said they have considered alternatives to perpetuity, compared with 22 percent of endowed foundations.
8. These options were cited by 24 percent, 23 percent and 20 percent, respectively, of respondents.
FIGURE 3-4 Foundations That Have Considered Alternatives to Perpetuity by Asset Size1
SOURCE: The Foundation Center, Perpetuity or Limited Lifespan: How do Family Foundations Decide?, 2009.1Asset amount unavailable for ten foundations; consideration of alternatives information unavailable for 20 foundations
0%
10%
20%
30%
40%
Less than$1 millionNo. = 46
$1 million–$5 millionNo. = 157
Percent of Respondents
$5 million–$10 millionNo. = 114
$10 million–$25 millionNo. = 143
$25 million–$50 million
No. = 75
$50 million–$250 million
No. = 86
More than$250 million
No. = 25
AllNo. = 656
❖ GRANTMAKERS ❖
SPEAK
“[We are] running out of family members
to continue into perpetuity.”
“Good strategic planning—evaluating
all options.”
“I heard of others spending out.”


Undecided Foundations 19
Undecided Foundations: Consideration of Alternatives to PerpetuityUndeciConside4
One-in-four family foundation respondents to the 2008 survey (273, or 25 percent) are currently undecided as to whether they will exist in perpetuity or have a limited lifespan. Some have not yet discussed this issue, others have not yet come to a decision, and many are simply uncertain about the family’s future involvement in the foundation.1
This chapter explores whether family foundations that are currently undecided have ever considered alternatives to perpetuity, what led to these considerations, and whether they are likely to consider other options in the future. These questions help us understand whether being undecided is essentially a default position. In other words, do foundations that have not yet made a formal decision about the future consider perpetuity the norm or are they open to another path?
HOW MANY UNDECIDED FOUNDATIONS HAVE CONSIDERED OTHER OPTIONS?
Interestingly, a large majority of “undecided” foundations (157, or 59 percent) have at some time considered limiting the foundation’s lifespan, compared with just 23 percent of perpetual foundations (Figure 4-1). At least one-half to two-thirds of the undecided foundations in every age group and of every asset size have considered alternatives to perpetuity. (Among those holding $50 million or more in assets, the share rises to 70 percent.) Similarly, a solid majority of undecided foundations in every region have considered other options, led by foundations in the West
(65 percent). These fi ndings reveal a distinct openness to the limited lifespan option for a substantial cross-section of family foundations that are currently undecided. Apparently, “undecided” status should not necessarily be construed as a default position or as just a stage in the path toward perpetuity.
FACTORS LEADING TO THE CONSIDERATION OF ALTERNATIVES
Similar to perpetual foundations, undecided foundations that said that they had considered alternatives to perpetuity were asked a follow-up question concerning what led to these considerations.2 Uncertainty about the level of family interest in the foundation and a shift in founder(s)’/ donor(s)’ attitudes towards perpetuity versus limited lifespan (which suggests a possible external infl uence) were the two leading reasons why undecided foundations have considered other options (Figure 4-2). About two out of fi ve respondents cited these factors. Only one other option—desire to preserve donor(s)’ philanthropic intent--was mentioned by close to one-in-fi ve respondents. At least one-in-ten undecided foundations cited new foundation leadership, a decline in resources, greater urgency to address social problems, and organizational challenges as causes for considering the limited-lifespan option.
Compared with foundations that plan to exist in perpetuity, undecided foundations were much more likely to mention family issues, especially uncertainty about family interest in the foundation (41 percent vs. 25 percent)
FIGURE 4-1 Percent of Undecided vs. Perpetual Foundations that have Considered Alternatives to Perpetuity
SOURCE: The Foundation Center, Perpetuity or Limited Lifespan: How do Family Foundations Decide?, 2009.
Yes
No
0%
20%
40%
60%
80%
100%
UndecidedNo. = 264
PerpetualNo. = 656
77.0%
23.0%
40.5%
59.5%
❖ GRANTMAKERS ❖
SPEAK
“We have discussed the perpetuity question
as something we need to consider if the next generation
isn’t interested in the foundation.”
“We have decided on an intermediate path…to commit to perpetuity until 2038 (50 years)
and then have the current board make
a decision.”

20 Perpetuity or Limited Lifespan
and twice as likely to mention a change in the donor(s)’ attitudes toward perpetuity versus limited lifespan (40 percent vs. 20 percent) as reasons for considering other options. They were a little less likely to cite a desire to preserve the donor(s)’ philanthropic intent (19 percent vs. 23 percent).
FUTURE PLANS
Regardless of whether they have considered alternatives to perpetuity in the past, undecided foundations were asked whether they were likely to do so in the future. Nearly four out of fi ve undecided foundations (78 percent) expect to consider the limited-lifespan option in the future (Figure 4-3). This proportion is greater than the three-in-fi ve foundations that said they did so at some earlier time and is three times greater compared with the fi ndings on perpetual foundations. Expectations are more muted, however, when degree of likelihood is taken into account. Just 15 percent of respondents (38) said they were “very likely” to explore other options compared with 63 percent (164) that were “somewhat likely.” Still, based on these fi ndings it seems reasonable to project that as many as 15 percent of family foundations that are currently undecided about their lifespan may decide to spend down in the future. It also makes sense that as foundations age and as more founders of family foundations created in the 1980s and 1990s pass the reins to
subsequent generations, family issues will play an increasingly important role in deliberations over lifespan planning choices.
Endnotes1. The vast majority of undecided foundations have a charter
that neither specifi es perpetuity nor includes a sunset clause (69 percent) or do not have a formal charter (20 percent) (see also Figure 1-8). Another 8 percent have a charter that specifi es perpetuity while 4 percent have a charter that includes a sunset clause. As noted earlier, it seems likely that these foundations expected to follow the founder(s)’ intent but changes in family circumstances or in resources makes them uncertain about the future.
2. 146 of the 157 undecided foundations (93 percent) that answered “yes” to the question “Has the foundation ever considered options other than existing in perpetuity?” also answered a follow-up question on what led to these considerations (for information about how to access the survey questionnaires, see Appendix B: Methodology).
FIGURE 4-3 Future Plans of Undecided Foundations Regarding Alternatives to Perpetuity
SOURCE: The Foundation Center, Perpetuity or Limited Lifespan: How do Family Foundations Decide?, 2009.
Not likely 22.3%
Very likely14.6%
Total No. of Foundations = 260
Somewhat likely 63.1%
eely %%
14.6%
Total No.No off o Fo Foundund tationsons = 260
SomSo ewhat 63.1%
FIGURE 4-2 Factors that Led to the Consideration of Alternatives to Perpetuity by Undecided Foundations
SOURCE: The Foundation Center, Perpetuity or Limited Lifespan: How do Family Foundations Decide?, 2009.1Response generated from “other” open-ended responses; not a survey option.
0% 10% 20% 30% 40% 50%
Other
Strategic planning, considerations¹
Unique funding opportunity
Family crisis
Change in mission or focus
Desire to have greater impact on specific field of giving
Organizational challenges (e.g. concern that organizationwas becoming too big or burdensome)
Greater urgency to address social problems
Decline in resources
New foundation leadership
Desire to preserve donor(s)' philanthropic intent
Shift in founder(s)'/donor(s)' attitudestowards perpetuity vs. limited lifespan
Lack of family interest in foundation
Percent of RespondentsNo. = 146

Attitudes toward Lifespan Choices 21
While the main thrust of the survey focused on the practices of individual foundations related to lifespan planning, a few attitudinal and opinion questions were included to gauge current thinking on the issue of limited lifespan vs. perpetuity for the fi eld overall. These questions asked about the advantages and disadvantages of these two lifespan choices and whether there has been a change in recent years in the foundation fi eld’s receptivity toward limited lifespan.
ADVANTAGES AND DISADVANTAGES OF LIMITED-LIFE AND PERPETUAL FOUNDATIONS
Survey respondents were asked what they think are the main advantages and disadvantages of the lifespan choice they have decided to follow. Specifi cally, limited-life foundations were asked to describe the advantages and disadvantages of having a limited lifespan, while perpetual and undecided foundations (which completed the “Perpetuity” version of the survey) were asked to describe the advantages and disadvantages of existing in perpetuity. To elicit the broadest range of opinions and attitudes, these questions were open-ended. The responses were subsequently reviewed and categorized to enable us to match similar answers, calculate frequency counts, and compare responses, as possible, across the respondent groups. Since not all respondents opted to write in a response, the percentages cited below for various advantages and disadvantages may not be representative of the survey sample overall.
Limited-Life Foundations
Advantages of a limited lifespan:1 For more than two out of fi ve respondents (41 percent) the leading advantage of a limited lifespan is the ability to honor donor intent and preserve the founder’s vision and level of engagement. A second tier of advantages based on share of respondents includes the ability to strategically focus and achieve greater impact (29 percent), concerns about family-related issues, e.g., not wanting to burden future generations with maintaining the foundation (19 percent), and a belief that there is greater effi ciency when foundations limit their lifespan (15 percent). Smaller shares of respondents cited diminishing resources (5 percent) and a belief that future generations should be free to establish their own philanthropies (5 percent).
Disadvantages:2 Three-fourths of the foundations that plan to spend down (75 percent) do not see any disadvantages to this option. Disadvantages cited by the largest percentages of respondents include three areas of concern: future generations will miss out on the opportunity to engage in philanthropy (7 percent), it is hard to spend out and maintain quality and/or effi ciency (6 percent), and grantees will have diffi culties bridging the gap in funding if the foundation ceases operations (5 percent).
Perpetual Foundations
Advantages of perpetuity:3 Nearly two-in-fi ve perpetual foundations (38 percent) cited family-related advantages, such as engagement across generations, training in philanthropy,
Attitudes toward Lifespan Choices: Limited Lifespan vs. PerpetuityAttitudeLimited 5
❖ GRANTMAKERS SPEAK ❖
“More foundations are considering [limited lifespan] but there are not more foundations actually implementing it.”
“[The] reason for the limited life [debate] is that too many foundations today are…pursuing goals or policies that the founders would likely consider counter to original intent.”
“I don’t believe this [survey] captures the essence of the issues at all. It has much more to do with [the] abuses
of large foundations, change of intent and focus over time, the inherent difference between volunteer and paid
staff foundations, and…increased paperwork requirements both at the Federal and State level.”

22 Perpetuity or Limited Lifespan
shared responsibility, and family unity. The second-most important advantage, cited by 32 percent of respondents, was the ability to meet the long-term needs of people and causes assisted by the foundation’s grantmaking. Of those who stated the importance of meeting long-term needs, the largest percentage specifi cally mentioned the
needs of their community (13 percent of all respondents), while the second largest subgroup (10 percent of all respondents) mentioned a particular issue or cause. Other advantages cited by at least one-in-ten respondents include: having a long-term impact, leaving a lasting legacy, and following the wishes (intent) of the founder(s).
Disadvantages:4 Interestingly, perpetual foundations were more likely to see the downsides to perpetuity than limited-life foundations were to see downsides to spending down. Still, the largest group of perpetual foundations (38 percent) indicated that there was no disadvantage to existing in perpetuity. The disadvantages cited by the most respondents were related to family issues—e.g., uncertainty about family members’ future commitment to the foundation (21 percent)—and divergence from the donor’s original intent, or “mission creep” (15 percent). A wide range of other disadvantages and concerns were mentioned by smaller groups of respondents, including future operational challenges (8 percent), future leadership issues (7 percent), limitations on the foundation’s impact due to payout constraints (7 percent), and the potential shrinking of resources available to carry out the foundation’s mission (7 percent).
Undecided Foundations
Advantages of perpetuity:5 Like perpetual foundations, the largest group of undecided foundations (46 percent) mentioned family-related advantages. Meeting the long-term needs of grantees and having a continued impact were both cited as advantages by 17 percent of respondents. Of the 25 foundations that mentioned meeting long-term needs, nine specifi ed funding for a specifi c issue and six wrote about changing or future needs. All of the other advantages listed, such as leaving a legacy, honoring donor intent, and the ability to continue to support grantees, were cited by fewer than 10 percent of undecided respondents.
Disadvantages:6 Undecided foundations were much more likely than perpetual foundations to mention disadvantages to perpetuity and larger shares of undecided foundations cited particular disadvantages. The greatest proportion of undecided respondents (40 percent) indicated that family-related issues, especially uncertainty as
Advantages of Spending Down
“ ◆ Our concern is in ensuring that the intent of the donor is realized. We are the last generation to have known the donors so it seems timely to spend down the assets.”
“Founders are able to make changes ◆
in their own lifetimes, making the decisions of whom and how to fund. A limited lifespan gives the next generation the ability to establish their own philanthropy.”
“Not burdening the successor ◆
generations with the responsibility for continuing to run the foundation.”
“To be able to address current social ◆
needs with greater impact and larger grants”
“One advantage is the ability to ◆
strategically focus. However, there is nothing inherent in a limited lifespan that requires this and nothing prohibiting it in a foundation in perpetuity.”
“We hope by helping people out of ◆
poverty today that future generations will be better off and not need as much help.”
“The foundation can spend the money ◆
now to help struggling organizations rather than reducing the amount of grants to preserve the corpus.”
“Trustees do not have the same ◆
goals and commitments as the founding fathers (two brothers) have.”
“Our assets are insufficient to ◆
continue as a stand-alone private foundation.”
Disadvantages of Spending Down
“A family foundation represents ◆
the founders’ charitable objectives. Limiting the lifespan of the foundation also limits the time for implementing the founders’ objectives.”
“Future generations of the founder’s ◆
family will not have the experience of making significant grants.”
“The worthwhile grantees that we ◆
have supported will need to identify new funders. In many cases, we took risks that others were unable or unwilling to take. Helping grantees bridge this gap is of great concern.”
“It’s hard to spend out and maintain ◆
quality.”
“Declining community profile status ◆
of the directors, all of whom are the children of the Founder.”
“It’s hard to retain personnel.” ◆
“Grantees will have to adjust to our ◆
absence, which won’t be easy for many, even with ten years of planning and preparation.”
PERSPECTIVES: Limited-Life Foundations
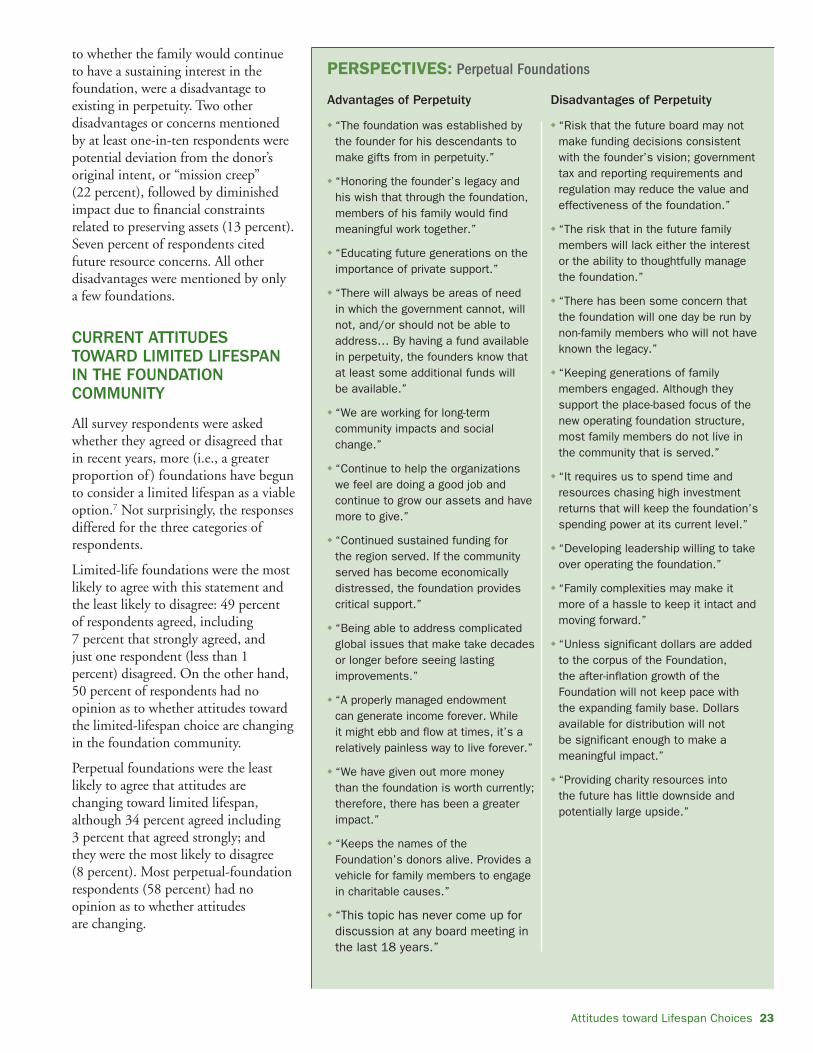
Attitudes toward Lifespan Choices 23
to whether the family would continue to have a sustaining interest in the foundation, were a disadvantage to existing in perpetuity. Two other disadvantages or concerns mentioned by at least one-in-ten respondents were potential deviation from the donor’s original intent, or “mission creep” (22 percent), followed by diminished impact due to fi nancial constraints related to preserving assets (13 percent). Seven percent of respondents cited future resource concerns. All other disadvantages were mentioned by only a few foundations.
CURRENT ATTITUDES TOWARD LIMITED LIFESPAN IN THE FOUNDATION COMMUNITY
All survey respondents were asked whether they agreed or disagreed that in recent years, more (i.e., a greater proportion of ) foundations have begun to consider a limited lifespan as a viable option.7 Not surprisingly, the responses differed for the three categories of respondents.
Limited-life foundations were the most likely to agree with this statement and the least likely to disagree: 49 percent of respondents agreed, including 7 percent that strongly agreed, and just one respondent (less than 1 percent) disagreed. On the other hand, 50 percent of respondents had no opinion as to whether attitudes toward the limited-lifespan choice are changing in the foundation community.
Perpetual foundations were the least likely to agree that attitudes are changing toward limited lifespan, although 34 percent agreed including 3 percent that agreed strongly; and they were the most likely to disagree (8 percent). Most perpetual-foundation respondents (58 percent) had no opinion as to whether attitudes are changing.
Advantages of Perpetuity
“The foundation was established by ◆
the founder for his descendants to make gifts from in perpetuity.”
“Honoring the founder’s legacy and ◆
his wish that through the foundation, members of his family would find meaningful work together.”
“Educating future generations on the ◆
importance of private support.”
“There will always be areas of need ◆
in which the government cannot, will not, and/or should not be able to address… By having a fund available in perpetuity, the founders know that at least some additional funds will be available.”
“We are working for long-term ◆
community impacts and social change.”
“Continue to help the organizations ◆
we feel are doing a good job and continue to grow our assets and have more to give.”
“Continued sustained funding for ◆
the region served. If the community served has become economically distressed, the foundation provides critical support.”
“Being able to address complicated ◆
global issues that make take decades or longer before seeing lasting improvements.”
“A properly managed endowment ◆
can generate income forever. While it might ebb and flow at times, it’s a relatively painless way to live forever.”
“We have given out more money ◆
than the foundation is worth currently; therefore, there has been a greater impact.”
“Keeps the names of the ◆
Foundation’s donors alive. Provides a vehicle for family members to engage in charitable causes.”
“This topic has never come up for ◆
discussion at any board meeting in the last 18 years.”
Disadvantages of Perpetuity
“Risk that the future board may not ◆
make funding decisions consistent with the founder’s vision; government tax and reporting requirements and regulation may reduce the value and effectiveness of the foundation.”
“The risk that in the future family ◆
members will lack either the interest or the ability to thoughtfully manage the foundation.”
“There has been some concern that ◆
the foundation will one day be run by non-family members who will not have known the legacy.”
“Keeping generations of family ◆
members engaged. Although they support the place-based focus of the new operating foundation structure, most family members do not live in the community that is served.”
“It requires us to spend time and ◆
resources chasing high investment returns that will keep the foundation’s spending power at its current level.”
“Developing leadership willing to take ◆
over operating the foundation.”
“Family complexities may make it ◆
more of a hassle to keep it intact and moving forward.”
“Unless significant dollars are added ◆
to the corpus of the Foundation, the after-inflation growth of the Foundation will not keep pace with the expanding family base. Dollars available for distribution will not be significant enough to make a meaningful impact.”
“Providing charity resources into ◆
the future has little downside and potentially large upside.”
PERSPECTIVES: Perpetual Foundations

24 Perpetuity or Limited Lifespan
Undecided foundations were more likely than perpetual foundations (but less likely than limited-life foundations) to agree that attitudes are changing (41 percent agreed, including 2 percent that agreed strongly). Just two undecided foundations (1 percent) disagreed with this statement. As with perpetual foundations, 58 percent had no opinion.
Endnotes1. 80 of the 125 spend-down foundations (64 percent) wrote
in a response. 2. 67 of the 125 spend-down foundations (54 percent) wrote
in a response. 3. 459 of the 676 perpetual foundations (68 percent) wrote in
a response. 4. 397 of 676 perpetual foundations (59 percent) wrote in a
response. 5. 145 of the 273 undecided foundations (53 percent)
answered this question.6. 148 of 273 undecided foundations (54 percent) answered
this question7. This question was answered by 101 of 125 limited-life
foundations (81 percent); 647 of 676 perpetual foundations (96 percent); and 256 of 272 undecided foundations (94 percent).
Advantages of Perpetuity
“To continue to honor the individuals ◆
for whom the Foundation was named by contributing to the types of charities they were enthusiastic about and by keeping their name in evidence.”
“The main advantage would be the ◆
family’s engagement in philanthropy across generations.”
“We are still building the corpus ◆
of the foundation with the goal of working with our children when they are in their 20s and 30s.”
“The founder expects the foundation ◆
to unify future generations of the family through their participation. The longer the foundation exists the more opportunity exists to achieve this purpose.”
“Our mission and focus is regional, ◆
and there will always be a need for the type of funding we supply in our region.”
“Ability to grow resources to have ◆
longer/larger impact on challenges of community.”
“Continuing to fund the causes our ◆
family feels are worthy, and passing the philanthropic vision to our descendants.”
“Has not come up for discussion.” ◆
Disadvantages of Perpetuity
“Loss of focus and commitment ◆
to founder’s areas of interest; challenges in getting third generation to spend time on the foundation”
“Family will be far less unified, ◆
less capable of consensus. Future generations will hardly know each other.”
“Succeeding generations may not ◆
share the goals and aspirations of the founders plus the second generation.”
“Grantmaking requires work, if it is to ◆
be done well. We may be leaving our son and grandchildren a responsibility they will be too busy to fulfill.”
“The founders want to see progress ◆
resulting from grants in their lifetime. Family members are becoming more geographically dispersed and their interests are more disparate.”
“Mission drift or reversal of ◆
donor intent.”
“Prevents making a more major ◆
impact on the work of a few specific charities.”
“Perpetuity is a long time. My children ◆
should decide the future of the foundation once I am gone.”
PERSPECTIVES: Undecided Foundation

Conclusion 25
ConclusionsConclus6This study’s most basic fi nding is
that while existing in perpetuity is
the norm for the majority of existing
family foundations, a small segment
(12 percent) plan to limit their
lifespan or are in the process of
spending down while a larger segment
(25 percent) are currently undecided,
either because they have not yet
discussed this issue or because of
uncertainty about the family’s future
involvement in the foundation. These fi ndings are based on the fi rst national survey on this topic to target a very broad cross-section of active family foundations—more than 5,800. While the study provides a reliable snapshot of the current intentions, practices, and attitudes of family foundations, it is not intended to generalize about all foundations nor should the fi ndings be considered indicative of foundation practices during any time period other than the present. Nevertheless, the core fi ndings are consistent with the results of a smaller Foundation Center survey conducted in 2004.
Foundation operating characteristics
infl uence the lifespan options of
active family foundations. In general, small foundations established since 1980 that do not employ paid staff and whose founder is still living are the most likely to plan to limit their lifespan though the percentage who expect to spend down is still modest; those that do not fund their grants out of endowment are especially likely to expect to spend down. In contrast, more mature, larger, staffed foundations whose founder is deceased are the most likely to plan to exist in perpetuity. Smaller foundations formed in the past two decades are the most likely to be undecided.
Having a living founder is an
especially strong determinant of
lifespan planning choices. Foundations with a living founder are three times more likely to expect to spend down than those whose founder is deceased and they are almost twice as likely to be undecided. Not surprisingly, the proportion of family foundations with living founders steadily increases as foundation age decreases—for all categories of foundations. As the proportion of living founders grows by decade, so too does the rate of limited-lifespan responses. The infl uence of a living founder is strongest among foundations formed in the 1980s and 1990s. Roughly one-sixth of foundations formed in those decades and whose founders are living plan to spend down. It appears that having a living founder increases the chance that a foundation will consider alternatives to perpetuity or leave the door open for future consideration.
Most family foundations do not
incorporate a decision about
intended lifespan into their founding
documents. The majority of survey respondents (55 percent) have a charter that neither specifi es perpetuity nor includes a sunset clause. Only about one-in-four foundations made a formal decision about their intended lifespan at inception that was incorporated into their charters. Of those that did, a large majority planned to exist in perpetuity. Interestingly, a handful of perpetual and limited-life foundations have a charter that specifi es a contrary option. Perhaps in such cases the by-laws of family foundations were written in a way that allowed fl exibility should the founder change his mind while still alive or should the decision no longer make sense.
LIMITED-LIFE FOUNDATIONS
Foundations that expect to limit
their lifespan are much more likely
to make a formal decision later
in the foundation’s life cycle than
at inception. Only 21 percent of limited-life foundations have a charter that includes a sunset clause (another 5 percent made the decision at inception even though it was not incorporated into their founding documents). More typically, the decision to limit the foundation’s lifespan was made later by the founder(s) (49 percent) or, to a lesser extent, by the founder(s)’ heirs and/or the foundation’s board (25 percent). The average number of years between foundation creation and deciding to spend down was 19, while the median (or mid-point) was 13 years. All but one respondent said that the decision was made after 1980 and the vast majority said it was made after 1999. In fact, the largest number of respondents by far made the decision in 2007 or 2008, which suggests a growing trend.
Reasons for deciding to limit the
foundation’s lifespan vary depending
on whether the decision was made
at inception or later. When made at inception, the two leading factors by far that drove the decision were the desire of the founder(s) to have a greater impact during their lifetimes and to be directly involved in how the money was spent. To a lesser extent, the decision was also driven by a desire to preserve philanthropic intent, a belief that subsequent generations will create their own philanthropies, and a belief that foundations are more effi cient when working within a limited lifespan. When the decision

26 Perpetuity or Limited Lifespan
was made later in the foundation’s life cycle, the most frequently cited reasons were a shift in the founder(s)’ attitude toward limited lifespan versus perpetuity; a constellation of family issues, especially uncertainty about the family’s future interest and involvement in the foundation; and a belief that subsequent generations will create their own philanthropies to address future needs. Interestingly, only a small proportion of respondents said that a decline in resources was an important factor driving the decision. (In light of recent steep declines in foundation endowments, responses to this question may well have differed if the survey was conducted six to nine months later. See also “What Impact Will the Current Economic Crisis Have on Foundation Lifespan Planning?” on page viii.)
Most foundations that have made
a decision to limit the foundation’s
lifespan have not yet started the
spend-down process. More than two out of fi ve limited-life foundations have not yet set a timeframe for spending down. Among those that have, nearly one-half (48 percent) said that the period was more than 20 years and 26 percent said 30 years or more. Only 16 foundations (30 percent) said that the period was less than ten years and just six expect to spend out over fi ve years. These fi ndings suggest that the limited-life foundations in the study are likely to have only limited impact on total foundation resources now and in the immediate future, since few of them are actually in the process of spending down. That said their impact is likely to grow over the next few decades, especially if the rate of decision-making continues at recent (2007 and 2008) levels.
Since few foundations in the
study have begun to spend down,
limited-life respondents overall
have made only limited changes in
their operational and grantmaking
strategies. The most frequently cited change by far in foundation operations (reported by four-in-ten respondents) was increasing the payout level. The only other option cited by at least one-tenth of respondents was changing the balance of investments from equities to fi xed income. About one-third of respondents indicated that they had not yet made any changes.
As for changes in grantmaking strategies, a majority or close to a majority of respondents indicated “no change” to the various options provided. The most frequently cited option (by 47 percent of respondents) was increasing the size of grants, yet a nearly equal proportion (45 percent) indicated “no change.” The response to this option was much stronger among the 37 foundations with at least $10 million in assets that responded: 62 percent of them are increasing the size of their grants and none are decreasing grant size.
Foundations that have set a
timeframe for spending down are
more likely to have taken steps
in preparation for closing the
foundation. Among respondents that have set a timeframe, the largest groups are communicating with their grantees and partners about their plans for closing the foundation (36 percent) and/or documenting the process of spending down (31 percent). At the same time, the majority of limited-life foundations that have not yet set a timeframe for spending down have also not yet taken any steps in preparation for this event, while about 21 percent are documenting the process. Whether or not they have set a timeframe, very few have announced publicly that they intend to close down. In fact, even among the foundations whose spend-down timeframe is less than ten years, less than one-fourth have publicly announced their plans.
PERPETUAL FOUNDATIONS
Foundations that have made a
formal decision to exist in perpetuity
are much more likely to make the
decision at inception. The majority of perpetual foundation respondents (57 percent) said that a formal decision was made to exist in perpetuity. (Of those, four out of fi ve respondents said that the decision was made by the founder(s) at the time of the foundation’s creation.) Apparently, among the remaining 43 percent of respondents that have not made a formal decision, perpetuity is considered the norm.
Reasons for deciding to exist in
perpetuity focus on impact and
family engagement. Respondents cited two principal reasons for deciding to exist in perpetuity: a desire to have a sustained, long-term impact on the local community and a desire for family engagement in philanthropy across generations. More than 70 percent of respondents said that each of these factors infl uenced their decision “a great deal.” Three other key factors cited by at least half of respondents as having a great deal of infl uence on their decision include a belief that their areas of giving will continue to need investment, a desire of the founder(s)’ to leave a lasting legacy, and a desire to ensure the availability of continued funding for grantees. The smallest foundations were much more likely to cite family issues as a very strong infl uence, while the largest foundations were the most likely to cite the belief that their causes or areas of giving will continue to need investment. Not surprisingly, the youngest foundations were the most likely to cite family bonding and family engagement issues as a very strong infl uence.

Conclusion 27
A large majority of foundations that
plan to exist in perpetuity have never
considered other options and are
unlikely to do so in the future. At least 70 percent of perpetual foundations of all sizes have never considered alternatives to perpetuity and a similar percentage say they are unlikely to do so in the future. Among the small minority that have considered other options in the past, the leading reasons cited were uncertainty about the level of family interest in the foundation, desire to preserve philanthropic intent, and a shift in the donor(s)’ attitudes toward perpetuity vs. limited lifespan.
UNDECIDED FOUNDATIONS
Unlike perpetual foundations, most
foundations that have not yet decided
have considered alternatives to
perpetuity at some time and the vast
majority of them expect to consider
limited lifespan in the future. At least one-half to more than two-thirds of the undecided foundations of every age group and asset size have considered other options (including 70 percent of those with assets greater than $50 million), and nearly four out of fi ve expect to do so in the future. These fi ndings reveal a distinct openness to limiting the foundation’s lifespan among a substantial cross-section of family foundations that are currently undecided. This suggests that being “undecided” should not be construed as merely a default position or as just a stage in the path toward perpetuity.
Undecided foundations cited family issues and a shift in the founder(s)’ attitude toward perpetuity versus limited lifespan as the leading reasons for considering other options. Roughly two out of fi ve respondents mentioned these reasons. Only one other reason—desire to preserve donor(s)’ intent, was mentioned by close to one-in-fi ve undecided foundations.
ADVANTAGES AND DISADVANTAGES OF LIMITED LIFESPAN AND PERPETUITY
For foundations that plan to limit
the foundation’s lifespan, the two
leading advantages cited were the
ability to honor donor intent and to
preserve the founder(s)’ vision and
level of engagement. More than two out of fi ve limited-life foundations mentioned these advantages, followed by the ability to achieve greater impact (29 percent). Three out of four foundations that plan to spend down did not see any disadvantages to this option, compared with smaller percentages of perpetual and undecided foundations that did not indicate any disadvantages to existing in perpetuity.
Foundations that plan to exist
in perpetuity were most likely to
mention as advantages family-related
reasons—such as engagement across
generations, shared responsibility,
and family unity—and a concern for
the long-term needs of people and
causes assisted by the foundation.
Other advantages cited include having a long-term impact, leaving a lasting legacy, and following the wishes of the donor(s). Two-in-fi ve perpetual foundations that answered the question do not see any disadvantages to existing in perpetuity. The disadvantages cited most frequently were uncertainty about family members’ future commitment to the foundation and the threat of “mission creep.”
Undecided foundations were
much more likely than perpetual
foundations to see disadvantages
to the perpetuity option. While many undecided foundations cited advantages to existing in perpetuity, especially family-related advantages, they were more also likely to mention disadvantages, such as uncertainty about the family’s future commitment and concerns about preserving the donor(s)’ intent (mission creep). Only one-sixth of the respondents who answered this question saw no disadvantages to existing in perpetuity.
ATTITUDES TOWARD LIMITED LIFESPAN IN THE FOUNDATION COMMUNITY
A substantial minority of all three types of respondents agreed that attitudes toward a limited-lifespan policy are changing in the foundation community. Not surprisingly, limited-life foundations were the most likely to agree (49 percent). Still, 41 percent of undecided foundations and 34 percent of perpetual foundations agreed that limiting a foundation’s lifespan is now seen as a viable option. At the same time, at least half of all types of respondents had no opinion one way or the other.


Additional Tables 29
APPENDIX A
Additional Tables
Table A-1. Lifespan Plan by Status of the Founder (Living or Deceased) and Establishment Period
Establishment Period Lifespan Plan
Are any of the foundation’s founders still living?
Yes No
No. % No. %
Pre-1950 Limited-life 0 0.0 1 1.7Perpetual 10 83.3 54 93.1Undecided 2 16.7 3 5.2Total 12 100.0 58 100.0
1950s2 Limited-life 2 8.7 4 4.5Perpetual 13 56.5 72 80.9Undecided 8 34.8 13 14.6Total 23 100.0 89 100.0
1960s3 Limited-life 4 10.0 2 3.1Perpetual 27 67.5 51 78.5Undecided 9 22.5 12 18.5Total 40 100.0 65 100.0
1970s4 Limited-life 3 15.8 2 7.7Perpetual 7 36.8 17 65.4Undecided 9 47.4 7 26.9Total 19 100.0 26 100.0
1980s5 Limited-life 19 18.3 6 6.7Perpetual 57 54.8 73 82.0Undecided 28 26.9 10 11.2Total 104 100.0 89 100.0
1990s6 Limited-life 39 19.0 8 6.4Perpetual 87 42.4 86 68.8Undecided 79 38.5 31 24.8Total 205 100.0 125 100.0
2000s7 Limited-life 12 13.3 1 1.9Perpetual 45 50.0 41 75.9Undecided 33 36.7 12 22.2Total 90 100.0 54 100.0
1Establishment year unavailable for 30 foundations.2Living founder status unavailable for 3 foundations.3Living founder status unavailable for 9 foundations.4Living founder status unavailable for 7 foundations.5Living founder status unavailable for 9 foundations.6Living founder status unavailable for 13 foundations.7Living founder status unavailable for 4 foundations.
Table A-2. Lifespan Plan by Foundation Staffing
Unstaffed Staffed
No. % No. %
Limited-life 73 12.3 52 10.8
Perpetual 351 59.3 325 67.4
Undecided 168 28.4 105 21.8
Total 592 100.0 482 100.0
Source: The Foundation Center, Perpetuity or Limited Lifespan: How do Family Foundations Decide?, 2009.
Table A-3. Foundation Age (Establishment Period) by Region
Region
Midwest1 Northeast2 South3 West4
Establishment Period No. % No. % No. % No. %
Pre-1950 19 8.1 19 8.1 17 5.9 15 5.3
1950s 24 10.3 21 8.9 40 13.8 30 10.5
1960s 28 12.0 33 14.0 34 11.7 19 6.7
1970s 14 6.0 13 5.5 13 4.5 12 4.2
1980s 44 18.8 45 19.1 64 22.1 49 17.2
1990s 73 31.2 73 31.1 89 30.7 108 37.9
2000s 32 13.7 31 13.2 33 11.4 52 18.2
Total 234 100.0 235 100.0 290 100.0 285 100.0
Source: The Foundation Center, Perpetuity or Limited Lifespan: How do Family Foundations Decide?, 2009.
1Establishment year information unavailable for 4 foundations.2Establishment year information unavailable for 6 foundations.3Establishment year information unavailable for 11 foundations.4Establishment year information unavailable for 9 foundations.
Table A-4. Founder(s)’ Involvement in Deciding to Adopt a Limited Lifespan When Made Later
If the decision to limit the foundation’s lifespan was made later, when was it made? No. %
During the founder(s)’ lifetime(s) 55 74.3
After the death of the founder(s) 19 25.7
Total 74 100.0
Source: The Foundation Center, Perpetuity or Limited Lifespan: How do Family Foundations Decide?, 2009.
Table A-5. Changes in Grantmaking Strategies of Limited-Life Foundations
Increase No Change Decrease
No. % No. % No. %
Size of grants 39 47.0 37 44.6 7 8.4
Number of program areas 7 8.8 58 72.5 15 18.8
Number of grantees 18 23.4 40 51.9 19 24.7
Number of multi-year grants1 16 23.2 40 58.0 13 18.8
Number of endowment grants2 7 13.7 41 80.4 3 5.9
Number of grants to build capacity of grantees3 19 33.3 35 61.4 3 5.3
Number of non-grantmaking charitable activities, e.g., using foundation staff to consult with grantees4
10 26.3 26 68.4 2 5.3
Other5 3 15.0 17 85.0 0 0.0
Source: The Foundation Center, Perpetuity or Limited Lifespan: How do Family Foundations Decide?, 2009.
1Eleven additional foundations indicated this option was not applicable.2Twenty-one additional foundations indicated this option was not applicable.3Sixteen additional foundations indicated this option was not applicable.4Twenty-six additional foundations indicated this option was not applicable.5Nine additional foundations indicated this option was not applicable.

30 Perpetuity or Limited Lifespan
Looking at only those foundations that have made a decision about their lifespan (i.e., excluding undecided foundations) we ran a linear regression model to further explore how the factors we examined affect the decision to spend down or exist in perpetuity and to assess their strength relative to each other.
Of all of the factors with statistically significant coefficients, the strongest related to the decision to spend down is pass-through status, followed by the presence of a living founder, establishment in the 1990s1, and location in the Midwest2. ASF membership is negatively related to deciding to spend down (at a relative strength slightly greater than having a Midwest location) (Table A-6).
This model described about 17% of the variance between deciding to spend down and deciding to exist in perpetuity (R2=.172).
While this regression model represents only one way of looking quantitatively at the decision to limit the lifespan of a foundation, it generally complements the previous analysis. It also allows us to compare the strength of different factors and highlight where further research may be directed.
METHODOLOGY
One dichotomous variable was created using the respondents’ indication of their lifespan plans: those choosing to spend down and those who plan to exist in perpetuity, with values of 1 and 0 respectively. The same was done for any categorical factors that were not already ratio-level variables (establishment year period, region, and asset size3).
The Linear regression equation was run using an SPSS regression model and the “entry” (where all factors are added to the regression model at once) equation creation method in order to weigh all the factors against one another.
Endnotes1. Establishment prior to 1950 was used as the dummy variable for the establishment year
range categories.2. Location in the South was used as the dummy variable for the region categories.3. Asset Range: More than $250 million was used as the dummy variable for the asset size
categories.
REGRESSION ANALYSIS
Table A-6. Linear Regression Model Coefficients
Unstandardized Coefficients
Standardized Coefficients
B Std. Error Beta t
(Constant) -0.010 0.079 -0.122
Living founder 0.126*** 0.027 0.180 4.670
Pass-through Foundations 0.336*** 0.057 0.239 5.860
Staffed 0.023 0.028 0.033 0.821
Northeast 0.012 0.034 0.014 0.357
Midwest 0.070* 0.033 0.086 2.135
West 0.037 0.033 0.046 1.132
ASF Member -0.076** 0.026 -0.108 -2.876
COF Member -0.042 0.030 -0.050 -1.370
Asset Range: Less than $1 million 0.016 0.086 0.012 0.181
Asset Range: $1 million–$5 million 0.013 0.070 0.016 0.183
Asset Range: $5 million–$10 million -0.019 0.071 -0.020 -0.263
Asset Range: $10 million–$25 million -0.026 0.068 -0.030 -0.378
Asset Range: $25 million–$50 million 0.079 0.071 0.076 1.109
Asset Range: $50 million–$250 million -0.002 0.071 -0.002 -0.024
Established in 2000s 0.054 0.057 0.052 0.937
Established in 1990s 0.107* 0.049 0.140 2.168
Established in 1980s 0.090 0.050 0.106 1.812
Established in 1970s 0.128 0.072 0.072 1.774
Established in 1960s 0.014 0.054 0.012 0.250
Established in 1950s 0.037 0.053 0.035 0.704
Source: The Foundation Center, Perpetuity or Limited Lifespan: How do Family Foundations Decide?, 2009.
*2-tailed signifi cance ≤ .05**2-tailed signifi cance ≤ .01***2-tailed signifi cance ≤ .001

Methodology 31
APPENDIX B
Methodology
Assessing the extent to which family foundations are either planning or considering spend-down, or “limited lifespan,” is challenging, fi rst, because there is no legal defi nition of a family foundation and second, because very few foundations publicly state their lifespan planning intentions. To learn about the prevalence of limited-life foundations among existing, active family foundations and to examine what motivates this practice, the Foundation Center (FC), in collaboration with the Council on Foundations (COF) and the Association of Small Foundations (ASF), conducted a survey of family foundations in June 2008 to obtain a “snapshot” of their current lifespan plans—whether they are planning to exist in perpetuity or limit their lifespan or are undecided. The study was funded by a grant from the Aspen Institute’s Nonprofi t Sector and Philanthropy Program.
The original sampling frame of potential survey respondents was all “family foundations” in the Foundation Center’s database that were ranked among the top 20,000 by giving in 2006.1 According to the defi nition used by the Center, family foundations are private independent foundations that either self-identify in its annual survey or meet objective criteria for family involvement, such as having “Family” in the name or having a living donor with the same name as the foundation name. Roughly 11,500 foundations met these criteria. Of those, the Center planned to directly survey more than 5,500, or nearly one-half.
To reach a larger number of small, unstaffed foundations and to help improve response rates, the Foundation Center and the Council on Foundations gratefully accepted a proposal from the Association for Small Foundations to partner in the survey by including questions from the Foundation Spend-down Study survey in ASF’s 2008 Operations and Management Survey2 (fi elded in May 2008). Based on the Center’s classifi cation of ASF members by type, ASF surveyed approximately 1,369 family foundations.3
Excluding ASF members, the FC’s fi nal sample included a non-randomly drawn component of 1,942 larger foundations4 and another component of 2,500 foundations drawn randomly from among the remaining foundations that met the study’s criteria. Not counting foundations surveyed by ASF, the Foundation Center sent surveys to 4,442 family foundations.
To encourage responses, the Center sent a follow-up postcard to all surveyed foundations. In addition, FC sent a follow-up email to all non-respondent contacts for which email addresses were available and FC staff attempted to reach by telephone nearly all non-respondent foundations in the sample with available telephone contact information.
In all, more than 5,800 family foundations were sent surveys. FC received 597 usable5 responses from its non-randomly and randomly drawn sample (a higher than 13 percent response rate6) and 477 usable ASF survey responses (a nearly 35 percent response rate).7 In total, 1,074 (or close to 19 percent) of surveyed family foundations provided usable surveys.
In terms of their fi nancial resources, the 1,074 survey respondents held $88.5 billion in assets circa 2006, which represents about 33 percent of the $265.5 billion of assets reported by close to 38,000 family foundations of all sizes identifi ed by the Foundation Center. Respondents reported $5.5 billion in giving, which accounts for nearly 34 percent of all family foundation giving.8 Broken down by subsample, foundations from the FC sample of 597 respondents represented $79.1 billion in assets and $5.0 billion in giving.9 By comparison, the 477 ASF respondents accounted for $9.5 billion in assets and $458.6 million in giving.
No subsample groups were weighted in the analysis. Below we provide information about the respondent characteristics from each sample component, so that readers may draw their own conclusions about the relative impact of each component on the overall fi ndings from the study.
RESPONDENT AND OVERALL FAMILY FOUNDATION SAMPLE CHARACTERISTICS
Foundation Asset Size
Compared with the overall distribution of family foundations among the top 20,000 (as ranked by total giving in 2006), survey respondents were more heavily distributed in the larger asset size categories (Table B-1). While 26 percent of family foundations in the sample overall had assets of at least $10 million, nearly half (46 percent) of respondents had assets of $10 million or more.
To access the survey questionnaires, please visit foundationcenter.org/gainknowledge/research/specialtrends.

32 Perpetuity or Limited Lifespan
Foundation Giving Size
In general, survey respondent foundations were more heavily distributed in larger giving size categories than family foundations in the overall sample. For example, 31 percent of respondents gave more than $1 million circa 2006, compared with 20 percent of foundations in the overall sample. Nevertheless, more than two-thirds of survey respondents (nearly 69 percent: N = 729) gave less than $1 million circa 2006 and slightly more than half of those foundations gave less than $250,000. In addition, the respondent group included 122 foundations (almost 12 percent) that gave less than $100,000 while the original sample had none.
Foundation Age
While the largest proportions of both the overall family foundation sample and survey respondent foundations were formed since 1980, respondents tended to be older than foundations in the overall sample (Table B-2). For example, 14 percent of respondents were created since 2000 and 33 percent were formed in the 1990s, compared with 21 percent and 41 percent, respectively, of foundations in the overall sample formed in those decades. Conversely, the percentage of respondent foundations formed before 1950 (7 percent) was almost twice as large as the percentage in the overall sample.
Staffed vs. Unstaffed Foundations
Survey respondents were much more likely to employ paid staff than foundations in the original sample of family foundations (45 percent vs. close to 15 percent). This difference is consistent with the fact that respondent foundations are more heavily represented in the larger asset and giving size categories.
Endowed vs. Pass-through Foundations
Consistent with their larger asset sizes, survey respondents were more likely to maintain an endowment than foundations in the overall sample and less likely to operate as a pass-through
Table B-1. Survey Respondents by Asset Size
Family Foundations in Top 20,0001 Respondents2
No. % No. %
Less than $1 million 2,342 20.3 100 9.4
$1 million–$5 million 4,096 35.4 297 28.0
$5 million–$10 million 2,095 18.1 174 16.4
$10 million–$25 million 1,649 14.3 199 18.8
$25 million–$50 million 699 6.0 122 11.5
$50 million–$250 million 577 5.0 133 12.5
More than $250 million 98 0.8 35 3.3
Total 11,556 100.0 1,060 100.0
Source: The Foundation Center, Perpetuity or Limited Lifespan: How do Family Foundations Decide?, 2009.
1Ranked by giving.2Asset size unavailable for 14 foundations.
Table B-2. Survey Respondents by Establishment Period
Family Foundations in Top 20,0001 Respondents2
No. % No. %
Pre-1950 395 3.6 70 6.7
1950s 677 6.1 115 11.0
1960s 778 7.0 114 10.9
1970s 360 3.3 52 5.0
1980s 2037 18.4 202 19.3
1990s 4499 40.7 343 32.9
2000s 2300 20.8 148 14.2
Total 11,046 100.0 1,044 100.0
Source: The Foundation Center, Perpetuity or Limited Lifespan: How do Family Foundations Decide?, 2009.
1Ranked by giving.2Establishment year was not available for 30 foundations.
Table B-3. Survey Respondents by Region
Family Foundations in Top 20,0001 Respondents
No. % No. %
Midwest 2,371 20.5 238 22.2
Northeast 3,981 34.5 241 22.4
South 2,920 25.3 301 28.0
West 2,280 19.7 294 27.4
Total 11,552 100.0 1,074 100.0
Source: The Foundation Center, Perpetuity or Limited Lifespan: How do Family Foundations Decide?, 2009.
1Ranked by giving; 4 additional foundations in the original survey sample are located in Puerto Rico (2) and the Virgin Islands (2).
Table B-4. Survey Respondents by Asset Size and Source Organization
Respondent Set Entry Point
All Respondents1 FC2 ASF3
No. % No. % No. %
Less than $1 million 100 9.4 33 5.5 67 14.4
$1 million–$5 million 297 28.0 165 27.7 132 28.4
$5 million–$10 million 174 16.4 105 17.6 69 14.9
$10 million–$25 million 199 18.8 115 19.3 84 18.1
$25 million–$50 million 122 11.5 63 10.6 59 12.7
$50 million–$250 million 133 12.5 81 13.6 52 11.2
More than $250 million 35 3.3 34 5.7 1 0.2
Total 1,060 100.0 596 100.0 464 100.0
Source: The Foundation Center, Perpetuity or Limited Lifespan: How do Family Foundations Decide?, 2009.
1Asset size unavailable for 14 foundations.2Asset size unavailable for 1 foundation.3Asset size unavailable for 13 foundations.

Methodology 33
foundation. For example, fewer than one-in-ten respondents (7 percent) operated as pass-through foundations,10 compared to the nearly one-quarter of family foundations in the overall survey sample.
Foundation Location
Survey respondents were much more likely than family foundations in the overall sample to be located in the West (27 percent vs. 20 percent) and a little more likely to be located in the South (28 percent vs. 25 percent) and the Midwest (22 percent vs. close to 21 percent (Table B-3). At the same time, survey respondents were much less likely to be based in the Northeast (22 percent vs. 35 percent).
RESPONDENT CHARACTERISTICS BY SUBSAMPLES
Among the 1,074 respondents, nearly 12 percent said that they plan to limit their foundation’s lifespan, 63 percent plan to exist in perpetuity, and 25 percent are undecided. Respondents directly surveyed by the Foundation Center were much more likely than the Association of Small Foundation’s member respondents to plan to spend down (15 percent vs. 8 percent), while ASF respondents
were more likely to plan to exist in perpetuity (65 percent vs. 61 percent) or were undecided (27 percent vs. 25 percent). While we cannot precisely explain these differences in practice, we can examine the demographics of respondents overall and compare the characteristics of the respondents from the two samples.
The following analyses compare the characteristics of the respondents from the two subsample sources—the Foundation Center and the Association of Small Foundations—and show that they differ somewhat in terms of resources, age, staffi ng, location, and endowed vs. pass-through status. These differences may account in part for the different rates of spend-down, perpetuity, and undecided foundations reported above.
Foundation Asset Size
Compared with ASF member respondents, FC respondents were less likely to hold assets of less than $5 million (43 percent vs. 32 percent, respectively) and they were more likely to report assets greater than $50 million (19 percent vs. 11 percent) (Table B-4).11
Foundation Giving Size
One-quarter of ASF respondents gave less than $100,000 in 2006, compared to less than 1 percent of FC respondents. This difference stems from the fact that the original FC survey sample was drawn from the top 20,000 family foundations by giving circa 2006, with a threshold of about $118,000. In contrast, the ASF survey sample included some family foundations whose giving fell below the original sample criteria (see Appendix B: Methodology endnote 3).
Foundation Age
FC respondents were somewhat older and more established than ASF respondents (Table B-5): 37 percent of FC respondents vs. 28 percent of ASF respondents were formed prior to 1980. The gap is biggest in the share of respondents formed since 1999 (11 percent for FC vs. 18 percent for ASF).
Staffed vs. Unstaffed Foundations
While less than half of all respondents were staffed, fewer ASF respondents employed paid staff than FC respondents: 39 percent compared to 50 percent, respectively.
Table B-5. Survey Respondents by Establishment Period and Source Organization
Respondent Set Entry Point
All Respondents1 FC2 ASF3
No. % No. % No. %
Pre-1950 70 6.7 48 8.1 22 4.8
1950s 115 11.0 74 12.6 41 9.0
1960s 114 10.9 69 11.7 45 9.9
1970s 52 5.0 32 5.4 20 4.4
1980s 202 19.3 116 19.7 86 18.9
1990s 343 32.9 184 31.2 159 34.9
2000s 148 14.2 66 11.2 82 18.0
Total 1,044 100.0 589 100.0 455 100.0
Source: The Foundation Center, Perpetuity or Limited Lifespan: How do Family Foundations Decide?, 2009.
1Establishment period unavailable for 30 foundations.2Establishment period unavailable for 8 foundation.3Establishment period unavailable for 22 foundations.
Table B-6. Survey Respondents by Region and Source Organization
Respondent Set Entry Point
All Respondents FC ASF
No. % No. % No. %
Midwest 238 22.2 130 21.8 108 22.6
Northeast 241 22.4 148 24.8 93 19.5
South 301 28.0 154 25.8 147 30.8
West 294 27.4 165 27.6 129 27.0
Total 1,074 100.0 597 100.0 477 100.0
Source: The Foundation Center, Perpetuity or Limited Lifespan: How do Family Foundations Decide?, 2009.

34 Perpetuity or Limited Lifespan
Endowed vs. Pass-through Foundations
Even though the vast majority of respondents from both sources were endowed, FC respondents are almost twice as likely as ASF respondents to operate as a pass-through foundation: 8 percent vs. 5 percent.
Foundation Location
FC respondents were more likely than ASF respondents to be based in the Northeast (25 percent vs. 20 percent) and less likely to be based in the South (26 percent vs. 31 percent) (Table B-6). They were almost equally likely to be based in the West (28 percent vs. 27 percent) or in the Midwest (22 percent vs. 23 percent).
In summary, ASF members were more likely to have certain characteristics—for example, smaller asset size and younger age—that are associated in this study with higher rates of limited-life foundations. At the same time, they are
more likely to maintain an endowment and be located in the South, which are characteristics associated with higher rates of perpetual foundations. Taken together, the characteristics of ASF member respondents do not appear to explain their lower rate of limited-lifespan foundations compared to non-ASF member respondents. One characteristic that is not measured in this study is any possible effect related to ASF membership. As observed by one of the study fi ndings’ discussants, perhaps the act of joining a membership group—especially one that uniquely serves small foundations—implies a long-term engagement in the fi eld.
Endnotes1. The threshold for this set was roughly $118,000 in giving,
based on fi scal year 2006 for most foundations. Because not all active grantmaking family foundations maintain endowments, we selected those for the sample by total giving level.
2. ASF surveyed all of its members, including independent, corporate, public, and operating foundations that did not meet the FC’s defi nition of a family foundation. Only those foundations that met the defi nition were included in the study.
3. Estimate based on ASF members identifi ed using FC family foundation criteria and examinations of survey respondents. To provide the widest possible range of perspectives, we included 159 ASF survey respondents that were not in the FC’s original sample of family foundations ranked among the top 20,000 U.S. foundations by giving. Of these, 122 foundations fell below the sample’s giving threshold; the other 38 respondents were not originally identifi ed in FC records as family foundations but were later determined to either meet the Center’s objective criteria or to meet subjective criteria by self-identifying as family foundations in the ASF survey.
4. This component includes all staffed foundations, members of the Council on Foundations, and foundations responding to the Foundation Center’s latest annual survey.
5. Usable responses are surveys in which the respondent indicated whether they plan to exist in perpetuity or not or are undecided.
6. The response rate was 26 percent for the non-randomly drawn sample of larger foundations surveyed by FC and 4 percent for the randomly drawn sample of smaller and unstaffed foundations
7. We received 801 ASF survey responses, of which 510 qualify as “family foundations’ based on the study’s criteria. Of those, 477 foundations provided usable responses.
8. Removing outliers drops the total assets to $55.4 billion and giving to $2.6 billion.
9. Removing any outliers, total assets drops to $45.9 billion and total giving drops to $2.1 billion
10. As noted earlier, in this study pass-through foundations are defi ned as those whose total giving in the latest fi scal year represented more than 25 percent of their assets. In general, these are foundations that maintain relatively low assets and that fund their grants out of gifts made into the foundation periodically by the donor(s).
11. The differences between FC and ASF respondents by asset size are most notable for the very smallest and largest asset size categories. For example, just 6 percent of FC respondents fall into the less than $1 million category versus 14 percent of ASF respondents. In contrast, 19 percent of FC respondents fall into the greater than $50 million category versus 11 percent of ASF respondents. Moreover, 34 of the 35 foundations that held assets greater than $250 million are FC survey respondents.

79 Fifth Avenue ◆ New York, NY 10003 ◆ (800) 424-9836 ◆ foundationcenter.org
This study was made possible in part by support from the Aspen Institute, with additional support from The Wallace Foundation.