
Estimation: Making Educated Guesses Point Estimation Interval Estimation Hypothesis Testing.

Research ArticlePerformance Study of Impact-Point Estimation Systems UsingTwo Types of Acoustic Sensor Arrangement Methods
Shin Hur ,1 EunJoong Lee,1 Jongseong Won,2 Duck-Gyu Lee,1 Kyungjun Song,3
and Kyusik Park2
1Department of Nature-Inspired Nano Convergence Systems, Korea Institute of Machinery and Materials, Daejeon,(34103) 156, Republic of Korea2Department of software science, Dankook University, Jukjeon, (16890) 152, Republic of Korea3Department of Mechanical Engineering, Pusan National University, (46241) 63-2, Geumjeong-Ku, Busan, Republic of Korea
Correspondence should be addressed to Shin Hur; [email protected]
Received 22 July 2019; Revised 11 September 2019; Accepted 16 September 2019; Published 11 November 2019
Academic Editor: Paolo Bruschi
Copyright © 2019 Shin Hur et al. This is an open access article distributed under the Creative Commons Attribution License, whichpermits unrestricted use, distribution, and reproduction in any medium, provided the original work is properly cited.
In this study, a shooting experiment is carried out with an acoustic sensor array that can detect shock wave at high-sound pressuresand withstand the shock wave of the bullet. Delta- and H-type of acoustic sensor units are constructed. The measured values of thetemporal arrival differences estimated based on the distance between the acoustic sensors are then compared with the theoreticalcalculations according to the types of bullets and shooting distance. In addition, an impact-point estimation system (IPES) isfabricated, which comprises delta- and H-type sensor units, a target, signal processing device, and an impact point estimationalgorithm. The impact points on the target caused by the shooting experiment are compared with those calculated using theimpact point estimation algorithm. Finally, the mean absolute error ðMAEÞ between the actual and the calculated impact-pointcoordinates is calculated, and the performances of the delta- and H-type IPES are evaluated.
1. Introduction
When a bullet is fired from a gun owing to the occurrence ofthe deflagration inside it, the air around the bullet is com-pressed and the bullet generates a cone-shaped shock wave.The generated blast wave then propagates at the sonic veloc-ity in the radial direction. As the shock wave is generated in aclear N-shape within a short time interval, the position of thebullet can be identified based on the time difference of thearrival (TDoA) of the shock wave. Acoustic sensors capableof measuring shock wave signals must withstand sound pres-sures greater than 140 dB. They must also exhibit uniformdetection performance regardless of temperature and humid-ity changes. In conventional shooting exercises, whenever ashooter shoots, the person’s visual acuity or the assisting tele-scope confirm the location at which the bullet has penetratedthe target plate. However, it is difficult and time consumingto determine the location of an impact point because theshooter uses the naked eye or the telescope to determine
the location of the impact point. Therefore, various countries,including the US, UK, Switzerland, Sweden, and others, havedeveloped impact-point estimation systems (IPES), such asthe location of miss and hit (LOMAH) system, to supportshooting training programs. The IPES can measure theimpact of a bullet and display the bullet’s impact point in realtime. The system allows shooters to identify the point ofimpact with a display at a nearby location, which can shortenthe time of shooting training and improve the safety of thetraining program. Training commanders can also managetraining information and perform real-time assessments tosummarize the shooting results and monitor the progress oftrainees. A typical IPES consists of a shock-wave detectionunit based on an acoustic a sensor array, a signal processingdevice, an impact-point estimation algorithm, a computer,and a monitor. In general, the shock-wave detection unit pos-sesses signal processing functions and detects the shock wavegenerated by the bullet. To accurately estimate the impactpoint, the placement method and number of acoustic sensors
HindawiJournal of SensorsVolume 2019, Article ID 1758765, 11 pageshttps://doi.org/10.1155/2019/1758765

must be determined, and an effective impact-point estima-tion algorithm must be used. Previous studies related to thiscurrent investigation included theoretical and experimentalstudies of the shock wave and gunshot of the bullet generatedby shooting, and the study of the time delay between the gen-eration of the shock wave and the gunshot [1, 2]. Further-more, theoretical and experimental studies have beenpublished that allow the detection of the position of a sniperwith the use of fire detectors worn by soldiers [3, 4]. How-ever, no prior studies compare the impact point performancewith different bullet types and sensor arrangement methodsusing the IPES.
This study selects an acoustic sensor that is capable ofsensing the shock wave of a bullet and compares the calcu-lated and experimental values of TDoA of the shock wavecaused by the distances between acoustic sensors. Further-more, the IPES are fabricated with delta- and H-type ofacoustic sensor units and the impact-point location of bulletson the target are obtained from an actual shooting experi-ment and compared with those calculated using the impact-point estimation algorithm. The performances of the IPESare evaluated by comparing the errors of the impact-pointcoordinates between the shooting experiment and theimpact-point estimation calculations.
1.1. Theory of Shock Wave. The speed of an object travelingfaster than the speed of sound in air can be expressed usingthe Mach number,M = V/c, as the ratio of the speed of soundc and the velocity of the object V . Figure 1 shows the shockwave generated by a bullet traveling at a velocity higher thanthe speed of sound from the compression of the air. Thisshock wave has a conical shape with an angle θ relativeto the path of the traveling object, and the wave propa-gates in the vertical direction of the shock wave at thespeed of sound [5].
In this case, the propagation angle θ of the shock wave isequal to arcsin ð1/MÞ. The shock wave measured through anacoustic sensor has a clear N-shape. The time interval T fromthe highest to the lowest points of the N-shape is expressed asfollows [1]:
T = 1:82 dc
� �Mxl
� �1/4ð1Þ
where d is the diameter of the bullet, x is the vertical distancebetween the trajectory of the bullet and the acoustic sensor,
and l is the length of the bullet. The speed of sound c isexpressed according to 331:5 + 0:6 × t, indicating that thetemperature t has a significant impact on the formation ofthe shock wave. Figure 2 shows a shock wave with a typicalN-shape. The time interval T of the shock wave was mea-sured as the peak-to-peak interval of the measured voltageshock wave signal.
c
θ
V
Figure 1: Generation of a cone-shaped shock wave for a bullettraveling with a velocity V.
98400
–10–8–6–4–2
02
Volta
ge (V
)
468
1012
98600Time (𝜇s)
Figure 2: N-shape form of shock wave signal.
x
L
Target plate
Sensor unit
Shock wave front
Gun
Blast wave front
x
z
x/cos𝜃
𝜃
𝜃
(x2 + L2
)
Figure 3: Schematic explaining the calculation of the shock andblast wave arrival times.
2 Journal of Sensors

Figure 3 shows a schematic for the calculation of theshock and blast wave arrival times. The distance betweeneach acoustic sensor and the impact point can be expressedas x, the travel distance from the shock wave generated inthe path of the bullet to the acoustic sensor as x/cos θ, andthe travel time as x/ðc · cos θÞ. In this case, the distance fromthe time of shooting to the shock wave detection time by theacoustic sensor is expressed as L − x tan θ using the shootingdistance L. The corresponding travel time is ðL − x tan θÞ/V .The sum of the travel time of the bullet from the time ofshooting and the travel time of the shock wave that reachesthe acoustic sensor is determined as ððL − x tan θÞ/VÞ +x/ðc · cos θÞ. Using this expression, the shock wave arrivaltimes at the six sensors can be calculated for an arbitraryshooting distance. The travel distance of the blast wave fromthe shooting point to the acoustic sensor can be expressed asffiffiffiffiffiffiffiffiffiffiffiffiffiffiffiffiffiffiðx2 + L2 Þp
, and the corresponding travel time is expressedas
ffiffiffiffiffiffiffiffiffiffiffiffiffiffiffiffiffiffiðx2 + L2Þp/c. When the shooting takes place at a distance
of 100m, the shock wave arrival time is 138ms at the temper-ature of 20°C, the bullet velocity is 920m/s, the bullet diam-eter is 7:62mm, the bullet length is 15mm, and the verticaldistance x between the bullet path and the sensor is 1m.The time difference of arrival (TDoA) between the shock
wave and the blast wave measured by the acoustic sensor,i.e., ðL − x tan θÞ/VÞ+x/ðc · cos θÞ − ffiffiffiffiffiffiffiffiffiffiffiffiffiffiffiffiffiffiðx2 + L2Þp
/c, increasesas the shooting distance increases [1].
2. Results and Discussion
2.1. Experimental Measurements. A typical muzzle explosionproduces shock waves with a sound pressure level(SPL)≥ 140 dB. Thus, acoustic sensors used for measuringthese shock waves must be able to withstand these soundpressures [6]. Therefore, several fire tests were conductedon various acoustic sensors. Based on these tests, the acousticsensor that was capable of withstanding shock waves wasselected. As shown in Figure 4(a), the structure of the
Protection Grid ECM Preamplifier Housing Connector
(a) (b)
Figure 4: Acoustic sensor. (a) Schematic of structure and constituent components. (b) Photograph of acoustic sensor.
102 103 104–50
–45
–40
–35
–30
Sens
itivi
ty (d
B)
Frequency (Hz)
S1S2S3
S4S5S6
–50
–40
–30
–20
–10
0
10
20
30
40
50
Phas
e (de
g)
Figure 5: Sensitivity (solid lines) and phase (dotted lines) measurements obtained from the acoustic sensors.
Table 1: Measurement results of the acoustic sensor.
Sensitivity -46.0 dB relative to 1V/pa± 3 dBFrequency response ± 2 dB, 100Hz to 10 kHz
Phase response± 3°, 100Hz to 3 kHz± 5°, 3 kHz to 5 kHz
3Journal of Sensors

acoustic sensor is composed of a protection grid, an electretcondenser microphone (ECM), a preamplifier, housing, andan SMB connector. Figure 4(b) shows the acoustic sensor(HJ06, SISPIA Co., Korea). Each of the acoustic sensorsshould also have uniform sensitivity and phase characteris-tics to predict accurately the impact point of the bullet. The
sensitivity and phase characteristics of the acoustic sensorswere measured in an anechoic chamber according to thestandard measurement method. The sensitivity of the acous-tic sensors was approximately -46.0 dB in the frequencyband of 100Hz to 10 kHz, and the phase was approximatelywithin ±3° at 1.0 kHz. Figure 5 shows the sensitivity and
(a)
0 50 100 150 200 250 300
600
650
700
750
800
850
900
950
7.62 mm5.56 mm
Linear fit of 7.62 mmLinear fit of 5.56 mm
Vel
ocity
(m/s
)
Distance (m)
(b)
Figure 6: Bullet velocity measurement setup. (a) Doppler radar equipment. (b) Bullet velocity measurements as a function of the shootingdistance.
Unit (mm)
S3
S1
S6
S2 S4 S5300 150
(a)
S3S1 S2
S6S4 S5300
400800
Unit (mm)
(b)
Control PC
PC
PC
Wi-fi
Wi-fi
Wi-fi device
Signalconditioner
DAQRecording PC
(c)
Figure 7: Schematic of the acoustic sensor units. (a) Delta-type sensor unit. (b) H-type sensor unit. (c) Data processing setup.
4 Journal of Sensors

phase measurement outcomes from the six acoustic sensors,thus indicating the uniform sensitivity and phase character-istics with respect to frequency. The performance specifica-tions of the acoustic sensors are listed in Table 1. The IPESbased on the delta- and H-type sensor units was constructedwith the use of the six acoustic sensors with uniform sensi-tivity and phase value.
To measure the shock wave of a bullet and to test the per-formance of the IPES, an experiment was performed in anactual shooting test site. Bullets with diameters equal to5:56mm and 7:62mm were used. Prior to the experiment,the bullet velocity was measured at 50m, 100m, 150m, and300m from the shooting point with a speed measuring device(Doppler radar SL-528PE, Denmark) based on the Dopplereffects at the shooting position. Figure 6 shows the bulletvelocity as a function of distance for bullets with diametersequal to 5:56mm and 7:62mm. For locations near the shoot-ing distance, the 5:56mm bullet with a diameter of 5:56mmis faster than that the bullet with a diameter of 7:62mm. Atthe shooting distance of 260m, the 7:62mm bullet with thediameter of 7:62mm is faster.
Figure 7 shows a schematic of the experimental setup forthe shock wave detection units. Figures 7(a) and 7(b) showthe delta- and H-type of acoustic sensor units with six acous-tic sensors in each of them. In addition, Figure 7(c) shows thedata processing setup that contains a signal conditioner(PCB-480E09), a data acquisition system (DAQ, NI USB-6366), LabVIEW (NI Signal Express) software, and a record-ing PC. In addition, a wireless communication device(MAP5020) operating based on Wi-Fi technology and con-trol PC is used to collect and control the data acquisition ofgenerated shock waves at long distances. The sampling rateof the shock wave measurement is 200 kHz, and the datatransmission rate is 20 kHz. The shooting distances are 100
m and 200m, and the bullet diameters are 5:56mm and7:62mm.
Figure 8 shows the test setup of the IPES for shock wavemeasurement and impact-point identification. Based on theactual shooting and the six acoustic sensors placed in thedelta-type and H-type sensor units, shock waves are collectedat the shooting distances of 100m and 200m. Figures 9(a)and 9(b) show the shock and blast waves measured at theshooting distances of 100m and 200m, respectively. Theseresults correspond to the shooting experimental results ofthe 7:62mm bullet with the delta type sensor unit. These out-comes show that the blast waves arrive after the arrival of theshock waves. Figures 9(c) and 9(d) show the shock wavesmeasured by the six acoustic sensors at the shooting distancesof 100 m and 200m, respectively, using the same conditions.Herein, S1–S6 represent the six acoustic sensors whosearrangements are shown in Figure 7.
The arrival time of the blast wave can be simply calcu-lated as
ffiffiffiffiffiffiffiffiffiffiffiffiffiffiffiffiffiðx2 + L2Þp/c. Figure 10 shows the experimental
and calculated time delays between the shock and blast wavesaccording to the shooting distance measured from the delta-type sensor unit. Based on this figure, it is confirmed that thetime delay of the shockwave increases as the shooting distanceincreases, and the error range of the experimental values isvery small. However, the difference between the experimentaland calculated values increases as the shooting distanceincreases. Amaximumdifference of 7:0% is obtained for a dis-tance of 200m. This appears to be caused because the theoret-ical equation cannot consider the nonlinear characteristics ofthe flight of the bullet, such as the drag, which occurs in long-distance flights as the shooting distance increases.
Use of the point of impact at the instant the bullet pene-trated the target in the actual shooting test, allows the calcu-lation of the actual coordinates from the center of the arrayed
Target Recording PC
Signalconditioner
(a)
DAQ
(b)
(c)
Figure 8: Test setup of the impact-point estimation system (IPES). (a) H-type sensor unit. (b) Delta-type sensor unit. (c) Data processingsetup.
5Journal of Sensors
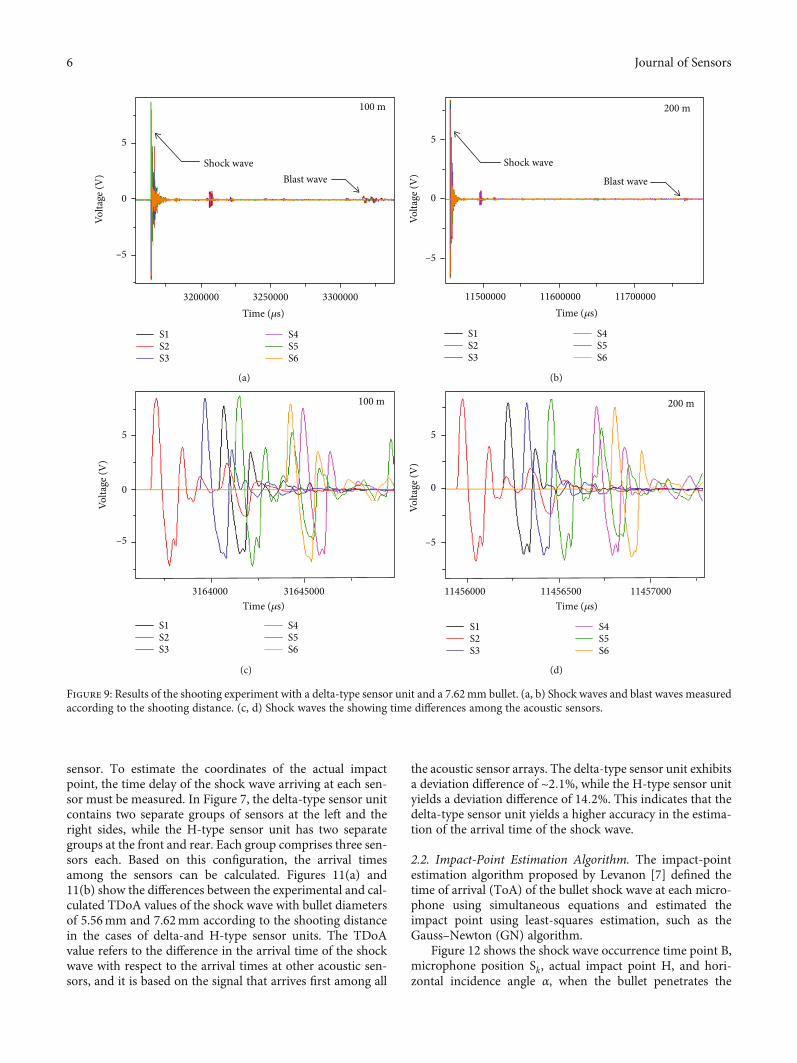
sensor. To estimate the coordinates of the actual impactpoint, the time delay of the shock wave arriving at each sen-sor must be measured. In Figure 7, the delta-type sensor unitcontains two separate groups of sensors at the left and theright sides, while the H-type sensor unit has two separategroups at the front and rear. Each group comprises three sen-sors each. Based on this configuration, the arrival timesamong the sensors can be calculated. Figures 11(a) and11(b) show the differences between the experimental and cal-culated TDoA values of the shock wave with bullet diametersof 5.56mm and 7.62mm according to the shooting distancein the cases of delta-and H-type sensor units. The TDoAvalue refers to the difference in the arrival time of the shockwave with respect to the arrival times at other acoustic sen-sors, and it is based on the signal that arrives first among all
the acoustic sensor arrays. The delta-type sensor unit exhibitsa deviation difference of ~2:1%, while the H-type sensor unityields a deviation difference of 14:2%. This indicates that thedelta-type sensor unit yields a higher accuracy in the estima-tion of the arrival time of the shock wave.
2.2. Impact-Point Estimation Algorithm. The impact-pointestimation algorithm proposed by Levanon [7] defined thetime of arrival (ToA) of the bullet shock wave at each micro-phone using simultaneous equations and estimated theimpact point using least-squares estimation, such as theGauss–Newton (GN) algorithm.
Figure 12 shows the shock wave occurrence time point B,microphone position Sk, actual impact point H, and hori-zontal incidence angle α, when the bullet penetrates the
5
3200000 3250000
Shock wave
Volta
ge (V
) Blast wave
3300000Time (𝜇s)
0
–5
100 m
S1S2S3
S4S5S6
(a)
11500000 11600000Time (𝜇s)
11700000
5
Volta
ge (V
)
0
–5
200 m
S1S2S3
S4S5S6
Blast wave
Shock wave
(b)
3164000 31645000
100 m
Time (𝜇s)
5
Volta
ge (V
)
0
–5
S1S2S3
S4S5S6
(c)
11456000 11456500 11457000
200 m
Time (𝜇s)
5
Volta
ge (V
)
0
–5
S1S2S3
S4S5S6
(d)
Figure 9: Results of the shooting experiment with a delta-type sensor unit and a 7.62mm bullet. (a, b) Shock waves and blast waves measuredaccording to the shooting distance. (c, d) Shock waves the showing time differences among the acoustic sensors.
6 Journal of Sensors

target. If the ToA at which the shock wave that occurs atB and arrives at Sk is defined as tk, tk can be expressedaccording to Equation (2).
tk = tof f set −1V
x − xkð Þ sin α − yk cos α½ �
+ffiffiffiffiffiffiffiffiffiffiffiffiffiffiffiffiffiffiffiffiffiffiffiffiffiffiffiffiffiffiffiffiffiffiffiffiffiffiffiffiffiffiffiffiffiffiffiffiffiffiffiffiffiffiffiffiffiffiffiffiffiffiffiffiffiffiffiffiffiffiffiffix − xkð Þ cos α + yk sin α½ �2 + h − hkð Þ2
q×
ffiffiffiffiffiffiffiffiffiffiffiffiffiffiffiffiffi1C2 −
1V2
r
ð2Þ
where tof f set is the common delay time for all the micro-phones and is expressed as tof f set = −y0/V , c is the speedof sound, V is the velocity of the bullet, and y0 is the posi-tion of the signal that reaches the microphone. Nonlinearequations are defined in the number of microphones usingthe arrival time and position of each microphone. Theequation listed above contains six variables. Specifically,x and h are impact points, and α is the horizontal incidenceangle. Therefore, to calculate the simultaneous equations,six or more equations, i.e., six or more microphone signals
7.62 mm experiments
100
400000
350000
300000
250000
200000
150000
150 200Shooting distance (m)
Dela
y be
twee
n sh
ock
and
blas
t wav
es (𝜇
s)
7.62 mm calculations5.56 mm calculations5.56 mm experiments
Figure 10: Experimental and calculated time delays between the shock and blast waves.
100
80
60
Diff
eren
ce o
f TD
oA (𝜇
s)
40
20
0100 150
Shooting distance (m)200
7.62 mm5.56 mm
(a)
100
80
60
Diff
eren
ce o
f TD
oA (𝜇
s)
40
20
0100 150
Shooting distance (m)200
7.62 mm5.56 mm
(b)
Figure 11: Differences between the experimental and calculated values of the TDoA between the sensors according to the shooting distance(100m, 200m). (a) Delta- and (b) H-type sensor units. The error bars represent the standard deviations from three measurements obtainedwith two types of bullets.
7Journal of Sensors

are required. In this study, signals were acquired from acous-tic sensors using delta- and H-type sensor units.
The method proposed by Levanon [7] uses the ToAmethod. Compared with the TDoA method, this methodproduces significantly different operation results when thereare ToA measurement errors [8], including the instances atwhich time synchronization problems occur. Therefore, theimpact points of the delta- and H-type sensor units were esti-mated using the TDoA-based impact-point estimation algo-rithm proposed by Won and Park [9].
Figure 13 shows a flow chart of the process used for theimpact-point estimation algorithm. The algorithm designatesinitial values (impact point, speed of sound, and bullet veloc-ity), performs iterative operations using the GN algorithm,and completes the iterative operations and displays theresults when the variation of the operation result decreasesbelow the set value. H denotes the partial differential of χ,
and R(i) denotes the difference between the measured timedifference and the calculated time difference. Δp representsthe amount of change in x and y at each iteration.
Even though 20 rounds were fired in the shooting exper-iment, 13 datasets were obtained because seven roundsmissed the target. Table 2 lists the shooting conditions andmeasured coordinates as well as the coordinates calculatedusing TDoA for the 13 datasets acquired from the shootingexperiment. Furthermore, the data for the shooting distanceof 200m included only three datasets. At this time, the x-axiscoordinate represents the horizontal coordinate and thez-axis coordinate represents the vertical coordinate. The cen-ter point of the target used in the experiment is convertedinto the coordinates (0, 900).
Figure 14 shows the measured impact-point coordinatesas well as the calculated impact-point coordinates using thedelta- and H-type sensor units. Compared to those estimated
z
x
y = 0
𝛼y h
H (x, 0, h)
B (0, y, h)
A (0, y0, h)Sk (xk, yk, zk)
Figure 12: Geometry of target.
Initialization x
Compute𝛥p = (HT H) –1HT [R(i)]
Measurement TDoA
x(i+1) = x(i) + 𝛥p
Finish
Y
N
𝛥p < 𝜀
i = i + 1
Figure 13: Flow chart of the impact-point estimation algorithm.
8 Journal of Sensors

for the delta-type sensor unit, the calculated coordinates esti-mated for the H-type sensor unit are slightly biased to thedirection at the bottom–left. In addition, the H-type sensorunit has difficulties the determination of the measuredimpact point in the upward–downward directions becauseall six acoustic sensors are present on the same plane, asshown in Figure 15. As the impact-point estimation algorithm
performs operations by designating the target center as theinitial value, an actual bullet that passes through the bottomof the acoustic sensors can be determined as being positionedabove the acoustic sensors. To address this problem, it seemsnecessary to place additional acoustic sensors or to adjust thepositions of the existing acoustic sensors.
Conversely, the delta-type sensor unit is capable of deter-mining the impact point in the upward–downward direc-tions, and thus avoids the problem identified above. Themean absolute error ðMAEÞ between the measured coordi-nates and the calculated coordinates of impact-point positionis estimated with Equation (3).
MAE = ∑ni=1 mi − cij jð Þ
nð3Þ
wherem is the measured coordinate, c is the calculated coor-dinate and n is the number of data points.
Table 2: The measured and the calculated impact-point coordinates.
Test times Shooting distance (m) Bullet diameter (mm)Measured
coordinates (mm)
CalculatedCoordinates
(mm), Delta-type
Calculatedcoordinates(mm), H-type
X axis Z axis X axis Z axis X axis Z axis
1
100
7.62
60.0 843.0 68.5 844.5 48.7 818.5
2 −68.0 1050.0 −63.5 1048.6 −76.4 1030.3
3 126.0 669.0 128.3 667.0 111.8 648.9
4 −36.0 648.0 −33.0 649.3 −43.6 623.3
5 87.0 1063.0 95.6 1060.0 77.2 1032.4
6
5.56
35.0 965.0 39.6 962.3 No data No data
7 −47.0 1058.0 −38.4 1048.2 −53.5 1023.0
8 118.0 712.0 112.4 709.4 105.1 689.5
9 −20.0 625.0 −10.2 624.1 −22.6 596.9
10 93.0 922.0 101.4 908.6 77.0 887.6
11
2007.62
113.0 765.0 116.1 770.7 99.4 743.2
12 231.0 1072.0 228.2 1070.5 208.9 1032.0
13 5.56 55.0 709.0 52.7 712.2 41.9 686.4
1100
1000
900
800
700
600–100 0 100 200 300
X-axis coordinate (mm)
Z-a
xis c
oord
inat
e (m
m)
MeasuredDelta-typeH-type
Figure 14: The measured and calculated impact-point coordinates.
S4 S5 S6
S1 S2 S3300
400
800Unit: mm
Figure 15: Schematic shows a potential problem with the samesignal in an H-type sensor unit.
9Journal of Sensors

Table 3 shows the MAE values of the delta- and H-typesensor units for different bullet diameters. In the case of theshooting distance of 100m, the MAE value of the delta-typeis relatively smaller than the MAE value of the H-type.Accordingly, it is considered that the delta-type of impactprediction performance is better. In the case of the H-typesensor unit, the reason why the MAE value of the Z axis islarger than the MAE value of the X axis is attributed to thefact that the problem arises because the sensor is arrangedin the X axis as mentioned above. Furthermore, given thatthe MAE value of the bullet with a diameter of 7.62mm is rel-atively smaller than that for the bullet with a diameter of5.56mm, it is considered that the impact prediction perfor-mance of the bullet with a diameter of 7.62mm is superior.In the case of the shooting distance of 200m, the MAE valueof the delta-type is also relatively smaller than the MAE valueof the H-type. However, given that the MAE value is calcu-lated using only three shooting datasets, the reliability ofthe MAE value cannot be confirmed.
3. Conclusions
This study presents the first performance evaluation out-comes on the accuracy of the IPES according to two typesof acoustic sensor arrangement methods. First, the acousticsensor suitable for measuring shock waves was selected, andthe various acoustic sensors were then tested. Subsequently,acoustic sensors with uniform sensitivity and phase charac-teristics were used in the shooting experiment, and it wasconfirmed that they had almost identical response character-istics for shock wave measurements. An IPES was con-structed with the use of delta-type and H-type sensor unitswith the selected acoustic sensors, and shock waves were col-lected by performing shooting experiments at the shootingdistances of 100m and 200m, and with two types of bulletswith the diameters of 5:56mm and 7:62mm. By comparingthe experimental and calculated TDoA values of the shockwave for delta-type and H-type sensor units, the TDoAvalues of the delta type sensor unit exhibited a low differencedeviation of 2:1%. The coordinates of the impact point wereobtained from actual shooting tests and the impact-pointestimation algorithm based on TDoA datasets for the delta-and H-type sensor units. Because the MAE values of thedelta-type sensor unit were relatively smaller than those forthe H-type sensor unit, it was considered that the perfor-mance of the delta-type impact-point estimation was betterthan that of the H-type unit. It is expected that this study will
contribute to the improvement of the accuracy of the IPESbased on the acoustic sensor arrangement method.
Data Availability
The data used to support the findings of this study are avail-able from the corresponding author upon request.
Conflicts of Interest
The authors declare that there is no conflict of interestregarding the publication of this paper.
Funding
This study was supported by the KIMM Project (UD0910) ofthe Civil Military Technology Cooperation Program (16-PD-SS-02) and the Industrial Strategic Technology DevelopmentProgram) (10078310, MO9500, Development of High SpeedMulti-pass DTP System) funded by the Ministry of Trade,Industry & Energy (MOTIE, Korea).
References
[1] R. C. Maher, “Modeling and signal processing of acoustic gun-shot recordings,” in 2006 IEEE 12th Digital Signal ProcessingWorkshop & 4th IEEE Signal Processing Education Workshop,pp. 257–261, Teton National Park, WY, USA, September 2006.
[2] R. C. Maher and S. R. Shaw, “Deciphering gunshot recordings,”in Audio Engineering Society Conference: 33rd InternationalConference: Audio Forensics-Theory and Practice, AudioEngineering Society, 2008.
[3] J. George and L. M. Kaplan, “Shooter localization using a wire-less sensor network of soldier-worn gunfire detection systems,”Journal of Advances in Information Fusion, vol. 8, no. 1,pp. 15–32, 2013.
[4] G. L. Duckworth, J. E. Barger, S. H. Carlson et al., “Fixed andwearable acoustic counter-sniper systems for law enforcement,”in Proceedings Volume 3577, Sensors, C3I, Information, andTraining Technologies for Law Enforcement. InternationalSociety for Optics and Photonics, Boston, MA, USA, 1999.
[5] T. Mäkinen and P. Pertilä, “Shooter localization and bullet tra-jectory, caliber, and speed estimation based on detected firingsounds,” Applied Acoustics, vol. 71, no. 10, pp. 902–913, 2010.
[6] B. G. Horman, Sound Suppressors 101, American Rifleman,2013.
[7] N. Levanon, “Acoustic hit indicator,” 1999, U.S. Patent No.5,920,522.
Table 3: Mean absolute error according to bullet type.
Shooting Bullet Delta-type H-typeDistance(m)
Diameter(mm)
X axis MAE (mm) Z axis MAE (mm) X axis MAE (mm) Z axis MAE (mm)
1005.56 7.40 5.88 9.5 30.00
7.62 5.38 1.84 10.26 23.92
2005.56 2.30 3.2 13.1 22.60
7.62 2.95 3.6 17.85 30.95
10 Journal of Sensors

[8] J.-W. Park, J.-H. Park, S.-H. Song, and T.-K. Sung, “Compar-isons of error characteristics between TOA and TDOA posi-tioning in dense multipath environment,” Transactions of theKorean Institute of Electrical Engineers, vol. 58, no. 2,pp. 415–421, 2009.
[9] J. Won and K. Park, “Impact point estimation system of the riflebased on time difference of arrival method using microphonearray,” Journal of the Acoustical Society of Korea, vol. 37,no. 4, pp. 206–214, 2018.
11Journal of Sensors

International Journal of
AerospaceEngineeringHindawiwww.hindawi.com Volume 2018
RoboticsJournal of
Hindawiwww.hindawi.com Volume 2018
Hindawiwww.hindawi.com Volume 2018
Active and Passive Electronic Components
VLSI Design
Hindawiwww.hindawi.com Volume 2018
Hindawiwww.hindawi.com Volume 2018
Shock and Vibration
Hindawiwww.hindawi.com Volume 2018
Civil EngineeringAdvances in
Acoustics and VibrationAdvances in
Hindawiwww.hindawi.com Volume 2018
Hindawiwww.hindawi.com Volume 2018
Electrical and Computer Engineering
Journal of
Advances inOptoElectronics
Hindawiwww.hindawi.com
Volume 2018
Hindawi Publishing Corporation http://www.hindawi.com Volume 2013Hindawiwww.hindawi.com
The Scientific World Journal
Volume 2018
Control Scienceand Engineering
Journal of
Hindawiwww.hindawi.com Volume 2018
Hindawiwww.hindawi.com
Journal ofEngineeringVolume 2018
SensorsJournal of
Hindawiwww.hindawi.com Volume 2018
International Journal of
RotatingMachinery
Hindawiwww.hindawi.com Volume 2018
Modelling &Simulationin EngineeringHindawiwww.hindawi.com Volume 2018
Hindawiwww.hindawi.com Volume 2018
Chemical EngineeringInternational Journal of Antennas and
Propagation
International Journal of
Hindawiwww.hindawi.com Volume 2018
Hindawiwww.hindawi.com Volume 2018
Navigation and Observation
International Journal of
Hindawi
www.hindawi.com Volume 2018
Advances in
Multimedia
Submit your manuscripts atwww.hindawi.com


