
Performance Report 2017-18 | ABUHB
31
Aneurin Bevan University Health Board Performance Analysis Report 2017/18
Transcript of Performance Report 2017-18 | ABUHB

1 | P a g e
Aneurin Bevan University Health Board
Performance Analysis Report
2017/18
2 | P a g e
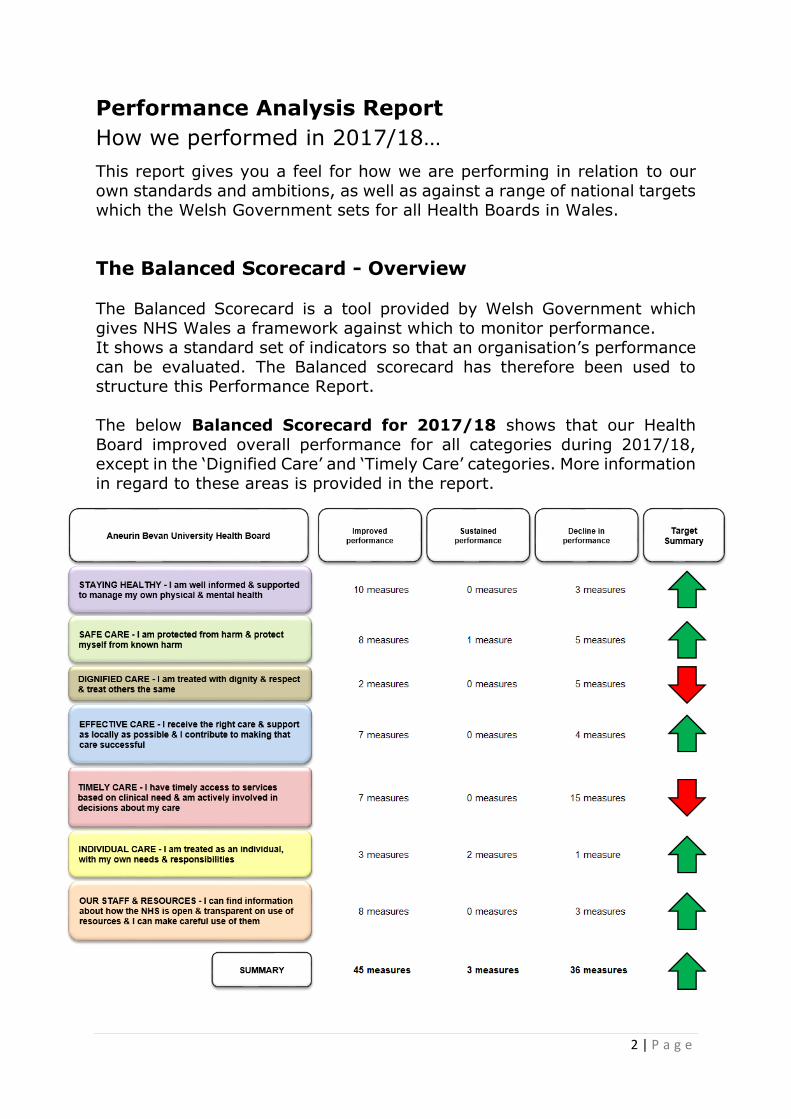
Performance Analysis Report
How we performed in 2017/18…
This report gives you a feel for how we are performing in relation to our
own standards and ambitions, as well as against a range of national targets which the Welsh Government sets for all Health Boards in Wales.
The Balanced Scorecard - Overview The Balanced Scorecard is a tool provided by Welsh Government which
gives NHS Wales a framework against which to monitor performance. It shows a standard set of indicators so that an organisation’s performance
can be evaluated. The Balanced scorecard has therefore been used to structure this Performance Report.
The below Balanced Scorecard for 2017/18 shows that our Health
Board improved overall performance for all categories during 2017/18, except in the ‘Dignified Care’ and ‘Timely Care’ categories. More information
in regard to these areas is provided in the report.

3 | P a g e
Our Performance in more detail
This report gives you information on how we are performing in relation to
our own standards and ambitions, as well as against a range of national
targets which the Welsh Government sets for all the Health Boards in
Wales.
We have used the seven categories from the Welsh Government Balanced
Scorecard as headings to present this information. These are:
Staying Healthy
Safe Care
Dignified Care
Effective Care
Timely Care
Individual Care
Our Staff and Resources
The report covers the financial year (April 2017 to March 2018), although
where appropriate data for 2016/17 has also been provided to enable a
comparison to be made year-on-year.
Staying Healthy
Flu vaccinations
Influenza, more commonly known as the flu, is a respiratory illness which
affects the lungs and airways. Anyone can get flu and the flu virus is easily
passed from person to person. Flu can spread rapidly, especially in closed
communities such as residential homes. Most people who are fit and well
recover fully from a bout of flu, but complications can occur (particularly in
the very young, older people, those who are pregnant, and people with
certain medical conditions). This can result in serious illness or even death.
Due to this increased vulnerability, we target these groups and encourage
them to take up the offer of a free vaccination.
Each year we review the effectiveness of vaccination campaigns by looking
at the percentage of eligible people who were vaccinated. During the winter
months, when flu is most common, we look at some of these percentages
on a weekly basis. Members of our staff are also encouraged to take up the
offer of free vaccination. This is because front line staff members are more
likely to be exposed to flu and, if large numbers of our staff are off sick,
there would be a severe impact on the services we provide.

4 | P a g e
In 2017/18 the uptake of influenza vaccination in groups that are at
particular risk following infection increased slightly, the percentage of our
staff, who are in direct contact with patients, who were vaccinated
increased significantly and exceeded the 50% target level.
Uptake of the national influenza vaccination. The figure for
‘pregnant women’ is not yet available as this is based on survey
rather than GP reported data.
source – Public Health Wales
Chronic conditions
Large numbers of people in Gwent live with chronic conditions such as heart
disease, epilepsy, diabetes and chest disease. Sometimes these conditions
get worse and people may then need to be admitted to hospital for
emergency care. These admissions are disruptive for people and their
families and may lead to lengthy stays in hospital.
However, if people are provided with the information and resources that
they need to manage their condition and they also have access to good
support in the community from their GP, nursing teams, voluntary agencies
and many other services, they may be able to avoid a possible worsening
of their condition and the frequency of these emergency admissions can be
reduced.
We monitor these admissions and readmissions to provide an indication of
how well we are doing in our provision of community and other support for
people with chronic conditions.
0%
10%
20%
30%
40%
50%
60%
70%
80%
≥ 65 years <65 in at risk groups pregnant women healthcare staff
2013/2014
2014/2015
2015/2016
2016/2017
2017/2018
5 | P a g e
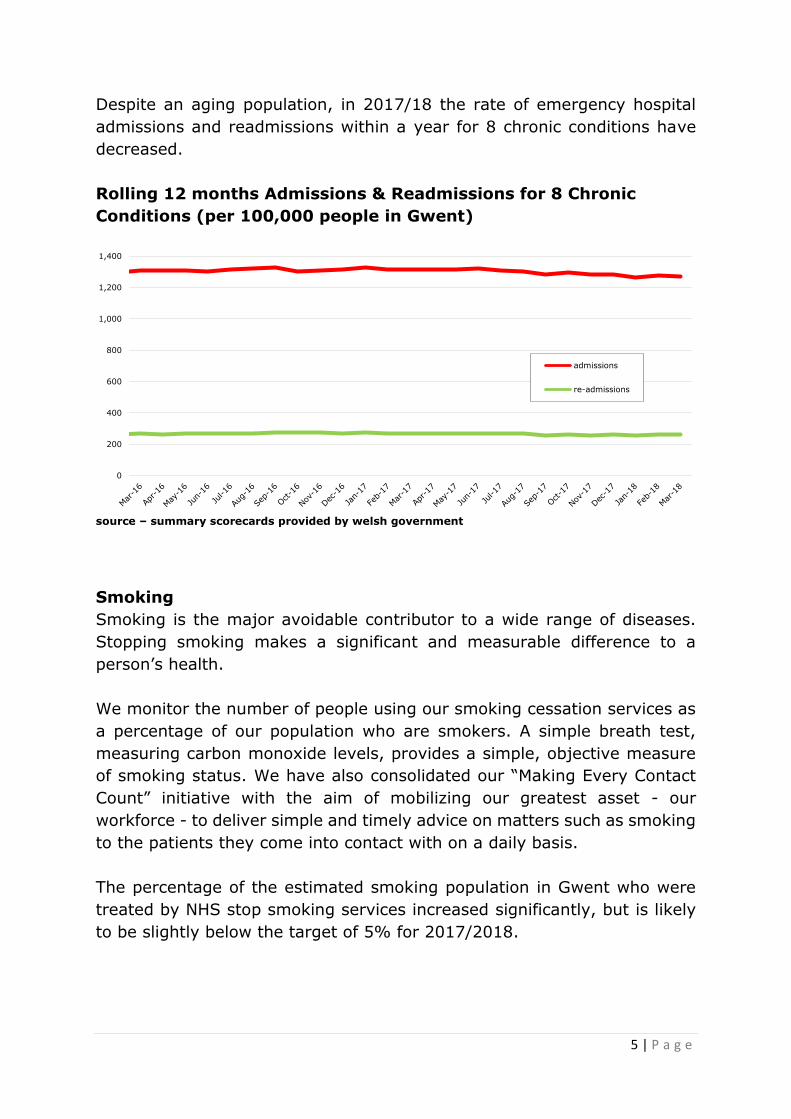
Despite an aging population, in 2017/18 the rate of emergency hospital
admissions and readmissions within a year for 8 chronic conditions have
decreased.
Rolling 12 months Admissions & Readmissions for 8 Chronic
Conditions (per 100,000 people in Gwent)
source – summary scorecards provided by welsh government
Smoking
Smoking is the major avoidable contributor to a wide range of diseases.
Stopping smoking makes a significant and measurable difference to a
person’s health.
We monitor the number of people using our smoking cessation services as
a percentage of our population who are smokers. A simple breath test,
measuring carbon monoxide levels, provides a simple, objective measure
of smoking status. We have also consolidated our “Making Every Contact
Count” initiative with the aim of mobilizing our greatest asset - our
workforce - to deliver simple and timely advice on matters such as smoking
to the patients they come into contact with on a daily basis.
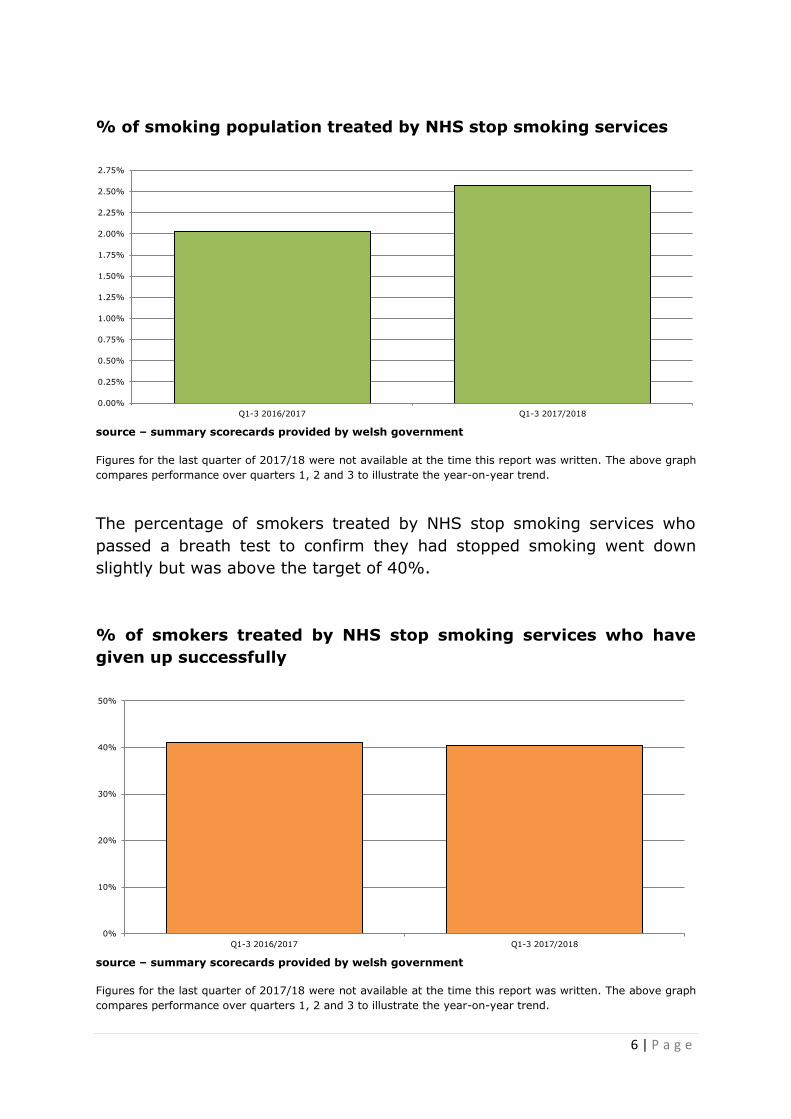
The percentage of the estimated smoking population in Gwent who were
treated by NHS stop smoking services increased significantly, but is likely
to be slightly below the target of 5% for 2017/2018.
0
200
400
600
800
1,000
1,200
1,400
admissions
re-admissions
6 | P a g e
% of smoking population treated by NHS stop smoking services
source – summary scorecards provided by welsh government
Figures for the last quarter of 2017/18 were not available at the time this report was written. The above graph
compares performance over quarters 1, 2 and 3 to illustrate the year-on-year trend.
The percentage of smokers treated by NHS stop smoking services who
passed a breath test to confirm they had stopped smoking went down
slightly but was above the target of 40%.
% of smokers treated by NHS stop smoking services who have
given up successfully
source – summary scorecards provided by welsh government
Figures for the last quarter of 2017/18 were not available at the time this report was written. The above graph
compares performance over quarters 1, 2 and 3 to illustrate the year-on-year trend.
0.00%
0.25%
0.50%
0.75%
1.00%
1.25%
1.50%
1.75%
2.00%
2.25%
2.50%
2.75%
Q1-3 2016/2017 Q1-3 2017/2018
0%
10%
20%
30%
40%
50%
Q1-3 2016/2017 Q1-3 2017/2018

7 | P a g e
Childhood vaccinations
The Health Board has robust reminder processes in place to try to promote
the uptake of a wide range of childhood vaccinations. We also promote and
participate in advertising and public awareness initiatives and campaigns.
Achievement of uptake at or above a level of 95% amongst the relevant
groups of children is the required level to ensure that communities are
protected from outbreaks. In previous years, the uptake rate for routine
vaccinations at four years of age was used as the overall indicator. Welsh
Government now uses the uptake rates for 3 doses of the 5 in 1 vaccine by
the age of one and two doses of the MMR vaccine by the age of five as the
key indicators. As can be seen in the chart, we are consistently achieving
the 95% uptake rate for the 5 in 1 vaccine but, although improving, we are
yet to achieve the optimal uptake rate for the MMR vaccine.
In 2017/18, the focus has been on working with partners in primary care
Neighbourhood Care Networks to improve the uptake of all primary
childhood immunisations in the most disadvantaged areas of the Health
Board in order to meet the 95% uptake standard.
Quarterly uptake of scheduled children’s immunisations
source – summary scorecards provided by welsh government
75%
80%
85%
90%
95%
100%
5_in_1_vaccine_age_1
second_MMR_dose_age_5

8 | P a g e
Safe Care
Patient Infection Rates
We take the safety of our patients very seriously. That means doing
everything we can to reduce the risk of anyone acquiring an infection while
they are in our care both in hospital and at home. Infection prevention is
regarded as everyone’s business and the Health Board is committed to
supporting staff in preventing infections. The Health Board maintains a
zero-tolerance approach to infections picked up in our hospitals and all
individual cases are fully investigated and any required actions taken.
Monthly number of cases of E Coli, C Difficile and Staph Aureus
bacteraemia
source – Public Health Wales
Patient safety alerts and notices
The Welsh Government has established Patient Safety Solutions at a
national level to issue Alerts and Notices to the NHS in Wales.
ALERT: This requires prompt action with a specified implementation date
to address high risks/significant safety problems that have been identified.
NOTICE: This is issued to ensure that organisations and all relevant
healthcare staff are made aware of potential patient safety issues at the
earliest opportunity.
We are committed to implementing the recommendations from Patient
Safety Solutions Wales within the identified timescales and keep track of
any failures to achieve this aim.
0
5
10
15
20
25
30
35
40
45
50
e_coli
s_aureus
c_difficile
9 | P a g e
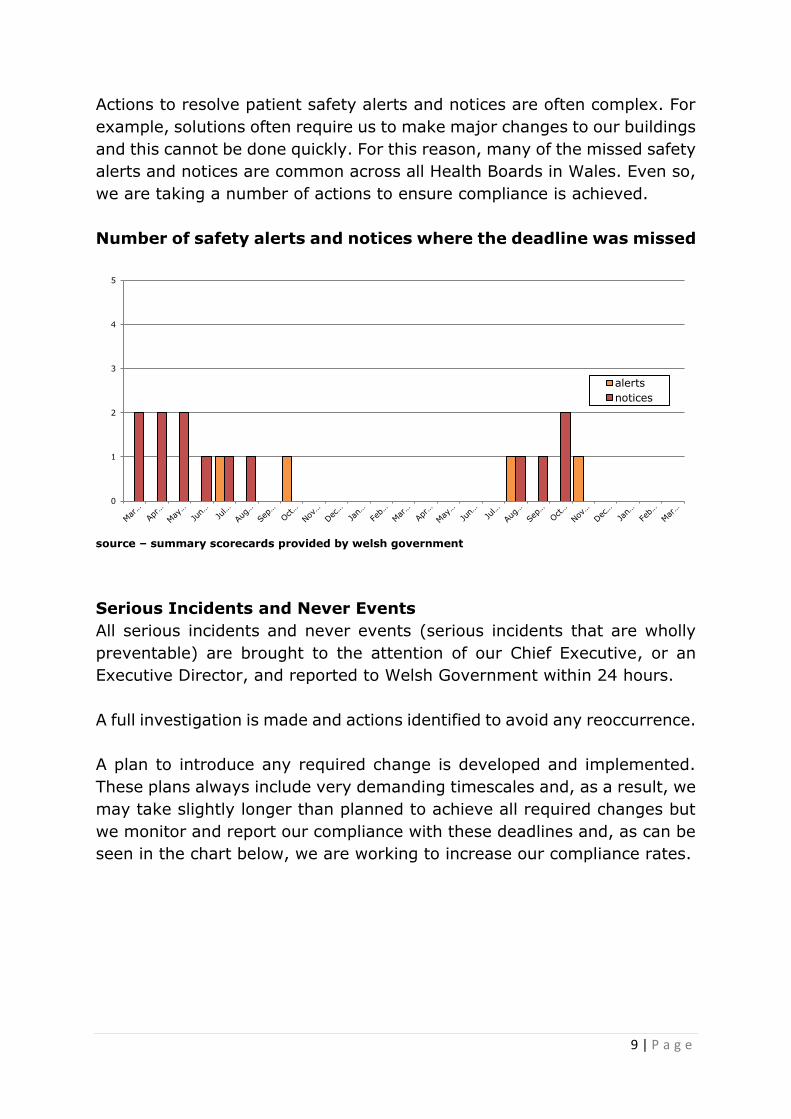
Actions to resolve patient safety alerts and notices are often complex. For
example, solutions often require us to make major changes to our buildings
and this cannot be done quickly. For this reason, many of the missed safety
alerts and notices are common across all Health Boards in Wales. Even so,
we are taking a number of actions to ensure compliance is achieved.
Number of safety alerts and notices where the deadline was missed
source – summary scorecards provided by welsh government
Serious Incidents and Never Events
All serious incidents and never events (serious incidents that are wholly
preventable) are brought to the attention of our Chief Executive, or an
Executive Director, and reported to Welsh Government within 24 hours.
A full investigation is made and actions identified to avoid any reoccurrence.
A plan to introduce any required change is developed and implemented.
These plans always include very demanding timescales and, as a result, we
may take slightly longer than planned to achieve all required changes but
we monitor and report our compliance with these deadlines and, as can be
seen in the chart below, we are working to increase our compliance rates.
0
1
2
3
4
5
alerts
notices

10 | P a g e
Of the Serious Incidents due for assurance within the month, the
% which were assured within the agreed timescale
source – summary scorecards provided by welsh government
Number of new Never Events:
source – summary scorecards provided by welsh government
Further information on the safety of our care and services is
available in our Annual Quality Statement at the link below:
http://www.wales.nhs.uk/sitesplus/866/page/62034
0%
20%
40%
60%
80%
100%
0
1
2
3
4
5

11 | P a g e
Dignified Care
The cancellation of an operation, especially at short notice, causes great
inconvenience for a patient and may prolong a period of anxiety and
discomfort.
We try hard to avoid cancellations, but if circumstances (such as very high
levels of demand for emergency care and treatments) make them
unavoidable we try to re-book as soon as possible.
We monitor our performance in rebooking following a cancellation and
report it to Welsh Government.
In 2017/2018, over the winter months when there was increased pressure
from emergency demand, our performance against this measure decreased
slightly but has started to recover and to carry on the overall upward trend.
% patients who had their procedure postponed on more than one
occasion and had their procedure within 14 days or at the patient’s
earliest convenience
source – summary scorecards provided by welsh government
0%
10%
20%
30%
40%
50%
60%
70%
80%

12 | P a g e
Effective Care
Delayed transfer of care
We recognise that we have high rates of patients who experience a delay
in their discharge or transfer to a different care environment.
This is an issue that is common across the UK. Considerable effort is going
into reducing the numbers and lengths of delays that can be attributed to
health and social care. However, a major reason for delays is patient choice
and family-related issues with selecting a nursing or residential home, or
the wait for a vacancy.
We have a Choice of Accommodation Policy to better support patients and
their families in making decisions about their future care and consequently
reducing delays. We are working closely with local authorities to address
the problems of delays due to the lack of suitable accommodation.
In 2017/18 the trend in the monthly rate for patients with mental health
problems was level but for patients with physical problems delayed
transfers of care increased slightly.
Monthly rates per 10,000 of the Gwent population experiencing a
delayed transfer of care (mental health = all ages, non-mental
health = patients aged 75 and older)
source – StatsWales
0
20
40
60
80
100
120
mh
non-mh

13 | P a g e
Mortality rates
Although death at the end of a hospital stay is sometimes inevitable, it is
crucial that we monitor and openly report rates to ensure that the risk of
avoidable deaths is minimised for all patients.
The ‘crude mortality rate’ is the percentage of our patients who die following
admission to one of our hospitals. We monitor these rates for all patients,
but nationally the measure is the rate for patients under the age of 75.
In 2017/18 the crude mortality rate for these patients (rolling 12 months)
in the Health Board remained stable and was consistently lower than the
average for the other Health Boards in Wales.
Crude mortality rate in patients <75 years of age
source – icompare - CHKS
Principle Diagnosis Code
The detailed information that makes up the narrative and content of the
clinical record of a patient’s stay in hospital is essential in managing and
optimising the care that the patient receives during that stay and any future
stays in hospital. However, if this information is to be used for analysis,
planning and reporting, it must be categorised and recorded as clinical
codes.
It is important that this is done as soon as possible after the end of a
patient’s stay in hospital so that this information is available for a wide
range of uses, such as the planning and costing of services. For this reason,
0.0%
0.1%
0.2%
0.3%
0.4%
0.5%
0.6%
0.7%
0.8%
0.9%
1.0%
abuhb
other health boards

14 | P a g e
we closely monitor and report the timeliness of coding.
Previously the target was that 95% of patients would have their diagnosis
coded within 3 months following their discharge but this period has been
shortened to 1 month following discharge.
In 2017/18 the average percentage of valid principal diagnosis codes
completed one month after the episode end date increased slightly from
2016/17 but is still below the target of 95%.
% valid principal diagnosis code 1 month after episode (target =
95%)
source – summary scorecards provided by welsh government
Research Studies
Research is essential for the improvement of the care that we provide for
patients and the outcome of their care and treatments. The Health Board
actively participates in a broad range of research activity.
The number of Health and Care Research Wales portfolio studies has
increased steadily and significantly over the past six years.
50%
55%
60%
65%
70%
75%
80%
85%
90%
95%
100%

15 | P a g e
Number of Health & Care Research Wales Clinical Research
Portfolio Studies
source – summary scorecards provided by welsh government
Timely Care
Access to GPs
Access to a GP appointment at a convenient time may be difficult, especially
for people working full time, or with demanding family or other
commitments. Extended opening hours improves this access.
The percentage of GP practices open within 1 hour of the daily core hours
increased in 2016 and has been maintained at 100% in 2017.
Percentage of GP practices open during daily core hours or within
1 hour of daily core hours
source – summary scorecards provided by welsh government
0
10
20
30
40
50
60
70
80
90
2012/2013 2013/2014 2014/2015 2015/2016 2016/2017 2017/2018
0%
20%
40%
60%
80%
100%
2013 2014 2015 2016 2017
16 | P a g e
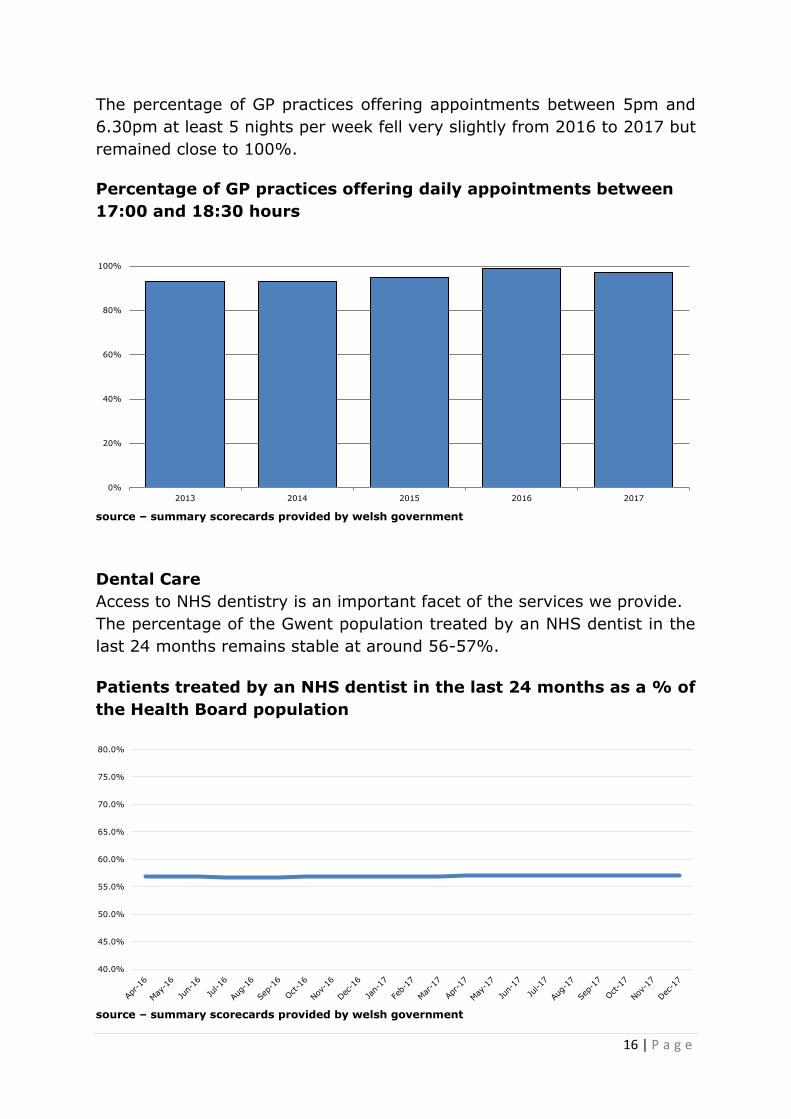
The percentage of GP practices offering appointments between 5pm and
6.30pm at least 5 nights per week fell very slightly from 2016 to 2017 but
remained close to 100%.
Percentage of GP practices offering daily appointments between
17:00 and 18:30 hours
source – summary scorecards provided by welsh government
Dental Care
Access to NHS dentistry is an important facet of the services we provide.
The percentage of the Gwent population treated by an NHS dentist in the
last 24 months remains stable at around 56-57%.
Patients treated by an NHS dentist in the last 24 months as a % of
the Health Board population
source – summary scorecards provided by welsh government
0%
20%
40%
60%
80%
100%
2013 2014 2015 2016 2017
40.0%
45.0%
50.0%
55.0%
60.0%
65.0%
70.0%
75.0%
80.0%

17 | P a g e
GP referral to treatment waiting times
The wait between referral by a GP and access to an outpatient appointment,
investigation and treatment may create anxiety and uncertainty. We
monitor and report the time that patients wait and we try to minimise
waiting times.
% of patients waiting less than 26 weeks for treatment (RTT)
Although in 2017/18 the percentage of patients waiting less than 26 weeks
for treatment (RTT) did not reach the goal of 95%, performance was
consistently within 10% of the target.
Further improving this performance is a key concern for the Health Board.
Percentage of patients with a referral to treatment time less than
26 weeks
source – summary scorecards provided by welsh government
80%
85%
90%
95%
100%
26 week actual target

18 | P a g e
Number of RTT 36 week breaches
Although lower than in previous years, the numbers of patients waiting
longer than 36 weeks for treatment remained largely static throughout
most of 2017/2018 but they have significantly reduced in the last 2 months
of the year.
Number of patients who have been waiting longer than 36 weeks
for treatment
source – summary scorecards provided by welsh government
Waiting times for Children and Adolescent Mental Health Services
(CAMHS)
For some services we work to lower waiting time targets. Children waiting
for mental health services are particularly vulnerable so we try to see the
majority of them within 4 weeks of referral. The number of children waiting
over 4 weeks has been reduced in 2017/2018.
Numbers waiting for CAMH Services
source – StatsWales
0
500
1000
1500
2000
2500
3000
3500
4000
4500
0
50
100
150
200
250
300
350
400
450
500
>26weeks
4-26weeks
<4weeks

19 | P a g e
% of patients waiting less than 8 weeks for specified diagnostic
tests.
The percentage of patients waiting less than 8 weeks for specified
diagnostic tests improved significantly during 2017/18.
Numbers of people waiting for diagnostic tests by time band and %
waiting less than 8 weeks
source – StatsWales
Follow-up appointments
Previously, the main focus for outpatient waiting time reductions was waits
for new or first appointments. We are now equally focused on avoiding long
waits for patients requiring a follow-up appointment.
We monitor figures for patients who were still waiting for an appointment
to be sent to them and patients who have been given an appointment but
have not yet been seen.
The chart below includes both of these groups of people.
0.0%
25.0%
50.0%
75.0%
100.0%
0
5000
10000
15000
20000
25000
30000
35000
40000
>8 weeks
≤ 8 weeks

20 | P a g e
Number of follow-up appointments delayed past their target date
source – summary scorecards provided by welsh government
Stroke care
We use a set of quality improvement standards to monitor the quality of
services that we deliver to people who have had a stroke. The standards
describe the things that should take place within fixed time periods. Welsh
Government publishes a limited sub-set of these standards to report our
performance. The chart below indicates our performance against the full
set of targets.
4 hours: Direct admission to a specialist Acute Stroke Unit and
Screening to make sure that patients have a swallow reflex and will not
choke if given food and fluids
12 hours: A computerised tomography (CT) Scan
24 hours: Assessment by a Stroke Consultant; Assessment by a
Stroke Nurse; Assessment by a Therapist
72 hours: Formal swallow assessment; Occupational Therapy assessment;
Physiotherapy assessment; Speech and Language Therapy communication
assessment
0
5,000
10,000
15,000
20,000
25,000
30,000
35,000
40,000
45,000
50,000

21 | P a g e
% compliance with the quality improvement measures for people
who have suffered a stroke
source – figures produced by the Delivery Unit
Emergency care
The efficiency and effectiveness of all emergency services are closely
related. If ambulance crews have to wait for a long time to hand over their
patient at A&E because of congestion and patients waiting a long time, they
are not available to answer emergency calls.
During periods of very cold weather our hospitals become very busy due to
an increased intake of very poorly people, which results in less seriously ill
people waiting longer to be seen in A&E.
People are still waiting for lengthy periods in our A&E departments before
they are discharged, admitted or transferred. This is an area of concern for
the Health Board and one to which we are actively responding to improve
this position.
0%
10%
20%
30%
40%
50%
60%
70%
80%
90%
100%
4 hours
12 hours
24 hours
72 hours

22 | P a g e
% of new patients spending no longer than 4 hours in A&E (target
95% - amber performance >90%)
source – ISD reportal
Numbers of patients spending 12 hours or more in A&E:
source – ISD reportal
70%
75%
80%
85%
90%
95%
4 hour actual
target
0
100
200
300
400
500
600
700
800
900

23 | P a g e
% of ambulance red call responses within 8 minutes (target 65%)
source – StatsWales
Number of over 1 hour A&E ambulance handovers
source – summary scorecards provided by welsh government
Cancer care
We maintain a strong commitment to the provision of excellent care for
cancer patients and an important aspect of this care is timely access to
cancer services.
There will continue to be a focus on maintaining and improving performance
over the next twelve months in the area of cancer waiting times.
30%
40%
50%
60%
70%
80%
90%
gwent target
0
100
200
300
400
500
600

24 | P a g e
For patients referred to us with suspected cancer, we aim to reach a
diagnosis and start their treatment within 62 days. The national target
requires us to achieve this for at least 95% of patients.
Performance at the start of the year was unacceptably low and significant
effort has gone into reducing the time that these patients wait. As can be
seen on the chart, this work has helped secure an increase in the
percentage of patients starting treatment within 62 days.
% of patients referred as urgent suspected cancer seen within 62
days (target 95%)
source – StatsWales
Some patients who are referred to us for other unrelated reasons are
subsequently diagnosed with cancer. When this happens we seek to start
their treatment within 31 days of this diagnosis being made.
The national target is to achieve this for 98% of patients. We didn’t achieve
this for many of the months in 2017/2018, but performance has improved
at year end and the target was achieved.
70%
75%
80%
85%
90%
95%
100%
62 day actual
target

25 | P a g e
% of patients referred as non-urgent suspected cancer seen within
31 days (target 98%)
source – StatsWales
Mental Health
The care we provide for citizens with mental health problems is just as
important as the care we provide for physical health problems.
Whilst we continue to provide hospital based services for people with
mental health difficulties we have moved some services to primary and
community care settings.
In 2017/18, there has been an increase in the percentage of assessments
by the Local Primary Mental Health Support Services (LPMHSS) undertaken
within 28 days from the date of referral.
There has also been an increase in the percentage of therapeutic
interventions started within 28 days following assessment.
Although we have not yet managed to consistently achieve the 80% target
for both of these measures, performance has visibly improved.
80.0%
85.0%
90.0%
95.0%
100.0%
31 day actual
target

26 | P a g e
% of assessments by the LPMHSS undertaken within 28 days from the
date of referral and the % of therapeutic interventions started within 28
days following assessment by the LPMHSS:
source – summary scorecards provided by welsh government
Individual Care
Number of calls to national helplines (C.A.L.L/Dementia/DAN)
Although we do not directly manage these services, we receive information
about the numbers of people in Gwent who have called these national
helplines. This information helps in decision making about the targeting of
services to ensure that they are tailored to the needs of our local
population.
The helplines we receive figures for are:
C.A.L.L. – Community Advice & Listening Line (Offers
emotional support and information/literature on Mental Health and
related matters to the people of Wales)
Wales Dementia Helpline (offers emotional support to anyone,
of any age, who is caring for someone with dementia as well as
other family members or friends. The service will also help and
support those who have been diagnosed with dementia)
DAN 247 (the drug and alcohol helpline for Wales)
0%
10%
20%
30%
40%
50%
60%
70%
80%
90%
100%
assessment
treatment
target

27 | P a g e
Calls to national helplines
source – summary scorecards provided by welsh government
Mental Health
The care we provide for citizens with mental health problems is just as
important as the care we provide to achieve and maintain physical health.
Individualised services with people involved in deciding and documenting
the care they will receive are crucial in achieving the highest standards of
care.
Throughout the year, the percentage of patients (all ages) who had a valid
Care and Treatment Plan (CTP) completed at the end of each month was
above the target of 90%.
In most months of 2017/18, 100% of patients were sent their outcome
assessment report within 10 working days after their assessment.
Throughout 2017/18, all of our hospitals had arrangements in place to
ensure advocacy available to all qualifying patients (target 100%).
0
50
100
150
200
250
300
call_helpline_calls dementia_helpline_calls dan_helpline_calls
Q1 2016/2017 Q2 2016/2017
Q3 2016/2017 Q4 2016/2017
Q1 2017/2018 Q2 2017/2018
Q3 2017/2018 Q4 2017/2018

28 | P a g e
% of patients (all ages) to have a valid Care and Treatment Plan
completed at the end of each month (target 90%)
source – summary scorecards provided by welsh government
% of patients who have been sent their outcome assessment report
within 10 working days after their assessment (target 100%)
source – summary scorecards provided by welsh government
75%
80%
85%
90%
95%
100%
ctp
target
75.0%
80.0%
85.0%
90.0%
95.0%
100.0%

29 | P a g e
% of our hospitals with arrangements in place to ensure advocacy
available to all qualifying patients (target 100%)
source – summary scorecards provided by welsh government
Our Staff and Resources
Missed Appointments
When people fail to turn up for an outpatient appointment without letting
us know, it wastes an outpatient slot that could have been used for another
person.
We have introduced a text reminder system and this is being rolled out
across our services.
In 2017 and 2018 there has been a downward trend in the percentage of
our patients not turning up for their appointment.
75.0%
80.0%
85.0%
90.0%
95.0%
100.0%

30 | P a g e
New and Follow up appointment DNA rates for selected specialties
source – ISD reportal
Performance appraisals
We are committed to a performance appraisal and development review
(PADR) or medical appraisal for every member of staff every year. Although
the target of 85% is yet to be achieved, compliance is steadily increasing.
% of staff who have had a PADR/medical appraisal in previous 12
months – all divisions and services
source – summary scorecards provided by welsh government
0.0%
2.5%
5.0%
7.5%
10.0%
% of patients who did not arrive for a first OPA
% of patients who did not arrive for a follow-up OPA
0%
10%
20%
30%
40%
50%
60%
70%
80%
90%

31 | P a g e
Staff Sickness
We are committed to offering all the support required to ensure that we
have a fit and health workforce.
This is important because we have a responsibility for the people who work
for us, but it is equally important for the smooth running of the services we
provide to the people we care for.
In 2017/18 the percentage of staff absences attributed to sickness has
often been above our target of 4.99 especially during the winter months
when we often see peaks in staff absence due to sickness.
% staff absence attributed to sickness
source – ISD reportal
4.00%
4.25%
4.50%
4.75%
5.00%
5.25%
5.50%
5.75%
6.00%
6.25%
6.50%
sickness_absence_rate
target