![4 Pile Cap Design [Civilax.com]](https://static.fdocuments.net/doc/165x107/563db860550346aa9a9320bb/4-pile-cap-design-civilaxcom.jpg)
Performance of Pile Cap Foundation with Respect to Cap ...
74
Performance of Pile Cap Foundation with Respect to Cap Rigidity Soukayna El Hammouli A Thesis in The Department of Building, Civil and Environmental Engineering Presented in Fulfillment of the Requirements For the degree of Master of Applied Science (Civil Engineering) at Concordia University Montreal, Quebec, Canada December 2019 © Soukayna El Hammouli, 2019
Transcript of Performance of Pile Cap Foundation with Respect to Cap ...

Performance of Pile Cap Foundation with Respect to Cap Rigidity
Soukayna El Hammouli
A Thesis
in
The Department of
Building, Civil and Environmental Engineering
Presented in Fulfillment of the Requirements
For the degree of Master of Applied Science (Civil Engineering) at
Concordia University
Montreal, Quebec, Canada
December 2019
© Soukayna El Hammouli, 2019

CONCORDIA UNIVERSITY
SCHOOL OF GRADUATE STUDIES
This is to certify that the thesis prepared
By: Soukayna El Hammouli
Entitled: Performance of Pile Cap Foundation with Respect to Cap Rigidity
and submitted in partial fulfillment of the requirements for the degree of
Master of Applied science (CIVIL ENGINEERING)
complies with the regulations of the University and meets the accepted standards with respect to
originality and quality.
Signed by the final Examining Committee:
Dr. Anjan Bhowmick. Chair
Dr. Biao Li Examiner
Dr. Mehdi Hojjati Examiner
Dr. Adel Hanna Supervisor
Dr. Lan Lin Supervisor
Approved by Dr. Ashutosh Bagchi
Chair of Department or Graduate Program Director
December 2, 2019 Dr. Amir Asif
Dean of Faculty

III
ABSTRACT
Performance of Pile Cap Foundation with Respect to Cap Rigidity
Soukayna El Hammouli
The thickness of a pile cap is a major parameter in the design of the pile-cap foundation. A
thin cap performs as a flexible slab by distributing the load on the piles unevenly, which does not
accord with the concept of pile foundations. On the other hand, a thicker and therefore more rigid
cap evenly distributes the load on the piles, as well as resisting bending moments and punching
shear failure, but may impose additional load on the foundation. In view of these differences, there
is a need to determine an optimal cap thickness such that the cap will distribute the load evenly on
the piles without imposing excessive loads.
This thesis, therefore, used ABAQUS commercial software to develop a 3-D finite
numerical model to simulate pile-cap foundations of 9 and 16 piles under variable pile diameter,
pile length, and pile spacing for a range of cap thickness from 0.5m to 3m. The collected data is in
the form of the load on individual piles, the load sharing between the pile and the cap, and the
vertical displacement of the cap.

IV
ACKNOWLEDGMENT
I take this opportunity to thank my two dear supervisors Dr. A. Hanna and Dr. L. Lin for
their constant supports, technical guidance, and encouragement throughout this research. They
were very kind and generous with their time and provided invaluable resources that had a
significant impact on this thesis.
Besides my advisors, I would like to thank my parents for their endless love and support,
for their patience and understanding during this period, and for all the sacrifices they have been
through for my and my sibling’s better future and success.
My thanks and appreciations also go to my colleagues, especially Mahmoud Khalifa, and
the people who have willingly helped me out with their best abilities.

V
TABLE OF CONTENTS
List of Figures……………………………………………………………………………….VII
List of Tables………………………………………………………………………………….X
CHAPTER 1: INTRODUCTION
1.1 Background……………………………………………………………………………………1
1.2 Objective.……………………………………………………………………………………...3
1.3 Thesis organization…………………………………………………………………………....3
CHAPTER 2: LITERATURE REVIEW
2.1 General.……...………………………………………………………………………….…......5
2.2 Past studies.……………………………………………………………………………………5
2.2.1 Flexural rigidity……………………………………………………………...……...5
2.2.2 Thickness of rigid pile caps………………………………………………...……...10
2.3 Code procedure for the design of pile caps…………………………………………...……...12
2.3.1 Canadian design standard A23.3-14…………………….…………………...…….12
2.3.2 American design code ACI318-14…………………………………………..……..14
Chapter 3: NUMERICAL MODELING
3.1 Description of pile foundation model………………..………………………………….…....15
3.2 Modeling techniques.………………………… ………………………………………….…..16
3.2.1 Piles and pile cap…………………………………………….……………...……...17
3.2.2 Soil……………………………………………………………………..…...……...17
3.2.3 Interactions and contact zones……………………………………………………...19
3.2.4 Mesh………………………………………………………………………...……...20
3.3 Model techniques validation…………………………..………...…….……………...….…...22

VI
CHAPTER 4: ANALYSIS RESULTS
4.1 Introduction.……...……………………………….…………………………………….…....27
4.2 Effect of pile-cap thickness.……...…..………....……………………………………….…....27
4.3 Effect of pile spacing.……...……………………………….…….…………………….…....40
4.4 Effect of pile diameter……...………………...…………….…….…………………….…....46
4.5 Effect of pile length………...………………...…………….…….…………………….…....53
CHAPTER 5: CONCLUSIONS AND RECOMMENDATIONS
5.1 Summary and Conclusions.….…………………………………………..…………….…....60
5.2 Recommendations for future research…………….…………………………………….…....61
REFERENCES

VII
LIST OF FIGURES
Figure 2.1 Illustration of small and large pile rafts adapted from Viggiani et al. (2012…….………9
Figure 2.2 Curvature versus depth of the cap for a variable number of floors (Cheng, 2005)….…11
Figure 2.3 Comparison of the depth of a pile cap with different methods (Cheng, 2005)………11
Figure 2.4 Regression analysis results as Rabbany et al. (2015)……………………...………….12
Figure 3.1 Elevation view of the foundations: (a) 16-pile foundation, (b) 9-pile foundation…......15
Figure 3.2 ABAQUS ¼ model: (a) 16-pile foundation, b) 9-pile foundation……………...……...17
Figure 3.3 ABAQUS ¼ model for the soil in the 16-pile foundation…………………..…………18
Figure 3.4 Contact zones defined in ABAQUS…………………………………………………..20
Figure 3.5 ABAQUS meshing for ¼ 16-pile foundation: (a) partitions assigned, (b) final meshed
model……………………………………………………………………………………………21
Figure 3.6 Boundary conditions defined in the model……………………………….…………...22
Figure 3.7 Finite element model as Alnuiam et al. (2013)……………………...…………………23
Figure 3.8 Comparison of the results of pile cap displacement vs axial loading………...……...…24
Figure 3.9 Comparison of the results of load sharing percentage vs pile cap displacement……….25
Figure 4.1 Layout of piles under examination: (a) 16-pile foundation, (b) 9-pile foundation…….28
Figure 4.2 Pile load vs pile cap thickness for the 16-pile foundation: (a) medium sand soil, (b)
dense sand soil…………………………………………….……………...………………………29
Figure 4.3 Pile load vs pile cap thickness for the 9-pile foundation: (a) medium sand soil, (b) dense
sand soil…………………………………………………………………………………………..30
Figure 4.4 Percentage of load sharing vs pile cap thickness: (a) 16-pile foundation, (b) 9-pile
foundation.………………………………………………….……………………………………32
Figure 4.5 Location of typical points to examine the displacement: (a) 16-pile foundation, (b) 9-
pile foundation...…………………………………………………………………………………33
Figure 4.6 Vertical displacement in pile cap in 16-pile foundation in medium sand soil………….35

VIII
Figure 4.7 Vertical displacement in pile cap in 16-pile foundation in dense sand soil.....................36
Figure 4.8 Vertical displacement in pile cap in 9-pile foundation in medium sand soil…………...37
Figure 4.9 Vertical displacement in pile cap in 9-pile foundation in medium sand soil...................38
Figure 4.10 Curvature versus depth of the cap for 9 and 16 pile caps in medium and dense
sand................................................................................................................................................39
Figure 4.11 Center settlement of the pile cap foundation with variable cap thicknesses for different
pile cap foundations………………………………………………………………………............40
Figure 4.12 Pile load vs pile spacing for the 16-pile foundation: (a) medium sand soil, (b) dense
sand soil…………………………………………………….…………………………………..41
Figure 4.13 Pile load vs pile spacing for the 9-pile foundation: (a) medium sand soil, (b) dense
sand soil…………………………………………………………………………………………..42
Figure 4.14 Percentage of load sharing vs pile spacing: (a) 16-pile foundation, (b) 9-pile
foundation………………………………………………………………………….…………….43
Figure 4.15 Vertical displacement in pile cap in 16-pile foundation: (a) medium sand soil, (b)
dense sand soil……………………………………………………………..……………………..45
Figure 4.16 Vertical displacement in pile cap in 9-pile foundation: (a) medium sand soil, (b) dense
sand soil……………………………………….…………………...……………………………..46
Figure 4.17 Pile load vs pile diameter for the 16-pile foundation: (a) medium sand soil, (b) dense
sand so i l . ………………………………….. .….…. . .……………………………..4 7
Figure 4.18 Pile load vs pile diameter for the 9-pile foundation: (a) medium sand soil, (b) dense
sand soil………………………………………………………………………………………...47
Figure 4.19 Percentage of load sharing vs pile diameter: (a) 16-pile foundation, (b) 9-pile
foundation………………………………………………………………………………………..50
Figure 4.20 Vertical displacement in pile cap in 16-pile foundation: (a) medium sand soil, (b)
dense sand soil……………………………………………………………………………………53
Figure 4.21 Vertical displacement in pile cap in 9-pile foundation: (a) medium sand soil, (b) dense
sand soil…………………………………………………………………………………………..53
Figure 4.22 Pile load vs pile length for the 16-pile foundation: (a) medium sand soil, (b) dense
sand soil………………………………………………………………………………………...54
IX
Figure 4.23 Pile load vs pile length for the 9-pile foundation: (a) medium sand soil, (b) dense sand
soil…………………………………................…………………………………………………..54
Figure 4.24 Percentage of load sharing vs pile length: (a) 16-pile foundation, (b) 9-pile
foundation………………………………………………………………………………………..57
Figure 4.25 Vertical displacement in pile cap in 16-pile foundation: (a) medium sand soil, (b)
dense sand soil………………………………………………………............................................58
Figure 4.26 Vertical displacement in pile cap in 9-pile foundation: (a) medium sand soil, (b) dense
sand soil…………………………………………………………………………………………59

X
LIST OF TABLES
Table 3.1 Pile cap parameters considered in the modeling and analysis…………………….……16
Table 3.2 Material properties…………………………………………………………………….19
Table 3.3 Basic information on models as Alnuiam et al. (2013)…………………………………23
Table 3.4 Information on modeling as Alnuiam et al. (2013)…………………….……………….24
Table 4.1 Pile load for different pile cap thickness, 16-pile foundation.........................................29
Table 4.2 Pile load for different pile cap thickness, 9-pile foundation…………………………...31
Table 4.3 Pile load for different pile spacing, 16-pile foundation..................................................41
Table 4.4 Pile load for different pile spacing, 9-pile foundation…………………………………42
Table 4.5 Pile load for different pile diameter, 16-pile foundation…………………...……….…49
Table 4.6 Pile load for different pile diameter, 9-pile foundation……………………...………...49
Table 4.7 Pile load for different pile length, 16-pile foundation………………………...…….…56
Table 4.8 Pile load for different pile length, 9-pile foundation.……………………………….…56

1
CHAPTER 1
INTRODUCTION
1.1 Background
Deep foundations are often used when the soil underneath the foundation has the
insufficient bearing capacity to support loads imposed. The typical types of deep foundations are
pile, pier, caissons, and well-foundation. Among them, the pile foundation is the most used type
of deep foundation. The two components of a pile foundation are pile cap and piles, while the pile
cap directly connects the superstructure with the substructure. Accordingly, the behavior of the
pile cap significantly affects the design of the entire foundation. For example, the loads in piles
affect both the design of pile cap and piles while the rigidity of the pile cap on the other affects the
load distributed to the piles. Therefore, piles and pile cap are intertwined, i.e., the design of one
component will affect the other.
A pile cap can be either rigid or flexible. Theoretically, if the pile cap is rigid, all the piles
are equally loaded. However, if the pile cap is flexible, then the piles close to the loading point are
heavily loaded compared to others. In some cases, the load in these piles could be 3-4 times of the
others. However, in practice, all the piles are designed using the largest demands among the pile
group.
Researchers have developed some formulae to determine the rigidity of the pile cap, such
as Hain et al. (1978), by considering the effects of the cap flexibility, size and pile group
parameters. Randolph (1983), by introducing flexibility matrix method and the average settlement
of the cap. Clancy and Randolph (1993), by presenting cap-pile interaction factor and cap and piles
2
stiffness, Viggiani et al. (2012), by including young’s modulus and Poisson’s ratio for both cap
and soil, etc. Some enclose only the parameters related to the pile cap in the formulation, such as
pile cap thickness and modulus of the elasticity of the material for the pile cap. Others also
introduce parameters associated with piles in the formula, e.g., pile stiffness. Very recently,
Rabbany et al. (2018) proposed an equation to estimate pile cap depth based on the external
loading. However, it was based on a regression analysis solely on very limited data provided 30
years ago in Reynolds et al. (1988).
In light of lagging research on the investigation of pile cap rigidity, design codes and
standards provide requirements for the determination of pile cap thickness. For example, Canadian
Concrete Design Standard CSA A23.3-14 specifies two methods for the design of pile caps, which
are sectional method and strut-and-tie method (STM). The sectional method is used for the design
of "shallow pile caps" since its behavior is very similar to spread footings as shallow foundations.
However, if the depth of a pile cap is greater enough, the cap would behave like a deep beam. In
this case, STM is also allowed. American Building Code Requirements for Structural Concrete
ACI 318-14 defines the requirements for pile cap design in the Section for Deep Foundation. It
also allows using STM to design pile caps. In CSA A23.2-14 and ACI 318-14, the depth of pile
caps should be determined to satisfy the requirements for both one-way shear and two-way shear.
In the engineering community, STM is commonly used for the design of pile caps since it
is well accepted that the beam design method is not valid for elements with discontinuity (i.e.,
loading and geometric discontinuities), in which the loading in a pile cap supported by multiple
piles is discontinued. Numerous studies have been conducted on improving STM, such as Adebar
et al. (1990), Adebar and Zhou (1996), Part et al. (2008), Aouza et al. (2009), etc. to debate which
either sectional method or strut-and-tie method is more appropriate for the design of pile caps.

3
1.2 Objective
The results from previous studies have indicated that the pile cap thickness plays a crucial
role in the performance of pile foundation, it has a direct impact on the pile cap flexural rigidity,
which will, in turn, affect the loads transferred from the superstructure to the substructure. Both
CSA A23.3-14 and ACI 318-14 requires that the pile thickness should satisfy the requirements for
one-way and two-way shear. However, the design factored shear is determined based on an
assumption that the external load is equally taken by all the piles. This assumption may not be
valid unless the pile cap is rigid enough to be able to distribute the load evenly. Given this, the
objective of this study is to examine the effects of pile cap thickness on the performance of pile
foundation in terms of load distribution on piles and deformation of pile cap itself and to conclude
if a given pile cap thickness would make the loads distribute more uniformly. Given this, the
following tasks were carried out in this study:
(1) Develop finite element models for pile cap foundations using ABAQUS. One foundation
has 16 piles and the other has 9 piles.
(2) Investigate pile cap thickness on the response of the two foundations and recommend the
thickness in which the pile cap is relatively rigid, and the piles carry approximately the
same amount of the load.
(3) Examine the effects of pile spacing, pile diameter, and pile length.
1.3 Thesis organization
This thesis is divided into 5 Chapters,
➢ Chapter 1 presents the introduction and objectives of the study.
➢ Chapter 2 presents the literature review on past studies related to the current
research.

4
➢ Chapter 3 describes the numerical modeling of the pile cap foundation using
ABAQUS and the validation of the modeling techniques with the analysis results
available in the literature.
➢ Chapter 4 presents and discusses the analysis results of the parametric study of the
pile cap foundation.
➢ Chapter 5 summarizes the major findings and conclusions from the present study,
and recommendations for future studies.

5
CHAPTER 2
LITERATURE REVIEW
2.1 General
Pile cap or pile raft1 is a critical element in the load transfer mechanism of the pile
foundation since it does not only transfer the loads from the superstructure to the substructure but
also it also affects the design of the piles. This chapter provides an overview of the past studies
related to the current research work with a focus on the estimate of the rigidity of pile caps and the
role of pile cap thickness on the behavior of the pile foundations. Furthermore, the requirements
and design procedures stipulated in the code and standard in North-America, e.g., American Code:
Building code requirements for structural concrete ACI 318-14 (ACI, 2014) and Canadian
standard: Design of concrete structures CSA A23.3-14 (CSA, 2014) are described at the end of
this Chapter.
2.2 Past studies
2.2.1 Flexural rigidity of pile caps
Hain et al. (1978) analyzed the effectiveness of the pile group in reducing the settlement of
the raft by considering the effects of the cap flexibility, size and pile group parameters. They
introduced the cap-supporting soil relative stiffness 𝐾𝑅 (Equation 2.1) and the pile-supporting soil
stiffness 𝐾𝑝 (Equation 2.2) from in their study.
1 The two terms pile cap and pile raft are exchangeable in this thesis.

6
𝐾𝑅 =4𝐸𝑅𝑡𝑅𝐵𝑅(1 − 𝑣𝑠
2)
3𝜋𝐸𝑠𝐿𝑅4 (2.1)
𝐾𝑝 =𝐸𝑝
𝐸𝑠 (2.2)
Where,
ER = Young’s modulus of the material for the raft
Ep = Young’s modulus of the material for piles
Es = Young’s modulus of the soil
LR, BR, tR = Length, breadth, and thickness of the raft
νs = Poisson’s ratio of the soil
They reported that 𝐾𝑅 varying from 10 to 0.01 represents very stiff to very flexible rafts
while 𝐾𝑝 ranging from 105 to 102 indicates very stiff to very compressible piles. Furthermore, they
concluded that the settlement becomes more effective with the increase of pile stiffness and pile
length. In addition, the results from the study suggested that increasing the raft flexibility would
increase the differential settlement of piles, reduce the bending moments in the raft.
Randolph (1983) proposed a simple method, namely, the flexibility matrix method, to study
the behavior of rafts by considering the interaction between piles and pile raft. The stiffness of
rectangular piles rafts can be estimated by Equation 2.3,
𝐾𝑟𝑠 =𝑃𝑝 + 𝑃𝑟
𝑤𝑝𝑟=
𝑘𝑝 + 𝑘𝑟(1 − 2𝛼𝑟𝑝)
1 − (𝑘𝑟
𝑘𝑝) 𝛼𝑟𝑝
2 (2.3)
Where,
Pp = Load carried by piles
Pr = Load carried by raft
wpr = Average settlement of raft
kp = Stiffness of piles

7
kr = Stiffness of raft
αrp = Interaction factor between piles and raft
Ten years after Randolph (1994) made a modification to Equation 2.3 and proposed
Equation 2.4 based on the finding reported in Clancy and Randolph (1993) that the interaction
factor 𝛼𝑟𝑝 tends to be equal to 0.8 for larger pile foundations.
𝐾𝑝𝑟 =
1 − 0.6 (𝑘𝑟
𝑘𝑝)
1 − 0.64 (𝑘𝑟
𝑘𝑝)
𝑘𝑝 (2.4)
Zaman et al. (1993) studied the effect of pile cap thickness and pile inclination on the
distribution of displacements using 3D nonlinear finite element analysis. In the modeling, the
soil medium was idealized as a generalized plasticity model in where both yielding and failure
surfaces were defined by a single mathematical function, and the pile cap and the piles were
assumed to be linearly elastic. The flexural rigidity of the pile cap (𝑅𝑃) is expressed as Equation
2.5. They concluded that the pile cap thickness and the pile inclination had a very minor effect
on the flexural moment distribution in piles except at the pile head region where the shear force
governs the design.
𝑅𝑃 =𝐸𝑃𝑡3
12(1 − 𝑣𝑝2)
(2.5)
Where,
Ep = Young’s modulus of material for piles
νp = Poisson’s ratio of the material for piles
t = thickness of pile cap

8
Duan and McBride (1995) investigated the effects of cap stiffness in order to improve the
foundation design practice stipulated in the highway bridge foundation design practice of the
California department of transportation (Caltrans) (1991). They suggested that a pile cap may be
assumed to be rigid if the length to thickness ratio of the overhang is less than or equal to 2.2.
where the cantilever is the edges of the overhang of the pile cap. Moreover, they reported that the
pile reactions are nonlinearly distributed because of the different elastic spring constants for
compression and tension piles and the flexural stiffness of the pile cap.
Ghali (1999) studied the effect of pile cap flexural rigidity and the piles’ axial stiffness on
the load transfer from column to piles. Ghali concluded that the flexural rigidity of the pile cap
significantly affects the deformed shapes of the footing, behavior of the pile cap and the load
distribution in piles as well. Most importantly, Ghali made the following recommendation: a pile
cap can be considered rigid if the ratio of the distance between the centerline of a column and the
centerline of the furthermost corner pile to the thickness of the pile cap is less than 2.4. Otherwise,
a detailed finite element analysis is required for the design of the pile cap since a flexible behavior
is expected.
Jeong et al. (2007) examined the behavior of interaction among pile cap, piles, and soil.
Jeong et al. also conducted a parametric study of the effect of the elastic modulus, the thickness of
the pile cap, the length and diameter of piles on the foundation performance as they were the main
parameters to affect the cap flexibility. In addition, Jeong et al. concluded that the effect of the cap
flexibility is more profound in a pile foundation with large pile diameter and large subgrade soil
reaction. It also has significant effects on the forces in piles including the pile head forces, bending
moments, and shear forces.
Abbas et al. (2008) evaluated the effect of pile cap system on the behavior of pile group
subjected to the axial load, and the effect of pile cap thickness on the shearing forces in piles. They

9
developed a 2D finite element model for the study where the pile cap was molded as a plate element
and the piles were modeled as a spring with a stiffness defined using hyperbolic stress-strain
relationship. They reported that smaller pile cap thickness made pile cap more flexible. In addition,
they concluded that the shearing forces in piles are affected by the following factors, the location
of piles within the group, the pile cap thickness, the state of loading, and the restraint of the pile
head.
Viggiani et al. (2012) studied the settlement and load sharing of piled rafts. In their study,
two rafts were considered as illustrated in Fig. 2.1. A raft is considered to be a small raft if the
ratio of the raft width B to the pile length L is less than 1, otherwise, it is considered as a large raft.
The stiffness of small rafts Krs given by Viggiani et al. is presented in Equation 2.6. Viggiani et al.
reported that large rafts are not desirable since the rafts would be too flexible, thus, additional piles
are required to avoid excessive settlement. Furthermore, in large rafts, changing the stiffness of
rafts would not affect the average and the differential settlement.
Figure 2.1 Illustration of small and large pile rafts adapted from Viggiani et al. (2012).
𝐾𝑟𝑠 =4𝐸𝑟(1 − 𝑣𝑠
2)
3𝐸𝑠(1 − 𝑣𝑟2)
(𝑡𝑟
𝐵𝑟)
3
(2.6)
Small raft Large raft

10
Where,
Er, Es = Young’s modulus of material for raft and soil respectively
νr, Vs = Poisson’s ratio of the material for raft and soil respectively
tr, Br = thickness, and width of raft respectively
2.2.2 Thickness of rigid pile caps
Reynolds et al. (1988) proposed to estimate the thickness of pile cap (h) using Equation 2.7
based on the pile diameter (hp) to satisfy the requirements for anchorage and punching shear.
Furthermore, they recommended that the cap thickness should be selected in such a way that
bending moments in the column are not considered. However, when two or more piles are placed
under one column it is necessary to reinforce the pile-cap for the moments and other forces
imposed. Thirty years after, Rabbany et al. (2018) commended that the Reynolds guideline is "very
safe but not economical and it’s an empirical guideline".
ℎ = 2ℎ𝑝 + 100 𝐼𝑓 ℎ𝑝 ≯ 550𝑚𝑚
ℎ =1
3(8ℎ𝑝 − 600) 𝐼𝑓 ℎ𝑝 ≥ 550𝑚𝑚 (2.7)
Cheng (2005) investigated the depth of reinforced concrete rigid-pile caps for tall buildings
using three-dimensional finite element analysis. He recommended using cap curvature to validate
the rigidity of the cap, i.e., a pile cap is considered rigid if a further increase in its depth will not
lead to a significant reduction of the cap curvature. A design chart (Fig. 2.2) was provided in Cheng
(2005) in which the cap curvature is represented by its out-of-plane deflection divided by the pile
spacing. Furthermore, a tangent can be drawn on each graph to obtain the depth for a rigid pile
cap.

11
Figure 2.2 Curvature versus depth of the cap for variable number of floors (Cheng, 2005).
In addition, Cheng compared the depths required for rigid pile caps from his study with
those obtained to satisfy the design requirements for flexural shear failure (one-way shear),
punching shear failure (two-way shear) and flexural bending failure. The results are presented in
Fig. 2.3. As shown in the figure that the depth proposed in Cheng (2005), which is about 1m, works
for buildings less than 45 floors. For buildings higher than 45 floors, the pile depth is governed by
punching shear.
Figure 2.3 Comparison of the design depth of a pile ap with different methods (Cheng, 2005).

12
Rabbany et al. (2018) conducted a regression analysis on the pile cap depth from the Strut-
and-Tie method and the depth formula proposed by Reynolds et al. (1999), which were referred to
as Reynolds chart in Fig. 2.4. The R-square was used as a statistical measure to fit the regression
line as shown in Fig. 2.4. The minimum depth of the pile cap can be determined using this formula,
Figure 2.4 Regression analysis results in Rabbany et al. (2015).
y =77.6x0.5 for a given external load, where x represents the load in ton and y represents the pile
depth in mm. This was the first study to connect the pile cap thickness with the external loading.
2.3 Code procedures for the design of pile caps
2.3.1 Canadian design standard A23.3-14
CSA A23.3-14 provides following Clauses for design of pile caps including Clause 15.3
(Footings and pile caps supporting circular and regular polygonal columns or pedestals), Clause
15.5 (Shear design of footings and pile caps), Clause 15.6 (Development of reinforcement in
footings and pile caps), Clause 15.8.3 (Minimum depth of pile caps), and Clause 15.9 (Transfer of
force at base of column, pile cap, wall, or pedestal).

13
There are methods stipulated in CSA A23.2-14, Part II (design examples and design aids)
for the design of pile caps, i.e., the sectional method for shallow pile caps, the Strut-and-Tie (STM)
method for deep pile caps. Shallow pile caps are defined where “the distance from the point of
zero shear to the face of the column, pedestal, or wall is less than two times the effective shear
depth, dv, of the footing” (CSA, 2014). Both methods use the same way to determine the pile cap
depth. They use the larger depth from steps 1 to 3 for the design of shallow pile caps and larger
depth from steps 1 and 2 for the design of deep pile caps as follows:
• Step 1: Determine minimum effective shear depth dv based on the requirements for a
one-shear check using Clause 11.3.4 and 11.3.6 in CSA A23.3-14 at the critical
section defined by Clauses 11.3.2, 15.2.3 and 15.5.3 depending on the pile
arrangements.
• Step 2: Determine minimum depth d based on the requirements for a two-shear check
using Clause 13.3.4 in CSA A23.3-14 at the critical section defined by Clauses
13.3.3, 15.2.3 and 15.5.3.
• Step 3: For shallow pile caps, corner pile shear checks must be conducted as per
Clause 3.3.6.3.
In the calculation following the above-mentioned procedure, the design shear is determined
by assuming the reaction in each pile due to external loading is the same. Specifically, pile reaction
is obtained by using the total load in the column divided by the number of piles in the foundation.
The difference between the sectional method and STM is related to the reinforcement design. For
the sectional method, the reinforcement is determined based on Clauses 10 (Flexural and axial
loads), 15 (Foundations), and 12 (Development and splices of reinforcement). For the STM, the
minimum tie reinforcement, minimum pile cap reinforcement, and minimum reinforcement for

14
interfaces should be determined as per Clause 15.9.2. The requirements for anchorage as per
Clause 11.4 must also be respected. When using these methods, the following attention must be
given:
1. STM was developed for pile caps with simple geometries and for concentric loadings.
For pile caps with complex geometries and for other loads including bending moments
and shear, the sectional method should be applied, and its step-by-step procedure is
described in CSA A23.3-14.
2. The reinforcement provided by the sectional method would be significantly less than
STM, the pile cap could be under reinforced by 20%.
2.3.2 American design code ACI 318-14
The requirements for design of pile caps given in American Code ACI 318-14 include
Clause 13.2.7 (Critical sections for shallow foundations and pile caps), Clause 13.2.8
(Development of reinforcement in footings and pile caps), and Clause 13.4.2 (Pile caps) that covers
the minimum depth of pile caps and shear design of pile caps (such as one-way shear check, two-
way shear check, and determination of factored shear for any section through a pile cap). In
general, these requirements are not very different from those in CSA A23.4-14. It is not surprising
given the design practice in the two countries are very similar.
Like CSA A23.3-14, ACI 318-14 also allows using STM for the design of pile caps.
However, the requirements are much detailed to specify Design strength (Clause 23.3), Strength
of struts (Clause 23.4), Strut reinforcement detailing (Clause 23.6), Strength of ties (Clause 23.7),
Tie reinforcement detailing (Clause 23.8) and Clause 23.9 (Strength of nodal zones).
15
CHAPTER 3
NUMERICAL MODELING
3.1 Description of the Numerical Model
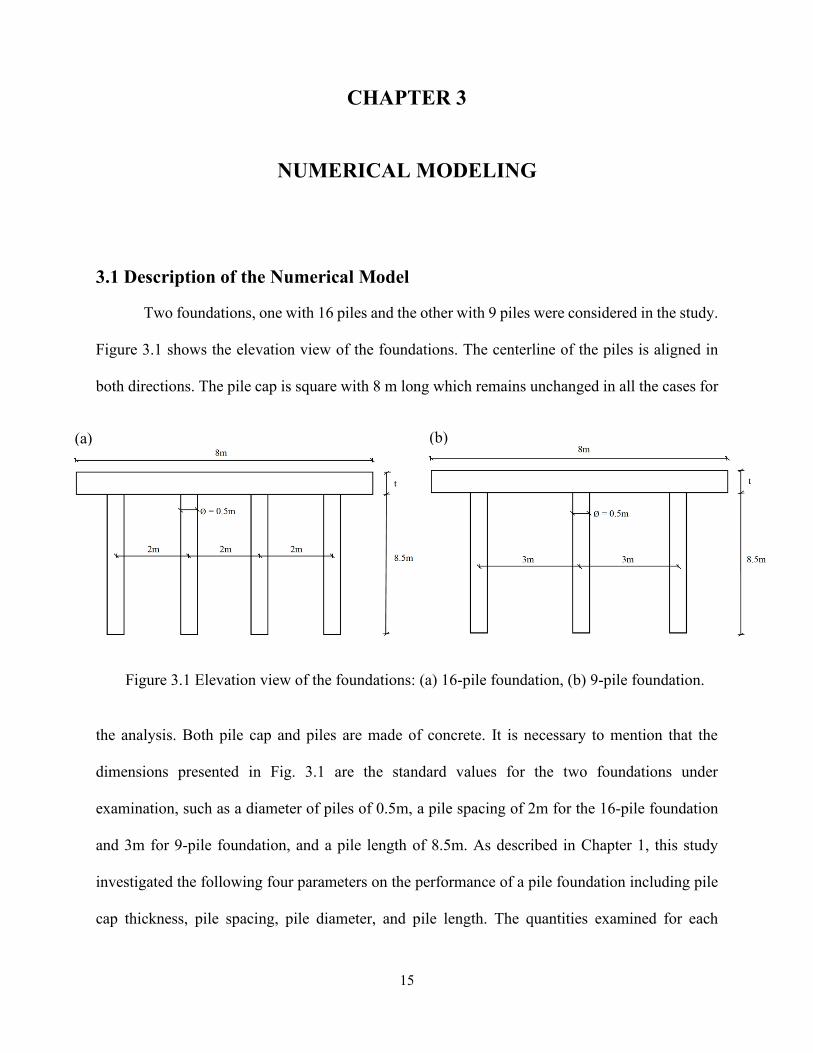
Two foundations, one with 16 piles and the other with 9 piles were considered in the study.
Figure 3.1 shows the elevation view of the foundations. The centerline of the piles is aligned in
both directions. The pile cap is square with 8 m long which remains unchanged in all the cases for
Figure 3.1 Elevation view of the foundations: (a) 16-pile foundation, (b) 9-pile foundation.
the analysis. Both pile cap and piles are made of concrete. It is necessary to mention that the
dimensions presented in Fig. 3.1 are the standard values for the two foundations under
examination, such as a diameter of piles of 0.5m, a pile spacing of 2m for the 16-pile foundation
and 3m for 9-pile foundation, and a pile length of 8.5m. As described in Chapter 1, this study
investigated the following four parameters on the performance of a pile foundation including pile
cap thickness, pile spacing, pile diameter, and pile length. The quantities examined for each
(a) (b)

16
parameter are listed in Table 3.1. With respect to the soil mediums, both medium sand and dense
sand are assigned to each of the foundations.
Table 3.1 Pile cap parameters considered in the modeling and analysis.
3.2 Modeling Techniques
In this study, the three-dimensional finite element software ABAQUS was used to model
the two pile foundations presented in Fig. 3.1. This software has been used many researchers to
perform studies on geotechnical engineering (Alkinani et al., 2014; Riyadh et al., 2017; Wang et
al., 2018; etc.). The detailed discussion on the techniques for modeling piles, pile cap, soil,
boundary conditions, etc. is given in the sections below.
Parameter examined Dimensions
Pile cap thickness Pile cap thickness: 0.5m, 1.0m, 1.75m, 2.0m, and 3.0m
Pile diameter: 0.5m
Pile spacing: 2.0m (16-pile foundation), 3.0m (9-pile foundation)
Pile length: 8.5m
Pile spacing Pile spacing:
1.25m, 1.5m, 1.75m, 2m, and 2.25 (16-pile foundation)
1.25m, 1.75m, 2m, 3m, and 3.25m (9-pile foundation)
Pile cap thickness: 1.75m
Pile diameter: 0.5m
Pile length: 8.5m
Pile diameter Pile diameter: 0.4m, 0.5m, 0.7m, and 1m
Pile cap thickness: 1.75m
Pile spacing: 2.0m (16-pile foundation), 3.0m (9-pile foundation)
Pile length: 8.5m
Pile length Pile length: 5m, 8.5m, 10m, and 14m
Pile cap thickness: 1.75m
Pile diameter: 0.5m
Pile spacing: 2.0m (16-pile foundation), 3.0m(9-pile foundation)

17
3.2.1 Piles and pile cap
The two elements were model using ABAQUS 3D deformable homogeneous solid element
C3D8 (i.e., Continuum, 3-D, 8-node). The C3D8 element has been used in several studies on the
investigation of pile-pile cap foundations, such as Moayed et al. (2013), Fattah et al. (2013), Ata
et al. (2014), etc. In the modeling, full integration instead of reduced integration was assigned to
the element. This is due to the fact that the preliminary results indicate that reduced integration
provided not correct displacements in the pile cap. As an example, Figure 3.2 shows a quarter of
the finite element model for the 16-pile foundation.
Figure 3.2 ABAQUS ¼ model: (a)16-pile foundation, (b) 9-pile foundation.
3.2.2 Soil
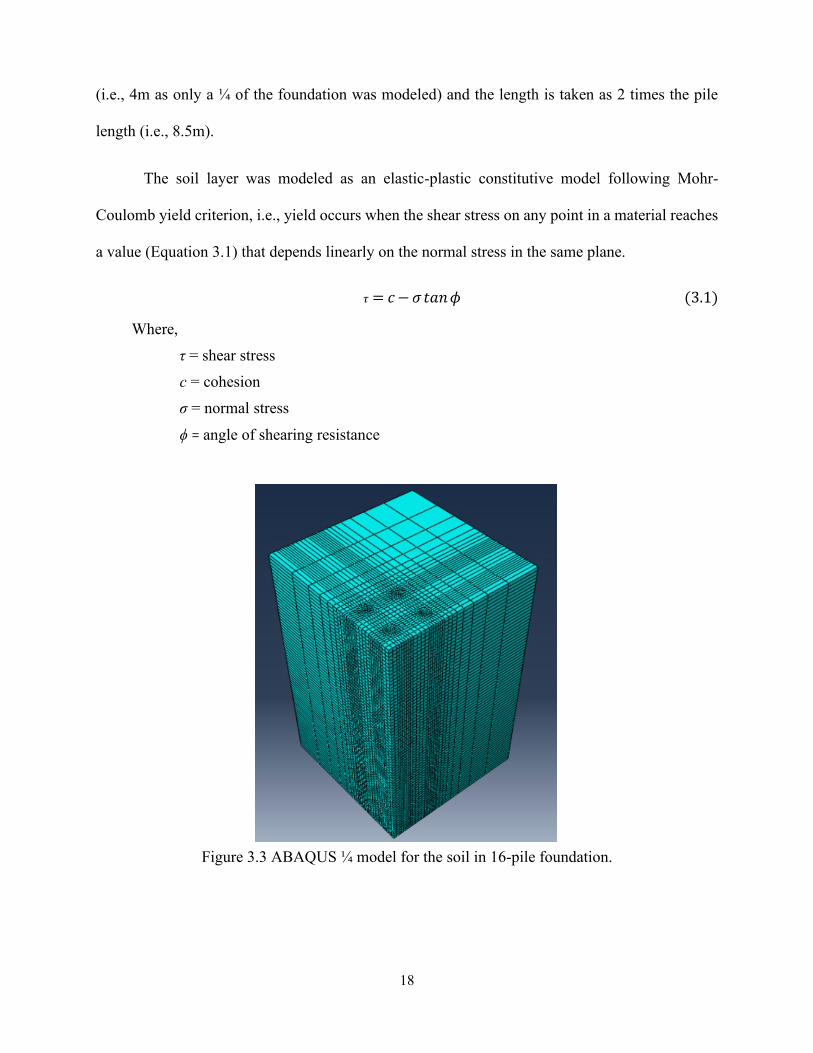
Figure 3.3 shows a quarter of the ABAQUS model for the soil in the 16-pile foundation.
The soil continuum in Fig. 3.3 is represented by a single layer of sand with a width of 10 m and a
length of 17 m. Specifically, the width of the soil is taken as 2.5 times the width of the pile cap
(a) (b)
18
(i.e., 4m as only a ¼ of the foundation was modeled) and the length is taken as 2 times the pile
length (i.e., 8.5m).
The soil layer was modeled as an elastic-plastic constitutive model following Mohr-
Coulomb yield criterion, i.e., yield occurs when the shear stress on any point in a material reaches
a value (Equation 3.1) that depends linearly on the normal stress in the same plane.
𝜏 = 𝑐 − 𝜎 𝑡𝑎𝑛 𝜙 (3.1)
Where,
τ = shear stress
c = cohesion
σ = normal stress
ϕ = angle of shearing resistance
Figure 3.3 ABAQUS ¼ model for the soil in 16-pile foundation.

19
Other input parameters assigned in ABAQUS to define the soil material including Young's
modulus of elasticity (E), which was taken from Geotechdata (Geotechdata.info, 2013) for medium
and dense sand and it was constant along the depth of the soil, Poisson’s ratio (v), friction angle
(ϕ) and dilatancy angle (ψ) (Table 3.2).
Table 3.2 Material properties.
Parameter Symbol Soil Concrete
Dense-sand Medium-sand
Material density Ρ (t/m3) 1.63 1.49 2.41
Young's modulus E (MPa) 65 49 23600
Friction angle ϕ (°) 40 30
Poison's ratio v 0.35 0.29 0.21
Angle of dilatancy ψ (°) 10 0
Friction coefficient 0.55 0.45
3.2.3 Interactions and contact zones
In this study, three contact zones were defined in ABAQUS to simulate the interaction
between pile cap and soil (Zone 1), pile circumference and soil (Zone 2), pile tip and soil (Zone 3)
as illustrated in Fig. 3.4.
Using slave and master concept, all the three zones were simulated with surface-to-surface
interaction, in which the nodes of soil elements were defined as Slave (red color in Fig. 3.4) while
the nodes of pile cap and piles were defined as Master (pink color in Fig. 3.3). Furthermore, the
contact zone was assigned by either friction contact (Type I) or frictionless contact (Type II)
depending on the expected behavior of the zone. In particular, Type I contact was assigned to
Zone 1 and Zone 2 as hard normal behavior and tangential behavior (Friction) with a Penalty
method instead of Lagrange method because of its simplicity, good convergence and less

20
computation time. Type II contact was assigned to Zone 3 using tangential behavior (Frictionless)
and hard normal behavior.
Figure 3.4 Contact zones defined in ABAQUS.
3.2.4 Mesh
In ABAQUS, the model is partitioned as an assembly first before meshing is performed.
Figure 3.5a illustrates partitions assigned in ABAQUS for the 16-pile foundation. As shown in
Fig. 3.5a, the partitions are placed closer to the foundation than the rest of the soil in order to create
finer elements around that area. In addition, the partitions were distanced equally around the pile
to have uniform meshing for all the piles.
There are two options for meshing that are available in ABAQUS, i.e., structured meshing
and sweep meshing. Specifically, the structured meshing is applied for high quality hexahedral or
near to perfect shell elements required on solids or surfaces. Kumar (2018) reported that "this
technique offers a better mesh control to the user compared to sweep meshing technique. It works
by partitioning the complex solids into smaller six or eight-sided parametric solids that can be
Zone 1 Zone 2 Zone 3

21
brick meshed. The nodes at the boundaries are then automatically attached to ensure connectivity".
The sweep meshing is used when hexahedral elements are required on solids with minimal
geometry editing. Kumar (2018) stated that "the technique automatically identifies a source side
and a target side on the geometry, it creates a quadrilateral shell mesh on the source side and
sweeps those elements to the target side thereby converting them to hexahedral or bricks". The
green region is shown in Fig. 3.5a was meshed using the structured meshing and the yellow regions
using the sweep meshing. Figure 3.5b shows the model for the 16-pile foundation after meshing.
Figure 3.5 ABAQUS meshing for ¼ of the 16-pile foundation: (a) partitions assigned,
(b) final meshed model.
Figure 3.6 shows the boundary conditions defined in the model. In the coordinate system,
the positive direction for the vertical axis Z is downward, the positive direction for horizontal axes
X and Y follows the well-known right-hand thumb rule. The restraints for the face nodes, corner
nodes and bottom nodes assigned to translation (U) and rotation (UR) about given axes are
provided in the figure.
(a) (b)

22
Figure 3.6 Boundary conditions defined in the model.
3.3 Model techniques validation
In order to validate the two models developed in this study, the above-described modeling
techniques were applied to a pile foundation system considered in Alnuiam et al. (2013) and the
results were compared with Alnuiam's. In addition, the data collected from the geotechnical
centrifuge testing available in Horikoshi et al. (2003) were also used to verify model techniques
explained in Section 3.2.
Alnuiam et al. (2013) used the software Plaxis to create a 3D finite element model to study
the performance of pile caps in Toyoura sand. Figure 3.7 shows a quarter model of the pile

23
foundation system examined in which B is the width of the pile cap and Lp is the length of piles.
They calibrated the finite element model (i.e., "Prototype" in Table 3.3) by centrifuge testing on
an aluminum model (i.e., "Model" in Table 3.3) with parameters and dimensions listed in Table
3.3.
Figure 3.7 Finite element model as Alnuiam et al. (2013).
Table 3.3 Basic information on models as in Alnuiam et al. (2013).
Parameter Model Prototype (n=50)
Diameter (mm) 10 500
Wall thickness (mm) 1 solid
Material Aluminum Concrete
Thickness 170 mm 8.5 m
Pile length 71 GPa 41.7 GPa
Modulus of elasticity 40 mm 2.0 m
Raft width (square) 80 mm 4 m
Pile Spacing 40 mm 2 m
Number of piles 4 4
In their study, Cone penetration tests were performed in order to get the strength of the
sand with the depth of the soil. Based on the test results the behavior of Toyoura sand was modeled

24
as an elastic-perfectly-plastic Mohr-coulomb constitutive model. Table 3.4 provides the material
properties for both soil and concrete in the finite element modeling. It should be noted that Young’s
modulus is increasing with increasing depth.
Table 3.4 Information on modeling as Alnuiam et al. (2013).
Parameter Soil Concrete
Constitutive modeling Mohr-Coulomb Linear elastic
Unit weight (kN/m3) 14.6 23.6
Angle of internal friction 45 -
Modulus of elasticity 4500 kN/m2 23.6 GN/m2
Poisson's ratio 0.175 0.21
Stiffness increases with depth Yes No
Incremental modulus of elasticity
(kN/m2/m)
6500
-
Interface reduction factor 0.43 -
For the purpose of validation, a 3D ABAQUS model was developed for the pile foundation
examined by Alnuiam et al. (2013) shown in Fig. 3.7 using the same geometric dimensions of the
foundation (Table 3.3) and soil material properties (Table 3.5) following the modeling techniques
described in Section 3.2. For ease of discussion, this model is referred to as FEM hereafter. Figure
3.8 presents the results of the displacement in the pile cap vs the axial load from FEM
Figure 3.8 Comparison of the results of pile cap displacement vs axial loading.

25
superimposed with the results given in Horikoshi et al. (2003) (Labelled as HOR in Fig. 3.8) and
Alnuiam et al. (2013) (labeled as ALN in Fig. 3.8). It can be seen in the figure that FEM results
are very close to HOR and ALN. For example, at the load of 5000 kN, the displacement given by
FEM is about 0.032 m while the displacement provided by both HOR and ALN is about 0.029 and
0.031m respectively; at the load of 15000 kN, the displacement given by FEM is about 0.11 m
while the displacement provided by HOR and ALN is the same, which is about 0.105 m.
Furthermore, the loads carried by piles from FEM were compared with those provided in
Alnuiam et al. (2013) for the case with the pile cap thickness of 2 m, and the ratio of pile spacing
to pile diameter of 4 and the results are shown in Fig. 3.9. In the figure, the vertical axis represents
the percentage of the loads carried by the group of piles, and the horizontal axis represents the
displacement of the pile cap normalized to its total displacement. It can be seen in the figure that
Figure 3.9 Comparison of the results of load sharing percentage vs pile cap displacement.
the two curves follow the same profile, i.e., At initial displacement, the load is carried by piles and
this is due to the lack of intimate contact between the pile cap and the soil. However, as the
displacement increases, the load carried by piles drops rapidly, e.g., 60% for ALN and 62% for

26
FEM at the displacement of 7%. While, at 80% of the displacement, ALN shows 45% of the load
is taken by piles, FEM shows 47% of the load is carried by piles.
The results in Figs. 3.8 and 3.9 have shown that the modeling techniques developed in this
study to build up ABAQUS models are able to provide results in good agreement with those from
finite element analysis given in Alnuiam et al. (2013) and experimental data reported in Horikoshi
(2003). Therefore, it can be concluded that the modeling techniques described in Section 3.2 are
acceptable to proceed with detailed analyses to examine the two pile foundations considered in
this study.

27
CHAPTER 4
ANALYSIS RESULTS
4.1 General
As described in Chapter 1, the objective of this study is to check the effects of pile cap
thickness, pile diameter, pile length, and pile spacing on the behavior of the pile-cap foundation.
For this purpose, two foundations, one with 16 piles and the other with 9 piles, were examined;
two soil mediums were tested, one is medium sand and the other is dense sand. A working load
of 200000 kN was applied in the vertical direction (downward) at the center of the pile cap because
it will cause higher deflections and deformations in both cap and piles compared to uniformly
distributed vertical loading. The structural response parameters considered in the analysis are
divided into two groups, i.e., one for piles and the other for pile cap, to consider
• Pile load carried by each individual pile, and load sharing between piles and pile cap
• Pile cap displacement in the vertical direction at selected points measured at the bottom
face of the cap
4.2 Effect of pile-cap thickness
Pile load resistance
Due to the symmetry of the foundation, a quarter of the pile-cap foundation (i.e., shaded
area in Fig. 4.1) was examined in this study, in particular, four piles (i.e., Pile 1 to Pile 4 labeled
in Fig. 4.1) were selected to investigate the amount of the Load developed in each individual pile
under the external loading. The ultimate Load of each pile in the 16-pile foundation and 9-pile
foundation for different pile cap thickness varied from 0.5m to 3m is presented in Figs. 4.2 and

28
4.3, respectively in which Figures 4.2a and 4.3a show the results for the medium sand while
Figures 4.2b and 4.3b for dense sand. It should be noted that the Load given by each pile is
equivalent to the load carried each pile under the external loading.
Figure 4.1 Layout of piles under examination: (a) 16-pile foundation, (b) 9-pile foundation.
For the 16-pile foundation, the results for the thickness of 0.5m (Fig. 4.2) clearly show that
Pile 2 carries the largest amount of the load followed by Piles 1 and 4 while Pile 3 carries the least.
This observation is not surprising from a structural point of view as the piles close to the loading
point (center piles, e.g., Pile 2) would carry more load while the piles far from the loading (corner
piles, e.g., Pile 3) would carry less load. More specifically, for cap thickness of 0.5m, the load
resisted by Pile 2 (maximum Load) is 3.7 times that by Pile 3 (minimum Load) for the medium
sand and 4.4 times for dense sand (Tables 4.). Furthermore, as illustrated in Fig. 4.2 when the
thickness is increased to 1m, this ratio reduces dramatically reaching around 1.6 as listed in Table
4.1 for both soil mediums considered. When the thickness is between 1.5m and 2m this ratio
becomes much smaller, i.e., about 1.3 for medium sand soil and 1.2 to1.1for dense sand soil. As
presented in Fig.4.2 all 4 piles carry the same load at the thickness of 3m in dense sand soil while
Pile 2 still carries about 20% more load than the other three piles in the medium sand soil. It is

29
necessary to mention that once the cap thickness is 1m and above, the load distributed to Piles 1,
3 and 4 is almost the same (Fig. 4.2 and Table 4.1).
Figure 4.2 Pile Load vs pile cap thickness for the 16-pile foundation: (a) medium sand soil,
(b) dense sand soil.
Table 4.1 Pile load for different pile cap thickness, 16-pile foundation.
For the 9-pile foundation, it can be seen in Fig. 4.3 for the cap thickness of 0.5m, a large
load is developed in Pile 2, which is about 16-18 times in other piles as provided in Table 4.2.
Such a result indicates the pile cap is much more flexible in the 9-pile foundation than in a 16-pile
foundation in which the ratio was about 4 (Table 4.1). Another reason leading to such a huge

30
difference in the pile load between Pile 2 and the other three piles is the number of piles associated
with the Pile ID (Table 4.2) is different. More specifically, in this foundation, there is only one
pile labeled as Pile 2 while there are two piles labeled as Pile 1 and Pile 4, four as Pile 3. As
illustrated in Table 4.2 once Pile 2 is removed in the calculation, the ratio of the maximum to the
minimum pile load is reduced from 15.9 (medium sand) and 18.4 (dense sand) to 1.9. While for
the thickness of 1m, this ratio is about 1.3, and for the thickness of 1.5m, 1.75m, 2m and 3m, the
ratio is about 1.2 for medium sand soil, 1.1 to 1.2 for dense sand soil.
Figure 4.3 Pile load vs pile cap thickness for the 9-pile foundation: (a) medium sand soil,
(b) dense sand soil.
Table 4.2 Pile load for different pile cap thickness, 9-pile foundation.

31
With respect to the effect of the soil medium on the pile load, the results in Figs. 4.2 and
4.3 indicate that dense soil tends to help distribute the load more uniformly across piles than
medium sand. This is also supported by the results provided in Tables 4.1 and 4.2 since the ratios
of the maximum load resistance to the minimum associated with the dense sand are relatively
smaller than those associated with the medium sand.
Theoretically, all the piles would not be able to develop exactly the amount of load. In this
study, the external load was considered to be evenly distributed to the piles once the difference of
the load resistance in the piles is not greater than 20%. Given this, considering the results for both
medium sand soil and dense sand soil, it can be noted that, among a variety of the cap thickness
examined, a pile cap with a thickness of 1.75m or above is able to distribute the load uniformly to
all the piles except the center pile in the 9-pile foundation. The results for the displacement of the
pile cap provided the same conclusion, the detailed discussion is presented in Section 4.2.2.

32
Figure 4.4 Percentage of load sharing vs pile cap thickness: (a) 16-pile foundation,
(b) 9-pile foundation.
Figures 4.4a and 4.4b present the load sharing between piles and pile cap for the 16-pile foundation
and 9-pile foundation, respectively. It can be noted that at the cap thickness of 0.5m, most of the
load is taken by piles. More specifically, for the 16-pile foundation, piles take about 60-70% of
the total load and the pile cap only takes a small portion of the load, which is about 30-40%. For
the 9-pile foundation, piles take even more load compared with the 16-pile foundation, i.e., about
75% of the load is taken by the piles while the pile cap takes about 25% of the load. Such results
(a)
(b)

33
indicate that the pile cap is extremely flexible compared to piles, as a result, it could not be able to
develop resistance again external loading. When the pile thickness reaches around 0.75m which is
the average between 0.5m and 1m, both pile cap and piles share the same amount of the load, i.e.,
each takes 50% of the load. When the thickness becomes 1m and above, the load sharing between
the pile cap and the piles does not change with the cap thickness. The percentage of the load carried
by the pile cap is about 60% for the 16-pile foundation, 70% for the 9-pile foundation.
Furthermore, the results in Fig. 4.4 illustrate that the soil medium does not affect the load sharing.
It is necessary to mention that the self-weight of the pile cap was considered to determine the load
sharing results presented in Fig. 4.4. In this study, it was noted that the self-weight of the cap would
affect the load sharing percentage by 6% for the 16-pile foundation, and 4% for the 9-pile
foundation.
Pile cap deformation
In addition, to examine the load carried by each individual pile, the deformation of the pile
cap for different cap thickness was evaluated in this study. Figure 4.5 illustrates the 9 points for
the 16-pile foundation, 4 points for the 9-pile foundation selected for this exercise.
Figure 4.5 Location of typical points to examine the displacement: (a) 16-pile foundation,
(b) 9-pile foundation.
(a) (b)

34
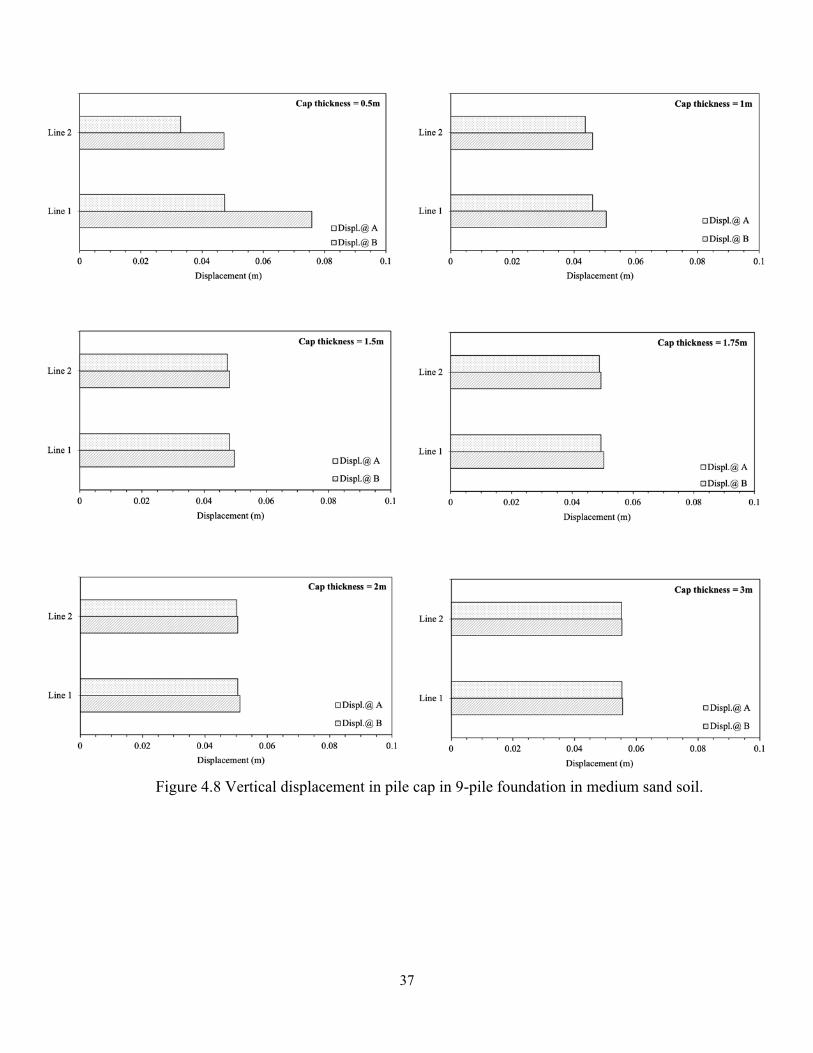
Figures 4.6 and 4.7 present the displacement at points A, B and C along lines 1, 2, and 3
for the 16-pile foundation for medium sand and dense sand, respectively while Figures 4.8 and 4.9
show the displacement at points A and B along lines 1 and 2 for the 9-pile foundation for medium
sand and dense sand, respectively. The dashed line on each plot in the figures represents the
average displacement based on the data presented for a given pile cap thickness. As expected, the
cap displacement in the foundation with medium sand is larger than that in the foundation with
dense sand. This is due to the fact that a loose soil medium provides less support to the pile cap as
compared to a dense soil medium. It can be noted that in Figs. 4.6 to 4.9 that there is a great deal
of variation among the displacements for the cap thickness of 0.5m especially for the results for
the 9-pile foundation (Figs. 4.8 and 4.9).

35
Figure 4.6 Vertical displacement in pile cap in 16-pile foundation in medium sand soil.

36
Figure 4.7 Vertical displacement in pile cap in 16-pile foundation in dense sand soil.
37
Figure 4.8 Vertical displacement in pile cap in 9-pile foundation in medium sand soil.

38
Figure 4.9 Vertical displacement in pile cap in 9-pile foundation in medium sand soil.
39
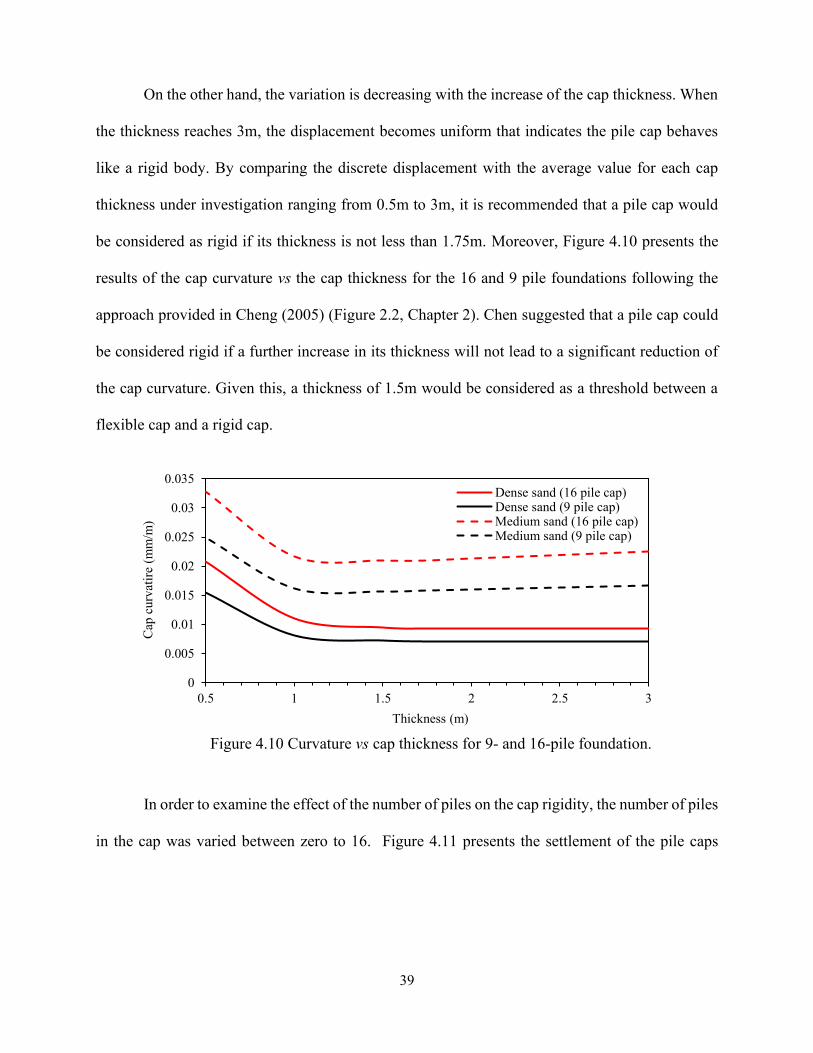
On the other hand, the variation is decreasing with the increase of the cap thickness. When
the thickness reaches 3m, the displacement becomes uniform that indicates the pile cap behaves
like a rigid body. By comparing the discrete displacement with the average value for each cap
thickness under investigation ranging from 0.5m to 3m, it is recommended that a pile cap would
be considered as rigid if its thickness is not less than 1.75m. Moreover, Figure 4.10 presents the
results of the cap curvature vs the cap thickness for the 16 and 9 pile foundations following the
approach provided in Cheng (2005) (Figure 2.2, Chapter 2). Chen suggested that a pile cap could
be considered rigid if a further increase in its thickness will not lead to a significant reduction of
the cap curvature. Given this, a thickness of 1.5m would be considered as a threshold between a
flexible cap and a rigid cap.
Figure 4.10 Curvature vs cap thickness for 9- and 16-pile foundation.
In order to examine the effect of the number of piles on the cap rigidity, the number of piles
in the cap was varied between zero to 16. Figure 4.11 presents the settlement of the pile caps
0
0.005
0.01
0.015
0.02
0.025
0.03
0.035
0.5 1 1.5 2 2.5 3
Cap
curv
atir
e (m
m/m
)
Thickness (m)
Dense sand (16 pile cap)Dense sand (9 pile cap)Medium sand (16 pile cap)Medium sand (9 pile cap)

40
versus the cap thickness. It can be noted that the settlement decreases by increasing the number of
piles in the cap. This can be explained by the fact that the piles act as stiffeners for the cap.
Figure 4.11 Center settlement of the pile cap foundation with variable cap thicknesses for
different pile cap foundations.
4.3 Effect of pile spacing
Based on the observations discussed above, a thickness of 1.75m is selected for a cap to be
rigid and it is being used in the next phase of the study to examine the effects of pile spacing, pile
diameter and pile length on the performance of piles and pile cap.
In order to investigate the effect of pile spacing on the pile load resistance and pile cap
deformation, for the 16-pile foundation, the pile spacing selected for the investigating is 1.25m,
1.5m, 1.75m, 2m, and 2.25m while for the 9-pile foundation, it is 1.25m, 1.75m, 2.25m, 2.75m,
and 3m. Other parameters for this exercise are presented in Tables 3.1 and 3.2, Chapter 3.
Pile load resistance
Figures 4.12 and 4.13 show the ultimate load in Piles 1 to 4 for the 16-pile foundation and
9-pile foundation, respectively in which Figures 4.12a and 4.13a illustrate the results for the
0
0.01
0.02
0.03
0.04
0.05
0.06
0.07
0.5 1.0 1.5 2.0 2.5 3.0
Set
tlem
ent
(m)
Thickness (m)
Dense sand (16 pile cap)
Dense sand (9 pile cap)
Dense sand( No piles)

41
foundation in medium sand while Figures 4.12b and 4.13b illustrate the results for the foundation
in dense sand.
For the 16-pile foundation, it can be seen in Fig. 4.12 that there is a greater deal of variation
on the load among the 5 pile spacings tested in the medium sand soil than in the dense sand soil.
Specifically, for the medium sand soil, the ratio of the maximum to the minimum pile load for the
five cases considered is around 1.3 while for the dense sand this ratio is much less which is not
greater than 1.1 (Table 4.3). Furthermore, the results in Fig. 4.12b clearly demonstrate the load is
uniformly distributed to the piles.
Figure 4.12 Pile load vs pile spacing for the 16-pile foundation: (a) medium sand soil,
(b) dense sand soil.
Table 4.3 Pile load for different pile spacing, 16-pile foundation

42
For the 9-pile foundation, since the number of piles associated with each pile ID is not the
same, as expected the variation in the data shown in Fig. 4.13 is much wider than that in Fig. 4.12.
However, it is noted that the difference in the pile load developed among the piles is the same for
the five pile spacings considered from 1.25m to 3.25m, which is 1.60 for the medium sand soil and
1.40 for the dense sand soil as listed in Table 4.4. If Pile 2 is eliminated in the calculation, the ratio
is reduced to around 1.2 for the medium sand soil, 1.1 for the dense sand soil. According to the
threshold defined above, the load in Piles 1, 3, and 4 could be considered as a uniform distribution.
Figure 4.13 Pile load vs pile spacing for the 9-pile foundation: (a) medium sand soil,
(b) dense sand soil.
Table 4.4 Pile load for different pile spacing, 9-pile foundation.
Based on the ratios of the maximum to the minimum pile load summarized in Tables 4.3
and 4.3, it was noted that ratio at the greatest spacing, i.e., 2.25m for the 16-pile foundation and

43
3.25m for 9-pile foundation, was larger than those ratios at smaller spacing. This is because piles
farther apart make the cap less rigid compared with a cap where piles are closer to each other,
which was approved by the results for the cap displacement (see Section 4.2.2).
Figure 4.14 presents the results for the load sharing between piles and pile cap for the five
pile spacings considered in the analysis. It can be noted that the load sharing percentage does not
Figure 4.14 Percentage of load sharing vs pile spacing: (a) 16-pile foundation,
(b) 9-pile foundation

44
change with the pile spacing. The load carried by the pile cap is about 60% in the case for the 16-
pile foundation and it is about 70% in the case for the 9-pile foundation, which is consistent with
the finding observed in the investigation of the effect of the pile cap thickness on the response of
the foundation as discussed in the previous section 4.1.1.
Pile cap deformation
Figures 4.15 and 4.16 illustrate the displacement of the pile cap for the 16-pile and 9-pile
foundation, respectively. The values for the pile spacing selected for presentation are 1.25m
(lowest), 1.75m, and 2.25m (highest) for the 16-pile foundation; 1.25m (lowest), 2m, and 3.25m
(highest) for the 9-pile foundation. The results in these figures show that the medium sand
generates more displacement in the cap than the dense sand. This is because the medium sand
provides less support to the cap than the dense sand. It is also noted in the figures that the variation
in the displacement becomes wider with the increase of the pile spacing. For example, at the two
smaller pile spacing (i.e., 1.25m and 1.75m for the 16-pile foundation, 1.25m, and 2m for the 9-
pile foundation), the variation is not very noticeable. However, at the largest pile spacing (i.e.,
2.25m for the 16-pile foundation, 3.25m for the 9-pile foundation), the variation is relatively larger,
and it indicates that larger pile spacing tends to prevent the external load from being uniformly
distributed across piles. This tendency can also be seen in Tables 4.3 and 4.4.

45
Figure 4.15 Vertical displacement in pile cap in 16-pile foundation: (a) medium sand soil,
(b) dense sand soil.

46
Figure 4.16 Vertical displacement in pile cap in 9-pile foundation: (a) medium sand soil,
(b) dense sand soil.
4.4 Effect of pile diameter
The diameters selected to examine the effect of pile diameter on the pile load resistance
and pile cap deformation are 0.4m, 0.5m, 0.7m, and 1.0m. As mention above in Section 4.1.2, the
thickness of the pile cap considered is 1.75, all other parameters used in the analysis are given in
Tables 3.1 and 3.2, Chapter 3.

47
Pile load resistance
The load resistance developed in each of the 4 piles (layout is given in Fig. 4.1) associated
with different pile diameters is presented in Figs. 4.17 and 4.18 for the case for the 16-pile
foundation and the case for the 9-plie foundation, respectively. In each figure, one plot is for the
medium sand soil and the other is for the dense sand soil.
Figure 4.17 Pile load vs pile diameter for the 16-pile foundation: (a) medium sand soil,
(b) dense sand soil.
Figure 4.18 Pile load vs pile diameter for the 9-pile foundation: (a) medium sand soil,
(b) dense sand soil.

48
It can be seen in Fig. 4.17, for the case for the 16-pile foundation with medium sand soil
(Fig. 4.17a), the load carried by Piles 1, 3, and 4 is quite close while the load carried by Pile 2 is
relatively high, which it is about 30% to 40% larger than that by Pile 3 taking the least load among
the 4 piles, as shown in Table 4.5. It is also noted that for the 4 diameters considered, pile diameter
of 0.5m leads to the smallest difference in the load among the 4 piles, which is also the case for
the dense sand soil. Compare with a wider distribution of the load in the piles observed in Fig.
4.17a, the load developed in each pile in the dense sand soil is very close. Although it is seen in
the figure that, at the diameter of 1m, the load provided by Pile 2 is relatively higher than that by
the other three piles, the difference is not very significant, instead, it is only about 20%. According
to the threshold proposed in Section 4.1.2 (i.e., if the load difference in the piles is less than 20%,
then the load in each pile is considered approximately the same), the external load would be
considered evenly distributed to piles for the four pile diameters considered in this study.
As discussed in Sections 4.1 and 4.2, the results shown in Fig. 4.18 for the 9-pile foundation
is not a surprise in which the load provided by Pile 2 is much higher than that provided by Piles 1,
3, and 4 while the load developed in these three piles is very close. More specifically, when Pile 2
is eliminated to determine the difference between the largest and the smallest load in the pile, the
ratio is about 15% as given in Table 4.6. Therefore, it can be concluded that Piles 1, 3 and 4 take
equal loads.
Table 4.5 Pile load for different pile diameter, 16-pile foundation.

49
Table 4.6 Pile load for different pile diameter, 9-pile foundation.
It is worth mentioning that the load developed in the piles linearly increases with the
increase of the pile diameter as illustrated in Fig. 4.15 and 4.16. This is because the axial stiffness
of the pile is linearly proportional to its diameter.
Figures 4.17a and 4.17b present the results for the load sharing between piles and pile cap
associated with different pile diameter. It is interesting to observe in the figure that the percentage
of the load sharing changes linearly with the increase of the pile diameter. For the 16-pile
foundation, at the pile diameter of 0.7m, piles and pile cap share the load equally, i.e., each
component takes 50% of the load. At the pile diameter smaller than 0.7m, most of the load is
carried by the pile cap, which is consistent with the finding from the investigation into the effect
of the pile cap thickness and pile spacing as discussed in the previous Sections 4.1 and 4.2.
However, when the diameter becomes larger than 0.7m, the group of piles carries most of the load.
50
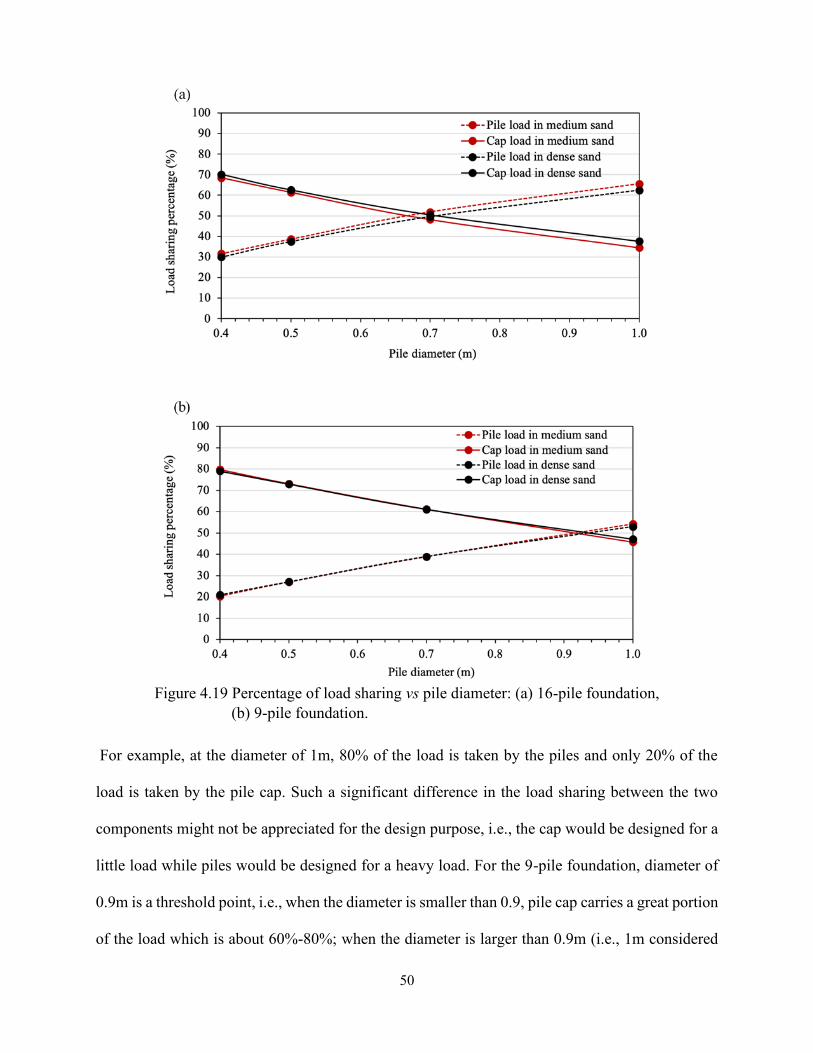
Figure 4.19 Percentage of load sharing vs pile diameter: (a) 16-pile foundation,
(b) 9-pile foundation.
For example, at the diameter of 1m, 80% of the load is taken by the piles and only 20% of the
load is taken by the pile cap. Such a significant difference in the load sharing between the two
components might not be appreciated for the design purpose, i.e., the cap would be designed for a
little load while piles would be designed for a heavy load. For the 9-pile foundation, diameter of
0.9m is a threshold point, i.e., when the diameter is smaller than 0.9, pile cap carries a great portion
of the load which is about 60%-80%; when the diameter is larger than 0.9m (i.e., 1m considered
51
in the examination), pile cap and group of piles each takes about 50% of the load. Comparing the
results between the 16-pile foundation and the 9-pile foundation, it is seen in Fig. 4.19 that the cap
in the 9-pile foundation carries about 10%-20% more load than that in the 16-pile foundation. This
is due to the significantly reduced number of piles (i.e., 9 vs 16) in the foundation.
Pile cap deformation
Figures 4.20 and 4.21 show the results of the cap displacement for the 16-pile foundation
and 9-pile foundation, respectively. The diameters chosen for the presentation are the smallest
diameter of 0.4m and the largest diameter of 1m used in the analysis. It can be noted that the
variation in the displacement does vary with the change of the pile diameter for all the cases (16-
pile foundation and 9-pile foundation, both medium sand soil and dense sand soil). Where the
variation of the displacement associated with the diameter of 0.4m is slightly larger than that of
the 1m. It can be concluded then that the pile diameter does slightly affect the displacement of the
pile cap.

52
Figure 4.20 Vertical displacement in pile cap in 16-pile foundation: (a) medium sand soil,
(b) dense sand soil.

53
Figure 4.21 Vertical displacement in pile cap in 9-pile foundation: (a) medium sand soil,
(b) dense sand soil.
4.5 Effect of pile length
The pile length considered in the investigation of its effect on the performance of the
foundation is 5m, 8.5m, 10m, and 14m. As used in the analysis for the pile spacing and pile
diameter, the thickness of the pile cap is taken as 1.75m in this examination while the values of all
other parameters are given in Tables 3.1 and 3.2, Chapter 3. Figures 4.22 and 4.23 present the
ultimate Load in each of the four selected piles for the 16-pile and 9-pile foundation, respectively.
The layout of the four piles is illustrated in Fig. 4.1.

54
Figure 4.22 Pile load vs pile length for the 16-pile foundation: (a) medium sand soil,
(b) dense sand soil.
Figure 4.23 Pile load vs pile length for the 9-pile foundation: (a) medium sand soil,
(b) dense sand soil.
Pile load resistance
It can be seen in Fig. 4.22a (for the 16-pile foundation, medium, and dense sand soil) that
the load developed in Pile 2 is quite larger compared to that developed in the other three piles
while the load in Piles 1, 3, and 4 is very close. More specifically, as shown in Table 2.7, the ratio
of the resistance in Pile 2 (maximum load) to that in Pile 3 (minimum load) ranges from about 1.15
for the pile length of 5m to 1.40 for the pile length of 14m. However, for the dense sand soil, the

55
load generated in Pile 2 is not very much different from that in Piles 1, 3 and 4 like observed in
the results for the medium sand soil. Instead, the load developed in Pile 2 is about 10% higher than
in the other three piles (Table 4.7). Considering such a small difference in the results, the load
distribution among the piles can be treated uniformly distributed.
With respect to the results of the 9-pile foundation (Fig.4.23), like the observation
discussion in the previous sections and due to the layout of piles in the foundation, there is no
doubt that the Load in Pile 2 is significantly larger than in the other three piles. For example, the
Load in Pile 2 is about two times in Pile 3 for the pile length of 5m (Table 4.8). However, if Pile
2 is not considered to determine the difference between the load resistance in piles, this ratio is
reduced dramatically from 2.11 to 1.28 as shown in Table 4.8. The results in Table 4.8 indicate
that the load resistance could be considered uniformly distributed among Piles 1, 3, and 4 for both
medium and dense sand soil for all the four values of the pile length under examination, except for
the pile length of 5m in medium sand since the ratio of the difference in the load resistance among
the four piles is too high to be considered to be uniform.
Furthermore, it can be seen clearly in Figs. 4.22 and 4.23 that the load in Pile 2 (i.e., center
pile) increases linearly with the increasing of the pile length. However, this increase grows much
faster in the dense sand soil than in the medium sand soil for both the 16-pile and 9-pile foundation.
In addition, the results in Tables 4.7 and 4.8 demonstrate that the difference in the load resistance
with the increasing of the pile length. It indicates that a larger pile length helps to achieve even
load distribution among the piles.

56
Table 4.7 Pile load for different pile length, 16-pile foundation.
Table 4.8 Pile load for different pile length, 9-pile foundation.
The results of the load sharing between piles and pile cap (Fig. 4.24) show that this sharing
changes linearly with the increase of the pile length and the soil medium does not affect the load
sharing. Given the observations from the results of the pile load resistance, it is expected that the
percentage of the load carried by the piles is higher for a larger pile length. For the largest pile
length tested, for the 16-pile foundation, piles, and pile cap share the same amount of the load
(i.e.50%) while for the 9-pile foundation, piles carry about 35% of the load and pile cap carries
65% of the load. Once the pile length is reduced, the percentage of the load shared by the piles is
also reduced. For example, for the 16-pile foundation, for the pile length of 5m, piles take about
30% of the load while the pile cap takes about 70% of the load; for the 9-pile foundation, for the
same length, these two percentages are 20% and 80%, respectively.

57
Figure 4.24 Percentage of load sharing vs pile length: (a) 16-pile foundation,
(b) 9-pile foundation.
Pile cap deformation
Figures 4.25 and 4.26 show the results of the pile cap displacement for the 16-pile
foundation and 9-pile foundation, respectively, for the pile length of 5m (Figs. 4.25a and 4.26a)
and 14m (Figs. 4.25b and 4.26b). The findings of the results are consistent with those obtained in
the evaluation of the effects of pile cap thickness, pile diameter and pile spacing on the response
(a)
(b)

58
of the foundation, namely, (i) the vertical displacement of the pile cap is smaller in the dense sand
soil than in the medium sand soil, (ii) the variation in the displacement remain the same regardless
of the quantity of the parameter under investigation.
Figure 4.25 Vertical displacement in pile cap in 16-pile foundation: (a) medium sand soil,
(b) dense sand soil.
59
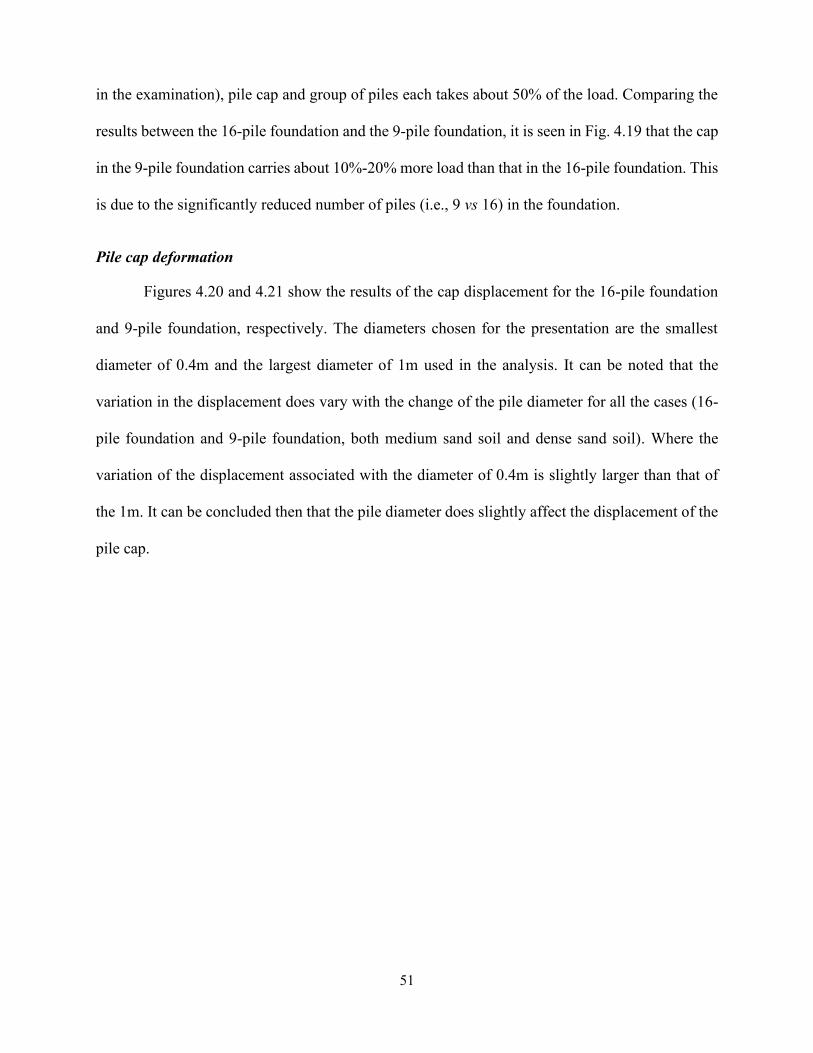
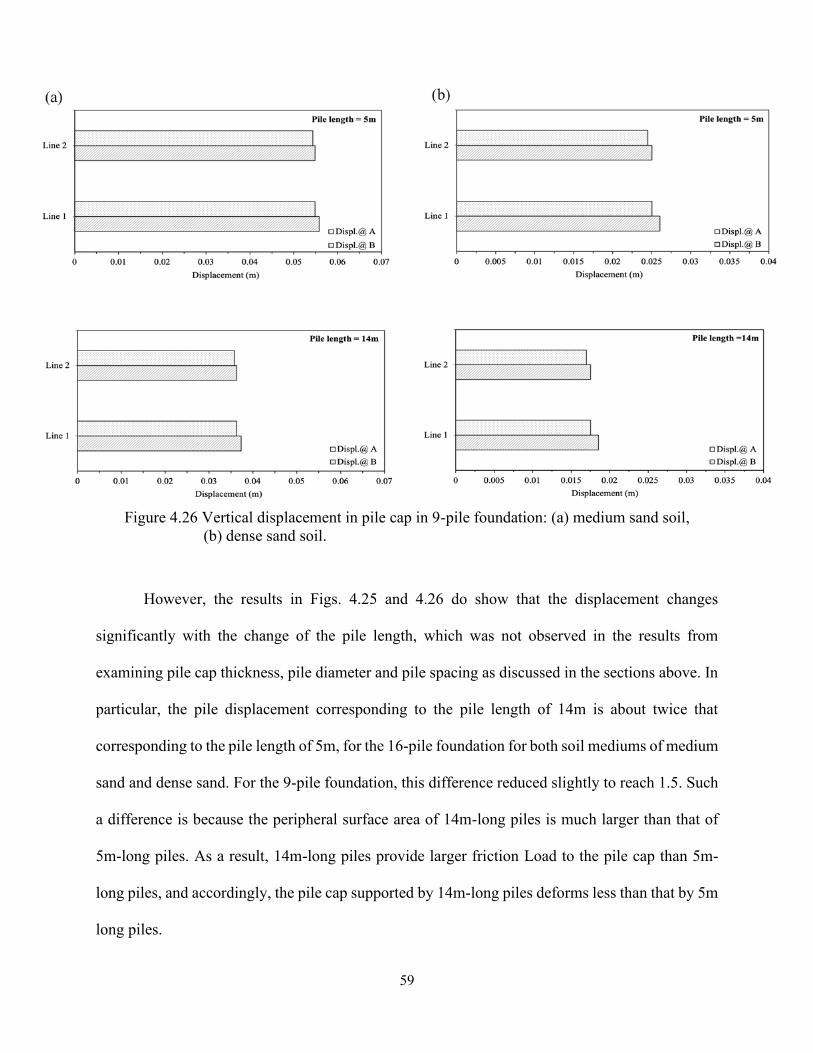
Figure 4.26 Vertical displacement in pile cap in 9-pile foundation: (a) medium sand soil,
(b) dense sand soil.
However, the results in Figs. 4.25 and 4.26 do show that the displacement changes
significantly with the change of the pile length, which was not observed in the results from
examining pile cap thickness, pile diameter and pile spacing as discussed in the sections above. In
particular, the pile displacement corresponding to the pile length of 14m is about twice that
corresponding to the pile length of 5m, for the 16-pile foundation for both soil mediums of medium
sand and dense sand. For the 9-pile foundation, this difference reduced slightly to reach 1.5. Such
a difference is because the peripheral surface area of 14m-long piles is much larger than that of
5m-long piles. As a result, 14m-long piles provide larger friction Load to the pile cap than 5m-
long piles, and accordingly, the pile cap supported by 14m-long piles deforms less than that by 5m
long piles.

60
CHAPTER 5
CONCLUSIONS AND RECOMMENDATIONS
5.1 Summary and Conclusions
In pile foundations, the cap is designed to transfer the loads from the superstructure to the
piles. The structural design of the cap stipulates that the cap will distribute the load uniformly on
the piles. The cap rigidity plays an important role in the loads taken by each individual pile. For a
flexible cap, some piles within the group may be overloaded, while others may carry less or be
separated from the cap. However, a relatively rigid cap may impose additional load on the piles.
Thus, the design of the cap in a pile foundation must be optimized to meet the design requirement
without imposing additional load.
In this thesis, a 3-D finite element model was developed to simulate the case of pile/cap/soil
system to examine the effects of pile spacing, pile diameter, pile length on the rigidity on the pile
cap and accordingly, the load distribution on the piles within the group. The software ABAQUS
was used in this analysis. The model was validated by the data available in the literature. Based on
the results obtained in this study, the following was concluded:
With respect to the pile cap thickness:
1. The thickness of the pile cap acts as flexible up to a certain thickness, beyond which the
cap acts as a rigid slab, where the loads are almost distributed evenly on the piles. The
thickness of 1.75 m is recommended as a lower bond for a pile cap to be rigid.
2. CSA A23.3-14 specifications for the design of pile caps lead to overestimating the pile cap
thickness.

61
3. The additional load (i.e., load from self-weight) in the cap and piles due to increasing pile
cap thickness is about 3% of the total load. Therefore, this extra load should not be a
concern in the selection of cap thickness.
With respect to the pile cap rigidity:
1. It increases with increasing pile diameter. This is due to the fact that by increasing the pile
diameter, the contact area of piles and the cap increases, which will further reduce the
settlement.
2. It increases with an increasing number of piles, as piles act as stiffeners to the cap.
3. It increases with an increasing pile length.
With respect to the load sharing:
1. Pile spacing does not affect the load sharing between the cap and the group of piles.
2. Load sharing increased linearly with increasing pile diameter and pile length.
5.3 Recommendations for future research
1. Examine the case of a variety of pile cap geometry in terms of length, width, and thickness
for a given layout of the piles to develop a threshold of the relative rigidity between a pile
cap and a group of piles such that the loads in piles are well distributed.
2. Introduce an optimum percentage for load sharing between a pile cap and a group of piles
to achieve the most economical design for both pile cap and piles.
3. Investigate the nonlinear behavior of piles.
4. Extend the current study to include bending moment and lateral load as external loading.

62
REFERENCES
1. Alnuiam, A., El Naggar, H., and El Naggar, M. (2013). "Performance of Piled-Raft System
under Axial Load." Proceedings of the 18th International Conference on Soil Mechanics
and Geotechnical Engineering. 2663–2666.
2. Abbas, J.M., Chik, Z., and Taha, M.R. (2008). Influence of Pile Cap Thickness on the Axial
Response of Pile Group. International Conference on Construction and Building
Technology., E(07): 63-72.
3. Adebar, P., Kuchma, D., and Collins, M. (1984). Investigation of thick slab (pile cap)
behavior. ACI Structural Journal, 81(1): 35-39.
4. Adebar, P., Kuchma, D., and Collins, M. (1990). Strut-and-Tie models for the design of
pile caps: An experimental study. ACI Structural Journal, 87(1): 81-92.
5. Adebar, P., and Zhou, L.Z., (1996). Design of deep pile caps By Strut-and-Tie models. ACI
Structural Journal, 93(1): 1-12.
6. Berebugo, Y. (1966). An experimental study of the load distribution in pile groups in sand.
Canadian Geotechnical Journal, 3(3): 145-166.
7. Bowles, J. (1997). Foundation analysis and design. Peoria: McGraw-Hill Companies.
8. Brown, M.D., Sankovich, C.L., Bayrak, O., Jirsa, J.O., Brean, J.E., and Wood, S.L. (2006).
Design for shear in reinforced concrete using Strut-and-Tie. Technical report O-4371:
Examination of AASHTO LRFD specifications, Center for Transportation Research,
University of Texas at Austin.
9. Cavers, W., and Fenton, G. (2004). An evaluation of pile cap design methods in accordance
with the Canadian design standard. Canadian Journal of Civil Engineering, 31(1): 109-
119.
10. Cheng, C. (2005). Designing the depth of reinforced concrete rigid-pile caps for tall
buildings, M.A.Sc thesis, Hong Kong University of Science and Technology.

63
11. Cheng, Y., and Zhang, Y. (2004). Thick plate analysis with application to pile cap design.
Chinese Journal of Rock Mechanics and Engineering, 23(6):1001-1006.
12. Demryere, A. (2018). Improvements on design and analysis of pile caps based on the Strut-
and-Tie method, Valencia: KU Leuven.
13. Duan, L., and McBride, S. (1995). The effects of caps stiffness on pile reactions. Concrete
International, 17(1): 42-44.
14. Geotechdata.info. (2013). Soil elastic Young's modulus. [Online]
Available at: http://geotechdata.info/parameter/soil-elastic-young-modulus.html
[Accessed 02 December 2018].
15. Ghali, M. (1999). Effect of pile cap flexural rigidity on the behaviour of bridge foundations.
IABSE Reports, Volume 80: 241-246.
16. Gogate, A., and Sabnis, G. (1980). Design of thick pile caps. ACI Journal, 77(1):18-22.
17. Gudmand-Høyer, T. (2004). Stiffness of Concrete Slabs, Lyngby: Technical University of
Denmark.
18. Hain, S., and Lee, I. (1978). The analysis of flexible raft-pile systems. Géotechnique, 28(1):
65-83.
19. Horikoshi, K. (1995). Optimum design of piled raft foundations, s.l.: The University of
Western Australia.
20. Horikoshi, K., and Randolph, M. (1999). Estimation of overall settlement of piled raft.
Soils and Foundations, 39(2): 59-68.
21. Jeong, S., Won, J., and Kim, Y. (2007). Effect of pile cap flexibility on the response of pile
group supported column. Journal of the Korean Geotechnical Society, 23(9): 39-49.
22. Muhammad, A., Baluch, M., and Azad, A. (1990). Generalized theory for bending of thick
plates. Studies in Applied Mechanics, Volume 24: 45-61.
23. Park, J., Kuchma, D., and Souzaa, R. (2008). Strength predictions of pile caps by a Strut-
and-Tie model approach. Canadian Journal of Civil Engineering, 35(12): 1399-1413.

64
24. Rabbany, G., Islam, S., and Uz-Zaman, H. (2018). Pile cap performances in different
consequences. Architecture Research, 8(2): 51-61.
25. Randolph, M. (1994). Design methods for pile groups and piled rafts. Proceedings of the
13th International conference on soil mechanics and foundation engineering, 5(13): 61-82.
26. Reid, S. (1985). The Flexural Rigidity of Reinforced Concrete Slabs. Computers and
Structures, 20(1): 929-938.
27. Reynolds, C., and Steedman, J. (1988). Reinforced concrete designer's handbook. London:
CRC Press; 10th edition.
28. Rouzegar, J., and Sharifpoor, R. (2015). Flexure of thick plates resting on elastic
foundation using two-variable refined plate theory. Archive of Mechanical Engineering,
62(2): 181-203.
29. Souza, R., Kuchma, D., Park, J., and Bittencourt, T. (2007). Non-linear finite element
analysis of four-pile caps supporting columns subjected to generic loading. Computers and
Concrete, 4(1): 363-376.
30. Souza, R., Kuchma, D., Park, J., and Bittencourt, T. (2009). Adaptable Strut-and-Tie model
for design and verification of four-pile caps. ACI Structural Journal, 106(1):142-150.
31. Timoshenko, S. (1959). Theory of plates and shells. California: McGraw-Hill.
32. Viggiani, C., Mandolini, A., and Russo, G. (2012). Piles and pile foundations. New York:
CRC Press.
33. Zaman, M., Najjar, Y., and Muqtadir, A. (1993). Effects of cap thickness and pile
inclination on the response of a pile group foundation by a three-dimensional nonlinear
finite element analysis. Computers and Geotechnics, 15(1): 65-86.