Performance evaluation and load demand management of grid ...
22
International Journal of Applied Power Engineering (IJAPE) Vol. 9, No. 3, December 2020, pp. 223~244 ISSN: 2252-8792, DOI: 10.11591/ijape.v9.i3.pp223-244 223 Journal homepage: http://ijape.iaescore.com Performance evaluation and load demand management of grid connected hybrid wind-solar-battery system K. M. Venkatachalam, V. Saravanan Department of Electrical and Electronics Engineering, Arunai Engineering College, Anna University, India Article Info ABSTRACT Article history: Received Oct 14, 2019 Revised Feb 16, 2020 Accepted Apr 15, 2020 In this paper, Performance of the grid connected hybrid wind-solar energy system and load demand response of the battery integrated single phase voltage source inverter is presented. The wind energy conversion system is generating AC power and the solar PV system is generating DC power and both are integrating with battery in the common DC bus. The output voltage of the wind and solar system are controlling using dc-dc converters and it achieved more than the battery voltage. P&O algorithm used MPPT based voltage controller is driving the dc-dc converter with a reference voltage value of the battery. The single-phase full-bridge converter is converting DC to AC power and feeding into the standalone AC loads and distribution grid with IEEE 519 standard. The bi-directional converter is controlling the directions of power flow and it operates two modes namely inverter mode and rectifier mode based on a voltage level of the battery. In this bi- directional converter is controlling by the PI controller with the reference value of the DC bus voltage and load current. The power quality and demand response of the inverter is observing at various types of load conditions in standalone mode and grid-connected mode using experimental results. Keywords: Battery energy storage Bidirectional converter Hybrid wind-solar Load demand management Power quality This is an open access article under the CC BY-SA license. Corresponding Author: K. M. Venkatachalam, Department of Electrical and Electronics Engineering, Arunai Engineering College, Tiruvannamalai 606 603, Tamilnadu, India. Email: [email protected] 1. INTRODUCTION The power fluctuation is continually occurring into the distribution power line due to the excessive load demand variation, power generation demand due to decreases the conventional fuel sources, such as highlighted importance of the renewable power generation and fed into the distributed power line for maintaining the standard power quality with reducing the power fluctuation at consumer side [1]. As compared to whole renewable energy sources, the wind energy conversion and solar photovoltaic systems are preferred for distributed power generation because of fewer land requirements and can implement from a low range to high range power generation in rural areas, developed cities and terrace of the buildings based on our requirements [2]. The wind power generation and solar photovoltaic systems are non-linear characteristics due to the variable nature resources of wind velocities and solar irradiation [3]. Many researchers have tried to extract the maximum power from solar photovoltaic and wind energy systems by designing the converters with suitable control algorithms [4]. The several maximum point tracker (MPPT) algorithms techniques are proposed for the wind-solar power system like perturb and observe (P&O), incremental conductance (I&C) method [5]. But mostly P&O algorithm based DC-DC converters is designing for solar photovoltaic and wind energy system to track the maximum power at fluctuated power generation [6]. Various topologies of dc-dc converters are proposed to integrate with common dc-bus with
Transcript of Performance evaluation and load demand management of grid ...

International Journal of Applied Power Engineering (IJAPE)
Vol. 9, No. 3, December 2020, pp. 223~244
ISSN: 2252-8792, DOI: 10.11591/ijape.v9.i3.pp223-244 223
Journal homepage: http://ijape.iaescore.com
Performance evaluation and load demand management of grid
connected hybrid wind-solar-battery system
K. M. Venkatachalam, V. Saravanan Department of Electrical and Electronics Engineering, Arunai Engineering College, Anna University, India
Article Info ABSTRACT
Article history:
Received Oct 14, 2019
Revised Feb 16, 2020
Accepted Apr 15, 2020
In this paper, Performance of the grid connected hybrid wind-solar energy
system and load demand response of the battery integrated single phase
voltage source inverter is presented. The wind energy conversion system is
generating AC power and the solar PV system is generating DC power and
both are integrating with battery in the common DC bus. The output voltage
of the wind and solar system are controlling using dc-dc converters and it
achieved more than the battery voltage. P&O algorithm used MPPT based
voltage controller is driving the dc-dc converter with a reference voltage
value of the battery. The single-phase full-bridge converter is converting DC
to AC power and feeding into the standalone AC loads and distribution grid
with IEEE 519 standard. The bi-directional converter is controlling the
directions of power flow and it operates two modes namely inverter mode
and rectifier mode based on a voltage level of the battery. In this bi-
directional converter is controlling by the PI controller with the reference
value of the DC bus voltage and load current. The power quality and demand
response of the inverter is observing at various types of load conditions in
standalone mode and grid-connected mode using experimental results.
Keywords:
Battery energy storage
Bidirectional converter
Hybrid wind-solar
Load demand management
Power quality
This is an open access article under the CC BY-SA license.
Corresponding Author:
K. M. Venkatachalam,
Department of Electrical and Electronics Engineering,
Arunai Engineering College,
Tiruvannamalai 606 603, Tamilnadu, India.
Email: [email protected]
1. INTRODUCTION
The power fluctuation is continually occurring into the distribution power line due to the excessive
load demand variation, power generation demand due to decreases the conventional fuel sources, such as
highlighted importance of the renewable power generation and fed into the distributed power line for
maintaining the standard power quality with reducing the power fluctuation at consumer side [1].
As compared to whole renewable energy sources, the wind energy conversion and solar photovoltaic systems
are preferred for distributed power generation because of fewer land requirements and can implement from
a low range to high range power generation in rural areas, developed cities and terrace of the buildings based
on our requirements [2]. The wind power generation and solar photovoltaic systems are non-linear
characteristics due to the variable nature resources of wind velocities and solar irradiation [3]. Many
researchers have tried to extract the maximum power from solar photovoltaic and wind energy systems by
designing the converters with suitable control algorithms [4]. The several maximum point tracker (MPPT)
algorithms techniques are proposed for the wind-solar power system like perturb and observe (P&O),
incremental conductance (I&C) method [5]. But mostly P&O algorithm based DC-DC converters is
designing for solar photovoltaic and wind energy system to track the maximum power at fluctuated power
generation [6]. Various topologies of dc-dc converters are proposed to integrate with common dc-bus with

ISSN: 2252-8792
Int J Appl Power Eng, Vol. 9, No. 3, December 2020: 223 – 244
224
buck, boost or buck-boost operations [3]. The overall efficiency of most two popular MPPT techniques
utilized in PV applications are analyzed, these algorithms are Perturb and Observe and Incremental
Conductance. An analysis of the results for the algorithms based on MATLAB simulation for various
changes in solar irradiance is present [7]. The performance of the solar PV system is varied through
experimental results under particle shadowed conditions with series and parallel [8]. A common DC bus has
a major advantage for controlling and power management of the source side as well as load side
converters [9]. Commonly PI and PID controller are using to control the DC-DC converter and dc-ac inverter
in the wind-solar-battery storage system as proposed in [10]. The PI controller used pulse width modulation
(PWM) based grid-connected hybrid wind-solar system with a storage system and without storage is present
in [11]. A 2.5 kW solar array system is developed and results are obtained under partial shaded condition by
using online reacting maximum power point optimization [12].
In large-size distributed power generation system can directly power feed into the grid or load
without any storage system even non-linear resources but the small system, the storage system is required to
feed constant and uninterrupted power to the grid or load especially for standalone mode [13]. Many
topologies have proposed for standalone with a storage system, especially for residential applications [14].
The Co-ordinate control techniques for a system having wind, solar PV, battery energy storage systems
are proposes for single-phase grid-connected and Standalone mode operation [15]. A grid-connected
bi-directional converter is present for standalone operating mode with a battery storage system to
supply the active and reactive power to the load [16]. The single-phase transformer is connecting between
the single-phase inverter and load or grid for interlinks the autonomous power generation system
and distributed power lines. The transformer interlinked grid-connected renewable energy conversion system
is proposed in [17]. A sliding mode controller for a non-isolated DC/DC, bidirectional converter is presented
and comparative study with PI controller is done to analysis inorder to do performance analysis [18].
In grid-connected mode, the phase sequence, voltage and frequency synchronization between power
generation system and distributed grid lines are needed for transfer power to the grid [19]. The phase lock
looped (PLL) algorithm based grid synchronization has been present in [20].
The objective of this system is to extract the maximum power from the wind-solar power generation
system using the MPPT technique, which is power feed into the local load or distribution grid through
a single-phase inverter. In this inverter is operating either standalone mode or grid-connected mode depends
on the availabilities of power generation and load demands. When the system is operating at standalone
mode, the generated electrical power is flow to the local load and excess power is charging to the battery
storage. If the power generation decreases in the source side, the load power is to compensate by discharging
the battery storage. When the system is operating in grid-connected mode, the generated electrical power is
feeding to the distribution grid and charging to the battery storage system. The block diagram of hybrid
wind-solar power generation system can be seen in Figure 1.
Figure 1. Block diagram of hybrid wind-solar power generation system

Int J Appl Power Eng ISSN: 2252-8792
Performance evaluation and Load demand management… (K. M. Venkatachalam)
225
2. DESCRIPTION OF HYBRID WIND-SOLAR-BATTERY ENERGY STORAGE SYSTEM
The proposed hybrid renewable power generation system is consisting of a permanent magnet
synchronous generator (PMSG) based horizontal wind energy conversion system (WECs), three-phase diode
bridge rectifier (DBR), DC-DC converter 1, solar photovoltaic (SPV) array, DC-DC converter 2, battery
energy storage system (BESS), bi-directional converter and transformer-coupled single-phase voltage source
inverter (VSI) as shown in Figure 1. The modeling and control techniques of the hybrid wind-solar-BESS
system are explained in the following sessions 2 and 3.
2.1. Wind energy conversion system
The WECs is converting the wind energy to kinetic energy with the help of wind turbine, which is
a rotating rotor of the PMSG wind generator to generate AC electrical energy. The generated kinetic energy
in the wind turbine is [21].
31( , ) ( )
2w pP AC V
(1)
where, Pw is a generated kinetic energy, A is a swept area of the blades, Cpis a co-efficient of rotor power,
is a tip-speed ratio of the wind turbine, β is pitch angle of the blade, Vω is a wind speed velocity.
The tip-speed ratio of the wind turbine depends on the rotor angular velocity (ω), radius of
the rotor (R), wind speed (Vω) as represented in (2) [22].
R
V
(2)
The swept area of the blade and radius of the rotor can change while the turbine is manufacturing,
so the output power of the wind system depends on the tip-speed ratio ( ) and rotor co-efficient power (Cp)
as shown in Figure 2.
Figure 2. Tip-speed ratio versus rotor co-efficient power
2.1.1. Modeling of permanent magnet synchronous generator The PMSG wind generator is best suitable for the variable speed wind energy conversion systems.
The PMSG output power depends on rating of the generator and swept area of the wind blades, its output
voltage depends on stator resistance, stator current and rate of change of flux linkage between stator and rotor
as represented in (3) [23].
RYB RYB RYB
s s s s
dV R i
dt
(3)
where VsRYBis the output voltage of the PMSG stator winding, Rs is the resistance of the stator windings,
isRYBis the output current values of the PMSG stator windings, ψs
RYB is the flux linkage between the stator

ISSN: 2252-8792
Int J Appl Power Eng, Vol. 9, No. 3, December 2020: 223 – 244
226
and rotor. The three-phase (RYB) is transformed into a direct axis (d) and quadrature axis (q) and
synchronous reference frame with 900 phase differences as defined as follows [24].
sd s sd sd m sq
dV R i p
dt
(4)
sq s sq sq m sd
dV R i p
dt
(5)
where Vsd, isd and ψsd are the direct axis stator voltage, current and flux linkage respectively, Vsq,
isq and ψsq are the quadrature axis stator voltage, current and flux linkage respectively, P is a number of
the pole in machine, Rs is a resistance of the stator winding, ωm is a rotating speed of the rotor. The value of
the d-q axis flux linkage depends on the stator inductance (Ld=Lq=Ls) and flux linkage (ψm) between
the stator and rotor as represented in (6) and (7):
sd d sd mL I
(6)
q q sqL I
(7)
Equations (6) and (7) are sub suited to (4) and (5). The d-q axis stator voltage is rewritten as [25]:
sd s sd d sd m q sq
dV R i L i p L i
dt
(8)
sd s sd s sd m s sq
dV R i L i p L i
dt
(9)
sq s sq q sq m s sd m
dV R i L i p L i
dt
(10)
sq s sq s sq m s sd m
dV R i L i p L i
dt
(11)
The generated power of the PMSG as defined by the combination of direct and quadrature
parameters of the stator. The electromagnetic torque of PMSG can be derived from (12):
3
2se sd sd sq sqP v i v i
(12)
After sub-suiting (9) and (11) into (12) the power is:
2 2
2 2
3
2
sd sd sq sq
se
s sd sq m sd sq sq sd
R i R i
P d dL i i p i i
dt dt
(13)
The first, second and third terms represent the power loss, stored energy in the magnetic field
and energy conversion from electrical to mechanical energy respectively. Electromagnetic torque of
the machine can be derived from the third term.
3
2e m e e sd sq e sq sdP T i i
(14)

Int J Appl Power Eng ISSN: 2252-8792
Performance evaluation and Load demand management… (K. M. Venkatachalam)
227
The relation between the mechanical and electrical velocity of the machine depends on the number
of pole pairs of the machine as presented in (15).
e mp
(15)
3
2e m sq d q sd sqT p i L L i i
(16)
The final expression of the electromagnetic torque is represented in (16). Here can observe the two
different torque equation terms; the first term is a synchronous torque due to the flux linkage of the permanent
magnet, the second term is a reluctance torque due to the difference between direct (d) and quadrature (q)
axis. In this torque equation, the reluctance torque is to be considered as zero and only synchronous torque is
presented because of the PMSG machine has a surface mounted permanent magnetic rotor [26].
3
2e m sqT p i
(17)
2.2. Solar photovoltaic array system The SPV array system is to convert the solar irradiation into DC electrical energy. The rating of
the solar system depends on the number of panels that are connected in array and rating of each panel.
The output voltage and current values are desired by series and parallel connections of the solar panels as
presented in 18.
max
max
max
max
DCseries
P
DCparallel
P
VN
V
IN
I
(18)
where Vmax DC, Imax DC maximum output voltage and current values of the SPV array, Vmax P, Imax P are
maximum output voltage and current values of each panel. Specification details of the WECs can
be seen in Table 1.
Table 1. Specification details of the WECs Parameter Value
Model : Whisper 200
Rotation axis : Horizontal Orientation & rotation direction : Looking up wind & clockwise
Number of blades : 3
Rotor diameter : 2.72 m Weight : 30 kg
Rated power : 1000 W
Rated output voltage : 48 V (AC) Energy produced : 200 kwh/month at 5.4 m/s
Rated wind speed : 11.6 m/s to 13 m/s
Startup/cut in wind speed : 2.7 m/s–3.1 m/s Cut out wind speed : 16 to 18 m/s
Survival wind speed : 55 m/s
Swept area : 5.8 meter square Blade pitch : Fixed
Rotational speed : 1200 rpm
Wind direction sensor : Tail fin & tail boom Yaw control : Free/passive yaw
2.2.1. Modeling of a solar photovoltaic cell The SPV array module is designed by the basic unit of single diode photovoltaic cells. It includes
the series and parallels connected resistances, anti-parallel diode, and current source. A simplified equivalent

ISSN: 2252-8792
Int J Appl Power Eng, Vol. 9, No. 3, December 2020: 223 – 244
228
circuit of the solar photovoltaic cell is shown in Figure 3. I-V characteristic equation of an SPV cell is given
by [27]: ( )
0 1pv s pvq V R I
pv s pvAKTpv ph
sh
V R II I I e
R
(19)
where Iph is a photocurrent by the incident solar irradiation, I0 is a diode reverse saturation current, Id is
a forward current through diode, Ish is a shunt branch resistor current, Rsh and Rse is the shunt and series
resistance respectively, Ipv is a net output current of the SPV, Vpv is a output voltage of the solar cell, q is
a charge of the electron, A and K is the fitting factor and Boltzmann constant (1.38×10⁻²³ J/K) respectively.
( )
0 1
pv s pv
sc
q V R I
N AKT
pv scI I I e
(20)
pv s pv
sh
V R I
R
is omitted from (20) because the shunt resistance is assumed to be infinite and the slope of the I-V
curve is zero at the diodes conducting period. Then the Iph is replaced by short circuit current (Isc), Nsc is
a total number of the solar cells connected in SPV panel. The photocurrent (Iph=0) is zero under open circuit
conditions. Hence, in (20) will be written as [28]:
0
( )ln 1
01 1
ph s phsc
oc
V R II
I V
pv sc
sc
II I e
I
(21)
where VOC is open circuit voltage of the photovoltaic panel. Specification details of the solar photovoltaic
panel can be seen in Table 2.
Figure 3. Equivalent circuit of a solar photovoltaic cell
Table 2. Specification details of the solar photovoltaic panel Parameter Value
Model : EFS12250MC72 Cell type : Multi crystalline
Solar cell per module : 72Cell
Maximum power( Pmax) : 250Wp Open circuit voltage (Voc) : 44.64V
Short current (Isc) : 7.27A
Maximum voltage( Vmp) : 36V Maximum current (Imp) : 6.95A
Maximum systems voltage : 1000VDC
Tolerance @ maximum power ( Pmax ) : ±3% Fill factor : 0.7925
Temperature coefficient - Voc : -0.36%/K
Temperature coefficient -Isc : 0.06%/K Temperature coefficient - Pmax : -0.43%/K
NOCT ( normal operating cell temperature) : 47±2° C
Module dimensions (L x W x T) : 1660x996 x 35 mm Module weight : 18.75 kg
Module area : 1.653 m

Int J Appl Power Eng ISSN: 2252-8792
Performance evaluation and Load demand management… (K. M. Venkatachalam)
229
2.3. Battery energy storage system The battery storage system is a major role for small scale renewable power generation system to
feed uninterrupted power supply to standalone loads without any fluctuations. The fluctuated power is
generating from the wind and solar system is charging to the battery. When the load demand increases more
than the source power, the battery is discharging to compensate load demand. The charging and discharging
process of the BESS is divided by four cases due to availability of wind and solar power generation as:
‒ Case 1:
( ) ( ) ( )solar wind LoadP t P t P t
(22)
In this condition, the combined wind-solar system generated electrical power is equal to
requirements of loads. The battery storage system cannot be entered to picture for the charging
and discharging process, here the storage system will act as a hybrid DC bus.
‒ Case 2:
( ) ( ) ( )solar wind LoadP t P t P t
(23)
In this condition the source power is more than the load demands, its meet to the load requirements
and excess power is a charge to a battery.
‒ Case 3:
( ) ( ) ( )solar wind LoadP t P t P t
(24)
In this condition the source power is unable to meet the load demands and the battery storage system
will deliver power to the load to satisfying the load requirements.
‒ Case 4:
( ) ( ) ( ) ( )solar wind Battery LoadP t P t P t P t
(25)
The load demand keeps on increasing and the availability of source power is too low.
Here the storage system will not able to meet the long duration of load requirements. In this scenario,
the power flows from the grid to load and battery. Specification details of the battery energy storage system
can be seen in Table 3.
Table 3. Specification details of battery energy storage system Parameter Value
Capacity : 800 Ah (each one rating 12 V, 100 Ah) Battery nominal voltage : 48 V
Grid charging current : 3 to 16A DC
Grid charger capacity(% kW rating) : 0-100% Grid charger control : Constant voltage, constant current
Battery type : Compatible with tubular/SMF lead acid
3. CONTROL TECHNIQUES FOR WIND-SOLAR-BATTERY ENERGY STORAGE SYSTEM
The controlling techniques of power electronics converters for source-side wind-solar energy system
and load side of VSI as described in this session. The controller is designed to extract maximum power from
sources and its feed to the load or grid as per grid code standard frequency, voltage and power quality.
The system can operate standalone or grid-connected mode, which is depending on the generated source
power and power demand of the load side.
3.1. Control technique for DC-DC converter 1
The MPPT tracks the maximum powers from the PMSG wind energy conversion system using
a simple perturb and observe the method by sensing the DC bus current. To measured and comparing
the previous DC bus current Idc (k-1) and present dc-bus current Idc (k). If the present DC bus current Idc (k) is
more than the previous DC bus current Idc (k-1), the perturbation is increased up to maximum power point.
If the present DC bus current Idc (k) is less than the previous DC bus current Idc (k-1), the perturbation has to
decrease as mentioned in the flow chart in Figure 4. The DC bus current is positive when the PMSG power

ISSN: 2252-8792
Int J Appl Power Eng, Vol. 9, No. 3, December 2020: 223 – 244
230
available in excess to a battery and fed to the grid. When the wind power is not sufficient feet to grid, the
deficit power is fed from the battery by DC bus current is negative. The DC bus voltage (Vdc-bus) is
compared with reference dc voltage and fed to the PI controller. The error signal of the PI controller is
compared with carrier waveform and to produce the duty cycle of pulse width modulation (PWM) gate signal
is control THE DC-DC converter switches as shown in Figure 5.
Figure 4. MPPT algorithm flow chart for WECs
Figure 5. Control circuit for DC-DC converter 1
3.2. Control technique for DC-DC converter 2 In this present paper, the dc-dc converter is controlled using the P&O algorithm based MPPT
through a PI controller. Its objective is to maintain the desired output voltage of solar the photovoltaic system
by controlling the dc-dc converter at variable irradiation and temperature of the SPV. The MPPT is sensed
generated output voltage and current and compare with reference desired voltage value of the battery as
shown in Figure 6. The buck or boost operating mode of the dc-dc converter depends on the PWM duty cycle
of the DC-DC converter, which is generated from MPPT. When the SPV power generation is increasing
and decreasing due to the variation of irradiation, the duty cycle of the DC-DC converter will decrease or
increase because of the variation of the output voltage of the SPV. MPPT algorithm flow chart for SPV
system is shown in Figure 7.

Int J Appl Power Eng ISSN: 2252-8792
Performance evaluation and Load demand management… (K. M. Venkatachalam)
231
Figure 6. Control circuit for DC-DC converter 2
Figure 7. MPPT algorithm flow chart for SPV system
The total generated power from the SPV system is expressed as:
pv pv pvP V I
(26)
where,Vpv, Ipv are the total generated output voltage and current of the SPV system. The P&O algorithm for
maximum power point tracker follows the power variation of the SPV;

ISSN: 2252-8792
Int J Appl Power Eng, Vol. 9, No. 3, December 2020: 223 – 244
232
pv pv pv pv pvdP dV I V dI
(27)
The maximum power point of the MPPT with respect to the variation of the output voltage at variable
irradiation is:
0pv pv
pv pv
pv pv
dP dII V
dV dV
(28)
The P&O algorithm operating details are represented in (4) and the flowchart of Figure 7;
( ) ( 1)pv pvV k V k V
(29)
When
( ) ( 1) & ( ) ( 1)
( ) ( 1) & ( ) ( 1)
pv pv pv pv
pv pv pv pv
P k P k V k V k
P k P k V k V k
,
( ) ( 1)pv pvV k V k V
(30)
When
( ) ( 1) & ( ) ( 1)
( ) ( 1) & ( ) ( 1)
pv pv pv pv
pv pv pv pv
P k P k V k V k
P k P k V k V k
,
where Vpv(k) is the present output voltage of the SPV, Vpv(k-1) is the previous output voltage of
the SPV, Ppv(k) is the present generated power of the SPV, Ppv(k-1) is the previously generated power of
the SPV.
3.3. Control technique for bi-directional converter The BESS system consisting of battery with a bi-directional converter is connected to the common
DC bus. The purpose of this bi-directional converter is to maintain the constant DC voltage in common DC
bus with help of battery at fluctuated generated power from wind and solar sources and load demand
variations. Whenever the generated electrical power is more than the load demand, the excess power is
charging to the battery. The load demand is more than the source power, the load demand is satisfied by
discharging the battery. The battery is continuously discharging power into the load due to the unavailability of
power generation. In this situation the power flow from grid to a battery through the bi-directional converter to
maintaining the minimum battery voltage to product the battery life. The bi-directional converter can control
based on the availability of power, load demand, minimum and maximum state of charging level by using
a PI controller as shown in Figure 8. The battery state of charging level (SOC) and energy levels are based on
the charging and discharging process due to the availability of input sources and deliver power to the loads.
( 1)( 1)
( ) ( ) ( ( )
( ( ) ))
Battery
Battery Load wind
Battery
solar inverter
E t
E t E t E t
E t
(31)
arg arg arg( ) ( ( )) ( ( ))ch ch chP t solar P t wind P t
(32)
In this proposed 48 V battery system state of charging and discharging voltage, values are vary between 44 V
to 54 V is calculated using 32.
min max( )SOC SOC t SOC
min max44 48 54V V V
(33)

Int J Appl Power Eng ISSN: 2252-8792
Performance evaluation and Load demand management… (K. M. Venkatachalam)
233
The SOCmin and SOCmax are controlled to protect the battery from over-discharging and overcharging by
controlling the trigger signal of the bi-directional converter
min max(1 )SOC DOD SOC
(34)
The SOC values of the battery are depending on the charging current and capacity of the battery;
max . .b n b nSOC V Q
(35)
100 1 battI dtSOC
Q
(36)
where Ibatt is charging current, Q is a capacity of the battery.
Figure 8. Control circuit for bidirectional converter
3.4. Control technique for single phase voltage source inverter The DC-AC converter is converting the DC supply to single-phase desired output voltage, frequency
of AC supply. Depending on the availability of source power, load demand and battery SOC, the inverter
operation is divided into two modes named as standalone mode, grid-connected mode. When the system is
operating at standalone mode, the inverter output voltage and frequency are maintaining constant by using
the PI controller. Due to the variation of load, the output current and voltage magnitude are varying, which is
measured with the help of current and voltage sensor and its compared with the reference value of BESS
voltage magnitude. The PI controller is analyzing the difference between the actual and reference values
and controlled to the pulse width of the inverter switches by using the PWM technique. In this mode of
operation, the generated electrical power from the renewable sources is feeding to the load and excess power
is charging to the battery.
When the system is operating at grid-connected mode, the inverter output voltage magnitude
and frequency depend on the grid voltage and grid frequency. The phase lock loop (PLL) unit is measuring
the value of grid voltage magnitude and frequency and given into the PI controller for synchronizing
the system with grid. The PI controller is comparing the grid voltage, frequency with inverter output voltage
magnitude and frequency, which is using to control the pulse width of inverter switches. In this mode of
operation, the generated electrical output power is fully feeding into the grid, the battery is charging from

ISSN: 2252-8792
Int J Appl Power Eng, Vol. 9, No. 3, December 2020: 223 – 244
234
source or grid through bi-directional converter based availability power sources. The inverters operating at
a standalone and grid synchronization process are shown in Figure 9.
Figure 9. Control circuit for single phase voltage source inverter
4. EXPERIMENTAL RESULTS AND DISCUSSION
The proposed hybrid system power flow management diagram is shown in Figure 10. The control
strategy and performance are evaluated by prototype experimental test in a renewable energy laboratory is
shown in Figure 11. The hybrid system is consisting of PMSG WECs, solar PV array, diode bridge rectifier,
DC-DC converters and single-phase full-bridge converter. The PMSG wind generator is designed at a rating
of 48 V, 1000 W for WECs and its output of ac electrical power is converted into DC electrical power using
DBR. The rating of 1500 W solar PV array is formed by series and parallel arrangement of six solar PV
panels (each one rated power of 250 W), which generates the dc electrical power. The dc-dc converters are
integrating the WECs and SPV with battery in common DC bus, which maintains the 48 V DC supply with
help of voltage control loop with an MPPT control technique. The bi-directional converter rating of 3 kW is
connected to the grid/load through a single-phase 28.8/230 V step-up transformer.

Int J Appl Power Eng ISSN: 2252-8792
Performance evaluation and Load demand management… (K. M. Venkatachalam)
235
Figure 10. Power flow management diagram of the proposed hybrid system
Figure 11. Picture of developed experimental prototype
The battery and grid voltages are sensed using voltage sensors and the output current of
the converter is measured using current sensors, which is the actual value of the control circuit for
the bi-directional converter. The experimental specification details of the wind energy conversion system,
solar array system and battery energy storage system as given in Tables 1 to 3. The performance of the hybrid

ISSN: 2252-8792
Int J Appl Power Eng, Vol. 9, No. 3, December 2020: 223 – 244
236
system is analyzed and power quality is verified under lamp load, induction motor load and computer loads at
constant load conditions as well as the sudden change of load conditions in standalone mode operation.
In grid-connected mode, the generated electrical energy from a hybrid system is feeding into the distribution
grid as verified. The experimental results are measured by using power quality analyzer ALM35 with the NM
93 A current sensors. The wind system-generated output power is varying from 0 W to 1000 W under
the variable voltage of 0 V to 48 V when the wind speed is changing from 0 m/s to 12 m/s. The solar PV
system is generated output power is varying from 0 W to 1500 W under the variable voltage of 0 V to 72 V
when the solar irradiation changes. Even the variable nature of source power the system is to satisfy
the power demands and continuous power is feeding to the loads with standard power quality using a battery
energy storage system.
4.1. Performance of the system for constant load conditions
Figures 12 to 15 are shown the experimental results for constant incandescent lamp load, induction
motor load, computer load and composite loads are connected to the transformer-coupled single-phase
voltage source inverter, which is feeding load power and power qualities are observed in terms of voltage and
current total harmonic distortion (THD) profiles, shape of the inverter output voltage and current. When
the load power is increasing the battery terminal voltage and energy values are decrease due to
the discharging of the battery. The DC-DC converters output voltage is changing due to the variation of
battery voltage and the DC-DC converter output voltage is maintained more than the battery voltage for
quick charge battery as seen results. Figure 12 shows the experimental results for constant incandescent lamp
load at the rating of 1550 W.
(a) (b) (c)
(d) (e) (f)
(g) (h) (i)
Figure 12. Experimental results for constant 1550 W incandescent lamp load, (a) VSC voltage and current,
(b) Phase angle difference between V and I, (c) Voltage THD of VSC, (d) Current THD of VSC,
(e) Terminal voltage of BESS, (f) DC output voltage of WECs, (g) DC output voltage of SPV
(h) Real power of load, (i) Reactive power of load
43.50
44.00
44.50
45.00
45.50
46.00
46.50
47.00
47.50
48.00
48.50
49.00
49.50
50.00
50.50
51.00
51.50
52.00
52.50
53.00
V
5:53:00.000 PM
3/27/2019
5:53:59.000 PM
3/27/2019
11 s/Div
59.000 (s)
44.00
46.00
48.00
50.00
52.00
54.00
V
5:39:00.000 PM
3/27/2019
5:39:59.000 PM
3/27/2019
11 s/Div
59.000 (s)
60.00
65.00
70.00
75.00
V
5:31:00.000 PM
3/27/2019
5:31:59.000 PM
3/27/2019
11 s/Div
59.000 (s)
1.400E+3
1.450E+3
1.500E+3
1.550E+3
1.600E+3
1.650E+3
W
4:13:00.000 PM
5/25/2019
4:13:59.000 PM
5/25/2019
11 s/Div
59.000 (s)
-14.50
-14.00
-13.50
-13.00
-12.50
-12.00
var
4:13:00.000 PM
5/25/2019
4:13:59.000 PM
5/25/2019
11 s/Div
59.000 (s)

Int J Appl Power Eng ISSN: 2252-8792
Performance evaluation and Load demand management… (K. M. Venkatachalam)
237
The transformer coupled inverter supplies the AC electrical power into the lamp load and measured
the inverter output parameters at the duration of 1-minute intervals. The inverter delivering output voltage
and current ratings of 228 V and 6.8 A with respective THD values of 2.6% and 2.9% with unity power
factor and inverter maintains the fundamental frequency of 50.02 Hz as shown in Figure 12(a)-(d). As seen in
Figure 12(e)-(g), the voltage value of BESS is decreasing from 50 V to 42.2 V because of discharging the
BESS and DC output voltage of the wind system is maintain 70 V and solar PV system is maintain 48.49 V
by controlling DC-DC converters, which is more than the BESS voltage. The inverter delivering real
and reactive powers are approximately 1550 W and 0 var, because of the connected load is an incandescent
lamp load it acts as a resistive load as shown in Figure 12(h)-(i).
Figure 13 shows the experimental results for constant induction motor load at the rating of 0.75 hp.
The transformer coupled inverter supplies the AC electrical power into the single-phase induction motor
and measured the inverter output parameters at the duration of 1-minute interval. The inverter delivering
output voltage and current ratings of 225.4 V and 3.6 A with respective THD values of 6.6% and 8.0% with
0.78 lagging power factor and inverter maintains the fundamental frequency of 50.02 Hz is shown in
Figure 13(a)-(d).
(a) (b) (c)
(d) (e) (f)
(g) (h) (i)
Figure 13. Experimental results for constant 0.75 hp induction motor load, (a) VSC voltage and current,
(b) Phase angle difference between V and I, (c) Voltage THD of VSC, (d) Current THD of VSC,
(e)Terminal voltage of BESS, (f) DC output voltage of WECs, (g) DC output voltage of SPV
(h) Real power of load, (i) Reactive power of load
As seen in Figure 13(e)-(g), the first 9 second voltage value of BESS is decreasing from 55 V to 53
V due to the starting current of the induction motor is more than the rated value, after than terminal voltage
of the BESS is increasing to 55 V due to decreasing the inverter delivering current and DC output voltage
50.00
52.00
54.00
56.00
58.00
60.00
V
12:37:00.000 PM
3/28/2019
12:37:59.000 PM
3/28/2019
11 s/Div
59.000 (s)
48.00
50.00
52.00
54.00
56.00
58.00
60.00
V
2:44:00.000 PM
3/28/2019
2:44:59.000 PM
3/28/2019
11 s/Div
59.000 (s)
55.00
60.00
65.00
70.00
75.00
80.00
85.00
V
2:36:00.000 PM
3/28/2019
2:36:59.000 PM
3/28/2019
11 s/Div
59.000 (s)
580.0
600.0
620.0
640.0
660.0
680.0
700.0
W
4:17:00.000 PM
5/25/2019
4:17:59.000 PM
5/25/2019
11 s/Div
59.000 (s)
440.0
460.0
480.0
500.0
520.0
540.0
var
4:17:00.000 PM
5/25/2019
4:17:59.000 PM
5/25/2019
11 s/Div
59.000 (s)

ISSN: 2252-8792
Int J Appl Power Eng, Vol. 9, No. 3, December 2020: 223 – 244
238
of wind system is maintain 55.8 V and solar PV system is maintain 55.8 V by controlling DC-DC converters,
which is more than the BESS voltage. The inverter delivering real and reactive powers are 644 W and 504
var at the time of motor starting and running time real and reactive power values are 637 W and 488 var
respectively as shown in Figure 13(h)-(i). The starting time of induction motor delivering power is more with
more lagging power factor and the running time of induction motor delivering power is less with less lagging
power factor compared with the starting time of the motor.
Figure 14 shows the experimental results for constant computer load at a rating of 400 VA.
The transformer coupled inverter supplies the AC electrical power into the into single-phase non-linear
computer load and measured the inverter output parameters at the duration of the 1-minute interval.
The inverter delivering output voltage and current ratings of 222.4 V and 1.8 A with respective THD values
of 19.4% and 89.3% with flat-topped sinusoidal wave shape and inverter maintains the fundamental
frequency of 50.02 Hz as shown in Figure 14(a)-(d). As seen in Figure 14(e)-(g), the voltage value of BESS
is 55.8 V and the DC output voltage of the wind system is maintain 55.85 V and the solar PV system is
maintain 75.3 V by controlling DC-DC converters, which is more than the BESS voltage. The inverter
delivering real and reactive powers are 282 W and -270 var, because of the connected load is a non-linear
load as shown in Figure 14(h)-(i).
(a) (b) (c)
(d) (e) (f)
(g) (h) (i)
Figure 14. Experimental results for constant 400 VA non-linear loads, (a) VSC voltage and current,
(b) Phase angle difference between V and I, (c) Voltage THD of VSC, (d) Current THD of VSC,
(e)Terminal voltage of BESS, (f) DC output voltage of WECs, (g) DC output voltage of SPV
(h) Real power of load, (i) Reactive power of load
Figure 15 shows the experimental results for constant composite loads, which is consisting of a 500
W incandescent lamp, 400 W non-linear and 0.75 hp induction motor loads. The transformer coupled inverter
50.00
52.00
54.00
56.00
58.00
60.00
V
11:45:00.000 AM
3/28/2019
11:45:59.000 AM
3/28/2019
11 s/Div
59.000 (s)
50.00
52.00
54.00
56.00
58.00
60.00
V
11:51:00.000 AM
3/28/2019
11:51:59.000 AM
3/28/2019
11 s/Div
59.000 (s)
68.00
70.00
72.00
74.00
76.00
78.00
80.00
82.00
V
11:48:00.000 AM
3/28/2019
11:48:59.000 AM
3/28/2019
11 s/Div
59.000 (s)
255.0
260.0
265.0
270.0
275.0
280.0
285.0
290.0
295.0
300.0
305.0
310.0
W
11:36:00.000 AM
3/28/2019
11:36:59.000 AM
3/28/2019
11 s/Div
59.000 (s)
-295.0
-290.0
-285.0
-280.0
-275.0
-270.0
-265.0
-260.0
-255.0
-250.0
-245.0
var
11:36:00.000 AM
3/28/2019
11:36:59.000 AM
3/28/2019
11 s/Div
59.000 (s)

Int J Appl Power Eng ISSN: 2252-8792
Performance evaluation and Load demand management… (K. M. Venkatachalam)
239
supplies the AC electrical power into the composite load and measured the inverter output parameters at
the duration of 1-minute interval. The inverter delivering output voltage and current ratings of 219.10 V and
5.8 A with respective THD values of 9.1% and 13.6% with inverter maintains the fundamental frequency of
50.02 Hz is shown in Figure 15(a)-(d). The inverter delivering real, reactive and apparent powers are 1249
W, 247 var, and 1267 VA respectively is shown in Figure 15(e)-(g). In this composite load condition
the system operating at 0.98 lagging power factor is shown in Figure 15(h) by adding more resistive load into
the composite load the system power factor is reached near to the unity and THD value is to reduce. As seen
in Figure 15(i), the voltage value of BESS is decreasing from 49.8 V to 47.8 V because the load power is
continuously feeding into the load and the BESS energy is reducing to satisfy the load demand.
(a) (b) (c)
(d) (e) (f)
(g) (h) (i)
Figure 15. Experimental results for constant composite loads, (a) VSC voltage and current,
(b) Phase angle difference between V and I, (c) Voltage THD of VSC, (d) Current THD of VSC,
(e) Real power of load, (f) Reactive power of load, (g) Apparent power, (h) power factor,
(i) Terminal voltage of BESS
4.2. Performance of the system for sudden change of load conditions Figures 16 and 17 are shown the experimental results are measured for a sudden change of
incandescent lamp load and induction motor load conditions. The results are measured to analyzing
the performance, reliability, and power controlling capability of the system at suddenly increasing and
decreasing the load demands. The performance of the DC-DC converters is observed under a sudden change
of BESS voltage. Figure 16 shows the experimental results for a sudden change of incandescent lamp loads.
The transformer coupled inverter supplies the AC electrical power into the lamp load and measured
the inverter output parameters at the duration of 3 minutes interval. The first 30 seconds time interval
the inverter is operating at no load condition at inverter output AC voltage of 228.3 V with 50.02 Hz
1.150E+3
1.200E+3
1.250E+3
1.300E+3
1.350E+3
W
4:37:00.000 PM
3/28/2019
4:37:59.000 PM
3/28/2019
11 s/Div
59.000 (s)
225.0
230.0
235.0
240.0
245.0
250.0
255.0
260.0
265.0
270.0
var
4:37:00.000 PM
3/28/2019
4:37:59.000 PM
3/28/2019
11 s/Div
59.000 (s)
1.150E+3
1.200E+3
1.250E+3
1.300E+3
1.350E+3
1.400E+3
VA
4:37:00.000 PM
3/28/2019
4:37:59.000 PM
3/28/2019
11 s/Div
59.000 (s)
0.90
0.92
0.94
0.96
0.98
1.000
1.020
1.040
1.060
4:37:00.000 PM
3/28/2019
4:37:59.000 PM
3/28/2019
11 s/Div
59.000 (s)
44.00
46.00
48.00
50.00
52.00
54.00
V
4:56:00.000 PM
3/28/2019
4:56:59.000 PM
3/28/2019
11 s/Div
59.000 (s)

ISSN: 2252-8792
Int J Appl Power Eng, Vol. 9, No. 3, December 2020: 223 – 244
240
fundamental supply frequency. Then after 30 seconds time interval the lamp load is suddenly increasing from
0 W to 640 W, the inverter output voltage is suddenly reduced from 228.3 V to 228 V and load current is
increased from 0 A to 2.8 A. Then after 60 seconds time interval the lamp load is again increasing from 640
W to 920 W, the inverter voltage again decreased from 228 V to 227.1 V with load current of 4 A.
The load power is again increasing from 920 W to 1560 W, the inverter delivering load current is
varied from 4 A to 6.8 A at the time interval of 90 to 120 seconds. In the last one minute’s the load power is
suddenly decreasing to 640 W, the inverter delivering current is reduced to 2.8 A and voltage of the inverter
is increased to 228 V with a unity power factor as seen in Figure 16(a)-(f). When the load power is increasing
the BESS terminal voltage is decreased due to more power discharge from the storage system and battery
voltage is increased by decrease the load power of the inverter as shown in Figure 16(g). The output voltage
of the DC-DC converters are adjusting due to the variation of battery voltage and the DC-DC converters
output voltage is always more than the BESS as shown in Figure 16(h)-(i). The proposed system is supplying
a continuous uninterrupted power supply to the load without any fluctuations even suddenly increasing and
decreasing the load demands.
(a) (b) (c)
(d) (e) (f)
(g) (h) (i)
Figure 16. Experimental results for sudden change of incandescent lamp load, (a) VSC voltage,
(b) VSC current, (c) Real power of load, (d) Reactive power of load, (e) Apparent power of load,
(f) Power factor, (g) Terminal voltage of BESS, (h) DC output voltage of WECs,
(i) DC output voltage of SPV
Figure 17 shows the experimental results for a sudden change of induction motor load.
The transformer coupled inverter supplies the AC electrical power into the induction motor and measured
the inverter output parameters at the duration of 3 minutes interval. In the first 1 minute time interval the
inverter is operating at no load condition at inverter output AC voltage, current, and power of 228.8 V, 0.8 A
and 190.2 VA respectively with 50.02 Hz fundamental supply frequency. Then after 1 minute time interval
205.0
210.0
215.0
220.0
225.0
230.0
235.0
240.0
245.0
250.0
V
4:42:00.000 PM
3/27/2019
4:44:55.000 PM
3/27/2019
35 s/Div
2:55.000 (min:s)
0.000
0.50
1.000
1.500
2.000
2.500
3.000
3.500
4.000
4.500
5.000
5.500
6.000
6.500
7.000
A
4:42:00.000 PM
3/27/2019
4:44:55.000 PM
3/27/2019
35 s/Div
2:55.000 (min:s)0.000
200.0
400.0
600.0
800.0
1000
1.200E+3
1.400E+3
1.600E+3
W
4:42:00.000 PM
3/27/2019
4:44:55.000 PM
3/27/2019
35 s/Div
2:55.000 (min:s)
-100.0
-80.00
-60.00
-40.00
-20.00
0.000
20.00
40.00
60.00
var
4:42:00.000 PM
3/27/2019
4:44:55.000 PM
3/27/2019
35 s/Div
2:55.000 (min:s)0.000
200.0
400.0
600.0
800.0
1000
1.200E+3
1.400E+3
1.600E+3
VA
4:42:00.000 PM
3/27/2019
4:44:55.000 PM
3/27/2019
35 s/Div
2:55.000 (min:s)
0.90
0.95
1.000
1.050
1.100
4:42:35.000 PM
3/27/2019
4:44:55.000 PM
3/27/2019
28 s/Div
2:20.000 (min:s)
44.00
46.00
48.00
50.00
52.00
54.00
V
5:20:00.000 PM
3/27/2019
5:22:55.000 PM
3/27/2019
35 s/Div
2:55.000 (min:s)
44.00
46.00
48.00
50.00
52.00
54.00
56.00
V
5:43:00.000 PM
3/27/2019
5:45:55.000 PM
3/27/2019
35 s/Div
2:55.000 (min:s)
50.00
55.00
60.00
65.00
70.00
75.00
V
5:33:00.000 PM
3/27/2019
5:35:59.000 PM
3/27/2019
35 s/Div
2:59.000 (min:s)
Int J Appl Power Eng ISSN: 2252-8792
Performance evaluation and Load demand management… (K. M. Venkatachalam)
241
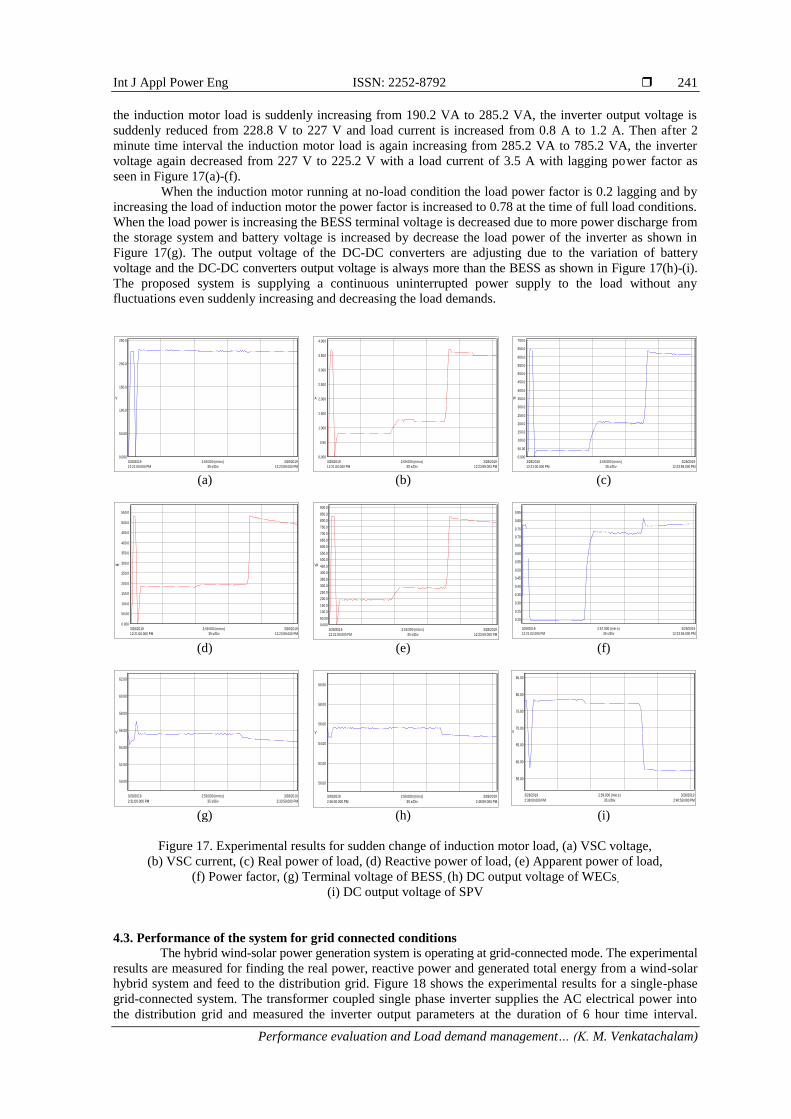
the induction motor load is suddenly increasing from 190.2 VA to 285.2 VA, the inverter output voltage is
suddenly reduced from 228.8 V to 227 V and load current is increased from 0.8 A to 1.2 A. Then after 2
minute time interval the induction motor load is again increasing from 285.2 VA to 785.2 VA, the inverter
voltage again decreased from 227 V to 225.2 V with a load current of 3.5 A with lagging power factor as
seen in Figure 17(a)-(f).
When the induction motor running at no-load condition the load power factor is 0.2 lagging and by
increasing the load of induction motor the power factor is increased to 0.78 at the time of full load conditions.
When the load power is increasing the BESS terminal voltage is decreased due to more power discharge from
the storage system and battery voltage is increased by decrease the load power of the inverter as shown in
Figure 17(g). The output voltage of the DC-DC converters are adjusting due to the variation of battery
voltage and the DC-DC converters output voltage is always more than the BESS as shown in Figure 17(h)-(i).
The proposed system is supplying a continuous uninterrupted power supply to the load without any
fluctuations even suddenly increasing and decreasing the load demands.
(a) (b) (c)
(d) (e) (f)
(g) (h) (i)
Figure 17. Experimental results for sudden change of induction motor load, (a) VSC voltage,
(b) VSC current, (c) Real power of load, (d) Reactive power of load, (e) Apparent power of load,
(f) Power factor, (g) Terminal voltage of BESS, (h) DC output voltage of WECs,
(i) DC output voltage of SPV
4.3. Performance of the system for grid connected conditions The hybrid wind-solar power generation system is operating at grid-connected mode. The experimental
results are measured for finding the real power, reactive power and generated total energy from a wind-solar
hybrid system and feed to the distribution grid. Figure 18 shows the experimental results for a single-phase
grid-connected system. The transformer coupled single phase inverter supplies the AC electrical power into
the distribution grid and measured the inverter output parameters at the duration of 6 hour time interval.
0.000
50.00
100.0
150.0
200.0
250.0
V
12:21:00.000 PM
3/28/2019
12:23:59.000 PM
3/28/2019
35 s/Div
2:59.000 (min:s)0.000
0.50
1.000
1.500
2.000
2.500
3.000
3.500
4.000
A
12:21:00.000 PM
3/28/2019
12:23:59.000 PM
3/28/2019
35 s/Div
2:59.000 (min:s)0.000
50.00
100.0
150.0
200.0
250.0
300.0
350.0
400.0
450.0
500.0
550.0
600.0
650.0
700.0
W
12:21:00.000 PM
3/28/2019
12:23:59.000 PM
3/28/2019
35 s/Div
2:59.000 (min:s)
0.000
50.00
100.0
150.0
200.0
250.0
300.0
350.0
400.0
450.0
500.0
550.0
var
12:21:00.000 PM
3/28/2019
12:23:59.000 PM
3/28/2019
35 s/Div
2:59.000 (min:s)0.000
50.00
100.0
150.0
200.0
250.0
300.0
350.0
400.0
450.0
500.0
550.0
600.0
650.0
700.0
750.0
800.0
850.0
900.0
VA
12:21:00.000 PM
3/28/2019
12:23:59.000 PM
3/28/2019
35 s/Div
2:59.000 (min:s)
0.20
0.25
0.30
0.35
0.40
0.45
0.50
0.55
0.60
0.65
0.70
0.75
0.80
0.85
12:21:02.000 PM
3/28/2019
12:23:59.000 PM
3/28/2019
35 s/Div
2:57.000 (min:s)
50.00
52.00
54.00
56.00
58.00
60.00
62.00
V
2:31:00.000 PM
3/28/2019
2:33:59.000 PM
3/28/2019
35 s/Div
2:59.000 (min:s)
50.00
52.00
54.00
56.00
58.00
60.00
V
2:46:00.000 PM
3/28/2019
2:48:59.000 PM
3/28/2019
35 s/Div
2:59.000 (min:s)
55.00
60.00
65.00
70.00
75.00
80.00
85.00
V
2:38:00.000 PM
3/28/2019
2:40:59.000 PM
3/28/2019
35 s/Div
2:59.000 (min:s)

ISSN: 2252-8792
Int J Appl Power Eng, Vol. 9, No. 3, December 2020: 223 – 244
242
The inverter delivering output voltage is varying 243 V to 235 V and current from 4.5 A to 1.1 A due to
the variation of wind speed and solar irradiation as shown in Figure 18(a)-(b). When the system is operating
at grid-connected mode, the real and reactive powers are feeding into the grid and total generated electrical
energy from the hybrid system is 4.25 kW at 6 hour time durations as seen in Figure 18(c)-(f). The proposed
hybrid wind-solar power generation system is supplying power to the distribution grid as well as standalone
loads with IEEE/IET power quality standards.
(a) (b) (c)
(d) (e) (f)
Figure 18. Experimental results for grid connected condition (a) VSC voltage, (b) VSC current,
(c) Real power, (d) Reactive power, (e) Apparent power, (f) Total generated energy
5. CONCLUSION
The proposed hybrid wind-solar power generation system has to injecting AC fixed power into
the AC loads without any fluctuation by using a battery storage system even though variable speed
and irradiation of the wind and solar system respectively. The ability of the system to extracts maximum
power from the wind-solar by MPPT controller at variable nature of the resources, feeding power to the load
or grid and excess power is charging to the battery. The performance of the bi-directional converter
and energy storage system has been validated through constant load and sudden change of load conditions.
The power quality and reliability of the systems are found under various types of loads like an incandescent
lamp load, induction motor load, non-linear load and composite loads in standalone mode operation. In grid
connected mode operation, the generated electrical power is feeding to the distribution grid with quick
synchronization. The obtained results have authenticated the reliability, performance and power quality under
various types of loads at variable source power and variable load demands.
ACKNOWLEDGEMENTS
This work was supported by Wind Energy Division, Ministry of New & Renewable Energy,
Government of India under grant (IFD Dy. No. 1429 dated 04/11/2016, Demand No. 61/69, Budget Head:
2810.00.104.04.05.31/35).
REFERENCES [1] N. Beniwal, I. Hussain, and B. Singh, "Control and operation of a solar PV-battery-grid-tied system in fixed and
variable power mode," in IET Generation, Transmission & Distribution, vol. 12, no. 11, pp. 2633-2641, 2018.
[2] P. Sanjeev, N. P. Padhy, and P. Agarwal, "Peak energy management using renewable integrated DC microgrid,"
in IEEE Transactions on Smart Grid, vol. 9, no. 5, pp. 4906-4917, 2018.
[3] N. Saxena, B. Singh, and A. L. Vyas, "Integration of solar photovoltaic with battery to single-phase grid," in IET
Generation, Transmission & Distribution, vol. 11, no. 8, pp. 2003-2012, 2017.
210.0
215.0
220.0
225.0
230.0
235.0
240.0
245.0
250.0
255.0
260.0
265.0
270.0
V
11:11:00.000 AM
4/5/2019
4:59:55.000 PM
4/5/2019
1 h/Div
5:48:55 (h:min:s)
0.50
1.000
1.500
2.000
2.500
3.000
3.500
4.000
4.500
5.000
A
11:11:00.000 AM
4/5/2019
4:59:55.000 PM
4/5/2019
1 h/Div
5:48:55 (h:min:s)
0.000
200.0
400.0
600.0
800.0
1000
1.200E+3
W
11:11:00.000 AM
4/5/2019
4:59:55.000 PM
4/5/2019
1 h/Div
5:48:55 (h:min:s)
100.0
150.0
200.0
250.0
300.0
350.0
var
11:11:00.000 AM
4/5/2019
4:59:55.000 PM
4/5/2019
1 h/Div
5:48:55 (h:min:s)
200.0
400.0
600.0
800.0
1000
1.200E+3
VA
11:11:00.000 AM
4/5/2019
4:59:55.000 PM
4/5/2019
1 h/Div
5:48:55 (h:min:s)0.000
500.0
1000
1.500E+3
2.000E+3
2.500E+3
3.000E+3
3.500E+3
4.000E+3
4.500E+3
VAh
11:11:00.000 AM
4/5/2019
4:59:55.000 PM
4/5/2019
1 h/Div
5:48:55 (h:min:s)

Int J Appl Power Eng ISSN: 2252-8792
Performance evaluation and Load demand management… (K. M. Venkatachalam)
243
[4] C. A. Hill, M. C. Such, D. Chen, J. Gonzalez, and W. M. Grady, "Battery energy storage for enabling integration of
distributed solar power generation," in IEEE Transactions on Smart Grid, vol. 3, no. 2, pp. 850-857, June 2012.
[5] K. Basaran, N. S. Cetin, and S. Borekci, "Energy management for on-grid and off-grid wind/PV and battery hybrid
systems," in IET Renewable Power Generation, vol. 11, no. 5, pp. 642-649, 2017.
[6] P. Shanthi, G. Uma, and M. S. Keerthana, "Effective power transfer scheme for a grid connected hybrid
wind/photovoltaic system," in IET Renewable Power Generation, vol. 11, no. 7, pp. 1005-1017, 2017.
[7] Ali Abdulwahhab Abdulrazzaq and Adnan Hussein Ali, "Efficiency performances of two MPPT algorithms for PV
system with different solar panels irradiances," International Journal of Power Electronics and Drive System,
vol. 9, no. 4, pp. 1755-1764, 2018.
[8] S. H. Chong, N. N. Chandren, and C. R. Allan Soon, "Output energy maximization of a single axis photovoltaic
solar tracking system: experimental verification," International Journal of Power Electronics and Drive System,
vol. 10, no 3, pp. 1655-1661, 2019.
[9] S. Jha, I. Hussain, B. Singh, and S. Mishra, "Optimal operation of PV-DG-battery based microgrid with power
quality conditioner," in IET Renewable Power Generation, vol. 13, no. 3, pp. 418-426, 2019.
[10] N. Saxena, B. Singh, and A. L. Vyas, "Single-phase solar PV system with battery and exchange of power in grid-
connected and standalone modes," in IET Renewable Power Generation, vol. 11, no. 2, pp. 325-333, 8 2 2017.
[11] Xiong Liu, Peng Wang, and Poh Chiang Loh, "A hybrid FAC/DC microgrid and its coordination control," IEEE
Transactions on Smart Grid 2011, vol. 2, no. 2, pp. 278-286, 2011.
[12] Yongli Wang, Yujing Huang, Yudong Wang, Ming Zeng, Fang Li, Yunlu Wang, and Yuangyuan Zhang, "Energy
management of smart micro-grid with response loads and distributed generation considering demand response,"
Journal of Cleaner production, vol. 197, no. 1, pp. 1069-1083, 2018.
[13] Sathyanarayana P, R. Ballal, G. Kumar, and Shaileshwari S, "Maximum power point optimization for a grid
synchronized PVsystem considering partial shaded condition using multi objective function," International Journal
of Power Electronics and Drive System, vol. 10, no. 3, pp. 1547-1554, 2019.
[14] P. K. Pathak and A. K. Yadav, "Design of battery charging circuit through intelligent MPPT using SPV system,"
Solar Energy, vol. 178, pp. 79-89, 2019.
[15] M. T. Iqbal and M. Tariq, "Modeling, analysis and control of different DC-DC converter topologies for photovoltaic
emulator," International Journal of Applied Power Engineering, vol. 6, no. 1, pp. 46-55, 2017.
[16] P. M. Lujano-Rojas, R. Dufo-López, J. L. Atencio-Guerra, E. M. G. Rodrigues, J. L. Bernal-Agustín, and J. P. S.
Catalão, "Operating conditions of lead-acid batteries in the optimization of hybrid energy systems and microgrids,"
Applied Energy, vol.179, pp. 590-600, 2016.
[17] A. Chatterjee and K. B. Mohanty, "Current control strategies for single phase grid integrated inverters for photovoltaic
applications-a review," Renewable and Sustainable Energy Reviews, vol. 92, pp. 554-569, 2018.
[18] C. S. Purohit, Geetha M., P. Sanjeevikumar, P. K. Maroti, S. Swami, and V. K. Ramachandaramurthy,
"Performance analysis of DC/DC bidirectional converter with sliding mode and pi controller," International
Journal of Power Electronics and Drive System, vol. 10, no. 1, pp. 357-365, 2019.
[19] Mohamed Ibrahim A. Arafa and El-Sayed Soliman A. Said, "A different vision for uninterruptible load
using hybrid solar-grid energy," International Journal of Power Electronics and Drive System, vol. 10, no 1,
pp. 381-387, 2019.
[20] Boucetta Abd Alla and Labed Djamel, "Control of power and voltage of solar grid connected," International
Journal of Electrical and Computer Engineering, vol. 6, no 1, pp. 26-33, 2016.
[21] M. Kalantar and S. M. Mousavi G., "Dynamic behavior of a stand-alone hybrid power generation system of wind
turbine, microturbine, solar array and battery storage," Applied Energy, vol. 87, no. 10, pp. 3051-3064, 2010.
[22] S. Marmouh, M. Boutoubat, and L. Mokrani, "Performance and power quality improvement based on DC-bus
voltage regulation of a stand-alone hybrid energy system," Electric Power Systems Research, vol. 163, no. A,
pp. 73-84, 2018.
[23] Y. Sawle, S. C. Gupta, and A. K. Bohre, "Review of hybrid renewable energy systems with comparative analysis of
off-grid hybrid system," Renewable and Sustainable Energy Reviews, vol. 81, no. 2, pp. 2217-2235, 2018.
[24] B. Afif, B. Merabet, A. Benhamou, and A. Chaker, "Standalone hybrid power system using homer software optimal
case sizing of ferraguig (North West of Algeria)," International Journal of Applied Power Engineering, vol. 8,
no. 3, pp. 287-298, 2019.
[25] M. Alramlawi, A. Gabash, E. Mohagheghi, and Pu Li, "Optimal operation of hybrid PV-battery system considering
grid scheduled blackouts and battery lifetime," Solar Energy, vol. 161, pp. 125-137, 2018.
[26] N. Hamrouni, M. Jraidi, A. Dhouib, and A. Cherif, "Design of a command scheme for grid connected PV systems
using classical controllers," Electric Power Systems Research, vol. 143, pp. 503-512, 2017.
[27] J. Jana, H. Saha, and K. D. Bhattacharya, "A review of inverter topologies for single-phase grid-connected
photovoltaic Systems," Renewable and Sustainable Energy Reviews, vol. 72, pp. 1256-1270, 2017.
[28] A. G. Shaik and O. P. Mahela, “Power quality assessment and event detection in hybrid power system," Electric
Power Systems Research, vol. 161, pp. 26-44, 2018.

ISSN: 2252-8792
Int J Appl Power Eng, Vol. 9, No. 3, December 2020: 223 – 244
244
BIOGRAPHIES OF AUTHORS
Mr. K. M. Venkatachalam, received Bachelor Degree in Electrical and Electronics Engineering
from Anna University, Chennai in the year 2014. He has received Master Degree in Electrical
Drives and Control from Pondicherry University, Puducherry in the year 2016. Currently he is
pursuing Ph.D. degree in Electrical Engineering, Anna University, Chennai. His area of research
is renewable energy, inverters and micro-grid. He published 10 papers in conferences and
journals.
Dr. V. Saravanan working as Professor in Department of Electrical & Electronics Engineering,
Arunai Engineering College, Tiruvannamalai, Tamilnadu, India and has been carrying out R & D
activities sponsored by various agencies of Government of India in the area of renewable energy
systems. He has teaching/industrial experience of about 15 years. His research interests include
Solar Photovoltaic Power Systems, Distributed Renewable Energy Systems, Smart/Microgrid.
He published more than 70 research papers in National, International Journals, Conferences, and
Exhibitions.