Mechanical characteristics and flexural behaviour of fibre ...

Delalic-Gurda, B., et al.: Performance Characteristics of Mechanical Draft Cooling ... THERMAL SCIENCE: Year 2020, Vol. 24, No. 2B, pp. 1423-1433 1423
PERFORMANCE CHARACTERISTICS OF MECHANICAL DRAFT COOLING TOWERS IN THERMAL POWER PLANT
Berina DELALIC-GURDA *, Dzana KADRIC, and Nijaz DELALIC
Faculty of Mechanical Engineering Sarajevo, Sarajevo, Bosnia and HerzegovinaOriginal scientific paper
https://doi.org/10.2298/TSCI181101303D
Generated power of thermal power plant is closely related to efficient work of cooling towers, via condenser pressure affected by output temperature of cooling water. Performance characteristics of cooling system can be rated via several pa-rameters such as: thermal effectiveness, Merkel number, number of transfer units, and overall heat and mass transfer coefficient. Results gathered during acceptance test of cooling system of thermal power plant Kakanj (unit 7) which consists of 12 wet counterflow induced draft cooling towers, are used to evaluate its most important performance characteristics. It is shown that some tower performance characteristic vary during the day more than others due to their dependence on climatic parameters, particularly air wet bulb temperature. Different approaches and methods (analytical and empirical) for evaluation of tower performance are discussed in order to define the most appropriate performance characteristic and calculation method which can be used for establishing the optimal working mode of analysed cooling system. Key words: cooling tower, performance characteristics, climate parameters,
optimal operation mode
Introduction
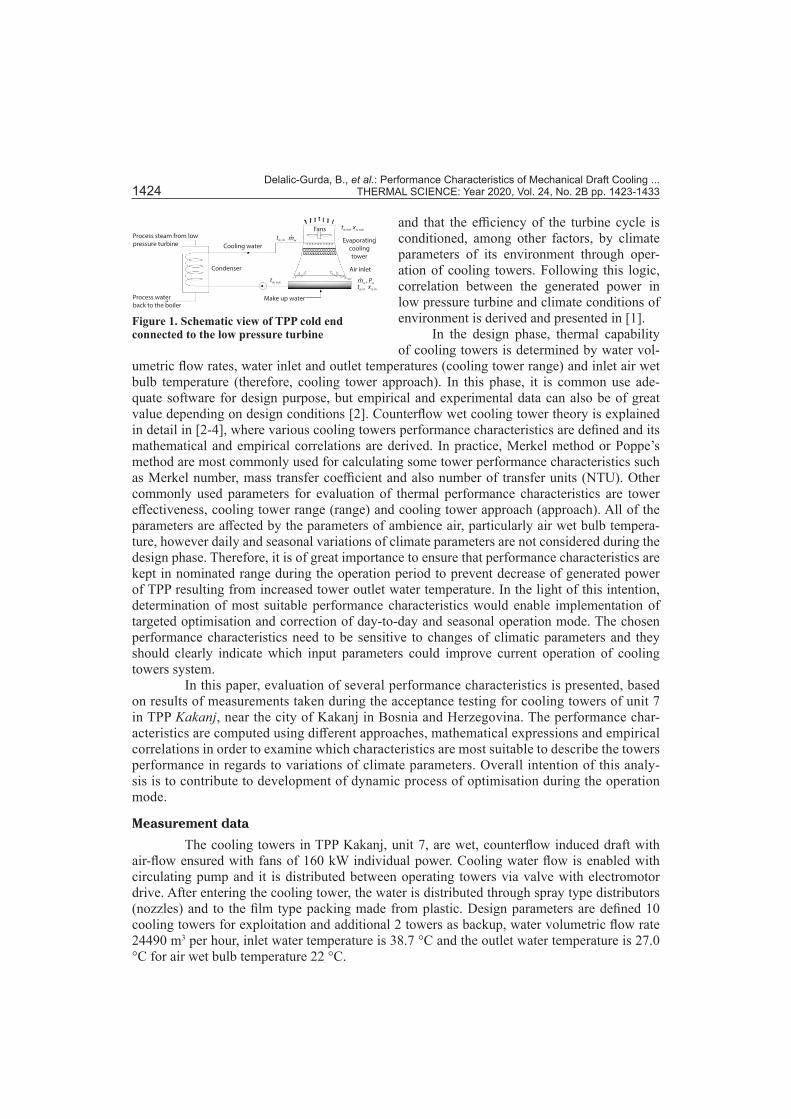
Cooling tower is a type of heat exchanger often used to dissipate heat in Clausius-Ran-kine cycle and it serves as so called cold end of thermal power plant (TPP) system. Turbine exhaust steam condenses in a condenser while heat is removed via cooling water as heat trans-fer medium, which circulates through the condenser tubes. Heated water from the condenser’s tubes is afterwards pumped to the cooling tower, where, in case of commonly used wet cooling towers, it is cooled by simultaneous heat and mass transfer to the ambience air. Re-cooled water then returns to the condenser for new cycle. In the system of counterflow cooling towers, simul-taneous heat and mass transfer takes place while cooling water flows downwards over the tower film-type fill and it is exposed to the atmospheric air that flows upwards. During the process, water temperature decreases while air temperature and humidity increases. Figure 1 provides schematic view of cold end system and its connection the steam turbine.
Theoretically, tower output water temperature can be lowered near to the air wet bulb temperature which indicates that the process is in great manner affected by the environmental climate conditions. On the other hand, temperature of the circulating water at the outlet of cool-ing tower is of the great importance since it directly affects the condenser pressure of turbine exhaust steam in the condenser. Further on, the condenser pressure determines the enthalpy drop of steam in the low pressure turbine and finally it conditions the generated power. This implicates that lower tower output water temperature can increase generated power in turbine
* Corresponding author, e-mail: [email protected]
Delalic-Gurda, B., et al.: Performance Characteristics of Mechanical Draft Cooling ... 1424 THERMAL SCIENCE: Year 2020, Vol. 24, No. 2B pp. 1423-1433
and that the efficiency of the turbine cycle is conditioned, among other factors, by climate parameters of its environment through oper-ation of cooling towers. Following this logic, correlation between the generated power in low pressure turbine and climate conditions of environment is derived and presented in [1].
In the design phase, thermal capability of cooling towers is determined by water vol-
umetric flow rates, water inlet and outlet temperatures (cooling tower range) and inlet air wet bulb temperature (therefore, cooling tower approach). In this phase, it is common use ade-quate software for design purpose, but empirical and experimental data can also be of great value depending on design conditions [2]. Counterflow wet cooling tower theory is explained in detail in [2-4], where various cooling towers performance characteristics are defined and its mathematical and empirical correlations are derived. In practice, Merkel method or Poppe’s method are most commonly used for calculating some tower performance characteristics such as Merkel number, mass transfer coefficient and also number of transfer units (NTU). Other commonly used parameters for evaluation of thermal performance characteristics are tower effectiveness, cooling tower range (range) and cooling tower approach (approach). All of the parameters are affected by the parameters of ambience air, particularly air wet bulb tempera-ture, however daily and seasonal variations of climate parameters are not considered during the design phase. Therefore, it is of great importance to ensure that performance characteristics are kept in nominated range during the operation period to prevent decrease of generated power of TPP resulting from increased tower outlet water temperature. In the light of this intention, determination of most suitable performance characteristics would enable implementation of targeted optimisation and correction of day-to-day and seasonal operation mode. The chosen performance characteristics need to be sensitive to changes of climatic parameters and they should clearly indicate which input parameters could improve current operation of cooling towers system.
In this paper, evaluation of several performance characteristics is presented, based on results of measurements taken during the acceptance testing for cooling towers of unit 7 in TPP Kakanj, near the city of Kakanj in Bosnia and Herzegovina. The performance char-acteristics are computed using different approaches, mathematical expressions and empirical correlations in order to examine which characteristics are most suitable to describe the towers performance in regards to variations of climate parameters. Overall intention of this analy-sis is to contribute to development of dynamic process of optimisation during the operation mode.
Measurement data
The cooling towers in TPP Kakanj, unit 7, are wet, counterflow induced draft with air-flow ensured with fans of 160 kW individual power. Cooling water flow is enabled with circulating pump and it is distributed between operating towers via valve with electromotor drive. After entering the cooling tower, the water is distributed through spray type distributors (nozzles) and to the film type packing made from plastic. Design parameters are defined 10 cooling towers for exploitation and additional 2 towers as backup, water volumetric flow rate 24490 m3 per hour, inlet water temperature is 38.7 °C and the outlet water temperature is 27.0 °C for air wet bulb temperature 22 °C.
Process steam from low
pressure turbine
Process water
back to the boiler
Cooling water
Condenser
tw, in mw
tw, out
ta, outFans
Evaporating
cooling
tower
m , Pa a
ta, in
Air inlet
xa, out
xa, in
Make up water
Figure 1. Schematic view of TPP cold end connected to the low pressure turbine

Delalic-Gurda, B., et al.: Performance Characteristics of Mechanical Draft Cooling ... THERMAL SCIENCE: Year 2020, Vol. 24, No. 2B, pp. 1423-1433 1425
Acceptance testing of cooling towers was performed in line with DIN 1947. During the testing, 10 out of 12 towers were in operation. Testing includes measurements of parameters during the period of 24 hours in summer time. Most important measured values are shown in tab. 1.
Table 1. List and ranges of most important measured parameters during acceptance testing
Measured parameters Unit Range of values Average valuesAir dry bulb temperature
at the tower inlet, ta,in[°C] 14.6 – 30.3 –
Air wet bulb temperature at the tower inlet, tawb,in
[°C] 14.1 – 22.9 –
Water inlet temperature, tw,in [°C] 34.4 – 38.9 36.68Water outlet temperature, tw,out [°C] 23.1 – 27.5 25.51
Water mass-flow rate at the tower inlet, ṁw
[kgs–1] 6452.0 -6954.4 6498.8
It is evident that the parameters during the testing period were in expected ranges of values and not exceeding design conditions, but the summer period can easily create unfavour-able conditions for tower operation. With the increase of dry bulb temperature, sensible heat flow can even change its direction and the ambient air will start heating the water. On the other hand, the web bulb temperature in mild continental climate such as in location of Kakanj, will always provide potential for evaporative cooling and will keep the overall heat flow in direction from water to the air. This situation is considered very rare, appearing during 0.1-0.2% of tower operation time [5] and in case of TPP it will not endanger the electricity generation process itself but only decrease generated power for short period.
Calculation model for heat transfer rates and discussion of results
Total heat rate exchanged in the cooling tower, QCT [kW], is calculated using overall energy balance of water:
( )w w,in w,outCTQ m i i= − (1)
Total heat rate is equal to the energy that the air stream takes over which results in the air enthalpy change. Also, energy balance for air enables another representation of heat transfer rate that consists of two-components – sensible and evaporative heat, [6]:
( ) ( ) ( )a a,out a,in a,lat a,sens a a,out a,in a ,a a,out a,inCT fg pQ m i i Q Q m x x i m c t t= − = + = − + − (2)
where ifg [Jkg–1] is latent heat of vaporization. It is visible that the latent heat rate is driven by change of humidity ratio of dry air, while sensible heat transfer rate is driven by change of air dry bulb temperature. The humidity ratio (mass ratio of water vapor to dry air) xa [kgwkga
–1] is calculated [2]:
sata
a sat0.622
px
p pϕϕ
=−
(3)
where psat is saturation pressure for current dry bulb air temperature and φ [–] is the relative humidity of the air.

Delalic-Gurda, B., et al.: Performance Characteristics of Mechanical Draft Cooling ... 1426 THERMAL SCIENCE: Year 2020, Vol. 24, No. 2B pp. 1423-1433
Enthalpy of the moisture-air mixture in [kJkg–1] is calculated [2]:
( )a a a a0.24 (595 0.46 4186.8)i t x t= + + (4)
Calculation procedure was using the eq. (1) total heat transfer rate is calculated. Rela-tive humidity of air at inlet of cooling tower is determined using the values of measured meteo-rological data at the location of power plant which include ambient air temperature, ambient air pressure and wet bulb temperature, and results are given in fig. 2. Air-flow rate is determined using the fan performance curve. From the total heat transfer rate and eq. (2), outlet air enthalpy is calculated. Using the Mollier diagram, dry bulb air outlet temperature is determined using enthalpy and assumption that air is at saturated state. Sensitive and latent heat transfer rates are calculated using the eq. (2).
100
90
80
70
60
50
40
30
20
Re
lati
ve
hu
mid
ity,
%φ
[]
Tem
pe
ratu
re,
Ct
[]
o
35
30
25
20
15
100 5 10 15 20
Time h, [ ours]τ
Dry bulb temperatureWet b lb temperatureuRelative humidity
0 5 10 15 20
Time h, [ ours]τ
He
at
rate
,M
WQ
[]
350
300
250
200
150
100
50
0
Total heat rate
Evaporate heat rate
Sensible heat rate
Figure 2. Ambient air parameters at the location of TPP Kakanj
Figure 3. Heat rates transferred during the 24 hours period in TPP Kakanj cooling towers
From fig. 2. it is evident how much the climatic parameters of air vary only within one full day, as well as particular heat rates are shown in fig. 3. It is visible that evaporative heat rate is dominant over the sensible heat rate, ranging from 71-94 % in total heat rates exchange. These results show that the total heat rate is mainly controlled by the evaporative (latent) heat rate which is in line with results presented in [5]. However, the relation between the evaporative heat rate and the climate conditions of environment are not as straight forward as in case of sen-sible heat rate which can easily be related to dry bulb air temperature, as shown in fig. 2 and 3.
In order to explain more clearly the dependence of evaporative heat rate from ambient conditions, the climate parameters of air entering and exiting the tower are shown in Mollier’s
Dry
bu
lb t
em
pe
ratu
re,
C[
]o
40
35
30
25
20
15
10
5
00 2 4 6 8 10 12 14 16 18 20 22 24 26 28 30 32 34 36 38 40
Mass ratio of water vapour kg kg, [ ]w a
–1
Δxmin, time 03:00
Δxmax, time :0018
Figure 4. Mollier diagram of moist air with air states at inlet (dot) and outlet (triangle) of tower

Delalic-Gurda, B., et al.: Performance Characteristics of Mechanical Draft Cooling ... THERMAL SCIENCE: Year 2020, Vol. 24, No. 2B, pp. 1423-1433 1427
i-x. As noticeable in fig. 4, dots on left hand side represent the conditions of inlet air at the en-trance of tower and the triangles on right hand side show the state of air at the exit of the tower. For analysing and predicting the evaporative heat rate tendency, most important parameter is the potential of air for receiving the moisture from the cooling water within the tower. This potential is a difference of humidity ratio of air between tower exit and entrance, Δx. For bigger relative humidity difference Δx, the ambient air can receive more moisture and the evaporative heat rate in the tower is higher. If the results from figs. 2-4 are compared, it can easily be noticed that the lowest relative humidity and highest dry bulb temperature are around 18 hours, fig. 2, which enables highest increase of humidity ratio, Δxmax, and the highest evaporative heat rate, fig. 3. Lowest potential for evaporative heat rate is found to be around 3 hours, when the dry bulb temperature is low and the relative humidity is highest.
For validation, values of calculated evaporated water mass-flow rate are compared with measured values of makeup water mass. The makeup water needs to cover three types of water losses from the cooling tower: – evaporation loss, – drift loss and – slug loss.
Water loss due to its evaporation in cooling towers is dominant and continuously present. If the air at outlet of tower is supersaturated, it contains water droplets which represent drift loss. Finally, due to the constant loss of clear water through evaporation, the density of water flowing through towers increases and a certain amount of water needs to be replaced by fresh makeup water. This is done periodically by discharging some water from cooling tower basin. During the performed acceptance testing of cooling towers, there was no discharge of water from the basin. Therefore, the slug loss was not taken into consideration for validation of results based on mentioned measurements.
Evaporated water is calculated:
( )evap a a,out a,inm m x x= − (5)
Values of calculated evaporated water and measured make up water mass differ around 4% in average, which is satisfactory since makeup water covers also drift losses. Air velocity expressed for fill cross-flow area was 3.09 m/s, which is smaller than limited values of 3.5 m/s therefore, upward transfer of water through the fill and resulting drift losses are mini-mized [4] and kept under guaranteed values smaller than 2%. Moreover, the makeup water con-trol system is rather sluggish in its response to tower water losses and it also creates deviation in comparison of values between the two water mass-flow rates.
Performance characteristics of examined cooling towers
In this chapter, several characteristic parameters for evaluation of cooling tower per-formance have been calculated on the basis of data collected at examined cooling towers system in TPP Kakanj. The results have been discussed with the aim to find parameters which could be useful for managing the tower system operation in most effective way.
Thermal effectiveness, cooling range and approach
Thermal effectiveness of cooling tower is expressed as a ratio of cooling range and sum of cooling range and approach. It can also be represented as actual temperature difference

Delalic-Gurda, B., et al.: Performance Characteristics of Mechanical Draft Cooling ... 1428 THERMAL SCIENCE: Year 2020, Vol. 24, No. 2B pp. 1423-1433
of cooling water as it flows through the cooling tower and a maximum theoretical temperature difference [7, 8]:
w,in w,out
w,in awb,in
RangeRange+Approach
t tt t
ε−
= =−
(6)
Cooling range of cooling tower is defined as difference between water inlet and outlet: Range = (tw,in – tw, out) and approach as difference: Approach = (tw,out – tawb,in). In tower operation both values must be greater than zero, while smaller value of approach represents better cooling tower operation and consequently it can improve the efficiency of the TPP system. However, there is a limitation for this parameter on the side of condenser. Namely, the exhaust steam from low pressure turbine needs to be fully transformed to liquid state in condenser, see fig. 1, but it must not be cooled too much below the condensation temperature. If the climate conditions of environment are suitable for high cooling performance of towers, like in winter time, there is a risk for subcooling the condensate which will then require more heat energy in boiler during the next cycle. Therefore, thermal effectiveness should be improved but under the condition keep the outlet water temperature at the desired value.
Thermal effectiveness is a function of inlet air wet bulb temperature and it increases while inlet air temperature increases. This is shown on tested cooling tower and it is visible in fig. 5 by comparing the values of tower thermal effec-tiveness and values of air wet bulb temperature. Based on design inlet values for cooling towers in TPP (unit 7), value of thermal effectiveness is 0.7 (that is 70%), while range is 11.7 °C and approach is 5 °C. Also, it is clear from eq. (6) that tower approach plays important role and that while
tower outlet water temperature gets closer to the air wet bulb temperature (therefore, air humidity increases) effectiveness of tower increases. In usual operation mode, approach has a value approxi-mately 5-6 °C [5] or even smaller [9]. Effectiveness of tested tower was in the range from 52-72%, which shows a great dependence of outlet air properties and it also indicates lack of control system sensitive to variations of climate parameters of environment. Results from [7] show lower tower effectiveness values than examined towers in Kakanj, as a result of smaller air wet bulb temperature.
Another formulation of tower effectiveness is given in [10] as:
w,in w,out*
w,out awb,in1t t
t tεεε
−= =
− −(7)
Values of ε* are calculated for conditions in TPP Kakanj which correspond to the ones presented in [10], Case 4. Corresponding measurements are taken in 10 hours: inlet water temperature 36.6 °C, outlet water temperature 26.4 °C and ambient air wet bulb temperature 20.9 ºC. Calculated thermal effectiveness is 1.88 which show good compatibility with results of Mansour (Case 4; thermal effectiveness 1.62), which means that this method could be im-plemented for examining the effectiveness of TPP Kakanj cooling tower. However, thermal effectiveness calculated as given in eq. (7) is rather developed to be used in relation with other important tower performance characteristic (NTU) and this will be further investigated in fol-lowing chapters.
Figure 5. Tower effectivencess and inlet air wet bulb temperature
Tow
er
eff
ect
ive
ne
ss,
%ε
[]
75
70
65
60
55
50
45
40
35
30
40
35
30
25
20
15
10
Tem
pe
ratu
re,
Cτ
[]
o
Time, hτ [ ours]0.00 5.00 10.00 15.00 20.00
Effectiveness by eq. (6)
Effectiveness by [6]
Effectiveness by designed data
Air wet bulb temperature by [6]
Air wet bulb temperature

Delalic-Gurda, B., et al.: Performance Characteristics of Mechanical Draft Cooling ... THERMAL SCIENCE: Year 2020, Vol. 24, No. 2B, pp. 1423-1433 1429
It is shown that effectiveness of cooling of the water film depends on the ratio of water to air mass-flow rates and decreases while ratio increase [8]. During the measurement, ratio of mass-flow rates was preserved in approximately constant values around 1.064, so this effect was not tested. However, the control of cooling system in towers can be done most easily through modification of air mass-flow rate. Therefore, investigation of this dependence would be of great value for the process of optimisation.
Merkel’s number
In practice, most frequently used theory for performance evaluation of cooling towers is Merkel method, which enables calculation of several performance characteristics: Merkel number, overall heat and mass transfer or NTU.
The Merkel number by Merkel’s methods is presented in the following equation [2]:
w wMe d fi fid h a Lh A KaV
Lm G = = =
(8)
where hd or K [kgm–2s–1] is the mass transfer coefficient, A [m2] – the heat and mass transfer surface area, afi or a [m2m-3] – the transfer surface area per unit volume V, Ġw [kgm–2s–1] – the mass velocity expressed as a ratio of water mass-flow rate and fill cross-flow area, Lf i [m] – the fill height and ṁw or L [kgs–1] – the water mass-flow rate. Most important assumptions of the model are that Lewis factor is equal to unity, air at the output of the cooling tower is saturated, air at the inlet of tower fill is of the same parameters as the air at the inlet of tower (ambient conditions) and evaporated water mass-flow rate is neglected in the energy balance. For known values of water and air temperatures at the inlet and outlet, Merkel number could be calculated using following equation, shown also as an algebraic equation, using the four-point Chebyshev integration technique [11]:
w,out
w,in
4w w
w w,in w,outa,sat a a,sat a1
d 1Me 0.25 ( )( )
tp
pjjt
c tc t t
i i i i=
= = −− −∑∫ (9)
where, ia,sat [kJkg–1] is enthalpy of saturated air calculated for the water temperature of adjacent film of water and ia [kJkg-1] is enthalpy of bulk moisture-air mixture.
Empirical relation for the Merkel number is given as a function of mass velocities of air and water and inlet film temperature in [4] as:
0.711a
0.657 0.476w w,in
Me 4.299fi
GL G t
=
(10)
Another empirical relation for Merkel number is given in [12] and it connects values of Merkel number and ratio of air to water mass-flow rates using empirical coefficients. The coefficients m and n are related to the condition of tower packing, i. e. their values decrease when the packing is damaged or fouled. For newly designed or reconstructed cooling towers the coefficients with values of m = 1.82 and n = 0.61 are given and they fit to the conditions of acceptance testing. The relation from [12] then becomes:
0.61a a
w wMe 1.82
nG G
mG G
= =
(11)

Delalic-Gurda, B., et al.: Performance Characteristics of Mechanical Draft Cooling ... 1430 THERMAL SCIENCE: Year 2020, Vol. 24, No. 2B pp. 1423-1433
Values of Merkel number are calculated for 24 hours period using the eqs. (9)-(11). The results are shown in fig. 6 and it is visible that the values according to Merkel equations vary in time as a function of outlet air parameters change while empirical equations give approximately uniform values of Merkel number. This can be easily explained by taking into consideration the fact that the water and air mass-flow rates, which are main variables in eqs. (10) and (11) were kept constant during the 24 hours measure-ments. It also implicates that the two empirical
correlations are very little sensitive to change of climate conditions of environment and are not suitable for analysis of tower performance in regards to daily and seasonal changes of ambient air. However, average values of Merkel number using both approaches do not differ significantly so all three equation are suitable for calculation of Merkel number for validation of results. It is important to notice that Merkel number according to eq. (9) takes into consideration both latent and sensible heat transfer via the difference of air enthalpy ia,sat – ia. It also reflects changes of ambient air and its curve follows the trends of thermal effectiveness and air wet bulb temperature shown in fig. 5. This indicates that Merkel number could be valuable parameter to follow and possibly to try to keep within defined interval of values for ensuring optimal operating of cooling towers. However, it is important to note that Merkel’s theory assumes same conditions of air at the inlet of tower fill as at the inlet of cooling tower (the ambient conditions) which can create non-negligible departure of results from real performance values. Some researches state that up to 10-20% of total heat exchange in cooling tower can happen inside of the rain zone (area under the packing in towers) [2]. This means that the parameters of air can significantly change during its flow through the rain zone before entering the tower packing. Further investigation should take into consideration the heat transfer process in the rain zone and its effect on the Merkel’s number. Moreover, the variations of air and mass-flow rate would be of interest because these parameters are the ones to be used for controlling the process.
Number of transfer units
Value of NTU is number of times that the average enthalpy potential (ia,sat – ia) goes into the temperature change of water, Δtw, so it is a measure of the difficulty of the task [9]. Ac-cording to ε-NTU approach [2], relation between NTU and Merkel number is given:
a
w wwa
a
w
dd
Me valid for conditions wheredd
p
pw
im ct
NTU mict
= >
(12)
Another formulation of NTU parameter is derived in [10] and it provides relation between tower effectiveness ε* given by eq. (7) and NTU:
*
* w
a0.5
NTUmCro Crom
ε
ε
=
−
+
(13)
Figure 6. Merkel number
Me
rke
l nu
mb
er
–[]
2.0
1.8
1.6
41.
1.2
1.0
0.6
0.60.00 5.00 10.00 15.00 20.00
Time h, [ ours]τ
Merkel number q. 9)e (
Merkel number q. 10)e (
Merkel number q. 11)e (

Delalic-Gurda, B., et al.: Performance Characteristics of Mechanical Draft Cooling ... THERMAL SCIENCE: Year 2020, Vol. 24, No. 2B, pp. 1423-1433 1431
where Cro is a function of interval of values for tawb,in and tw,in. This approach as presented in [10] enables calculation of water outlet temperature once when NTU and ṁw/ṁa are known. Therefore, it is very convenient for optimisation of working mode of cooling towers.
The values of ε* for selected time period of measurements show very good agreement with results of other authors. Therefore, value of ε* is computed for 24 hours measurements period and it is used to calculate the values of NTU according to eq. (13). The value of Cro was chosen for the interval offered in [10], which was the closest to the measured values of tempera-ture ranging from 16-36 °C, and it equals to 1.136. Values of calculated tower effectiveness ε* and NTU for 24 hours measurements are given in fig. 7, together with NTU values calculated according to eq. (12). It is visible that they three have similar trends with maximum values which are reached at 12:00 hours.
When compared to trends of climate pa-rameters of air shown in fig. 2, the relation be-tween the NTU and wet bulb air temperature can be clearly noticed proving good sensitivity of this methods to the climate conditions of environment. Moreover, these methods also take into consider-ation the air and water mass-flow rates which play important role in developing control methods. Therefore, the NTU could be a good choice as a parameter to follow and try to keep in predefined interval by adjusting other parameters when pos-sible. Which method should be used for NTU cal-culation will probably depend on the availability of measurement data in particular case but also, very importantly, on the fact which parameters of tower can be adjusted intentionally (e. g. air mass-flow rate by changing the speed of fans).
Overall mass transfer coefficient
For known Merkel number, using eq. (8) it is possible to calculate mass transfer co-efficient as:
wMedfi fiaG
hL
=
(14)
Fill material installed in examined tower is PVC CHSB 21, with ratio afi = Ap/Vc = 148 m2/m3 where Ap is the total area of the surface presented by the bed of packing and Vc is the column volume.
Empirical equation for overall heat and mass transfer coefficient, applicable for inlet water temperature ranging from 38-46 ºC according to [5]:
( )a am n
xa A w qβ ρ= (15)
where βxa [kgm–3h–1] is the overall heat and mass transfer coefficient, wa [ms-1] – the air velocity calculated for the total section of the empty unit, q [m3m–2h–1] – the specific water volumetric flow rate. Empirical coefficients are determined experimentally and have values of A = 635, m = 053, and n = 0.39 [8].
Another empirical equation for counterflow cooling towers is presented in [4], for computing mass transfer coefficient per meter of fill height hdm where values of all coefficients (ad, bda, and bdb) are determined experimentally for different types of fill. When using values of
0.00 5.00 10.00 15.00 20.00
Tow
er
eff
ec
tiv
en
ess
,%
ε[
]
4
3.6
3.2
2.8
2.4
2
1.6
1.2
0.8
2
1.6
1.2
0.8
0.4
NT
U,
–[]
Effectiveness q. 7)– e (
NTU q. 13)– e (
NTU q. 14)– e (
Figure 7. Tower effectiveness ε* and NTU

Delalic-Gurda, B., et al.: Performance Characteristics of Mechanical Draft Cooling ... 1432 THERMAL SCIENCE: Year 2020, Vol. 24, No. 2B pp. 1423-1433
coefficients for packing Brentwood Ind Accu-Pac CF 1900 [2] which is similar to packing used in the cooling towers in TPP Kakanj, unit 7, the empirical equation is given:
w0
7
w
.
a
.620 21.664
da
db
bdm fi b w
d fi fia
h GG
a Ga L L
G G
−−
= =
(16)
Measurements data are used to compute overall mass transfer coefficient by all three presented equations and the results for 24 hours period are given in fig. 8. It is evident that all three equations resulted in relatively uniform values of overall mass transfer coefficient over the 24 hours period which indicates low sensitivity to variations of climate parameters of environ-ment. Slightly more changes are provided by eq. (14) and it could be explained by the influence of Merkel number which is strongly dependent on climate conditions as shown before, eq. (9) and fig. 6. The two empirical equations, eqs. (15) and (16), are mostly determined by air and water
mass-flow rates so the only alteration in values happened around 10 hours when the water mass-flow rate was slightly increased unexpectedly due to the current plant operation conditions. It is however curious that the results of eq. (15) differ significantly from other two sets of results and it could indicate that the correlation is not suitable for the examined towers or the measure-ment conditions. Further investigation should be performed for eqs. (14) and (16) by testing other values of empirical coefficients and by introduc-ing variations in air and/or mass-flow rates.
Conclusions
This paper presented values of different performance characteristics obtained by ap-plying mathematical and empirical correlations on data from 24 hours measurement at oper-ating cooling system of TPP Kakanj, unit 7. Main focus of the paper was to analyse different parameters in regards to their sensitivity to climate parameters of environment which dictates condition for the performance of towers and of overall cooling system.
After performing necessary calculation and creating visual representation of results, it has been concluded that three parameters are sensitive to climate conditions of environment: thermal effectiveness, Merkel number (according to Merkel’s methods) and NTU. On the other hand, Merkel number and NTU could be easily linked to the air and water mass-flow rates which are the controlled variables for cooling tower operation. Overall mass transfer coefficient by all three presented equations showed relatively low sensitivity to variations of climate parameters of environment. Further investigation with expanded measurements of varying air or mass-flow rates could provide better insights in possibilities for improving tower operation control.
Limitations of this analysis are mainly related to the ones met during the measure-ments. The air and water mass-flow rates were kept constant during the measurements which made it difficult to analyse the behaviour of some parameters. Further on, air mass-flow rate for this research has been calculated based on the characteristics of fans which may not be as precise as needed. Also, water flow rate for one cooling tower is calculated by assuming even distribution of total water flow rate from condenser over the 10 operating cooling towers. Other limitations are related to model assumptions such as the one suggesting total saturations of air at tower outlet which can have great influence on fan speed control and its electricity consumption as well as on the drift water losses in tower.
Figure 8. Mass transfer coefficient for 24 hours period of measurements
0.00 5.00 10.00 15.00 20.00
Mas
s tr
ansf
er c
oeffi
cien
t,kg
sm
[]
–1–2
0.300
0.250
0.200
0.150
0.100
0.050
0.000
Mass transfer coefficient q. (15)e
Mass transfer coefficient q. (16)e
Mass transfer coefficient q. (17)e

Delalic-Gurda, B., et al.: Performance Characteristics of Mechanical Draft Cooling ... THERMAL SCIENCE: Year 2020, Vol. 24, No. 2B, pp. 1423-1433 1433
Finally, expanded measurements in others seasons would provide complete picture of the tower behaviour. It would be important to learn about the performance of the towers during autumn regime when the relative air humidity can be high which decreases the evaporative heat rate in towers. Data about cooling system behaviour over the year would be of great value in designing detailed model sensitive to climate parameters of environment and providing good guidance on how to maintain optimal values of tower performance characteristics.
Nomenclature
afi – transfer surface area per unit of volume, [m2m–3]
cp – specific heat at constant pressure, [Jkg–1K–1]
Ġ – mass velocity, [kgm–2s–1]hd – mass transfer coefficient, [kgm–2s–1]i – enthalpy, [Jkg–1K–1]Lfi – fill height, [m]ṁ – mass-flow rate, [kgs–1]Me – Merkel number (= hdA/ṁ), [–]NTU – Number of transfer units, [–]p – pressure, [Pa or mbar]Q – heat rate, [W]t – temperature, [°C]x – humidity ration, [kgwkga
–1]
Greek symbol
ε – effectiveness
Subscripts
a – air (or dry bulb)awb – air wet bulbevap – evaporatedin – inletlat – latentmp – makeup waterout – outlet sat – saturatedsens – sebsiblew – water
References[1] Delalic, N., et al., Determination of Key Parameters in the Process of Optimization of the Thermal Power
Plant Cooling System, Proceedings, International Conference on Innovative Technologies (IN-TECH), Ljubljana, Slovenia, 2017, pp. 173-176
[2] Kroger, D. G., Air-Cooled Heat Exchangers and Cooling Towers, PennWell Corporation, Tulsa, Okl., USA, 2004
[3] Singham, J. R., Cooling Towers, in: Heat Exchanger Design Handbook (Ed. E. U. Schlunder et.al.), Hemisphere Publishing Corporation, Washington, USA, 1983, Chapter 3.12, pp. 3.12.1-1 - 3.12.6-4
[4] Erens, P. J., Specific Heat Transfer Devices – N4 Cooling towers, in: VDA Heat Atlas, Springer, Berlin, Heidelberg, Germany, 2010, Chapter 3.12, pp. 1485-1500
[5] Khan, J. R. et.al., Performance Characteristics of Counter Flow Wet Cooling Towers, Energy Conversion and Management, 44 (2003), 13, pp. 2073-2091
[6] Li, Y., et. al., The Study on the Evaporation Cooling Efficiency and Effectiveness of Cooling, Energy Conversion and Management, 52 (2011), 1, pp. 53-59
[7] Fisenko, S. P., Petruchik, A. I., Toward to the Control System of Mechanical Draft Cooling Tower of Film Type, International Journal of Heat and Mass Transfer, 48 (2005), 1, pp. 31-35
[8] Lakovic, M., et. al., Industrial Cooling Tower Design and Operation in the Moderate-Continental Climate Conditions, Thermal Science, 20 (2016), Suppl. 5, pp. S1203-S1214
[9] ***, Cooling Towers, in: ASHRAE Handbook – HVAC Systems and Equipment, ASHRAE Inc., Atlanta, Geo., USA, 2016
[10] Mansour, M. K., Hassab, M. A., Innovative Correlation for Calculating Thermal Performance of Counter-flow Wet-Cooling Tower, Energy, 74 (2014), Sept., pp. 855-862
[11] Kadric, Dz., et. al., Heat and Mass Transfer Coefficients in Cooling Towers, Proceedings, 8th World Con-ference on Experimental Heat Transfer, Fluid Mechanics, and Thermodynamics, Lisbon, Portugal, 2013, Paper No. 117
[12] Zemanek, I., Heat and Mass Transfer in Cooling Tower Packing, National Research Institute for Machine Design, Prague, Czech Republic, 1989
Paper submitted: November 1, 2018Paper revised: June 24, 2019Paper accepted: July 1, 2019
© 2020 Society of Thermal Engineers of SerbiaPublished by the Vinča Institute of Nuclear Sciences, Belgrade, Serbia.
This is an open access article distributed under the CC BY-NC-ND 4.0 terms and conditions