The Characteristics of Innovative, Mechanical Productsppmdlab/files/innovative.products.pdf · The...
38
The Characteristics of Innovative, Mechanical Products * Matthew N. Saunders 1 and Carolyn C. Seepersad 2 Product, Process and Materials Design Laboratory Department of Mechanical Engineering The University of Texas Austin, Texas Katja Hölttä-Otto 3 Department of Mechanical Engineering The University of Massachusetts Dartmouth, Massachusetts ABSTRACT Many new products fail upon introduction to the marketplace, but a few products are exceptionally successful, earning innovation awards and other benchmarks of success. To better understand the features of those innovative products, 197 award-winning products are analyzed to identify the characteristics that distinguish those products from the competition. For the analysis, a set of product-level characteristics are identified and organized into categories, which included functionality, architecture, external interactions, user interactions, and cost. Based on their innovation award citations, the products are analyzed with respect to the set of characteristics, and results are tabulated. Several award-winning products are also compared to competitive products on the shelves of major retail stores. On average, award-winning products display multiple characteristics of innovation. Overall, a vast majority (more than two-thirds) of the award-winning products exhibit enhanced user interactions, with a similar percentage displaying enhanced external interactions, compared with approximately one-third of products * This is a revised version of Paper Number DETC2009 -87382, published in the ASME IDETC Design Theory and Methodology Conference. 1 Email: [email protected] 2 Corresponding Author. Email: [email protected] . Phone: (512) 471-1985 3 [email protected]
Transcript of The Characteristics of Innovative, Mechanical Productsppmdlab/files/innovative.products.pdf · The...
The Characteristics of Innovative, Mechanical Products*
Matthew N. Saunders1 and Carolyn C. Seepersad
2
Product, Process and Materials Design Laboratory
Department of Mechanical Engineering
The University of Texas
Austin, Texas
Katja Hölttä-Otto3
Department of Mechanical Engineering
The University of Massachusetts
Dartmouth, Massachusetts
ABSTRACT
Many new products fail upon introduction to the marketplace, but a few products are
exceptionally successful, earning innovation awards and other benchmarks of success. To better
understand the features of those innovative products, 197 award-winning products are analyzed
to identify the characteristics that distinguish those products from the competition. For the
analysis, a set of product-level characteristics are identified and organized into categories, which
included functionality, architecture, external interactions, user interactions, and cost. Based on
their innovation award citations, the products are analyzed with respect to the set of
characteristics, and results are tabulated. Several award-winning products are also compared to
competitive products on the shelves of major retail stores. On average, award-winning products
display multiple characteristics of innovation. Overall, a vast majority (more than two-thirds) of
the award-winning products exhibit enhanced user interactions, with a similar percentage
displaying enhanced external interactions, compared with approximately one-third of products
* This is a revised version of Paper Number DETC2009 -87382, published in the ASME IDETC Design Theory and
Methodology Conference. 1 Email: [email protected]
2 Corresponding Author. Email: [email protected]. Phone: (512) 471-1985
2
offering an additional function and approximately half displaying innovative architectures. The
award-winning products also exhibit an average of approximately two more characteristics than
their competitors on retail shelves, along with significantly higher rates of innovative
architecture, external interactions, and user interactions. The analysis concludes with a
discussion of the implications of these findings for engineering design methods.
1 INTRODUCTION
On average, approximately half of new product development projects are successful [1].
A large number of products fail upon introduction to the marketplace, with the failure rate of
new products varying from about 30% to 90% depending on the novelty of the market, the
product category, and the industry [2-4]. In contrast, a small fraction of new products are very
successful and conquer the competition with significantly larger market shares, greater profit
margins, or better brand recognition.
Successful products are typically described as products that satisfy customer needs in
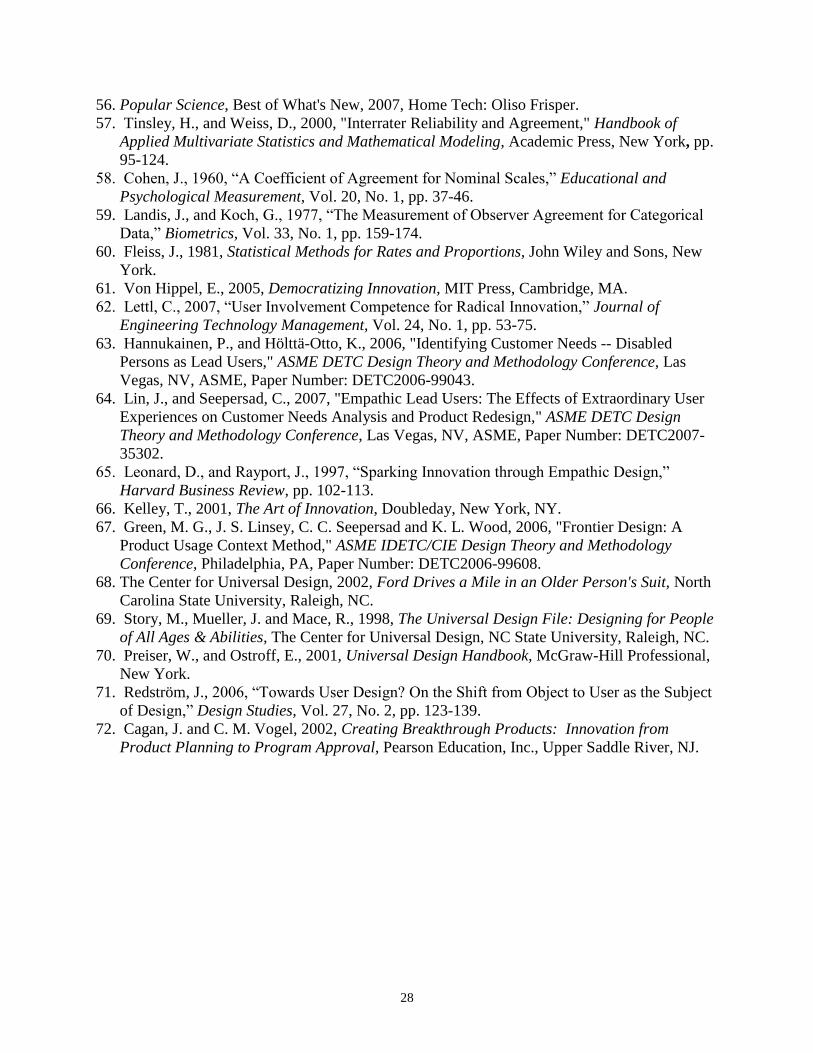
particularly innovative or unexpected ways. From the perspective of the Kano diagram [5] in
Figure 1, successful products delight customers. In a Kano diagram, standard ―must-have‖
features are so common that customers are disappointed unless they are implemented expertly.
Baseline features satisfy customers with their presence, and the level of satisfaction typically
depends on the degree of functionality. The most successful products, on the other hand, tend to
incorporate features that delight the customer, by performing beyond his or her expectations.
Since the delightful features exceed the customer’s expectations, it is unusual for a customer to
articulate these needs in a typical interview or survey.
3
[INSERT FIGURE 1 [5]]
The development of a new product typically starts with identifying customer needs.
Unfortunately, the typical needs articulated by a customer fall under the ―baseline‖ or ―must-
have‖ needs in the Kano diagram, and fulfilling these needs is not enough to create an innovative
product. How could one create a ―delight‖?
In this paper, a set of innovative products is identified from major innovation award
lists and analyzed with respect to a set of product-level characteristics. The focus is specifically
on product-level characteristics that describe observable features of a product itself, such as
functionality and architecture, rather than enterprise- or market-level characteristics, such as
profit or market share. The objective of this paper is to investigate whether specific
characteristics are more prevalent in award-winning products, relative to their competitors, and
to identify any trends that could be important for engineering innovation.
2 LITERATURE REVIEW
Numerous underlying factors can influence the success of a product. Cooper [6]
classified these factors into the following categories: market, synergy of product and firm’s
skills, characteristics of the product venture, execution of development, the product itself, and
information found during development. Within these categories, 18 dimensions of success were
identified from related literature. The same list has been modified and supported by numerous
researchers [7-10], and similar lists have been suggested by additional studies [11-14]. Despite
the fact that different categories may be more or less applicable to different markets and cultures
4
[6,7,10,15], there seems to be general agreement that factors ranging from the market to the firm
to the product itself affect product success.
With the abundance of factors influencing product success, it is difficult to draw a linear
relationship between technical innovation and product success, but the majority of research
suggests that innovation and competitive advantage are leading factors in product success [6-
8,10,16,14]. For the sake of this study, an innovative product is defined as a product that
changes or has the potential to change the nature of the marketplace by satisfying a new (or
latent) customer need or by satisfying customer needs in a significantly new way. In contrast, a
breakthrough product is defined as an innovative product that has already experienced
commercial success in the context of numerous market and business influences.
While numerous factors influence the success of a product, a product’s level of
innovation is affected most directly at the product design stage. Designers are currently told to
innovate, but few tools are provided to help a designer maximize the likelihood of product
success. Should the designer add an additional function, reduce product size, make the product
easier to use, or pursue other options? What are the characteristics of innovative products? The
dilemma begins with the difficulty of gathering customer needs to create innovative products.
Several sources suggest that the creation of highly innovative or breakthrough products cannot
be done with traditional customer needs analysis because the needs are latent, or not yet
articulated [17,18,12,19,20]. Some customer analysis tools, such as voice of the customer (VOC)
[21] and the lead user method [17], claim to result in more successful products than other
methods; however, product success is far from guaranteed. In some instances, engineers are
tasked with incorporating design requirements forced upon the product from large retailers just
5
to get the product on the shelf [22]. These tradeoffs in a design not only hinder potential
innovation, but also may lead to decreased commercial success [23].
The difficulty of creating innovative products is further exacerbated by apparent
differences in customer evaluation and acceptance of innovative products based on their
similarity to related products [18,24]. The more successful products seem to be difficult for
customers to categorize because they do not fit neatly into preexisting product categories.
Customers spend more time analyzing innovative products, and cannot make quick decisions
based on previous experiences. Customers’ evaluations of innovative products often demonstrate
lack of familiarity, irrationality, user-product interaction problems, uncertainty, and fixation on
seemingly trivial details of the product [25]. These non-functional concerns are important to
customers’ purchasing decisions, but they are difficult for engineers to evaluate in the early
stages of development because they require research into potential consumer behavior and
responses to the design [26]. Furthermore, several studies support that product development and
management differ greatly for different levels of innovation [27-30,16,31,32].
It is not only challenging to extract useful information from customers, but it is also
difficult to characterize the appropriate target level of innovation. In a comparison of innovation
factors cited in the literature, Garcia and Calantone [33] identified more than 15 constructs of
innovation with 51 attributes. They merged existing terminology and distinguished incremental,
really new, and radical forms of innovation to clarify and unify the theories of innovation.
Incremental innovation is the classical approach of utilizing customer needs analysis to create
slight generational improvements to an existing product. Radical innovations cause disruption of
the marketplace by introducing a breakthrough technology. Really new innovation can be any
combination of factors between incremental and radical. These classifications are supported with
6
s-curves [34,35], in which products experience slow evolution in their initial development,
followed by an accelerated series of improvements, only to level off into a final period of slow
development. In this way, the evolution of a product follows an ―S‖ shaped pattern of
improvement on a plot of quality or functionality over time. Discontinuities in improvement, or
jumps, create new curves of higher quality. Garcia and Calantone [33] suggested that the market
of a product also follows an s-curve and that radical innovation is defined by causing jumps on
both a product’s technology and market curves. Really new innovation is characterized by a
jump in either curve, but not both. Incremental innovation is classified as movement along
existing curves. Innovation should therefore be viewed as a relative property as suggested by
Dewar and Dutton [36] because it is inherently based on the degree to which one product
distinguishes itself from preceding and competing products. Based on these classifications, the
literature suggests that radical innovation is rare and occurs in less than 20% of innovations,
while incremental innovation is much more widespread [33].
Despite all of this research on innovation, engineering design tools provide very little
guidance on the product-level characteristics of innovative products. Available product attribute
checklists, including categories for decomposing product specifications and checklists for
embodying concepts [37-39], do not directly encourage innovation for the sake of potential
market success. These lists are normally used throughout the design process to ensure that all
aspects of a product’s development cycle are considered, but they do not provide guidance for
competitive advantage or innovation. While the majority of the characteristics of innovation
developed in this study correlate with items on these lists (e.g., function, layout, energy,
ergonomics, and costs), their importance is lost with the inclusion of so many other engineering
factors of product design (e.g., production, quality control, assembly, transport, and scheduling)
7
in the lists. They do not help differentiate and distinguish one concept from another at the state of
ideation, which is a promising time to evaluate concepts for potential innovation and success
according to Goldberg et al. [13]. A few design tools are available for this critical early stage of
development. The creation of a project mission statement [39], for example, encourages
identification of potential areas of innovation at the beginning of a design project, but no
guidelines are provided to examine potential areas thoroughly. Also, there are many creativity
and brainstorming tools that help create as many ideas as possible. Examples include 6-3-5
[40,38], C-sketch [41], TRIZ [42], Design by Analogy[43], Design Through Transformation
[44], and Biomimetic Concept Generation [45]. Similarly, there are numerous tools for
selecting the concept that best meets customer requirements (e.g., [46-48]). Interestingly,
however, Cooper [1] finds that many concept selection methods are designed to select mediocre
concepts, because the methods do not use ―product superiority‖ as a criterion and therefore do
not lead to breakthrough products. Additionally, benchmarking the competition [39,49] is an
important part of the House of Quality [21] for comparing a product to leading competitors and
connecting customer needs with engineering specifications; however, this tool, as well as
adaptations of it [50], may suffer from the challenges of extracting customer needs effectively
and moving beyond incremental innovation.
The aforementioned tools, from customer needs analysis to the House of Quality, are
available to all designers, but somehow only a fraction of products can truly claim to be
breakthrough products. What is it that makes a product stand out from the competition? It has
been shown that factors such as development of a clear product strategy and willingness to take
risks [1] contribute to good business performance from the management point of view, but what
about the engineering design process? It would be helpful to document the types of product-
8
level characteristics typically embodied by innovative products, so that those criteria can be used
to drive the design process and evaluate resulting designs.
3 RESEARCH METHODOLOGY
A research methodology was developed to establish a set of product-level characteristics of
innovative products and to use those characteristics for analyzing trends among award-winning,
innovative products. The research proceeded in a series of four steps: (1) developing a
comprehensive list of product-level characteristics of innovation, (2) selecting innovative
products to be analyzed, (3) analyzing the products with respect to the characteristics identified
in the first step, and (4) comparing a subset of the award-winning products to non-award-
winning competitors available in major retail stores. A subsection is devoted to describing each
of the steps.
3.1 Developing a Set of Product-Level Characteristics of Innovation
The goal of this step was to compile a set of product-level characteristics that describe
innovative products. Product-level characteristics are those that describe observable features of
the product itself, such as architecture or functionality, rather than enterprise- or market-level
characteristics such as market share or profitability. The product-level characteristics are
selected to be domain-independent, comprehensive, and mutually independent. A domain-
independent characteristic can be used to describe various types of products, rather than a
specific product (e.g., material flow versus miles per gallon). The characteristics in a mutually
independent set should not overlap; in other words, it should be possible to identify a product
that exhibits one specific characteristic without exhibiting the remaining characteristics. A
9
comprehensive set of characteristics should be sufficient for describing any innovation in the
domain of interest. The mechanical domain, including mechanical, electro-mechanical, and
thermo-mechanical products, was the focus of this study; innovations that are purely chemical,
electrical, or materials-related, without a mechanical component, were not considered in the
study.
With these requirements in mind, the characteristics of innovative products were
compiled by reviewing published award citations of award-winning, innovative products
(selected according to the procedure described in Section 3.2), along with relevant design
methodology tools and terminology. While reviewing each product, the researchers asked,
―What features made the product more innovative than competing products at the time of its
release?‖ The review was conducted from the perspective of the customer, rather than the
manufacturer or the designer. For example, customers cited a product’s compact size as
innovative, rather than the advances in material processing and manufacturing that enabled it;
therefore, improved size was identified as a potential characteristic of innovative products.
Characteristics were added to the set as necessary to accurately describe the differences between
products. The set was refined for comprehensiveness, mutual independence, and domain-
independence. For validation purposes, characteristics were developed independently by two of
the authors and then critically evaluated and merged into a unified set. The names and definitions
of several characteristics were informed by standard terminology from functional modeling and
product architecture literature (cf. [51-53]). Also, the final set was compared with other lists of
10
product criteria, such as the requirements list checklist provided by Pahl and Beitz [52] to verify
its completeness. 4
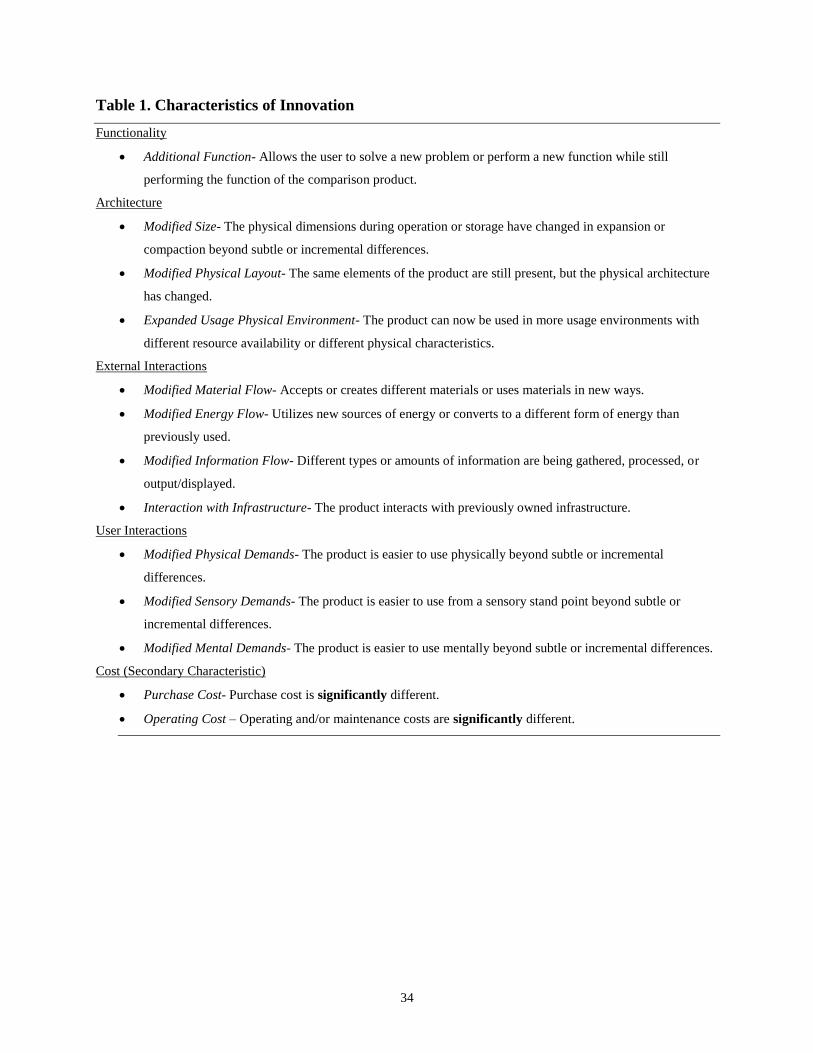
As shown in Table 1, five major categories of innovation were identified: functionality,
architecture, external interactions, user interactions, and cost. The first category is used to
evaluate whether the breakthrough product offers a significant new function, relative to
competitive products. The second category is used to evaluate whether there are any architectural
innovations (related to size, layout, or usage context) in the breakthrough products that are not
generally found in competitive products. The external interactions category addresses modified
flows of material, energy, or information into or out of a functional model [1] of the product. A
modification includes a change in the type of flow (e.g., electrical energy replaced by solar
energy in a solar-powered device) or in the magnitude of the flow (e.g., a more fuel-efficient
vehicle). The external interactions category also includes product interactions with pre-existing
infrastructure, such as data formats, standardized connectors, or other types of pre-existing
hardware, software, services, or networks. The user interactions category is used to evaluate
whether the innovative products are more user-friendly than competitive products. For example,
the physical demands characteristic refers to innovations that make the product easier to use
under various physical conditions, including permanent or temporary physical disabilities. The
sensory demands characteristic includes innovations that enhance ease of use for sensory-
impaired persons or persons with temporary sensory impairment (e.g., a cell phone user at a loud
concert). The modified cognitive demand characteristic refers to innovations that make it easier
to understand a product, including its assembly, operation, and/or inputs/outputs. Finally, cost is
4 It should be emphasized that these characteristics were compiled by the authors, based on a careful review of the
design methodology literature and award-winning innovative products. Accordingly, they do not necessarily match
all of the judging criteria for the innovation awards cited in this paper.
11
included as a secondary characteristic that sometimes accompanies other characteristics (e.g., a
change in design enables both modified material flows and reduced operating costs).
[INSERT TABLE 1]
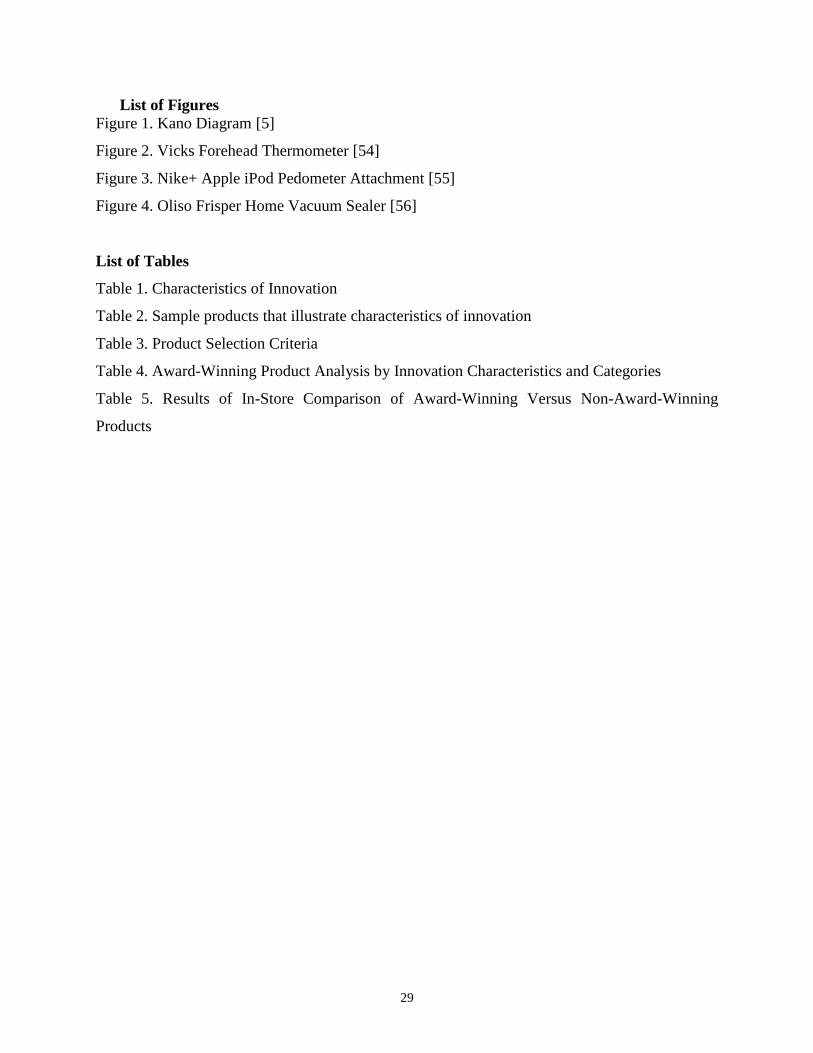
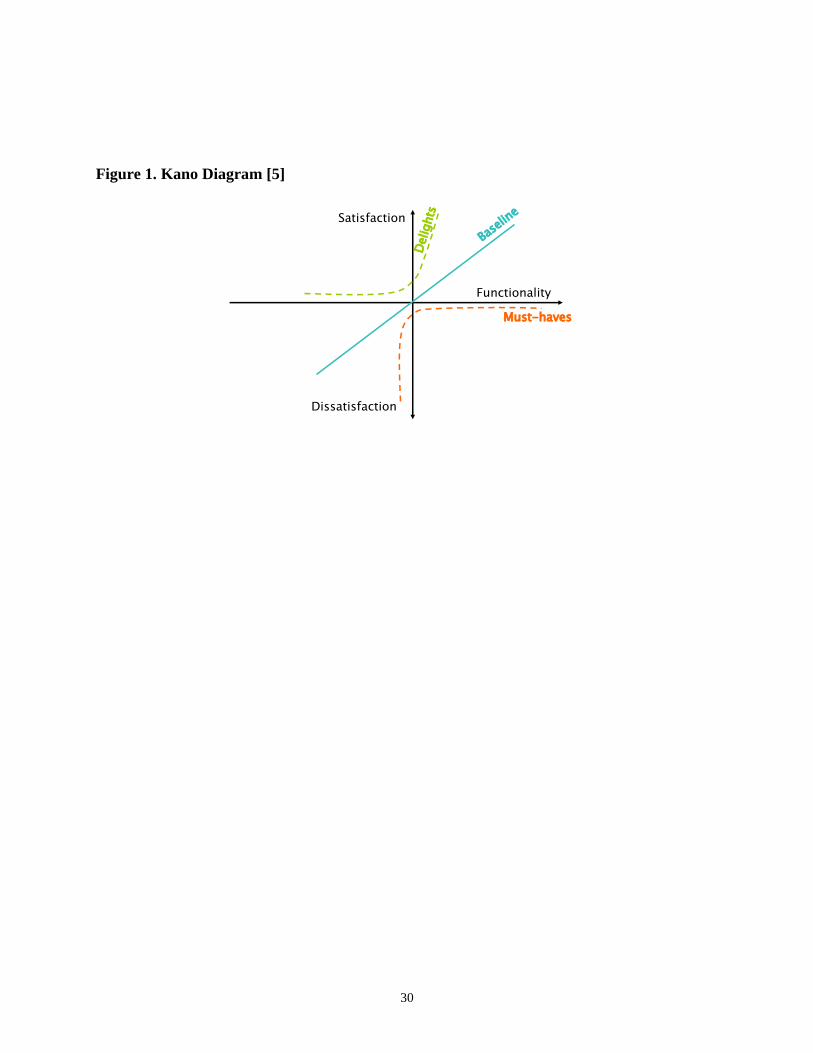
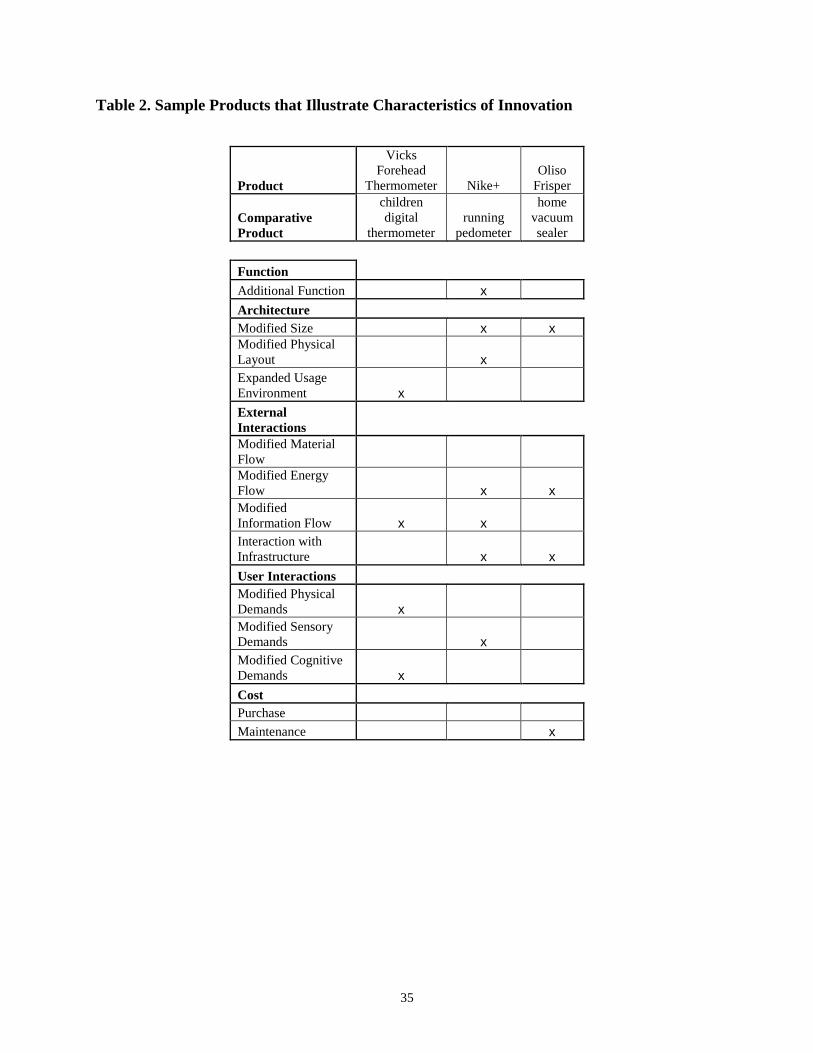
The sample products in Table 2 illustrate several of the innovation characteristics. The
Vicks Forehead Thermometer, illustrated in Figure 2, is a thermometer designed to eliminate the
difficulty of taking a child’s temperature by accurately measuring temperature from the forehead
rather than the standard mouth, ear, rectal, or armpit methods. It also displays a background color
based on the grade of the fever, ranging from green for no fever to red for high fever. Relative to
competing, home-use thermometers, the color-coded display increases the amount of information
displayed, as recorded in the ―Modified Information Flow‖ column of Table 2. It also makes it
easier for the user to determine if a fever exists without having to memorize appropriate
temperature ranges, as classified by the ―Modified Cognitive Demands‖ column in Table 2. The
thermometer also embodies ―Modified Physical Demands‖ because it is physically easier to
measure a child’s temperature on the forehead, relative to other locations.
[INSERT TABLE 2]
[INSERT FIGURE 2 [54]]
[INSERT FIGURE 3 [55]]
12
The Nike+ is a jogging pedometer attachment for Apple iPod digital music players. A
small piezoelectric measuring unit placed in or on a jogger’s shoe collects pace data, and
communicates it wirelessly to an iPod attachment, which broadcasts current and average workout
pace through the iPod headphones. When connected to a computer, the device sends data from
previous workouts to an online account that helps runners track their distance, pace, and running
routes. These features justify marks in the ―Additional Function‖ and ―Modified Information
Flow‖ columns in Table 2. The connection between the pedometer and an iPod and a computer is
an advantageous ―Interaction with Infrastructure.‖ In this sense, the infrastructure interaction is
manifested both geometrically, by attaching to the iPod, and digitally, by exchanging data
between the shoe-based module and the iPod. Compared to competing, one-piece pedometers,
the Nike+ is both smaller in size (―Modified Size‖) and modular (―Modified Physical Layout‖).
The use of a piezoelectric accelerometer in the foot unit is considered a ―Modified Energy Flow‖
because competing products used springs and lever arms at the time of its release, which require
more energy. The Nike+ also provides ―Modified Sensory Demands‖ by allowing users to hear
their data over the iPod headphones in addition to tracking it visually.
[INSERT FIGURE 4 [56]]
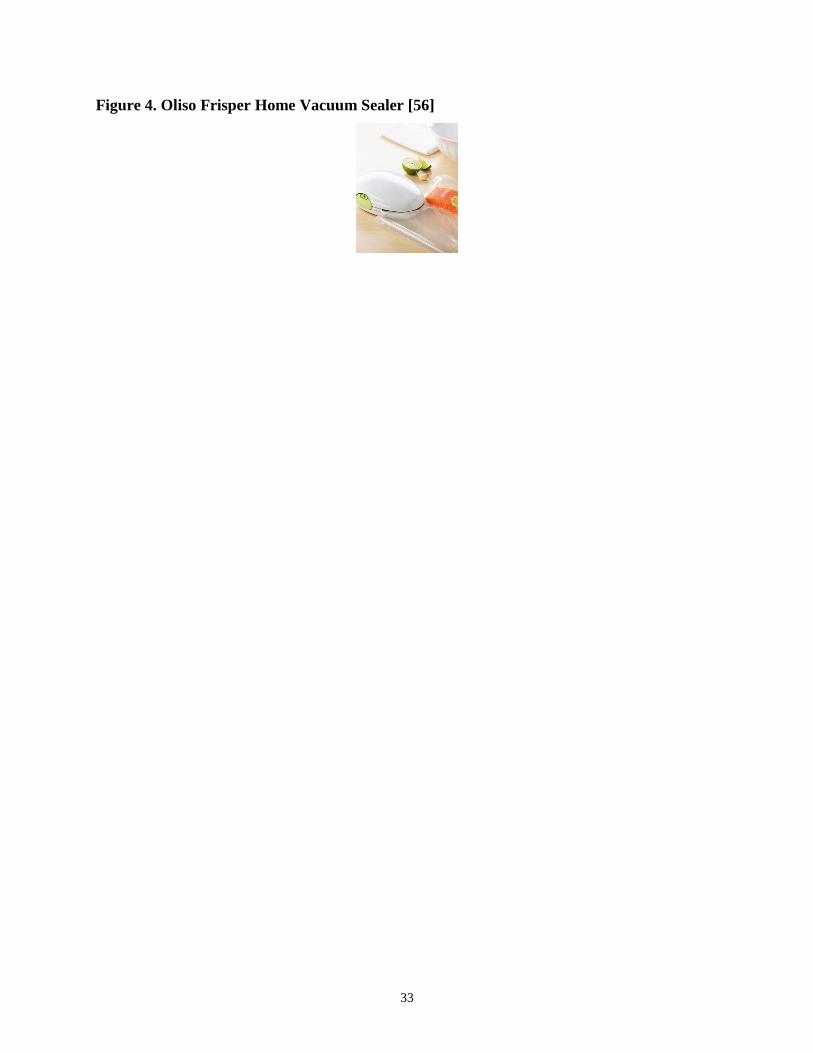
The Oliso Frisper is a home vacuum sealer that punctures a tiny hole in any closable plastic
bag, removes the air, and then heat-seals the hole to ensure a vacuum. As opposed to traditional
vacuum sealers that require specialized bags, this method of sealing allows a variety of bags to
be continually reused, and it is not required to span the full length of the bag to operate properly.
The puncturing and resealing mechanism is considered a ―Modified Energy Flow,‖ and it allows
13
the Oliso Frisper to be considerably more compact than the competition, as recorded in the
―Modified Size‖ column in Table 2. The Oliso Frisper also exhibits improved ―Interaction with
Infrastructure‖ because it can be used with existing household sealable bags. The product also
earns a reduced ―Cost‖ designation because the customer can use any sealable plastic bag (rather
than expensive, specialized bags) and reuse the original bag countless times without loss of
function.
3.2 Selecting Innovative Products for Analysis
Products were selected from three published lists of innovative products: Time
magazine’s Inventions of the Year, Popular Science magazine’s Best of What’s New, and
Industrial Designers Society of America’s (IDSA) International Design Excellence Awards
(IDEA). Products were selected from these lists, rather than personal research by the authors, to
avoid any researcher bias in the selection of products. The lists also provided a wide assortment
of products to support a relatively broad analysis of innovation, with the Time list oriented
towards the general public, the Popular Science list towards scientific-minded readers, and IDEA
towards industrial designers and other professionals.
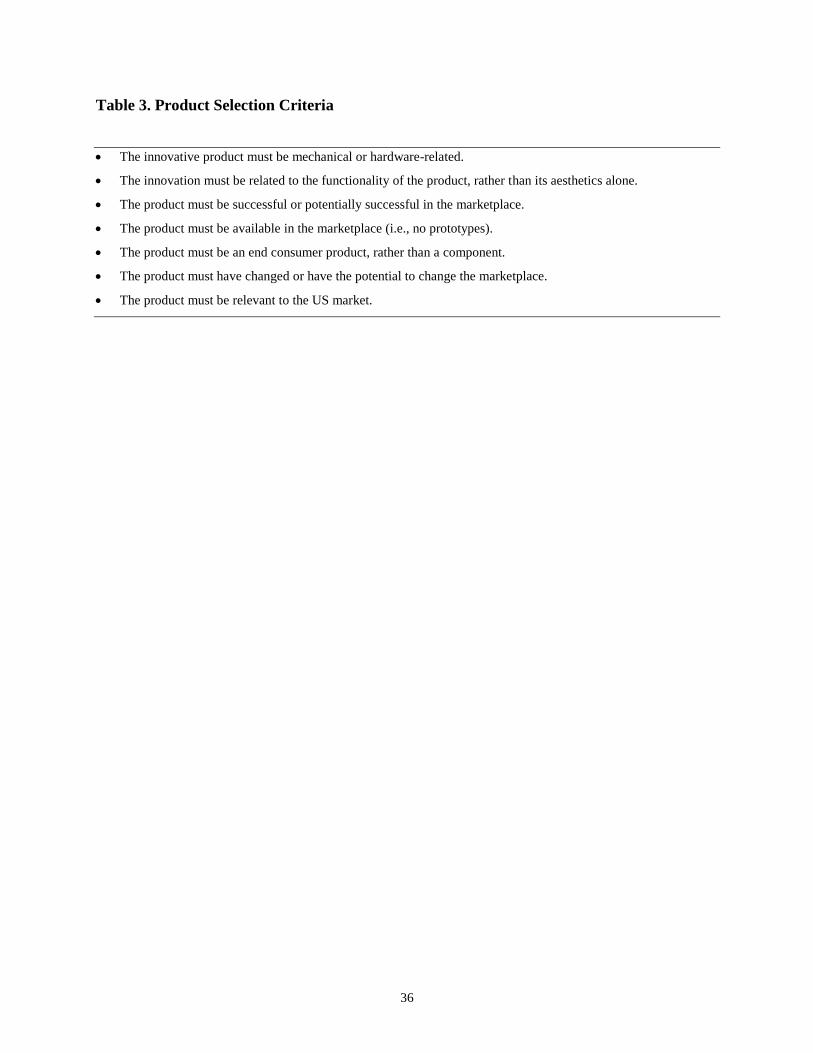
As shown in Table 3, a set of criteria was developed for selecting products from the
published lists. Since the purpose of this study was to investigate mechanical innovation,
products with no significant mechanical component were eliminated (e.g., new software,
materials, or chemicals). The innovation also needed to be function-related, rather than a purely
cosmetic or aesthetic change. This criterion eliminated fashion and most clothing, except for a
few that demonstrated mechanical innovation. Also, products were required to be commercially
available; prototypes were eliminated to ensure design feasibility. Only end consumer products
14
were considered, rather than components (e.g., engines, transmissions). Since products were
evaluated from a consumer perspective, it was difficult to evaluate components that were isolated
from a parent product. The ability of a product to change or potentially change a marketplace
was a significant criterion, which most of the products met by virtue of appearing on one of the
innovation lists. Finally, it was necessary for the product to be relevant to the United States
market, rather than international markets, so that the U.S.-based researchers could evaluate the
product relative to competing products.
[INSERT TABLE 3]
The selection criteria were used to extract products from the published parent lists. After
analyzing the 2003-2008 editions of each parent list, 197 products were obtained. Although
additional products could be obtained from earlier editions of the lists, the product count was
hypothesized to be large enough to provide significant insights on innovation. (This hypothesis is
revisited in Section 4.) Overall 45, 104, and 80 products were extracted from the Time, Popular
Science, and IDSA lists, respectively, with 29 of those products receiving awards from multiple
lists.
3.3 Analyzing Award-Winning Innovative Products
Each of the 197 products was analyzed with respect to the innovation characteristics in
Table 1. A sample analysis is illustrated in Table 2. Analysis was based on the description of
the product in the award list. Each product was analyzed with respect to a comparative product.
The comparative product was selected by identifying the product class that a customer would

15
most likely consider purchasing, instead of the innovative product, at the time the innovation
award was issued. For example, an iPod® would be compared to other digital music players,
rather than a compact disc player.
3.4 Comparing Award-Winning Innovative Products to Non-Award-Winning Competitors
Available in Major Retail Stores
For this analysis, the 2007 and 2008 editions of the award lists were analyzed to identify
the subset of products that were available on the in-store shelves of major national or regional
retail stores, including Target, Best Buy, Frys, Sears, and HEB (a regional Texas grocery chain).
In selecting the comparison products, the objective was to identify the non-award-winning
products that a customer would most likely consider purchasing instead of the award-winning
product. To provide a standardized means of selecting non-award-winning products that offered
a fair and challenging comparison to the award-winning products, a set of selection criteria were
devised. First, the authors considered only products on the same in-store retail shelves as the
award-winning product; product offerings from other retailers, including on-line retailers, were
excluded from consideration. Second, each comparison product was required to exhibit similar
basic functionality and similar levels of innovation characteristics as the award-winning product,
relative to the most basic products on the shelf. For example, the Vicks Forehead Thermometer,
described in Section 3.1 and Figure 2, was compared to several non-award-winning baby
thermometers on the shelves of its retail store. All of the comparison products offered similar
basic functionality of measuring and displaying the body temperature of a child, but they also
offered noticeable enhancements in functionality, architecture, or user or external interaction
characteristics, relative to the most basic oral, armpit, ear, or rectal baby thermometers. For
example, one competing product was offered in the form of a pacifier, a modified architectural
16
characteristic (layout), and several products offered color-coded temperature readings, a user-
interaction (modified cognitive demand) and external interaction (modified information flow)
characteristic.
Each award-winning product was analyzed for innovation characteristics by comparing it
to the non-award-winning products in its comparison set. Similarly, each non-award-winning
product was analyzed by comparing it to the award-winning product and to the other non-award-
winning products in the set. Only features that were unique to a specific product earned
innovation characteristics. For example, several baby thermometers offered color-coded
temperatures, including the Vicks Forehead Thermometer, so none of them earned innovation
characteristics for that feature. However, only one product was offered in the form of a pacifier,
a unique architectural feature that earned a "modified layout" characteristic for that non-award-
winning product.
3.5 Analyzing Repeatability
The repeatability of the analysis was assessed with inter-rater agreement, which measures
the degree to which two judges assign the same ratings to each alternative [57]. Specifically,
Cohen’s [58] kappa coefficient, K, and standard percent agreement were used to calculate inter-
rater agreement. Kappa coefficient values range from -1, which represents complete
disagreement, to 0, which represents chance agreement, to 1, which represents perfect
agreement. Generally, inter-rater agreement of 0.40 or less is considered ―poor‖ agreement; 0.4
to 0.75 is considered ―fair to good‖ agreement; and 0.75 and above is considered ―excellent‖
[59,60]. Percent agreement was calculated as the direct proportion of agreements to the total
possible number of agreements. In this evaluation, judges were considered to agree if both
17
indicated that a product satisfied (or did not satisfy) an innovation characteristic. Initially, lists of
approximately 10 sample products were evaluated by two of the authors independently.
Differences were discussed as a means of training the judges and clarifying the definitions of the
characteristics in Table 1. The procedure was repeated until an acceptable level of inter-rater
agreement was achieved for the sample products. Initial inter-rater agreement fell in the 0.65 K,
or 85% agreement, range between authors, but discussion and clarification of the innovation
characteristics and their definitions raised the level to 0.75 K, or 90% agreement, for new
samples of independently analyzed products. Then, 49 products, or 25% of the total number of
products, were analyzed independently by two of the authors. A high inter-rater agreement was
observed in the form of Cohen’s kappa and percent agreement levels of 0.68 and 88%,
respectively, and the two authors differed in their analysis of the number of products in each
innovation category by less than 8%.
4 RESULTS
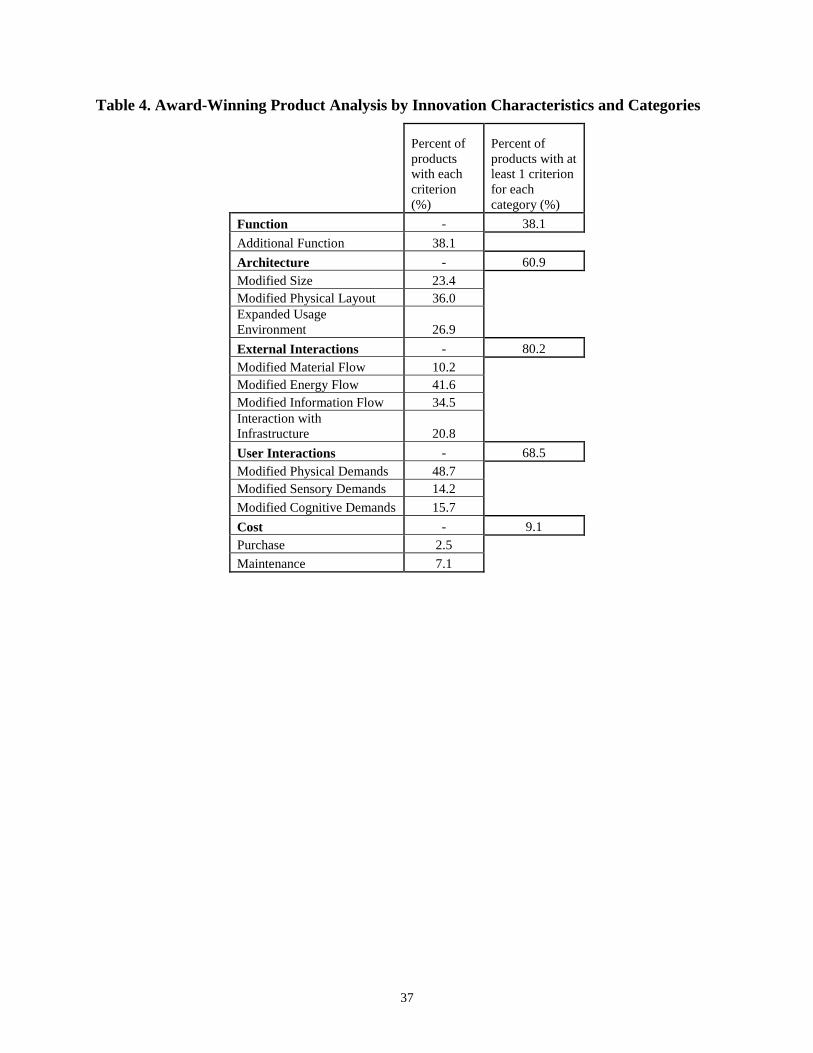
After all of the award-winning products were evaluated, the results were analyzed by
characteristics and overarching categories as shown in Table 4. The first column lists all of the
characteristics of innovation identified in Section 3, with category headings highlighted in bold.
The second column indicates the percentage of products that displayed each characteristic. The
third column indicates the percentage of products with at least one characteristic in each
category. For example, 60.9% of the products exhibited at least one characteristic in the
architecture category.
[INSERT TABLE 4]
18
Modified Physical Demands and Modified Energy Flow were the most frequently
displayed characteristics, with 48.7% and 41.6% of products surveyed, respectively. Similarly,
their parent categories, user interactions and external interactions, were the most frequently cited
categories, with 68.5% and 80.2% of products, respectively, exhibiting at least one characteristic
in each category. In contrast, the percentage of products that granted the user an additional
function was much lower at 38.1%.
There are at least two potential explanations for the differences between categories. First,
the results suggest that mechanical innovation may be more closely associated with a product’s
external and user interactions than with additional functionality alone, at least from the
customer’s perspective. The lower percentage of products with additional functions could also
indicate that additional functions or functional shifts are more difficult to integrate into products.
Finally, the external and user interaction categories are quite broad, as indicated by the number
of characteristics associated with them. The breakdown in characteristics may also encourage
the researcher to think more carefully about these categories and thereby identify more products
that exhibit them.
Overall, neither the average number of characteristics per product nor the distribution of
characteristics across categories differed substantially when compared across award lists or
award list years. For example, the percentage of products with at least one characteristic in each
category, as documented in Table 4, differed by less than 4% per category between the set of
products in the 2003-2005 award lists and those in the 2006-2008 award lists. Also, the IDEA
products were expected to display more user interaction characteristics than the other award lists
based on IDSA’s origins in industrial design, but this hypothesis proved not to be the case. Also,
19
no statistically significant differences were observed between products that appeared on multiple
award lists and those that appeared on only one. These results indicate that the trends in
innovation characteristics were consistent across the award lists and years investigated in this
study.
[INSERT TABLE 5]
On average, award-winning products displayed multiple characteristics of innovation.
The 197 products in the study averaged approximately three innovation characteristics per
product. Approximately 75% of the products exhibited at least 3 innovation characteristics, and
approximately 95% exhibited at least two. These results suggest that innovative products often
exhibit multiple innovative advantages over comparative products.
To further investigate these findings, the authors compared a subset of the award-winning
products to their competitors on the in-store shelves of major retailers, as described in Section
3.4. Specifically, fourteen products from the 2007 and 2008 award lists were found on the in-
store shelves of major retail stores: Logitech MX Air Mouse, Vicks Forehead Thermometer,
Polaroid PoGo Zink Pocket Printer, Eye Fi Wireless SD Card, Yamaha YSP-series Digital Sound
Projector, GearWrench X-beam Wrench, Chef’n PalmPeeler, One Touch Can Opener, Stanley
MaxLife TriPod Flashlight, Belkin Compact Surge Protector, Oliso Frisper, Cub Cadet ZForce
Zero Turn Riding Mower, Oral-B Triumph Smart Series Electric Toothbrush, and the iPhone.
Each product was compared with at least two non-award-winning products, with an average of
approximately four non-award-winning comparison products per award-winning product. Of the
14 products investigated, all but 4 displayed more innovation characteristics than their
20
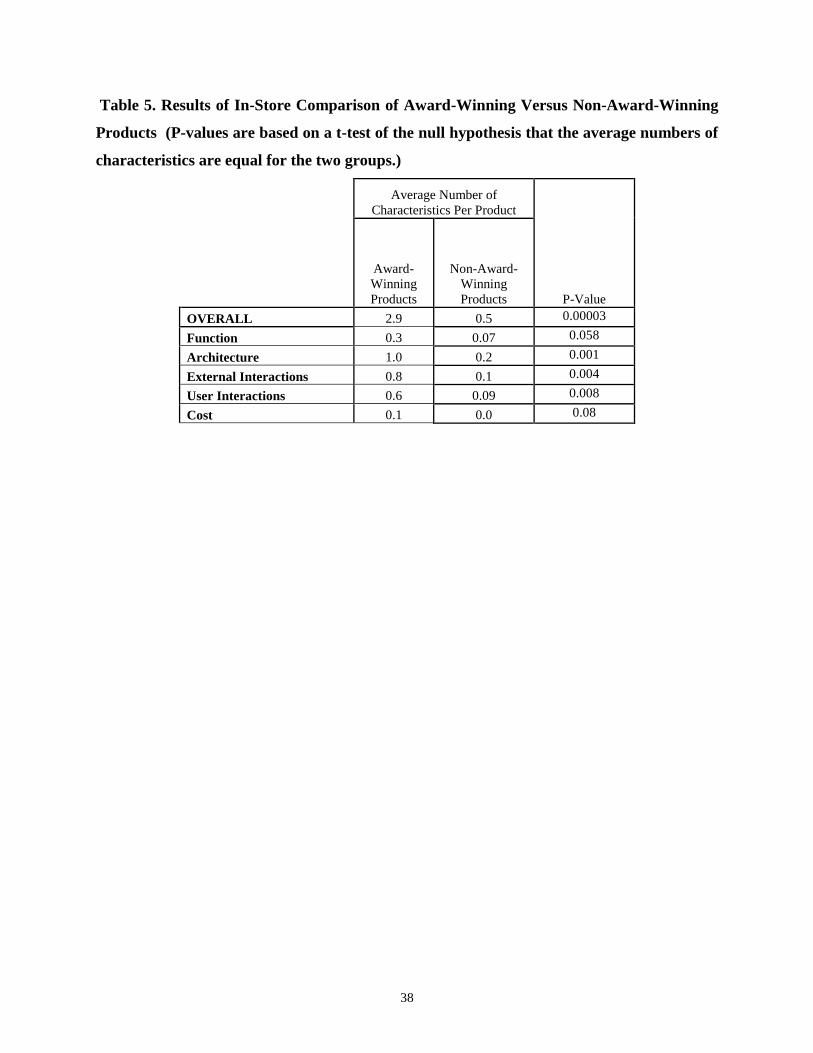
competitors. As shown in Table 5, the award-winning products exhibited an average of 2.9
characteristics per product, compared with 0.5 characteristics per non-award-winning product.
The difference was statistically significant with a p-value of 0.00003, based on a t-test of the null
hypothesis that the average numbers of characteristics were equal for the two groups. The
award-winning products also exhibited a higher average number of characteristics in each
innovation category. As shown in Table 5, the differences between award-winning and non-
award-winning products were statistically significant for all innovation categories at a p-value of
0.1. The architecture and external and user interaction categories were statistically significant
for p-values of 0.05. Those three categories were also the most frequently exhibited categories
in the larger parent study summarized in Table 4.
The significance of these differences between award-winning and non-award-winning
products is remarkable for several reasons. First, it provides evidence that the innovation
characteristics are more prevalent in award-winning products than in their non-award-winning
competitors. This trend suggests that innovators may be wise to focus on multiple
characteristics, when attempting to design innovative products. Second, even though the award-
winning products had been available for two or more years in the marketplace, their competitors
had not yet managed to replicate all of their innovative features. In some cases, such as the
Vicks Forehead Thermometer, a low-cost competitor had already launched a competing product
with identical features, such as color-coding and forehead readings. In most cases, however, the
award-winning product's distinguishing features were still unique on the retailer's shelves. For
example, the Cub Cadet Zero Turn Riding Mower was the only consumer riding lawn mower on
its retailer's shelves that offered a zero turn radius with a standard steering wheel, rather than a
series of levers, resulting in innovation characteristics such as reduced physical and cognitive
21
demands. Third, since each product was compared to an average of four non-award-winning
products, there were ample opportunities for the non-award-winning products to exhibit
distinguishing characteristics, but they did so with a much smaller frequency than the award-
winning products. Often, the award-winning product (or another competing product) already
embodied the non-award-winning products’ advantageous features. For example, the Oliso
Frisper was compared to three products on its retailer’s shelves: the Tilia Foodsaver Freshsaver
Handheld Vacuum System, the Rival Seal-a-Meal, and the Tilia Foodsaver Vacuum Packaging
System. Two of the competing products (the Rival Seal-a-Meal and the Tilia Foodsaver Vacuum
Packaging System) advertised their hands-free, one-touch operation. Since both of those
products (and the Oliso Frisper) offered that feature, none of the products earned a ―modified
physical demand‖ characteristics for that feature because they did not offer an advantage relative
to their competitors. The remaining product (the Tilia Foodsaver Freshsaver Handheld Vacuum
System) cited its handheld size as an advantage relative to the larger systems, but the Oliso
Frisper offered that feature as well. However, all of the vacuum sealing products required
proprietary bags, except the Oliso Frisper, which utilized standard Ziploc bags and earned
―modified cost‖ and ―interacting with infrastructure‖ characteristics for that feature.
5 CLOSURE
An empirical study was conducted of 197 consumer products that received innovation
awards from Time, Popular Science, and the Industrial Design Society of America between 2003
and 2008. Based on their award citations, the products were analyzed with respect to several
innovation criteria in the categories of architecture, external interactions, user interactions,
functionality, and cost. One of the interesting findings of the study was the frequency with
22
which different types of innovations were exhibited. Of the products analyzed in the study,
68.5% and 80.2% exhibited enhanced user and external interactions, respectively, compared to
38.1% with additional functions and 60.9% with innovative architectures. Furthermore, when the
innovation categories were partitioned into more specific characteristics (e.g., the user
interactions category was partitioned into three characteristics: modified physical demands,
modified sensory demands, and modified cognitive demands), the average product exhibited
approximately three characteristics. Of the 197 award-winning products, approximately 75%
exhibited at least 3 different characteristics of innovation and 95% exhibited at least 2. These
results were reinforced by an in-store empirical study in which a subset of the award-winning
products were compared to competing products on the shelves of major retailers. On average,
those award-winning products exhibited 2.9 characteristics per product, a statistically significant
increase over the 0.5 characteristics exhibited, on average, by their competitors. The award-
winning products also exhibited enhanced architecture and external and user interactions at a
significantly greater rate than their competitors.
These findings stress the need for engineering design methodologies that focus on
improving product interactions. Tools are available for considering function, architecture, and
external interactions during the design process. These tools include an abundance of recent
research on functional modeling, product architecture, and green design. While more research
and industrial applications are certainly needed in those areas, there appears to be a significant
gap between current design methodology and the need to incorporate innovative user interaction
features as part of many successful products.
There are several emerging engineering design techniques that focus on customer
interactions with a product, as a source of innovations. For example, Von Hippel and coauthors
23
[17,61,62] conduct customer interviews with lead users—customers who push a product to its
limits, experience needs prior to the general population, and benefit significantly from having
those needs fulfilled. In related work, the authors have developed techniques for helping ordinary
customers serve as lead users by interacting with a product under extreme conditions [63,64].
Other techniques, such as empathic design [65], articulated use [39], bodystorming [66], and
contextual needs analysis [67] are also aimed at helping designers better understand, or even
experience, how customers interact with products. For example, Ford engineers developed a
simulation suit with goggles, ear plugs, thick gloves, and arm and leg weights and motion
restrictors to help their young engineers understand the challenges faced by older drivers [68].
These principles have also been reflected in universal design studies that encourage designers to
target broader sections of the population [69,70]. Based on the results of this study as well as
literature that suggests a design shift towards a product’s interactions [71], it appears that these
types of techniques may become increasingly important. Cagan and Vogel [72], for example,
introduce an integrated new product development approach that focuses specifically on user-
centered design.
In addition to the broad research opportunities motivated by this study, there are several
opportunities for expanding and refining the study itself. First, it could be helpful to further
decompose some of the innovation characteristics to differentiate, for example, between changes
in type and changes in magnitude of energy, material, and information flows. It could also be
helpful to expand the list of characteristics to capture aspects of product value that are broader
than innovation, which was the focus of this study. For example, Cagan and Vogel [72] define a
set of attributes that contribute to the overall value of a product, some of which overlap with the
innovation characteristics defined in this study. For example, ergonomics and impacts, as
24
defined by Cagan and Vogel [72], are reflected in the user interaction and external interaction
characteristics defined in this study. Other attributes, such as quality, clearly contribute to the
long-term value of a product, but they are not included in the innovation characteristics because
they were not highlighted in the innovation award citations from which they were derived.
It would also be interesting to compare the results of this study with a series of customer
interviews probing the reasons for purchasing an innovative product over the competition.
Specifically, it would be informative to poll representative customers for their opinions on the
characteristics of innovative products and to compare the results to the characteristics compiled
by the authors. In addition, it could be very revealing to investigate the designers and design
processes behind award-winning products and specifically to research the factors that drove the
product designers to incorporate specific characteristics in their designs. It would also be
interesting to quantitatively track the market success of the award-winning products in this study,
relative to non-award-winning products, and to link that success to various characteristics of the
market, firm, and product itself.
Finally, the innovation characteristics developed in this study could be adapted as
evaluation tools for analyzing the results of innovation studies. The comparison of award-
winning and non-award-winning products provides evidence that some of the innovation
characteristics are more prevalent in award-winning products. Accordingly, those characteristics
should be useful as tools for predicting whether a product has the potential for innovative
success.
25
ACKNOWLEDGMENTS
The authors would like to acknowledge Dr. Kristin L. Wood of The University of Texas at
Austin for helpful comments on a draft of this paper. The authors would also like to
acknowledge support from the National Science Foundation under Grant No. CMMI-
0825461/0825713. Any opinions, findings and conclusions or recommendations expressed in this
material are those of the authors and do not necessarily reflect the views of the sponsors.
REFERENCES
1. Cooper, R., 2005, Product Leadership, Basic Books, New York.
2. Association of National Advertisers, 1984, Prescription for New Product Success, New York.
3. Lori, D., 2002, ―Learning from Failure: Knowing What Went Wrong in Past Product
Launches Can Be Key to Future Success,‖ Stagnito's New Products Magazine, Vol. 2, No. 3,
pp. 18.
4. Berkowitz, D., Wren, B. and Grant, S., 2007, ―Predicting New Product Success or Failure: A
Comparison of U.S. and U.K. Practices (Report),‖ Journal of Comparative International
Management, (June) 2007.
5. Kano, N., 1984, ―Attractive Quality and Must-Be Quality,‖ The Journal of the Japanese
Society for Quality Control, (April), pp. 39-48.
6. Cooper, R., 1979, ―The Dimensions of Industrial New Product Success and Failure,‖ Journal
of Marketing, Vol. 43, (August), pp. 93-103.
7. Cooper, R., and de Brentani, U., 1991, ―New Industrial Financial Services: What
Distinguishes the Winners,‖ Journal of Product Innovation Management, Vol. 8, No. 2, pp.
75-90.
8. Kleinschmidt, E., and Cooper, R., 1991, ―The Impact of Product Innovation on Performance,‖
Journal of Product Innovation Management, Vol. 8, No. 4, pp. 240-251.
9. Parry, M., and Song, X., 1994, ―Identifying New Product Successes in China,‖ Journal of
Product Innovation Management Science, Vol. 11, No. 1, pp. 15-30.
10. Song, X., and Parry, M., 1994, ―The Dimensions of Industrial New Product Success and
Failure in State Enterprises in the People's Republic of China,‖ Journal of Product
Innovation Management, Vol. 11, No. 2, pp. 105-118.
11. Ali, A., Krapfel, R. and LaBahn, D., 1995, ―Product Innovativeness and Entry Strategy:
Impact on Cycle Time and Break-even Time,‖ Journal of Product Innovation Management,
Vol. 12, No. 1, pp. 54-69.
12. Lynn, G., Morone, J. and Paulson, A., 1996, ―Marketing and Discontinuous Innovation: The
Probe and Learn Process,‖ California Management Review, Vol. 38, No. 3, pp. 8-37.
13. Goldenberg, J., Lehmann, D., and Mazursky, D., 1999, ―The Primacy of the Idea Itself as a
Predictor of New Product Success,‖ Marketing Science Institute Working Paper.
14. Astebro, T., and Michela, J., 2005, ―Predictors of the Survival of Innovations,‖ Journal of
Product Innovation Management, Vol. 22, No. 4, pp. 322-335.
26
15. Mishra, S., Kim, D. and Lee, D., 1996, ―Factors Affecting New Product Success: Cross
Country Comparisons,‖ Journal of Product Innovation Management, Vol. 13, No. 6, pp. 530-
550.
16. Souder, W., and Song, M., 1997, ―Contingent Product Design, and Marketing Strategies
Influencing New Product Success, and Failure in US, and Japanese Electronic Firms,‖
Journal of Product Innovation Management, Vol. 14, No. 1, pp. 21-34.
17. Von Hippel, E., 1986, ―Lead Users: A Source of Novel Product Concepts,‖ Management
Science, Vol. 32, No. 7, pp. 791-805.
18. Deszca, G., Munro, H. and Noori, H., 1991, ―Developing Breakthrough Products:
Challenges and Options for Market Assessment,‖ Journal of Operations Management, Vol.
17, No. 6, pp. 613-630.
19. Colarelli O' Connor, G., 1998, ―Market Learning and Radical Innovation: A Cross Case
Comparison of Eight Radical Innovation Projects,‖ Journal of Product Innovation
Management, Vol. 15, No. 2, pp. 151-166.
20. Song, X., and Parry, M., 1999, ―Challenges of Managing the Development of Breakthrough
Products in Japan,‖ Journal of Operations Management, Vol. 17, No. 6, pp. 665-688.
21. Hauser, J., and Clausing, D., 1988, ―The House of Quality,‖ Harvard Business Review, pp.
63-73.
22. Williams, N., Azarm, S., and Kannan, P., 2008, ―Engineering Product Design Optimization
for Retail Channel Acceptance,‖ Journal of Mechanical Design, Vol. 130, No. 6, pp. 081010.
23. Michalek, J., Ceryan, O., Papalambros, P., and Koren, Y., 2006, ―Balancing Marketing and
Manufacturing Objectives in Product Line Design,‖ Journal of Mechanical Design, Vol. 128,
No. 6, pp. 1196-1204.
24. Olshavsky, R., and Sprend, R., 1996, ―An Exploratory Study of the Innovation Evaluation
Process,‖ Journal of Product Innovation Management, Vol. 13, No. 6, pp. 512-529.
25. Veryzer, R., 1998, ―Key Factors Affecting Customer Evaluation of Discontinuous New
Products,‖ Journal of Product Innovation Management, Vol. 15, No. 2, pp. 136-150.
26. Crilly, N., Moultrie, J., and Clarkson, P., 2009, ―Shaping things: intended consumer
response and the other determinants of product form,‖ Design Studies, Vol. 30, No. 3, pp.
224-254.
27. Lawton, L., and Parasuraman, A., 1980, ―The Impact of the Marketing Concept on New
Product Planning,‖ Journal of Marketing, Vol. 44, No. 1, pp. 19-25.
28. More, R., 1982, ―Risk Factors in Accepted and Rejected New Industrial Products,‖
Industrial Marketing Management, Vol. 11, pp. 9-15.
29. Lee, M., and Na, D., 1994, ―Determinants of Technical Success in Product Development
When Innovative Radicalness is Considered,‖ Journal of Product Innovation Management,
Vol. 11, No. 1, pp. 62-68.
30. Olson, E., Walker, O. and Ruekert, R., 1995, ―Organizing for Effective New Product
Development: the Moderating Role of Product Innovativeness,‖ Journal of Marketing, Vol.
59, No. 1, pp. 48-62.
31. Schmidt, J., and Calantone, R., 1998, ―Are Really New Product Development Projects
Harder to Shut Down?‖ Journal of Product Innovation Management, Vol. 15, No. 2, pp. 111-
123.
32. Song, M., and Montoya-Weiss, M., 1998, ―Critical Development Activities for Really New
Versus Incremental Products,‖ Journal of Product Innovation Management, Vol. 15, No. 2,
pp. 124-135.
27
33. Garcia, R., and Calantone, R., 2002, ―A Critical Look at Technological Innovation Typology
and Innovativeness Terminology: A Literature Review,‖ Journal of Product Innovation
Management, Vol. 19, No. 2, pp. 110-132.
34. Foster, R., 1986, Innovation, the Attacker's Advantage, Summit, New York.
35. Betz, F., 1993, Strategic Technology Management, McGraw-Hill, New York.
36. Dewar, R., and Dutton, J., 1986, ―The Adoption of Radical and Incremental Innovations: An
Empirical Analysis,‖ Management Science, Vol. 32, No. 11, pp. 1422-1433.
37. Franke, H., 1975, ―Methodische Schritte beim Klaren konstruktiver Aufgabenstellugen,‖
Konstruktion, Vol. 27, pp. 395-402.
38. Pahl, G., and Beitz, W., 1996, Engineering Design: A Systematic Approach, Springer-
Verlag, New York.
39. Otto, K., and Wood, K., 2001, Product Design: Techniques in Reverse Engineering:
Systematic Design, and New Product Development, Prentice-Hall, New York.
40. Rohrbach, B., 1969, ―Kreativ Nach Regeln -- Methode 635, Eine Neue Technik Zum Losen
Von Problemen,‖ Absatzwirtschaft, Vol. 12, pp. 73-75.
41. Shah, J., 1998, "Experimental Investigation of Progressive Idea Generation Techniques in
Engineering Design," ASME DETC Design Theory and Methodology Conference, Atlanta,
GA.
42. Altshuller, G. S., 1984, Creativity as an Exact Science, Gordon and Breach, Luxembourg.
43. Linsey, J. S., Murphy, J.T., Markman, A.B., Wood, K.L., and Kurtoglu, T., 2006,
"Representing Analogies: Increasing the Probability of Innovation," ASME DETC Design
Theory and Methodology Conference, Philadelphia, PA, Paper Number: DETC2006-99383.
44. Singh, V., Skiles, S., Krager, J., Wood, K., Jensen, D., and Sierakowski, R., 2009,
―Innovations in Design Through Transformation: A Fundamental Study of Transformation
Principles,‖ Journal of Mechanical Design, Vol. 131, No. 8, pp. 081010.
45. Chiu, I., and Shu, L. H., 2007, ―Biomimetic Design through Natural Language Analysis to
Facilitate Cross-Domain Information Retrieval,‖ Artificial Intelligence for Engineering
Design, Analysis, and Manufacturing, Vol. 21, No. 1, pp. 45-59.
46. Keeney, R., and Raiffa, H., 1976, Decisions with Multiple Objectives: Preferences and
Value Tradeoffs, John Wiley and Sons, New York.
47. Saaty, T., 1980, The Analytical Hierarchy Process, McGraw-Hill, New York.
48. Pugh, S., 1990, Total Design, Addison-Wesley, New York.
49. Thevenot, H., and Simpson, T., 2009, ―A Product Dissection-Based Methodology to
Benchmark Product Family Design Alternatives,‖ Journal of Mechanical Design, Vol. 131,
No. 4, pp. 041002.
50. Leary, M., and Burvil, C., 2007, ―Enhancing the Quality Function Deployment Conceptual
Design Tool,‖ Journal of Mechanical Design, Vol. 129, No. 7, pp. 701-708.
51. Ulrich, K., 1995, ―The Role of Product Architecture in the Manufacturing Firm,‖ Research
Policy, Vol. 24, No. 3, pp. 419-440.
52. Pahl, G. and W. Beitz, 1996, Engineering Design: A Systematic Approach, Springer-Verlag,
New York.
53. Stone, R. B. and K. L. Wood, 2000, ―Development of a Functional Basis for Design,‖ ASME
Journal of Mechanical Design, Vol. 122, pp. 359-370.
54. Industrial Design Society of America, International Design Excellence Awards, 2008, Vicks
Forehead Thermometer.
55. Popular Science, Best of What's New, 2006, Recreation: Nike+iPod Sports Kit.
28
56. Popular Science, Best of What's New, 2007, Home Tech: Oliso Frisper.
57. Tinsley, H., and Weiss, D., 2000, "Interrater Reliability and Agreement," Handbook of
Applied Multivariate Statistics and Mathematical Modeling, Academic Press, New York, pp.
95-124.
58. Cohen, J., 1960, ―A Coefficient of Agreement for Nominal Scales,‖ Educational and
Psychological Measurement, Vol. 20, No. 1, pp. 37-46.
59. Landis, J., and Koch, G., 1977, ―The Measurement of Observer Agreement for Categorical
Data,‖ Biometrics, Vol. 33, No. 1, pp. 159-174.
60. Fleiss, J., 1981, Statistical Methods for Rates and Proportions, John Wiley and Sons, New
York.
61. Von Hippel, E., 2005, Democratizing Innovation, MIT Press, Cambridge, MA.
62. Lettl, C., 2007, ―User Involvement Competence for Radical Innovation,‖ Journal of
Engineering Technology Management, Vol. 24, No. 1, pp. 53-75.
63. Hannukainen, P., and Hölttä-Otto, K., 2006, "Identifying Customer Needs -- Disabled
Persons as Lead Users," ASME DETC Design Theory and Methodology Conference, Las
Vegas, NV, ASME, Paper Number: DETC2006-99043.
64. Lin, J., and Seepersad, C., 2007, "Empathic Lead Users: The Effects of Extraordinary User
Experiences on Customer Needs Analysis and Product Redesign," ASME DETC Design
Theory and Methodology Conference, Las Vegas, NV, ASME, Paper Number: DETC2007-
35302.
65. Leonard, D., and Rayport, J., 1997, ―Sparking Innovation through Empathic Design,‖
Harvard Business Review, pp. 102-113.
66. Kelley, T., 2001, The Art of Innovation, Doubleday, New York, NY.
67. Green, M. G., J. S. Linsey, C. C. Seepersad and K. L. Wood, 2006, "Frontier Design: A
Product Usage Context Method," ASME IDETC/CIE Design Theory and Methodology
Conference, Philadelphia, PA, Paper Number: DETC2006-99608.
68. The Center for Universal Design, 2002, Ford Drives a Mile in an Older Person's Suit, North
Carolina State University, Raleigh, NC.
69. Story, M., Mueller, J. and Mace, R., 1998, The Universal Design File: Designing for People
of All Ages & Abilities, The Center for Universal Design, NC State University, Raleigh, NC.
70. Preiser, W., and Ostroff, E., 2001, Universal Design Handbook, McGraw-Hill Professional,
New York.
71. Redström, J., 2006, ―Towards User Design? On the Shift from Object to User as the Subject
of Design,‖ Design Studies, Vol. 27, No. 2, pp. 123-139.
72. Cagan, J. and C. M. Vogel, 2002, Creating Breakthrough Products: Innovation from
Product Planning to Program Approval, Pearson Education, Inc., Upper Saddle River, NJ.
29
List of Figures
Figure 1. Kano Diagram [5]
Figure 2. Vicks Forehead Thermometer [54]
Figure 3. Nike+ Apple iPod Pedometer Attachment [55]
Figure 4. Oliso Frisper Home Vacuum Sealer [56]
List of Tables
Table 1. Characteristics of Innovation
Table 2. Sample products that illustrate characteristics of innovation
Table 3. Product Selection Criteria
Table 4. Award-Winning Product Analysis by Innovation Characteristics and Categories
Table 5. Results of In-Store Comparison of Award-Winning Versus Non-Award-Winning
Products
30
Figure 1. Kano Diagram [5]
Satisfaction
Dissatisfaction
Baseline
Functionality
Delights
Must-haves
31
Figure 2. Vicks Forehead Thermometer [54]

32
Figure 3. Nike+ Apple iPod Pedometer Attachment [55]
33
Figure 4. Oliso Frisper Home Vacuum Sealer [56]
34
Table 1. Characteristics of Innovation
Functionality
Additional Function- Allows the user to solve a new problem or perform a new function while still
performing the function of the comparison product.
Architecture
Modified Size- The physical dimensions during operation or storage have changed in expansion or
compaction beyond subtle or incremental differences.
Modified Physical Layout- The same elements of the product are still present, but the physical architecture
has changed.
Expanded Usage Physical Environment- The product can now be used in more usage environments with
different resource availability or different physical characteristics.
External Interactions
Modified Material Flow- Accepts or creates different materials or uses materials in new ways.
Modified Energy Flow- Utilizes new sources of energy or converts to a different form of energy than
previously used.
Modified Information Flow- Different types or amounts of information are being gathered, processed, or
output/displayed.
Interaction with Infrastructure- The product interacts with previously owned infrastructure.
User Interactions
Modified Physical Demands- The product is easier to use physically beyond subtle or incremental
differences.
Modified Sensory Demands- The product is easier to use from a sensory stand point beyond subtle or
incremental differences.
Modified Mental Demands- The product is easier to use mentally beyond subtle or incremental differences.
Cost (Secondary Characteristic)
Purchase Cost- Purchase cost is significantly different.
Operating Cost – Operating and/or maintenance costs are significantly different.
35
Table 2. Sample Products that Illustrate Characteristics of Innovation
Product
Vicks
Forehead
Thermometer Nike+
Oliso
Frisper
Comparative
Product
children
digital
thermometer
running
pedometer
home
vacuum
sealer
Function
Additional Function x
Architecture
Modified Size x x
Modified Physical
Layout x
Expanded Usage
Environment x
External
Interactions
Modified Material
Flow
Modified Energy
Flow x x
Modified
Information Flow x x
Interaction with
Infrastructure x x
User Interactions
Modified Physical
Demands x
Modified Sensory
Demands x
Modified Cognitive
Demands x
Cost
Purchase
Maintenance x
36
Table 3. Product Selection Criteria
The innovative product must be mechanical or hardware-related.
The innovation must be related to the functionality of the product, rather than its aesthetics alone.
The product must be successful or potentially successful in the marketplace.
The product must be available in the marketplace (i.e., no prototypes).
The product must be an end consumer product, rather than a component.
The product must have changed or have the potential to change the marketplace.
The product must be relevant to the US market.
37
Table 4. Award-Winning Product Analysis by Innovation Characteristics and Categories
Percent of
products
with each
criterion
(%)
Percent of
products with at
least 1 criterion
for each
category (%)
Function - 38.1
Additional Function 38.1
Architecture - 60.9
Modified Size 23.4
Modified Physical Layout 36.0
Expanded Usage
Environment 26.9
External Interactions - 80.2
Modified Material Flow 10.2
Modified Energy Flow 41.6
Modified Information Flow 34.5
Interaction with
Infrastructure 20.8
User Interactions - 68.5
Modified Physical Demands 48.7
Modified Sensory Demands 14.2
Modified Cognitive Demands 15.7
Cost - 9.1
Purchase 2.5
Maintenance 7.1
38
Table 5. Results of In-Store Comparison of Award-Winning Versus Non-Award-Winning
Products (P-values are based on a t-test of the null hypothesis that the average numbers of
characteristics are equal for the two groups.)
Average Number of
Characteristics Per Product
P-Value
Award-
Winning
Products
Non-Award-
Winning
Products
OVERALL 2.9 0.5 0.00003
Function 0.3 0.07 0.058
Architecture 1.0 0.2 0.001
External Interactions 0.8 0.1 0.004
User Interactions 0.6 0.09 0.008
Cost 0.1 0.0 0.08