Performance Assessment Task Truffles Grade 6 Common Core ...
25
© 2012 Noyce Foundation Performance Assessment Task Truffles Grade 6 The task challenges a student to demonstrate understanding of ratios and proportions. A student must be able to model and solve contextualized problems using various representations, such as graphs, tables, and equations. A student must make sense of and interpret line graphs. A student must determine a generalized rule from an understanding of ratio and proportional reasoning in a given real‐world context. Common Core State Standards Math ‐ Content Standards Ratios and Proportional Relationships Understand ratio concepts and use ratio reasoning to solve problems. 6.RP.1 Understand the concept of a ratio and use ratio language to describe a ratio relationship between two quantities. For example, “The ratio of wings to beaks in the bird house at the zoo was 2:1, because for every 2 wings there was 1 beak.” “For every vote candidate A received, candidate C received nearly three votes.” 6.RP.2 Understand the concept of a unit rate a/b associated with a ratio a:b with b = 0, and use rate language in the context of a ratio relationship. For example, “This recipe has a ratio of 3 cups of flour to 4 cups of sugar, so there is 3/4 cup of flour for each cup of sugar.” “We paid $75 for 15 hamburgers, which is a rate of $5 per hamburger.” Expressions and Equations Represent and analyze quantitative relationships between dependent and independent variables. 6.EE.9 Use variables to represent two quantities in a real‐world problem that change in relationship to one another; write an equation to express one quantity, thought of as the dependent variable, in terms of the other quantity, thought of as the independent variable. Analyze the relationship between the dependent and independent variables using graphs and tables, and relate these to the equation. For example, in a problem involving motion at constant speed, list and graph ordered pairs of distances and times, and write the equation d = 65t to represent the relationship between distance and time. Common Core State Standards Math – Standards of Mathematical Practice MP.6 Attend to precision. Mathematically proficient students try to communicate precisely to others. They try to use clear definitions in discussion with others and in their own reasoning. They state the meaning of the symbols they choose, including using the equal sign consistently and appropriately. They are careful about specifying units of measure, and labeling axes to clarify the correspondence with quantities in a problem. They calculate accurately and efficiently, express numerical answers with a degree of precision appropriate for the problem context. In the elementary grades, students give carefully formulated explanations to each other. By the time they reach high school they have learned to examine claims and make explicit use of definitions. MP.8 Look for and express regularity in repeated reasoning. Mathematically proficient students notice if calculations are repeated, and look both for general methods and for shortcuts. Upper elementary students might notice when dividing 25 by 11 that they are repeating the same calculations over and over again, and conclude they have a repeating decimal. By paying attention to the calculation of slope as they repeatedly check whether points are on the line through (1, 2) with slope 3, middle school students might abstract the equation (y – 2)/(x – 1) = 3. Noticing the regularity in the way terms cancel when expanding (x–1)(x+1), (x–1)(x2+x+1), and (x–1)(x3 +x2+x+1) might lead them to the general formula for the sum of a geometric series. As they work to solve a problem, mathematically proficient students maintain oversight of the process, while attending to the details. They continually evaluate the reasonableness of their intermediate results. Assessment Results This task was developed by the Mathematics Assessment Resource Service and administered as part of a national, normed math assessment. For comparison purposes, teachers may be interested in the
Transcript of Performance Assessment Task Truffles Grade 6 Common Core ...

© 2012 Noyce Foundation
Performance Assessment Task Truffles Grade 6
The task challenges a student to demonstrate understanding of ratios and proportions. A student must be able to model and solve contextualized problems using various representations, such as graphs, tables, and equations. A student must make sense of and interpret line graphs. A student must determine a generalized rule from an understanding of ratio and proportional reasoning in a given real‐world context.
Common Core State Standards Math ‐ Content Standards Ratios and Proportional Relationships Understand ratio concepts and use ratio reasoning to solve problems. 6.RP.1 Understand the concept of a ratio and use ratio language to describe a ratio relationship between two quantities. For example, “The ratio of wings to beaks in the bird house at the zoo was 2:1, because for every 2 wings there was 1 beak.” “For every vote candidate A received, candidate C received nearly three votes.” 6.RP.2 Understand the concept of a unit rate a/b associated with a ratio a:b with b =� 0, and use rate language in the context of a ratio relationship. For example, “This recipe has a ratio of 3 cups of flour to 4 cups of sugar, so there is 3/4 cup of flour for each cup of sugar.” “We paid $75 for 15 hamburgers, which is a rate of $5 per hamburger.” Expressions and Equations Represent and analyze quantitative relationships between dependent and independent variables. 6.EE.9 Use variables to represent two quantities in a real‐world problem that change in relationship to one another; write an equation to express one quantity, thought of as the dependent variable, in terms of the other quantity, thought of as the independent variable. Analyze the relationship between the dependent and independent variables using graphs and tables, and relate these to the equation. For example, in a problem involving motion at constant speed, list and graph ordered pairs of distances and times, and write the equation d = 65t to represent the relationship between distance and time.
Common Core State Standards Math – Standards of Mathematical Practice MP.6 Attend to precision. Mathematically proficient students try to communicate precisely to others. They try to use clear definitions in discussion with others and in their own reasoning. They state the meaning of the symbols they choose, including using the equal sign consistently and appropriately. They are careful about specifying units of measure, and labeling axes to clarify the correspondence with quantities in a problem. They calculate accurately and efficiently, express numerical answers with a degree of precision appropriate for the problem context. In the elementary grades, students give carefully formulated explanations to each other. By the time they reach high school they have learned to examine claims and make explicit use of definitions. MP.8 Look for and express regularity in repeated reasoning. Mathematically proficient students notice if calculations are repeated, and look both for general methods and for shortcuts. Upper elementary students might notice when dividing 25 by 11 that they are repeating the same calculations over and over again, and conclude they have a repeating decimal. By paying attention to the calculation of slope as they repeatedly check whether points are on the line through (1, 2) with slope 3, middle school students might abstract the equation (y – 2)/(x – 1) = 3. Noticing the regularity in the way terms cancel when expanding (x–1)(x+1), (x–1)(x2+x+1), and (x–1)(x3 +x2+x+1) might lead them to the general formula for the sum of a geometric series. As they work to solve a problem, mathematically proficient students maintain oversight of the process, while attending to the details. They continually evaluate the reasonableness of their intermediate results.
Assessment Results This task was developed by the Mathematics Assessment Resource Service and administered as part of a national, normed math assessment. For comparison purposes, teachers may be interested in the

© 2012 Noyce Foundation
results of the national assessment, including the total points possible for the task, the number of core points, and the percent of students that scored at standard on the task. Related materials, including the scoring rubric, student work, and discussions of student understandings and misconceptions on the task, are included in the task packet. Grade Level Year Total Points Core Points % At Standard
6 2009 9 5 68 %

Grade 6 Copyright © 2009 by Mathematics Assessment Resource Service. All rights reserved.
23
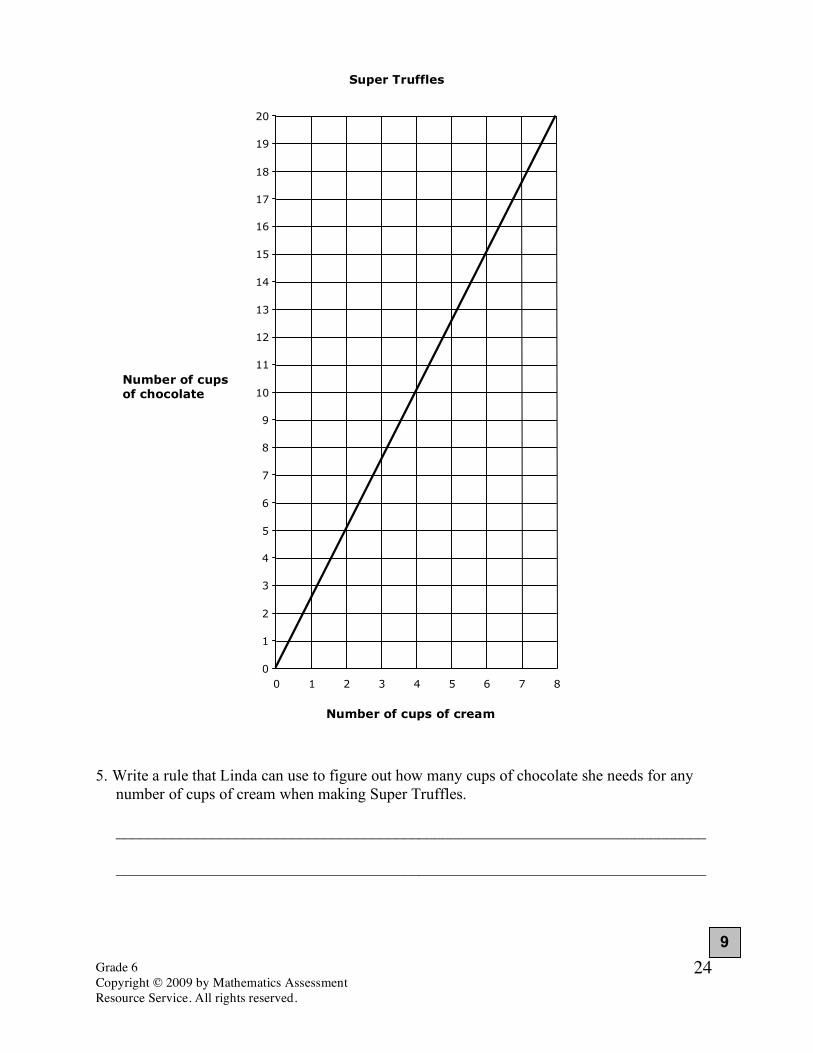
Truffles This problem gives you the chance to: • do calculations in a real situation Linda makes chocolate truffles. The recipe for 20 dark chocolate truffles is 1 cup cream 2 cups dark chocolate 1. Complete the recipe for 40 dark truffles
_________ cups cream
_________ cups dark chocolate 2. One day, Linda has 8 cups of dark chocolate and plenty of cream. How many truffles can she make? ____________ Explain how you figured it out. __________________________________________________________________ __________________________________________________________________ 3. The recipe for Super Truffles is different. The graph on the next page shows how much cream and chocolate to use. How much chocolate does Linda need for two cups of cream?
_____________________ 4. How much cream does she need for 15 cups of chocolate?
_____________________
Grade 6 Copyright © 2009 by Mathematics Assessment Resource Service. All rights reserved.
24
5. Write a rule that Linda can use to figure out how many cups of chocolate she needs for any number of cups of cream when making Super Truffles. __________________________________________________________________________ __________________________________________________________________________
9
Super Truffles
0
1 2
3 4 5
6
7
8 9 10
11 12 13
14
15
16 17 18
19 20
0 1 2 3 4 5 6 7 8
Number of cups of cream
Number of cups of chocolate

Grade 6 Copyright © 2009 by Mathematics Assessment Resource Service. All rights reserved.
25
Truffles Rubric • • The core elements of performance required by this task are: • • do calculations in a real situation • Based on these, credit for specific aspects of performance should be assigned as follows
points
section points
1. Gives correct answers: 2 4
1 1
2
2. Gives correct answer: 80 Gives correct explanation such as: She can make four times as many as the recipe.
1 2
3
3 Gives correct answer: 5 cups 1 1
4. Gives correct answer: 6 cups 1 1
5. Gives correct rule such as: Multiply the number of cups of cream by two and a half. Partial credit Shows a 2.5: 1 ratio or equivalent.
2
(1)
2
Total Points 9

Grade 6 Copyright © 2009 by Noyce Foundation All rights reserved.
26
Truffles Work the task and look at the rubric. What are the big mathematical ideas a student needs to understand to be successful on this task?_____________________________ Look at student work for part 2, finding the amount of truffles for a given amount of chocolate. How many of your students put:
80 160 60 4 40 Other
How might students have gotten an answer of 160? 60? 4? How are these misconceptions different? Look at student work of part 3, finding the amount of chocolate for 2 cups of cream using the graph. How many of your students:
• Could read the graph and find the answer of 5 cups?_____________ • Used the old formula and put 4 cups?_________ • Put 1 cup?_________ What might they be thinking?
Now look at reading the graph from the vertical scale to the horizontal scale. How many of your students put:
6 14 5 7 1/2 3 Other
What was problematic for students? What didn’t they understand about the situation? Now look at the rules for finding chocolate for Super Truffles. How many of your students could:
• Write a multiplication rule, chocolate is 2.5 times the amount of cream?________ • Write the ratio: 2.5 chocolates for every cream?_______ • Describe how to use the graph to find the answer?_________ • Make a table and told how to use it?___________ • Gave a rule about odd and even?________ • Gave a recursive rule, like add two or add five?__________ • Made a rule that wouldn’t work for all the examples? • Did not attempt a rule?___________
What do you think students understand about writing a rule? How often do students in your class get an opportunity to make generalizations or write rules using algebra? How can you plan a class discussion to help students make more sense of this idea of writing a rule? How do students learn to check rules against the evidence? What do we want sixth graders to understand about slope, growth, and algebraic or number sentence notation? What is the foundation at this grade level for later algebraic thinking?

Grade 6 Copyright © 2009 by Noyce Foundation All rights reserved.
27
Looking at Student Work on Truffles Student A looks for a multiplicative relationship to find the number of truffles in part 2. The student can then apply this strategy to finding a rule in part 5. Notice how the rule is different than stating a ratio. Student A

Grade 6 Copyright © 2009 by Noyce Foundation All rights reserved.
28
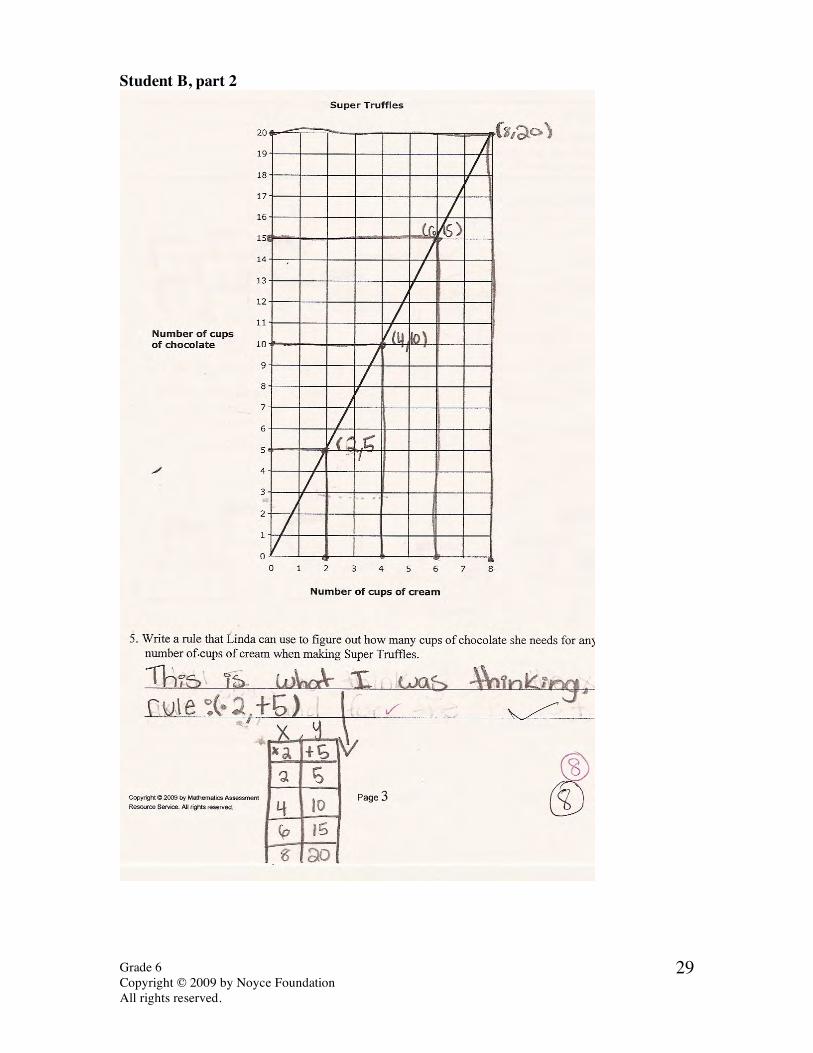
Student B is able to identify and extend a pattern to chug out an answer in part 2. In part 5, the student should have been given no marks. The student has used the graph to make a table. The student doesn’t correctly quantify how the pattern is growing at the top of the table and doesn’t identify a ratio of 2.5 to 1. What questions might push this student to look more closely for a relationship? Student B
Grade 6 Copyright © 2009 by Noyce Foundation All rights reserved.
29
Student B, part 2

Grade 6 Copyright © 2009 by Noyce Foundation All rights reserved.
30
Student C seems to understand the mathematics of the task but is unclear about how to develop a mathematical explanation in part 2. What types of classroom activities help students develop the logic of making an explanation? How can you use models to help students see what constitutes a good explanation? The student uses a ratio in part 5. Student C

Grade 6 Copyright © 2009 by Noyce Foundation All rights reserved.
31
Look at the work of student D on part 2. Where does the 3 come from? What is the misconception or faulty logic of this argument? In part 3 the student is able to obtain a correct solution, but look at the misconception about dividing with decimals. How does this prevent the student from seeing and quantifying a relationship in part 5? Student D

Grade 6 Copyright © 2009 by Noyce Foundation All rights reserved.
32
Student E cannot make sense of the idea that there is plenty of cream in part 2. The student does not understand the qualities of a rule for this grade level. While at earlier grades noticing that the pattern is about odd and even is acceptable, at this grade level students need to look for ways of quantifying relationships. What types of experiences does this student need? Student E

Grade 6 Copyright © 2009 by Noyce Foundation All rights reserved.
33
Student F identifies points on the graph to correctly solve part 3 and 4. However the student doesn’t use that information when making the table. In part 2 the student made a table increasing by 20 each time. Here the student uses a recursive rule of adding 2. What is an expression that would quantify the relationship shown in the table? What evidence should the student have noticed that would hint this rule is incorrect? Student F

Grade 6 Copyright © 2009 by Noyce Foundation All rights reserved.
34
Student G, H, and I all thought the number of truffles in part two was 160. What was the thinking or logic of their strategy? Why doesn’t it work? Where does it break down mathematically? Student G
Student H
Student I

Grade 6 Copyright © 2009 by Noyce Foundation All rights reserved.
35
Student I is also confused about how to use a scale on the graph. The student doesn’t understand how to read points that aren’t on grid lines. Student I

Grade 6 Copyright © 2009 by Noyce Foundation All rights reserved.
36
Look at the explanation of Student J. What is the underlying mathematics that allows this strategy to work? How is it different from some of the strategies of the previous 3 students? In part 5 the Student J talks about adding 1/2, but the rule is multiplicative. Why does this work mathematically? What types of experiences may have helped the student to do this kind of reasoning? Student J
Grade 6 Copyright © 2009 by Noyce Foundation All rights reserved.
37
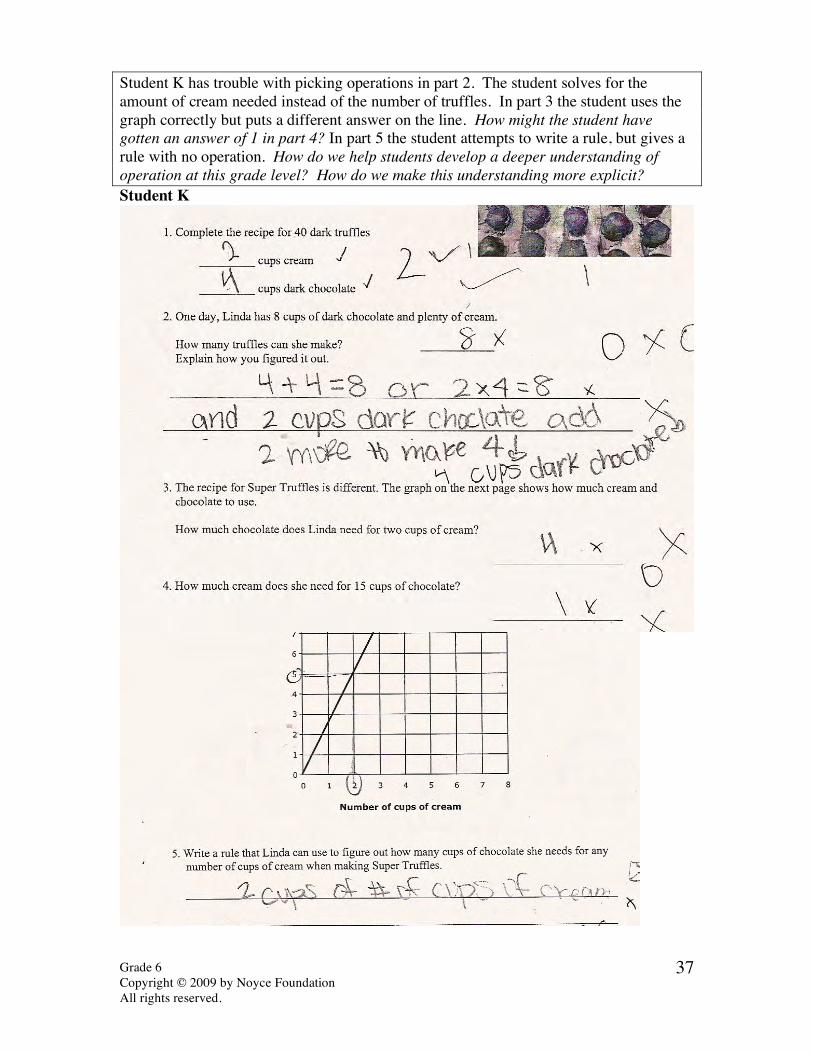
Student K has trouble with picking operations in part 2. The student solves for the amount of cream needed instead of the number of truffles. In part 3 the student uses the graph correctly but puts a different answer on the line. How might the student have gotten an answer of 1 in part 4? In part 5 the student attempts to write a rule, but gives a rule with no operation. How do we help students develop a deeper understanding of operation at this grade level? How do we make this understanding more explicit? Student K

Grade 6 Copyright © 2009 by Noyce Foundation All rights reserved.
38
6th Grade Task 2 Truffles Student Task Do calculations involving rates a real situation. Core Idea 3 Algebra and Functions
Understand relations and functions, analyze mathematical situations, and use models to solve problems involving quantity and change.
• Represent analyze, and generalize a variety of relations and functions with tables, graphs and words.
• Represent probabilities as ratios, proportions, decimals or percents.
• Model and solve contextualized problems using various representations, such as graphs tables, and equations.
Core Idea 1 Number and Operation
• Understand and use proportional reasoning to represent quantitative relationships.
Mathematics of the task:
• Understanding ratios and multiplicative relationships • Identifying and extending a pattern • Reading and interpreting a graph • Understanding scale • Using data from a graph or looking at slope to find a rule • Writing a rule for a multiplicative relationship from the ratio
Based on teacher observations, this is what sixth graders know and are able to do:
• Complete the recipe for 40 truffles • Read the graph to find the amount of cream and chocolate for Super Truffles
Areas of difficulty for sixth graders:
• Using multiplication to find the truffles in part 2 • Explaining their thinking mathematically in part 2 • Finding the ratio of cream to chocolate in part 5 • Writing a rule for finding the chocolate for any amount of cream in part 5
Strategies used by successful students:
• Students who used multiplication in part two were more likely to find a rule or ratio in part 5

Grade 6 Copyright © 2009 by Noyce Foundation All rights reserved.
39
The maximum score available for this task is 9 points. The minimum score needed for a level 3 response, meeting standard, is 5 points. Most students, 93%, could find the recipe for making 40 truffles. Many students, 75%, could find the recipe for 40 truffles and read the graph to find the amount of chocolate and cream in part 3 and 4. More than half the students, 63%, could also find the amount of truffles in part 2. Almost half the students, 44%, could explain how to find the number of truffles in part 2. A few students, 17%, could identify the ratio of cream to chocolate for Super Truffles. Almost 9% could meet all the demands of the task including writing a rule for finding chocolate for any amount of cream. About 5% of the students scored no points on this task. All the students in the sample with this score attempted the task.

Grade 6 Copyright © 2009 by Noyce Foundation All rights reserved.
40
Truffles Points Understandings Misunderstandings
0 All the students in the sample with this score attempted the task.
Students struggled with extending the recipe from 20 to 40 truffles.
2 Students could double a recipe. Students had difficulty reading the graph. 9% of the students thought there were 4 cups of chocolate in part 3. 4% thought there would be 1 cup of chocolate. In part 3 4% thought there were be 14 cups of cream, 4% thought there would be 5 cups of cream, and 3% thought there would be 7 1/2 cups of cream.
4 Students could extend the recipe to 40 truffles and use the graph to find the amount of chocolate or cream.
Students struggled with finding the amount of truffles that could be made with 8 cups of chocolate in part 2. 8% thought there would be 160 truffles. 7% thought there could be 60 truffles. 4% thought there were be only 4 truffles.
5 Students could extend the recipe to 40 truffles, find the number of truffles in part 2, and read the graph.
Students struggled with explaining how to find the number of truffles.
7 Students could also explain how to find the number of truffles in part 2.
Students struggled with finding relationships from the graph in part 5. 18% wrote descriptions of how to use the graph. Many students gave recursive rules like add 5 every time or made a table. 6% did not attempt to write a rule.
8 15% of the students gave a ratio, but couldn’t use that ratio to write a multiplicative rule.
9 Students could work with ratios to extend a recipe, read and interpret a graph, and use the ratio to write a multiplicative rule to find the chocolate for any amount of cream.
Grade 6 Copyright © 2009 by Noyce Foundation All rights reserved.
41
Implications for Instruction Students need to be able to work with simple ratios, such as 1:2 and be able to extend them to double or triple a recipe. Students need to be able to reason about patterns requiring multiple steps. In this case students needed to think about a recipe for 20 chocolates and extend the recipe for 40 chocolates. Students should be exposed to tools for thinking about ratios, such as graphing and ratio tables. Students also needed to think that if the recipe requiring 2 cups of chocolate was increased to 8 cups of chocolate, how many truffles could be made. In other words, students should be able to convert between equal ratios. In learning about ratios, students should also be comfortable with changing the ratios to rules. This should start with students recognizing the importance of unit ratios and then converting the unit ratio into a rule. Having students solve a variety of problems involving ratios in context helps students to see the purpose for being able to find and use a rule. Ideas for Action Research: Rate Palooza Using a Problem of the Month is a powerful way for students to explore the ideas of rate. In Brisbane, teachers worked together to introduce the idea of rates and the rate problem of the month school-wide. Each teacher developed a small set of rate tasks for students to work and think about. Students moved from room to room engaging in the tasks and discussing the rates. Here is an example of menu from one teacher’s classroom:
Mathematics Lesson Plan (for grade 6)
For the lesson on Wed. May 20th At Cambrian Middle School
FiMC Instructor: Joe Condon
Rate Palooza and “Small Motor Experiments”(Introducing Problems of the Month)
1. Goal of the Lesson: Students physically experience concept of rate and explore connected mathematical vocabulary in order to build a community foundation for the concept of rate prior to beginning a non-routine, differentiated problem on rate – “First Rate P.O.M.”). Teacher formatively assesses students’ understanding, vocabulary and skills related to First Rate problem to inform his instruction. • Misconceptions, vocabulary, and successful strategies emerge, so that students
can practice or confront them in future lessons • Students relate mathematical language to a real world situation by using
language to communicate mathematical ideas and to reach agreement about mean of words and recognize the importance of commonly shared definitions
• Students grapple with comparing experimental rates over different time spans so that the importance of unit rate arise in order to compare rates
2. Relationship between this lesson and: • State Standards 1.2& 1.3 Interpret and use ratios in different contexts. Use
proportions to solve problems. • State Standards 2.2 Demonstrate an understanding that rate is a measure of
one quantity per unit value of another quantity • MAC Core Ideas: 6th and 7th Number and Operations/Algebra

Grade 6 Copyright © 2009 by Noyce Foundation All rights reserved.
42
o Understand and use proportional reasoning to represent quantitative relationships. Develop, analyze and explain methods for solving problems involving proportional reasoning, such as scaling and finding equivalent ratios
o Identify and describe situations with constant rates and compare them. 3. About this lesson study and design:
This lesson was developed as part of a school-wide effort to introduce a Problem of the Month on Rates. Originally there were 4 sets of rate activities (one set in each of four classrooms) and students got a taste of each set of activities and then rotated to the next classroom. After the first run-through some teachers liked the trading rooms and continued the format, other teachers thought students needed to have more time to experience the activities. In the version being presented, the group has decided to keep the class together so students can sample more of the activities from one of the teacher’s classroom set. The number of activities has been condensed from 6 activities to 4 activities because of the short time available for today’s lesson. Originally students timed each activity to see how much could be done in one minute. Now different groups are given different times for each activity. The thinking is that in later debriefs students will need to grapple with the idea of how to compare different rates. For example if Student A can use chopsticks to move 35 cubes in 60 seconds and Student B can move 28 cubes in 45 seconds, how can we determine which student is faster? During the first two sets of lessons students were supposed to find unit rates of some quantity/sec. But often found number of seconds/ per “….”. We decided that this would be a good place to prod their thinking about rates. When would it be better to use the “per second” rate? Can you write a problem this would help solve? When would the other rate be more helpful? Can you write a problem this second rate would help solve? The original lesson had an introduction asking students to name familiar rates (linking knowledge to everyday experiences) and generalize about rates (finding a common definition). During the debrief meeting, the planning group talked about adding another piece to the introduction with a brief experience on walking measured in meters per second. The activity will be linked to using a ratio table, so students can think about finding equivalent rates with larger or smaller denominators. Teachers conjectured that going up from minutes to hours was easier for students to conceptualize, than going from minutes to one second. The school’s typical POM of the month kick-off is similar in these ways: (1) It involves all grades (six, seven, and eight) having a common experience (2) It mirrors the content of the POM (3) It is a simple and fun introduction to the content or skills in the POM. This kick-off is a bit different in that the grades experience the same activities, but not together. Also, our focus is clearly to lay a conceptual foundation, rather than honing in on specific content or skills.

Grade 6 Copyright © 2009 by Noyce Foundation All rights reserved.
43
Lesson flow
1. Introduction: a. Brief rate demonstration: collect rate data on “5 meter shuttle” and record
data in a ratio table b. Debrief demo in a concept map of RATE: What is rate? Generalize and
ask for specific examples. Include “unit rate”. c. Emphasize role of UNITS in a rate: Teacher puts ratio on board and asks
for several different possible contexts for this rate 2. Small Motor Rate experiments: Teacher describes and demonstrates stations. In
pairs, students collect and record their data (in words first, then ratios with units). 3. Summary:
a. Whole group T asks Ss which small motor activity which was their fastest. b. Teacher poses question for individual think time: Given these three
students’ rates, who counted rice fastest? c. Teacher poses questions for individual, written, reflection: Why don’t we
know who counts rice fastest strictly from our raw data? What can we do to our raw data so we can compare the rates and justify our conclusion? (Please share as many strategies as you have)
d. Time Allowing, T asks individuals to share their thinking whole group, just to get a few starter ideas out in the community (i.e. common denominator “same amount of time”, common numerator “same amount of rice”, unit rate – special case of common denominator, role of equivalent ratios). Following lessons will focus on these strategies in more detail.
Three Stations o Counting Rice: Given a cup of rice, pour some out on your desk. How many
grains can you count in a given amount of time? Or how long will it take to count the pile?
o Moving cubes with chopsticks: Given a cup of 1 cm cubes. How long will it take, using chopsticks, to transfer the cubes from one cup to another cup?
o Stringing beads on a shoelace: Given a shoelace and some large wooden beads, how many beads can you string in a given amount of time?

Grade 6 Copyright © 2009 by Noyce Foundation All rights reserved.
44
4. OBSERVATION Data collection points: a. How do students measure? Are they accurate about time- how do you
know? b. *Do you notice change in the types of language and features discussed
during the lesson? How does the lesson contribute to their use of academic language?
c. *Do students use labels (write the units in words next to their ratios)? d. *Do students do the proper division? How do they interpret their result?
(Do they see the “per ONE second”? Do they name it a “unit rate”?) e. What types of misconceptions did you observe? f. How did students compare ratios? g. Did students ask questions of each other? What determined the solution
when there was disagreement? Were students able to increase any of the rates to per hour or per day? Were some rates more difficult for them than others? Why? What about the mathematics was different in different activities? (for future lessons) How do activities such as these help students develop a basic “feel” for rates? While teachers worked on lesson units around rate, students worked on following problem of the month, First Rate. Throughout the unit and during the debrief, teachers and students could refer back to the experiences in the Problem of the Month Launch. Parts of the lessons will be available on DVD from your coach, Rate Palooza. You might watch this will colleagues and discuss on to do a school problem of the month or just get ideas on how to introduce rates to your class. Problem of the Month First Rate Page 2 (c) Noyce Foundation 2008. To reproduce this document, permission must be granted by the Noyce Foundation: [email protected]. Level B Tom and Diane start to race. Tom took 4 seconds to run 6 yards. Diane ran 5 yards in 3 seconds.
If they continued to run at the same speeds, who would get to 30 yards first? Show how you figured out. Who runs faster? How can you compare their speeds?

Grade 6 Copyright © 2009 by Noyce Foundation All rights reserved.
45
Problem of the Month First Rate Page 3 Level C The Environmental Club at school attends an annual community clean-up event. They have recycling games. A team is assigned an area of land that is scattered with litter. The goal is for a pair of participants to clean up the area in the fastest time possible.
Tammy, working alone, could clean one-half the area in one hour. Her partner Melissa, working alone, could clean one-third of the area in one hour. During the contest when they work together, how long will it take them to clean the area? Explain how you found your solution. Level D You are an Olympic runner. You have just qualified to be in the finals of the 1,500-meter race. The track is 400 meters in an oval shape. The race is three and three-fourth laps around the track.
The favorite to win the race is a Kenyan, who holds the current best time, which is 3 minutes 29.4 seconds. The Kenyan runs a very steady race. Each of the Kenyan’s lap times (400 meters) are within a second of each other. You run a completely different type of race. You have a very strong kick, which means you usually lag behind for the first three laps to save energy and then when the leader has 300 meters to go you pour it on to win at the tape. You like to save energy in the first three laps, but you don’t want to be more than 50 meters behind when you start your kick to the finish line. Determine your strategy to win this race. What is the average speed you need to run the first part of the race? What is the average speed you need to run during your kick to win the race? How might your race change if the Kenyan runs two seconds faster?
Start ->
Finish