Percent Plans, Automatic Admissions, and College ... · Percent Plans, Automatic Admissions, and...
34
1 Percent Plans, Automatic Admissions, and College Enrollment Outcomes Lindsay Daugherty RAND Corporation [email protected] Francisco (Paco) Martorell RAND Corporation [email protected] Isaac McFarlin Jr. University of Michigan [email protected] September 2012 Abstract In 1997, the Texas Legislature passed House Bill 588 – also known as the Texas Top Ten Percent Law – guaranteeing automatic admission to all state-funded universities for Texas students in the top ten percent of their high school class. Automatic admissions policies remain controversial, and the effects of these policies on college enrollment and choice remain unclear. Using regression discontinuity methods and data on 6 cohorts of graduates from a large urban school district, we examine the effect of eligibility for automatic admission on college enrollment and persistence. We find that the Top Ten Percent Law does have a substantial impact on enrollment at Texas flagship universities and increases the total number of semesters enrolled at a flagship university four years after high school graduation. This increase in flagship enrollment appears to displace enrollment in private or out-of-state universities, and we find no effect on college enrollment overall or on the quality of college attended. We find evidence of effects on flagship enrollment for both white and minority students. However, these effects are concentrated in schools that send large (relative to the district) fractions of graduates to college, suggesting that automatic admissions may have little effect on the outcomes of students in the most disadvantaged schools. This is a preliminary draft. Please do not cite or distribute without permission of the authors.
Transcript of Percent Plans, Automatic Admissions, and College ... · Percent Plans, Automatic Admissions, and...
1
Percent Plans, Automatic Admissions, and College Enrollment Outcomes
Lindsay Daugherty
RAND Corporation
Francisco (Paco) Martorell
RAND Corporation
Isaac McFarlin Jr.
University of Michigan
September 2012
Abstract
In 1997, the Texas Legislature passed House Bill 588 – also known as the Texas Top Ten Percent Law –
guaranteeing automatic admission to all state-funded universities for Texas students in the top ten percent
of their high school class. Automatic admissions policies remain controversial, and the effects of these
policies on college enrollment and choice remain unclear. Using regression discontinuity methods and
data on 6 cohorts of graduates from a large urban school district, we examine the effect of eligibility for
automatic admission on college enrollment and persistence. We find that the Top Ten Percent Law does
have a substantial impact on enrollment at Texas flagship universities and increases the total number of
semesters enrolled at a flagship university four years after high school graduation. This increase in
flagship enrollment appears to displace enrollment in private or out-of-state universities, and we find no
effect on college enrollment overall or on the quality of college attended. We find evidence of effects on
flagship enrollment for both white and minority students. However, these effects are concentrated in
schools that send large (relative to the district) fractions of graduates to college, suggesting that automatic
admissions may have little effect on the outcomes of students in the most disadvantaged schools.
This is a preliminary draft. Please do not cite or distribute without permission of
the authors.
2
1. Introduction
Recent research (Hoekstra, 2009; Andrews et al., 2012) suggests that there may be large
economic returns to attending highly-selective universities. As a consequence, the process by
which students are admitted to these institutions has garnered considerable attention from
policymakers, researchers and members of the public. Concerns about fairness and equity have
been particularly salient. Universities have sought to increase the diversity of their student body
through “affirmative action” policies that grant preferences in admissions decisions to members
of racial and ethnic minorities that have traditionally been under-represented at selective
universities. However, the legality of these policies has been challenged, and a 1996 decision by
the U.S. 5th
Circuit Court in Hopwood v. Texas banned the use of race in college admissions
decisions.1
In response to this decision, the state of Texas passed the “Top Ten Percent Plan” in 1997
that guaranteed admission to any public university to students in the top decile of their high
school class. The goal of this law was to maintain racial, economic and geographic diversity at
the state’s flagship universities, since it ensures that the same proportion of students are eligible
for admission to any public university irrespective of how disadvantaged the students served by a
particular school happen to be. Two other states (California and Florida) soon followed suit and
adopted similar policies.2 Despite being explicitly race-neutral, “percent plans” remain very
controversial. Critics contend that the law is unfair to students at more competitive high schools
who may be denied admission in favor of students with worse academic credentials (such as
college entrance exam scores) but who are admitted by virtue of being in the top ten percent
(TTP) at a less competitive high school. University administrators also contend that too many
students are admitted under the automatic admission policy, thereby forcing them to turn down
better-qualified applicants.3 To address these concerns, the Texas law was changed so that,
1 The 2003 Supreme Court ruling in Grutter v Bollinger upheld a policy of race-based application
considerations at the University of Michigan, and after that decision the University of Texas reinstated
some racial preferences in admission for students outside of the top ten percent. The Supreme Court is
currently scheduled to reconsider the legality of racial preferences in college admissions in the case of
Fisher v. University of Texas at Austin. 2 Florida grants automatic admission to students in the top 20 percent of their high school class to the
University of Florida system, and automatic admission to the University of California system is available
to students in the top 4 percent of their class (Horn and Flores, 2003) 3 Another possible criticism of the TTP Law is that encourages a form of gaming whereby students seek
out less competitive high schools in order to get into the TTP (Cullen, Long and Reback, 2011).
3
beginning with the fall 2011 entering class, the University of Texas-Austin could cap the share of
enrollees admitted under the automatic admissions rule to 75 percent.
Of course, the relevance of the claims made both in favor and against percent plans
depends on whether and for whom eligibility for automatic admission actually affects college
enrollment and choice. In this paper, we examine this question by estimating the causal effect of
being eligible for automatic admission on the college enrollment and college choice outcomes of
several cohorts of high school students from a large urban school district in Texas. To carry out
this analysis, we created a database that links detailed high school records from district
administrative data to college enrollment information from the National Student Clearinghouse
(NSC) database. To account for the fact that students in the top class rank decile would have
better college outcomes even without the automatic admission policy, we use a regression
discontinuity design that compares the outcomes of students on either side of the top ten percent
class rank cutoff.
Our approach has several important strengths. First, our data are drawn from students in a
large urban school district that has traditionally sent few students to the state’s leading
universities and to college in general. This study sheds light on whether automatic college
admission affects college outcomes for a potentially under-served population. Second, we use
administrative data on college enrollment from the National Student Clearinghouse, which
allows us to consider a wider set of outcomes than just flagship enrollment and does not suffer
from misreporting error present in survey data. In particular, we can assess whether flagship
enrollment induced by being in the TTP of one’s class displaces enrollment at other institutions.
This is also the first study on the TTP Law that we are aware of that examines longer-run college
persistence measures. Third, we are able to compute class rank at various points throughout high
school, including the end of 11th
grade, which is the key point for determining membership in the
top ten percent for the purposes of applying to the state’s flagship universities. In contrast, the
only other study using this type of approach (Niu and Tienda, 2010) uses class rank measured at
the end of 12th
grade, which is after students would have applied to college. Our results suggest
this difference may be important.
Our preliminary findings suggest that the TTP Law does have a substantial impact on
enrollment at Texas flagship universities for students in a large urban district. Our results suggest
that eligibility for automatic admissions leads to substitution away from private or out-of-state
4
colleges rather than lower-ranked public institutions. On net, we do not find evidence of an effect
on the likelihood of enrolling in college or on enrollment at a four-year college. We also find
some evidence indicative of important heterogeneity. The estimated effects on flagship
attendance are twice as large for white students as they are for minority students, and there are no
effects for low-income students. We also find no evidence of an effect of automatic admission in
high schools that traditionally send relatively few students to four-year colleges. In ongoing
work, we are examining the effect of automatic admission on other measures of college quality
students attend, as well as on measures of college persistence and attainment.
The paper is organized as follows. Section 2 reviews existing research on the TTP Law
and provides some background on how the law works. Section 3 presents the conceptual
framework for our study, and Section 4 discusses the data on high school achievement and
college enrollment and provides descriptive statistics for students by TTP status. Section 5
describes our regression discontinuity strategy. Results are presented in Section 6. Section 7
concludes.
2. Background and Existing Research
The economic and societal benefits of college education are well-known (Kane and
Rouse, 1995; Currie and Moretti, 2003). These benefits tend to be especially large at the most
selective universities, as demonstrated by a recent study which showed that earnings are up to 20
percent higher as a consequence of attending the “flagship” university (Hoekstra, 2009). Who
gains access to college, and in particular, to the most elite universities, is thus a central question
for higher education policymakers in Texas and throughout the nation. Typically, universities
select students on the basis of academic achievement as measured by standardized test scores and
high school grades. Given that more advantaged students tend to have stronger academic
credentials (Kane, 1998), a consequence of this system is that other students are placed at a
serious disadvantage in the college admissions process. The lower enrollment rates of
disadvantaged students are argued to result in a lack of diversity at selective campuses.
The assumed purpose of the TTP rule is to ensure diversity at four-year (competitive)
public universities in the absence of more explicit race-based affirmative action policies. It is
therefore important to understand how automatic admissions policies compare to race-based
affirmative action in creating diverse college campuses. In a simulation of SAT score report
submissions, Long (2004) finds that minority students in Texas and California would be much
5
less likely to apply to top-tier colleges under the automatic admissions policies. On the other
hand, Bucks (2004) finds that the number of minorities at the University of Texas at Austin (UT)
was roughly restored by the law, while minority enrollment remains somewhat lower at Texas
A&M (TAMU) relative to rates under affirmative action. Tienda, Alon and Niu (2008) find that
the perceived increases in diversity at UT under the TTP Law are largely driven by an increase in
the enrollment rates of Asian students, while enrollment rates of Blacks and Hispanics declined.
There are a number of explanations for the TTP Law’s minimal effects on Black and
Hispanic enrollment. Niu, Sullivan and Tienda (2006) find that Black and Hispanic students are
less likely to be ranked in the TTP, particularly in schools with high minority populations. Even
among students in the top decile, minorities and graduates from poor schools are less likely to
choose selective institutions as their most preferred school (Niu, Tienda & Cortes, 2006). In
addition, there are a number of students who may be uninformed of the law. In a recent survey of
Texas seniors, Hispanic students were significantly less likely to report that they know “a lot”
about the TTP Law, a pattern that holds even among TTP students with a preference to attend a
four-year university (Niu, Sullivan & Tienda, 2006). Financial constraints are also likely to play
a role, though there are no studies to date that look at the potential that unmet financial need is
deterring TTP students from enrolling at the Texas flagships. To address these financial issues,
UT and TAMU created scholarship programs directed to some of the highest need schools, but
for students who do not attend a targeted school, are not well-informed about the scholarships, or
are not chosen to receive a scholarship through the application process, unmet financial need is
likely to remain a significant issue. Even for those students who receive the scholarships, there
still might be unmet financial need and there may be other colleges (e.g. private colleges) that
offer more attractive financial aid packages.
Despite extensive research on the effects of the TTP Law on overall enrollment rates,
solid empirical evidence on how automatic admissions affects individual enrollment decisions is
limited. This is likely due to the lack of student-level data with the necessary class rank
information needed to conduct such an analysis. One exception is a study by Niu and Tienda
(2010) that uses a similar research design to that which we use here and survey data linked to
administrative records on class rank at graduation. Overall they do not find statistically
significant estimates of effects on flagship enrollment, although they do find positive effects for
Hispanics and those attending “typical” high schools. Our paper adds to Niu and Tienda’s
6
research in several important ways. With multiple cohorts of data and exact grade point average
(GPA) calculations from district course-taking data, the estimates of the law’s effect on college
enrollment are more precise. In addition, the inclusion of more recent years of data allows us to
determine whether the effects of the TTP Law have shifted over time. Second, we consider a
broader set of measures that allow us to consider what any flagship enrollment induced by the
TTP displaces and also whether there effects on longer-run measures of college persistence.
Third, our data allows us to estimate the effect of the law on a key population of interest –
students in a large urban district with traditionally low college enrollment and a large number of
low-income and minority students. Finally, we use a measure of class rank at the end of 11th
grade, the time when the class rank most commonly reported on college applications is
determined.
3. Institutional Details
The TTP Law was instituted in 1997 in response to Hopwood v. Texas, a case that banned
the use affirmative action in college application decisions. Rather than using explicit race-based
considerations in application decisions, the TTP Law states that students who are ranked in the
TTP of their class must be granted automatic admission to the public Texas college of their
choice. The state grants flexibility to districts in how they choose to calculate GPA and class
rank. However, to receive automatic admission, students must provide a transcript along with
their application that verifies their class rank falls within the TTP. Students must also take either
the SAT or the ACT, although for students in the TTP of their high school class, these tests are
not used for admissions decisions.
For students who are not in the TTP of their high school class, admissions decisions are
based on the usual factors including GPA and class rank, admissions test scores, and non-
academic factors such as personal statements and extracurricular activities. Following the
Grutter v. Bollinger decision in 2003 (which covers most of our study period), the University of
Texas reinstated race-conscious affirmative action. Studies (CITES) that have examined the
transition between the pre- and post-Hopwood admissions regimes indicate that the Texas
flagships did provide racial minorities preferential treatment in admissions decisions prior to the
Hopwood decision and that this ended after the ban on affirmative action went into place.
7
However, there is relatively little research examining whether racial preferences were fully
restored to pre-Hopwood levels following the Grutter decision.
A key consideration for our study is how class rank is defined for the purposes of
determining eligibility for automatic admissions. The way in which class rank is calculated could
vary across schools as state law does not specify how this is to be done. Moreover, both absolute
class rank and the number of students used to determine percentile class rank are not constant
over time. The relevant class rank for determining eligibility for automatic admissions is the one
used at the time of application to college, which might vary across students.
To better understand the process by which the relevant class rank for determining
automatic admissions was calculated, we contacted counselors at each of the high schools in the
district we examine as well as a representative from the district’s central office. Under the
student information system used in the district during our study period, class ranks were
calculated centrally. Both class rank and the total number of students enrolled were calculated at
the end of each semester and given to the Student Records office, which then distributed
transcripts to high school campuses.4
A related issue is that both absolute class rank and the number of students used to
determine percentile class rank are not constant over time. The relevant class rank for
determining eligibility for automatic admissions is the one used at the time of application to
college, which might vary across students. Although students can choose when to apply to
college, the applications to the University of Texas system are due December 1st, and
applications to TAMU are due in the middle of January. At the same time, first semester high
school grades are not released in the district until late January or early February. With senior
grades not available in time for application to flagship colleges, most students will be accepted to
colleges under the TTP Law according to GPA and class rank measured at the end of 11th
grade.
We confirmed with high school counselors in the district that 11th
grade class rank was most
likely to be reported on applications to four-year universities, especially for the flagships which
have relatively early application deadlines.
4 In contrast, other districts allow individual schools to calculate class rank, potentially using different
algorithms to determine absolute class rank and the denominator for calculating percentile rank. In fact,
our study district recently decentralized class rank calculations and now the individual high schools do it
themselves.
8
4. How Eligibility for Automatic Admissions Can Affect Student Outcomes
In the college enrollment process, three distinct decisions take place: students determine
which colleges they will apply to, colleges determine which students they will accept among the
pool of applicants, and students must determine which college to enroll at (if any) among the
colleges they are accepted to. Automatic admissions policies could potentially affect enrollment
and college choice through any of these three processes (Card and Krueger, 2005).
If all students at the TTP cutoff would likely be admitted even without the TTP Law, and
if acceptance rates for students just outside of the TTP are also high, then automatic admissions
might have little “bite” and have minimal effects on student outcomes. In fact, some research
suggests that this may have been the case prior to the adoption of the TTP law (CITES).
However, this reasoning ignores fails to account for the increase in applications to the flagship
universities since the TTP Law went into effect. Today the percentage of acceptances to UT and
TAMU accounted for by TTP students increased from 36 percent to 61 percent, and the recent
efforts of UT to cap the percentage of enrollees who are accepted under the TTP Law provides
further evidence that Texas flagships would be unlikely to accept all top decile applicants in the
absence of the law. Moreover, some research shows that the TTP law expanded the set of high
schools that have students that apply to the flagship universities (Long, Saenz and Tienda, 2010).
If students from these schools have lower college entrance exam scores (and other credentials)
than did the typical pre-TTP Law applicant, the admissions patterns from the period before the
adoption of TTP Law might not reflect the importance of automatic admissions to current
applicants. This is especially important for our study district, which has much lower college-
sending rates than is typical in Texas.
Eligibility for automatic admissions could also increase the likelihood of applying to a
particular school. A number of studies find that as race-based affirmative action policies were
eliminated, the decrease in probability of acceptance for minority students led to lower
application rates to competitive colleges, even among those with relatively high probabilities of
acceptance (Arcidiacono, 2001; Long, 2004; Brown & Hirschman, 2006). By increasing the
probability of acceptance to 100 percent for students who are ranked in the top of their class,
automatic admission policies should increase the number of applications from TTP students.
Even if being in the TTP does not actually increase the probability of acceptance conditional on
applying, the TTP Law makes the admissions guarantee explicit, and this alone could change
9
application behavior if students would not be aware that they had a very high probability of
being accepted without the highly visible TTP Law (Long, Saenz, and Tienda, 2010).
Automatic admission could make it more likely that an admitted student attends a
particular university. Because of the admissions guarantee, students might be induced to seek out
financial aid opportunities earlier and more intensively than they would without the admissions
guarantee. In addition, scholarship programs like the Longhorn and Century Scholarship
programs (established by UT and TAMU, respectively) target students who are in the TTP of
their high school class and who attend schools with large concentrations of economically
disadvantaged students. The offer of automatic admission may also serve to make students feel
welcome at a particular university, which could also increase enrollment conditional on
acceptance.
In addition to considering the ways in which automatic admission could affect enrollment
and college choice, it is also important to think of how these effects could vary across student
subgroups. One of the primary purposes of the TTP Law was to ensure diversity at college
campuses, particularly in Texas flagships were African American and Hispanic students have
historically been under-represented and that accept students from a relatively small number of
high schools throughout Texas (Long, Saenz and Tienda, 2010). Ex ante, though, it is not clear
whether effects of automatic admissions would be larger or smaller for students from more
disadvantaged backgrounds. On one hand, minority students in the district tend to be
concentrated in the high schools that have lower college-sending rates and lower academic
achievement in general. Since these students may have difficulty being admitted without
automatic admissions, effects on outcomes like flagship enrollment might be larger for them. On
the other hand, factors such as credit constraints and lack of information could mitigate the
effects of automatic admission for minority students and students from schools with lower
college-sending rates. These considerations motivate our analysis of the effects by race and also
by whether a student attends a high school that traditionally sends few students to college.
5. Data and Descriptive Statistics
5.1 Data
This paper uses data from a large urban school district in Texas. We focus on graduates
from the 2002 through 2007 graduating cohorts. Data files include administrative data on student
demographics and high school membership, semester course files with grades, high school exit
10
exam scores, and graduation information. Full student-level data are available beginning in 1999,
allowing us to follow all students in our sample throughout high school. District files are
supplemented with college data from the National Student Clearinghouse (NSC), a non-profit
organization that is now the nation’s leading source for postsecondary degree and enrollment
verification. Files are linked using social security numbers and state identifiers.
Our data do not include a class rank measure, and we construct it from the district
student-level data. As noted above, during our study period the class rank included on a student’s
transcript is calculated centrally by the district, and we follow the procedure used by the district
to determine the absolute and percentile rank. First, we compute cumulative GPA at a given time
using grades received in courses taken up to that point. These data come from course enrollment
files that include course numbers and titles for each course in which a student is enrolled, the
grade earned, and course entry and withdrawal dates (where applicable).5 Second, students are
ranked within a school on the basis of cumulative GPA to determine absolute class rank at a
particular time. Finally, the percentile class rank is calculated as the ratio of absolute class rank
to the number of students in a school with a valid cumulative GPA. As described above, the class
rank relevant for automatic admissions to UT-Austin and Texas A&M is the rank at the end of
11th
grade. Therefore, we use this measure in our analysis.
The research design we use depends crucially on having accurate measures of percentile
class rank at the end of 11th
grade. This information is not maintained by the district, but we are
in the process of obtaining information on cumulative GPA’s listed on final transcripts for a
subset of the years of our study period. Although this is not the class rank measure we use in the
analysis, it will still be useful to compare our calculated GPA and class rank to the information
on actual transcripts to see how closely our computed measure is to the “official” measure.6
5 In the district, class rank is based on weighted GPA, with regular courses receiving a weight of 4 for an
“A” and advanced-courses receiving a weight of 5 for an “A”. Grades from “local credit only” courses
and courses that students withdrew from are not included in the GPA calculations. 6 We were able to compare by hand graduation GPA and class rank for one cohort of graduates in one
district high school. Our estimated ranks were almost identical to the ranks kept on file at the school.
Ranks differed slightly for students who had entered the district sometime after the start of high school,
because high school grades prior to entering the district are included in campus GPA calculations, but are
not available in district course enrollment files. To the degree that these late-entering students affect our
class percentile ranks, our estimates of the effect on enrollment will be underestimated. However, these
students represent a relatively small portion of all graduates, particularly those at the top of the GPA
distribution. Although this validation was only done for a subset of schools and students in our analysis,
11
NSC data includes semester-level observations for each NSC-reporting institution that a
student attends, including date of enrollment and completion, level of enrollment (e.g. part-time,
full-time). More than 92 percent of higher education institutions in the United States report to the
NSC. We construct several outcomes using the NSC data. First, we look at short-run college
enrollment and choice measures, focusing on the fall following graduation. The NSC data is
supplemented with IPEDs data to identify competitiveness (based on Barron’s ranking),
selectivity (defined as the percent of applicants admitted), public or private funding structure,
and state in which the college is located. Next, we look at persistence measures including year-
by-year enrollment up to four years after high school graduation, total semesters enrolled in
college four years after graduation, and transferring to a more (or less) selective college.
The final data source used includes SAT and ACT on attempts and scores. Most four-
year colleges require students to take the SAT or ACT as part of the application process. In
addition, Even though TTP students are not accepted based on college exam scores, they still
must submit documentation indicating that fulfilled the requirement. Data for all three exams is
available from 2004 through 2011. Since these data are not available for all cohorts in our study,
we do not use this as a control variable in the analysis, but we do show college entrance exam
taking rates in descriptive statistics.
The sample used in the analysis consists of students who graduated from a district high
school between 2002 and 2008. We limit the analysis to graduates because the district only
obtained college enrollment data from NSC for high school graduates. One concern with doing
so is that it might impart selection bias if TTP status at the end of 11th
grade affects the
probability of graduation. However as we discuss below, there is no evidence for this type of
effect. We also exclude students who did not have valid GPA’s at the end of 11th
grade (for
instance, students who transfer into the district in 12th
grade) since our empirical strategy relies
on using 11th
grade percentile class rank as the running variable in the regression discontinuity
estimation. Our final sample includes 17,057 students across the 7 cohorts.
5.2 Descriptive Statistics
Table 1 provides descriptive statistics for our analysis sample by TTP status. We also
show results stratified by whether a student attended a school with a higher or lower college-
we think this lends support to the validity of our class rank measure because class rank is calculated
centrally by the district throughout our study period and for all schools.
12
sending rate among its graduates. The results indicate that TTP students are more likely to be
white and female, and are less likely to be economically disadvantaged. As expected, TTP
students are higher performing across all measures of academic achievement. Students in the
TTP are more likely to graduate with a recommended or distinguished diploma, take a college
entrance exam, and have much higher exit exam scores. These patterns are found in both types of
high schools, although higher college-sending schools serve students from higher socioeconomic
backgrounds and have much better academic achievement.
TTP students have substantially higher college-going rates than students outside the TTP.
Overall, almost 60 percent of students in the TTP attend college in the fall following graduation
compared to only 26 percent among students in the bottom 90 percent. These differences are
especially stark for flagship university enrollment, with 21 percent of TTP students attending a
flagship (or about one-in-three students who enroll in college) compared to only 1 percent from
among the bottom 90 percent. However, sizable differences also exist for enrollment at private
and out-of-state institutions, which suggests that the causal effect of being in the TTP on flagship
enrollment is at most only a portion of the raw difference in flagship enrollment for TTP and
non-TTP students.
Two other patterns bear mentioning. First, only 10 percent of TTP students in the lower-
sending high schools enroll in a flagship, compared to almost 30 percent in the higher-sending
schools. This difference motivates our examination of heterogeneity in the effects of being in the
TTP between these types of high schools. Second, college-sending rates overall in the district are
low. Statewide during our study period, the percent of high school graduates enrolled in college
in the fall following graduation ranged from 52 to 56 percent (THECB, 2010), but only 30
percent of graduates in this district enroll in college. Even in the high schools that send large
numbers of students to college relative to the district overall, only 37 percent of graduates enroll
in college.
6. Methods
6.1 Research Design
The goal of this paper is to estimate the effect of being eligible for automatic admission
to the Texas public universities via membership in the top decile of one’s high school class. The
empirical challenge we face stems from the differences between TTP students and those with
13
lower class rank, some of which are documented in Table 1. To credibly estimate the effect of
being in the TTP, we use an approach that mimics randomly assigning placement into the TTP.
Specifically, we employ a regression discontinuity research design that relies on comparisons
between students whose class rank is just above or below the 90th
percentile. As demonstrated by
Lee (2008), as long as students cannot exert complete control over their exact class rank (i.e.,
there is some randomness in class rank at the point when students apply to college), whether a
student falls just above or below the TTP class rank threshold is “as good as” random, and
students on either side of the threshold should be similar in all respects other than one being in
the top decile and the other not.
To formalize these ideas considering the following model for some outcome, Yi (e.g.,
enrollment in a Texas flagship university):
(1) Yi = θTTPi + f(CRi) + Xiβ + ei
Where CRi is the ranking of student i her high school class (measured as the fraction of students
ranked above student i), TTPi is an indicator variable equal to 1 if a student is in the TTP of her
class (i.e., Ti = 1(CRi<.10)), Xi is a vector of observable covariates, and ei is a random
disturbance term. The function f(·) is a flexible function of class rank that captures the
relationship between the outcome and class rank away from the ten percent cutoff.
The key assumption underlying our approach is that falling just above or below the ten
percent cutoff is not systematically related to other factors that affect the outcomes of interest
(i.e., ei). The primary threat to the research design is that students manipulate their class rank in
order to just get above the ten percent cutoff.7 While students may alter the mix of courses they
take and petition for better grades in order to increase their chances of being in the top decile of
their class, course performance is at least somewhat uncertain and students are unlikely to have
perfect information about exactly what their classmate’s GPA will be. This makes it unlikely that
students can manipulate their exact class rank with the precision necessary to undermine our
empirical strategy.
7 The other main way the research design could be undermined is if school officials manipulate the
calculation of class rank to increase the number of its students eligible for automatic admissions via the
TTP plan. However, as described above, during our study period class rank was calculated at the district
central office using an automated procedure, so we do not think this type of gaming was empirically
important during the time covered by our analysis.
14
In addition to being credible on a priori grounds, the assumptions underlying the research
design can be tested by examining baseline covariates and examining whether they “trend
smoothly” through the ten percent cutoff (Lee, 2008; Imbens and Lemieux, 2008) and whether
the distribution of class rank is discontinuous at the ten percent cutoff. Below we show evidence
consistent with the identification assumptions we make. We also report results from
specifications that include controls for baseline covariates, which should improve the precision
of the estimates and have little effect on the point estimates if the controls are “balanced” on
either side of the cutoff.
6.2 Estimation
Obtaining consistent estimates of the discontinuity in a given outcome depends crucially
on modeling f(.) in Equation 1 appropriately. We follow the suggestion of Imbens and Lemieux
(2008) and Imbens and Kalyanaraman (2009) and use local linear regression in a bandwidth
around the TTP cutoff, where the slopes are allowed to differ for students below and above the
90th
percentile cutoff.8 To assess the sensitivity of bandwidth choice, we report estimates from
three different specifications. The first two are OLS local linear regression models with a
bandwidth of either 10 or 5 percentile ranking points. The third is the estimator proposed by
Imbens and Kalyanaraman (2009; henceforth IK) that uses weighted local linear regression and a
data-driven bandwidth choice.
To further assess which specification is most trustworthy for a given outcome, we also
present graphical evidence showing the regression fit and local means. The degree to which the
regression fit “tracks” the local means near the cut point is informative about whether the
estimated discontinuity is being driven by misspecification of f(.). If the regression fit tracks the
underlying data well, then it provides reassurance that the estimated discontinuities are reliable.
5.3 Interpretation
Our approach is designed to produce internally valid estimates of the effect of being in
the top decile. As noted above, any effects could be operating by changing the likelihood of
applying to a particular university, the probability of acceptance conditional on application, or
the probability of enrollment conditional on acceptance. We are not able to distinguish from
among these mechanisms since we only observe enrollment outcomes and not application nor
8 Because the range of percentile class rank values above the 90
th percentile cutoff is relatively small, we
do not report estimates from “global polynomial” models that use the complete range of class rank and
control for a polynomial in class rank.
15
admissions decisions. Thus, our estimates should be thought as the reduced-form effect of barely
being in the TTP at a time when state law guaranteed automatic admission for students in the top
decile of their high school class.
While eligibility for automatic admission to the Texas public universities is the most
noteworthy consequence of being in the TTP, as described above, the policy in place in Texas
during this time included outreach efforts that targeted students in the TTP, especially at schools
that serve large number of disadvantaged students and where students are eligible to apply for
Longhorn or Century scholarships. This outreach may have had independent effects on college
enrollment by, for instance, increasing information about college. As a result, our results should
be interpreted as estimates of the combined effect of automatic admission and the accompanying
outreach efforts that are part of the Texas TTP Law.9
In addition, as with any regression discontinuity design, our estimates are “local” to the
cutoff; specifically, they capture a weighted average of individual-level effects where the
weights are a function of the probability of being at the ten percent cutoff (Lee, 2008). In this
case, the effect near the cutoff has considerable policy relevance. This is because the controversy
surrounding the TTP Law largely stems from the perception that the law lets “under-qualified”
students gain admission to the most selective universities, and our estimates shed light on the
students for whom this claim is most relevant. Moreover, our results are informative about the
likely consequences of a change in the automatic admissions cutoff, such as that which went into
effect at UT Austin in the fall of 2011.
7. Results
7.1 Tests of the Identification Assumptions
As described in the preceding section, the assumptions underlying our research design
can be tested by examining whether baseline covariates exhibit discontinuous changes at the ten
percent cutoff. Table 2 demonstrates that discontinuity estimates for the baseline covariates are
generally small in magnitude and only one estimate is statistically significant (reading, in the
bandwidth of 10 specification), and there are no covariates for which we found statistically
9 There may be other benefits to being in the TTP not related to the Texas TTP plan. For instance, some
scholarships may be offered to students if they are in the TTP of their class. During our study period
Texas had no such statewide policy and we do not know of any other examples at the main schools
attended by students in our sample. Nonetheless, if there are such effects, then our estimates capture the
“reduced form” effect of the TTP policy provisions and any other benefits of being in the TTP.
16
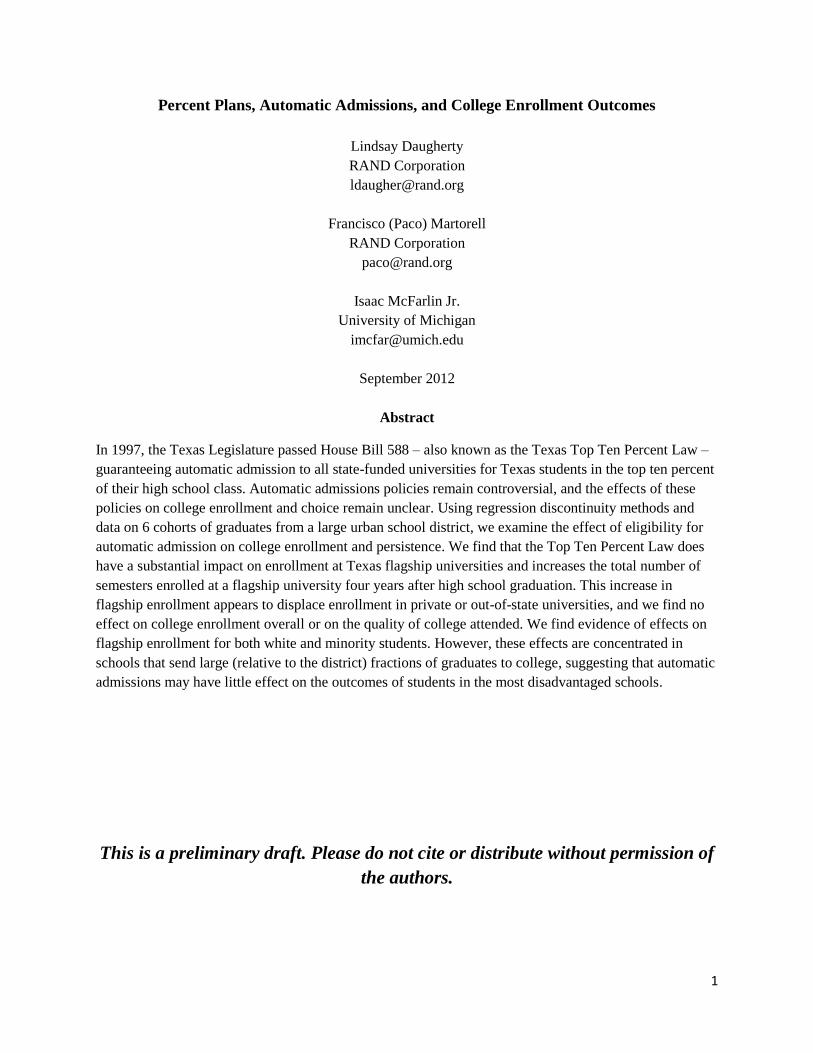
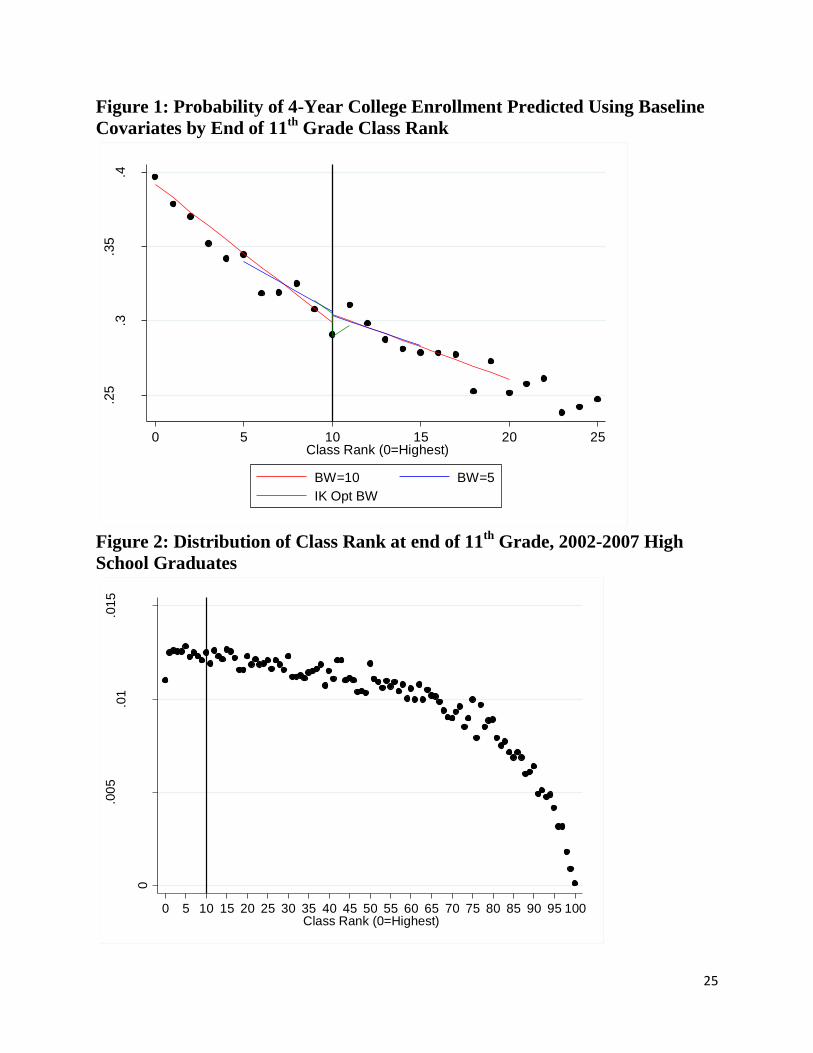
significant discontinuities across all specifications.10
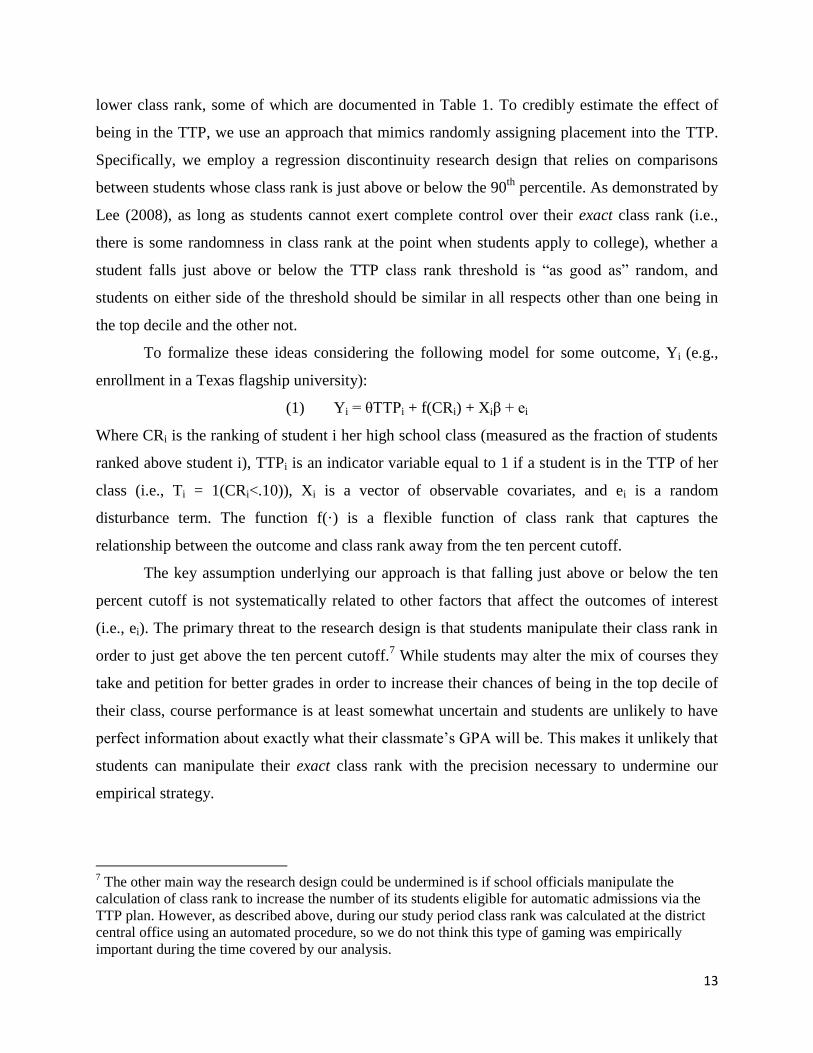
As a summary measure of all of the
covariates, we predicted the probability of 4-year college enrollment as a function of baseline
covariates, which places most weight on covariates which are relevant predictors of the college
enrollment outcomes of interest. The estimated discontinuities in this variable are small and
statistically insignificant. A fact confirmed by the visual evidence in Figure 1.
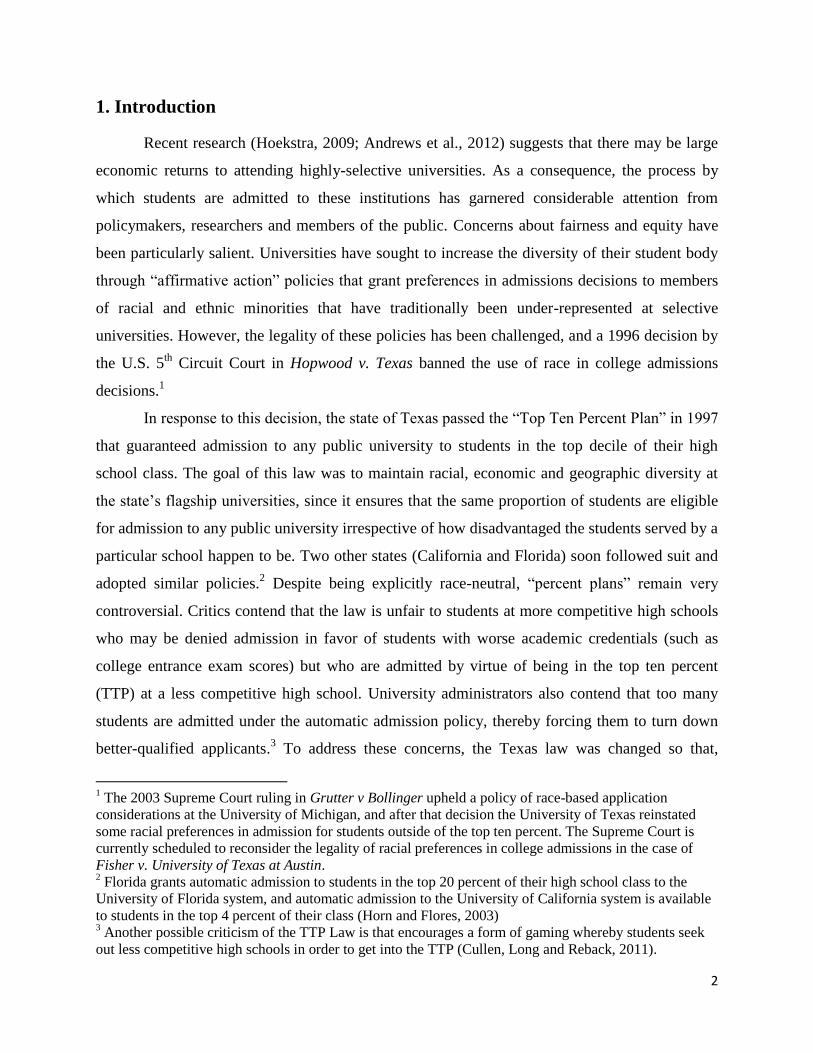
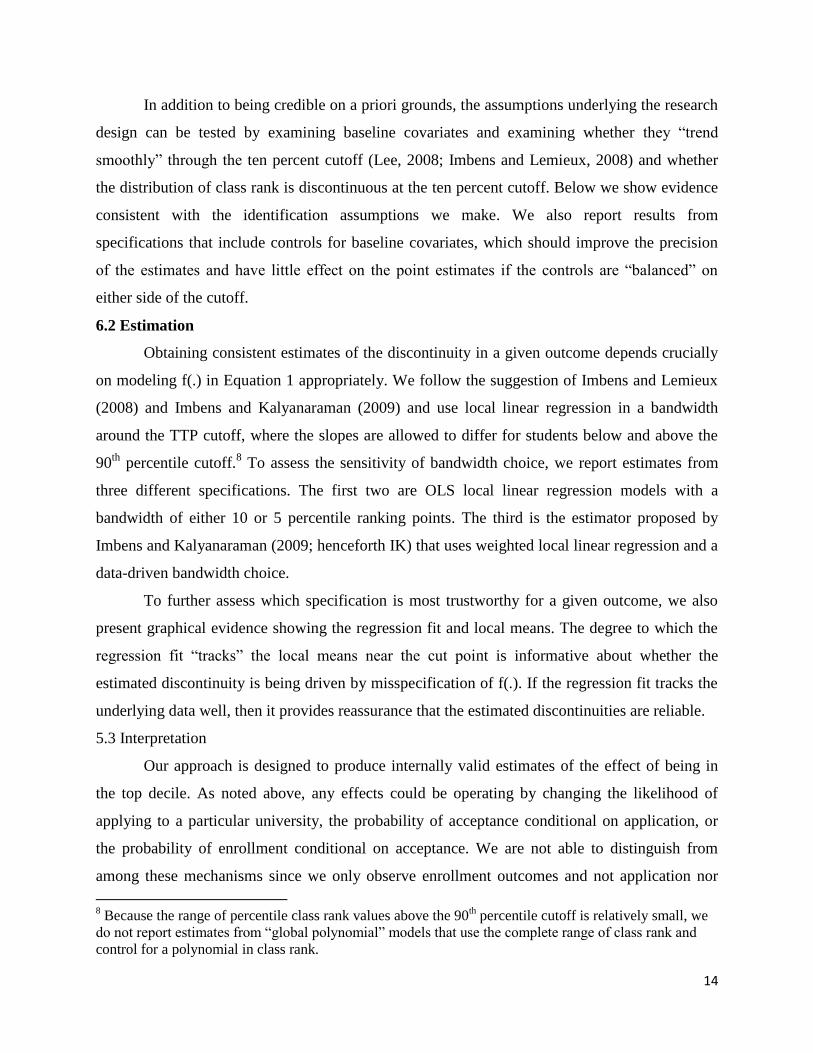
A second test of the identification assumption is to examine whether the distribution of
class rank is continuous at the cut point (McCrary, 2008). Among all students for whom we
observe an end of 11th
grade class rank, the distribution of class rank is uniformly distributed by
construction (at least within a school). However, the distribution of class rank is not uniform in
the sample we use for the analysis because we exclude students who do not graduate. If
graduation is affected end of 11th
grade TTP status, our research design would be threatened.
Such an effect would manifest itself in a discontinuity in the distribution of class rank at the TTP
cutoff. In contrast, Figure 2 reveals no indication of any discontinuity in the distribution of class
rank at the TTP cutoff.
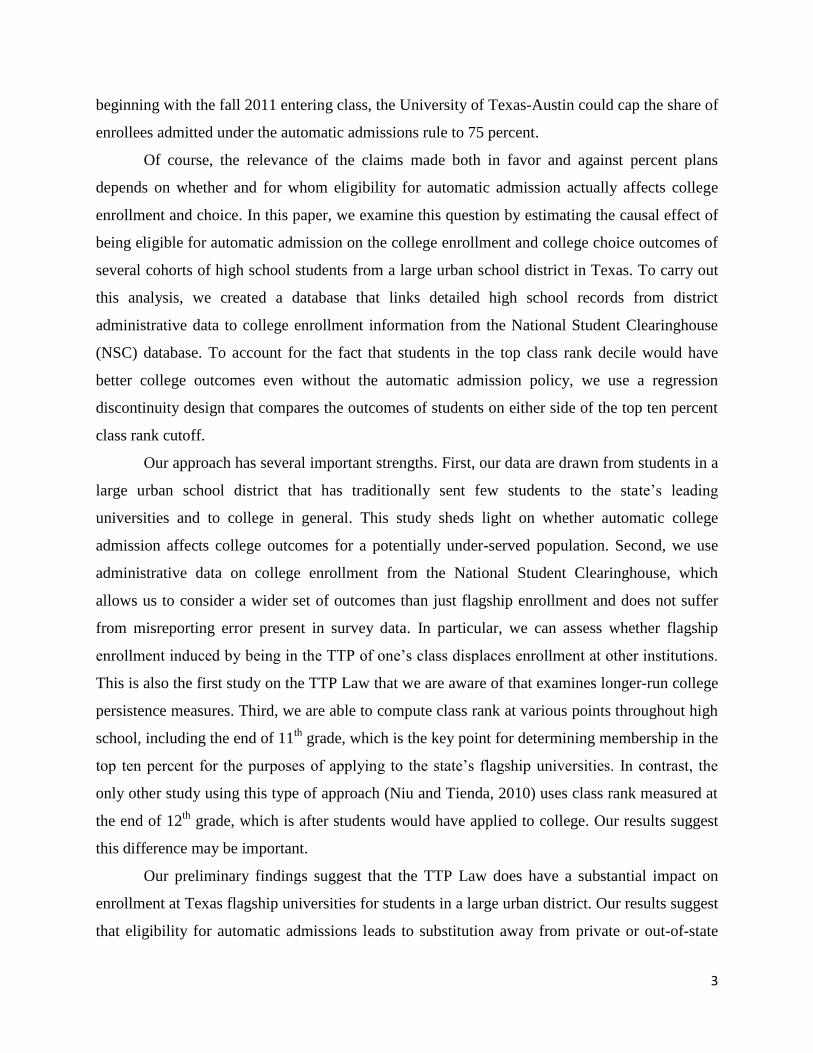
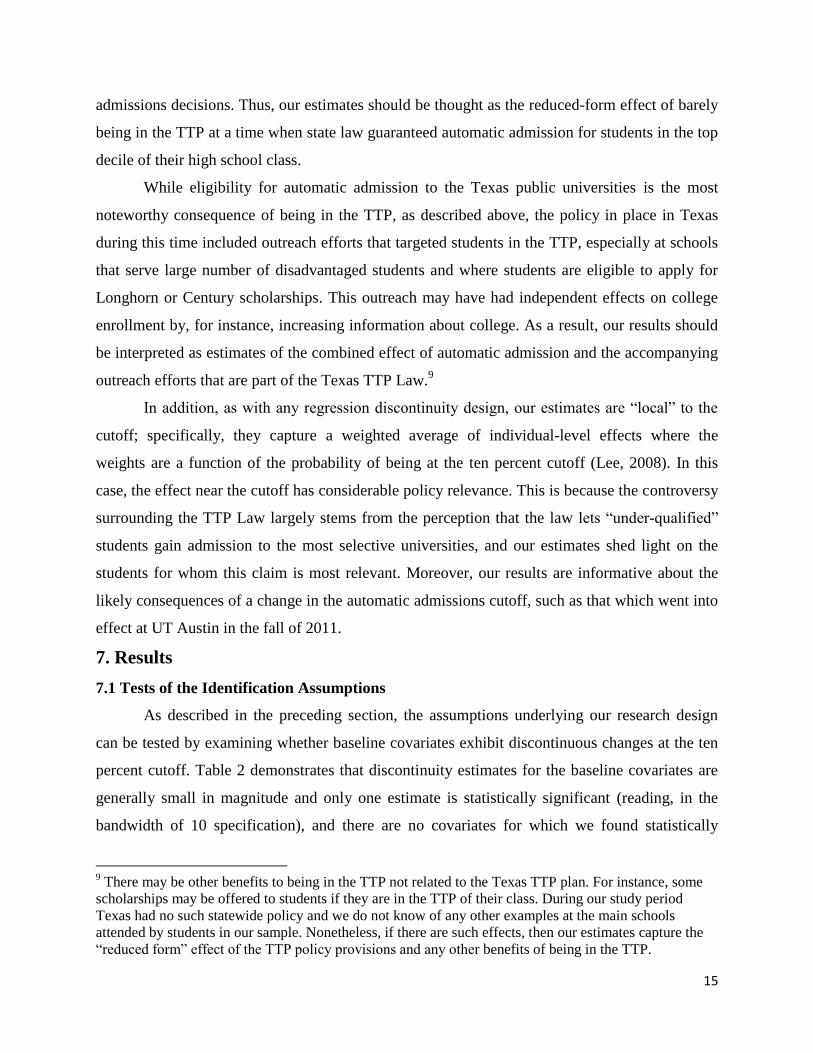
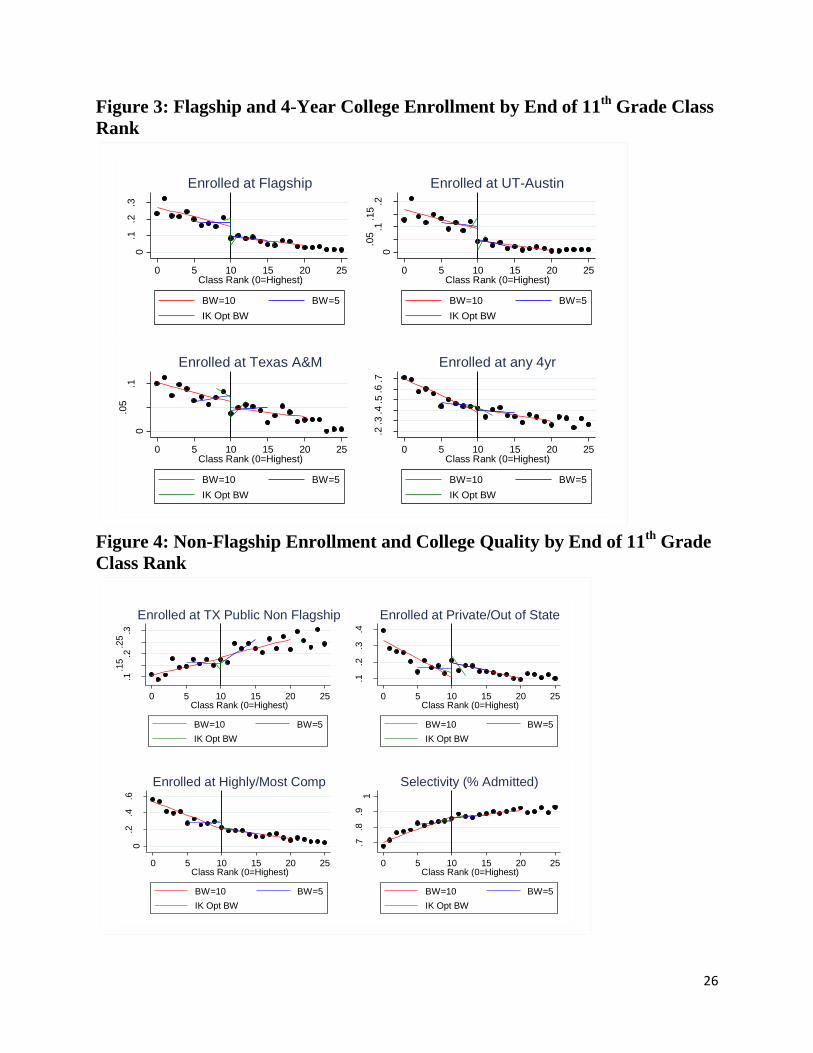
7.2 Effects on College Enrollment and Choice
Table 3 presents the estimates of the effect of being in the TTP on college enrollment and
college choice outcomes. As mentioned previously, all of these outcomes refer to enrollment in
the fall following graduation from high school. The results indicate that membership in the TTP
does increase flagship enrollment. The estimates range from about 6 percentage points in the
model with a bandwidth of 10 to 16.5 percentage points in the IK specification, which uses a
very narrow bandwidth. This variability indicates the magnitude of the effect is somewhat
sensitive to the model specification. This is consistent with Figure 3, which shows the regression
fit and local averages (in bins 1 percentile point wide). There is strong visual evidence of a
discontinuity in the flagship enrollment rate, but the magnitude does depend on the bandwidth.
We then examine which of the two flagships drives this effect. The results in Table 3 and Figure
3 indicate that most of the effect on flagship enrollment from being in the TTP is due to an
10
Further support for the view that the estimate for the reading exit exam score is not indicative of
manipulation of the class rank variable can be found by looking at math scores. If students were
systematically sorting around the cutoff, then we would expect to see estimated discontinuities having the
same sign in both exit exam subjects. Instead, the estimates for math and reading have opposite signs in
two out of three specifications.
17
increase in the probability of attending UT-Austin, as the estimates for Texas A&M are smaller
in magnitude and not statistically significant.
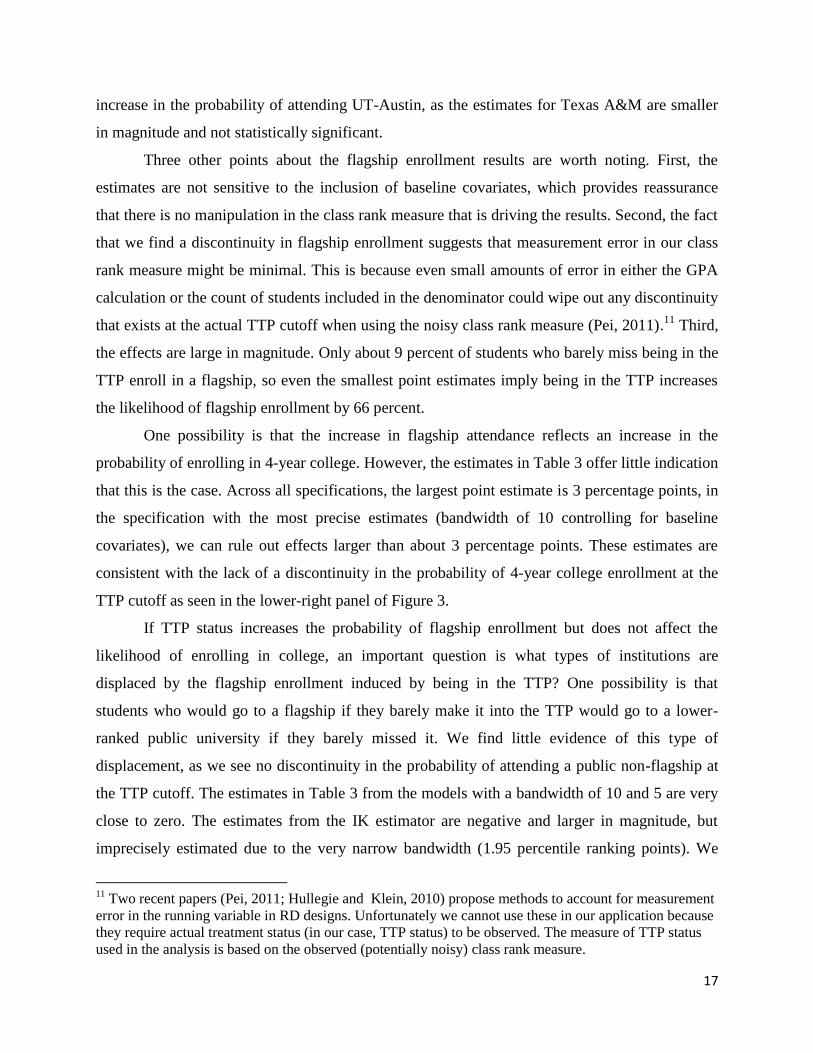
Three other points about the flagship enrollment results are worth noting. First, the
estimates are not sensitive to the inclusion of baseline covariates, which provides reassurance
that there is no manipulation in the class rank measure that is driving the results. Second, the fact
that we find a discontinuity in flagship enrollment suggests that measurement error in our class
rank measure might be minimal. This is because even small amounts of error in either the GPA
calculation or the count of students included in the denominator could wipe out any discontinuity
that exists at the actual TTP cutoff when using the noisy class rank measure (Pei, 2011).11
Third,
the effects are large in magnitude. Only about 9 percent of students who barely miss being in the
TTP enroll in a flagship, so even the smallest point estimates imply being in the TTP increases
the likelihood of flagship enrollment by 66 percent.
One possibility is that the increase in flagship attendance reflects an increase in the
probability of enrolling in 4-year college. However, the estimates in Table 3 offer little indication
that this is the case. Across all specifications, the largest point estimate is 3 percentage points, in
the specification with the most precise estimates (bandwidth of 10 controlling for baseline
covariates), we can rule out effects larger than about 3 percentage points. These estimates are
consistent with the lack of a discontinuity in the probability of 4-year college enrollment at the
TTP cutoff as seen in the lower-right panel of Figure 3.
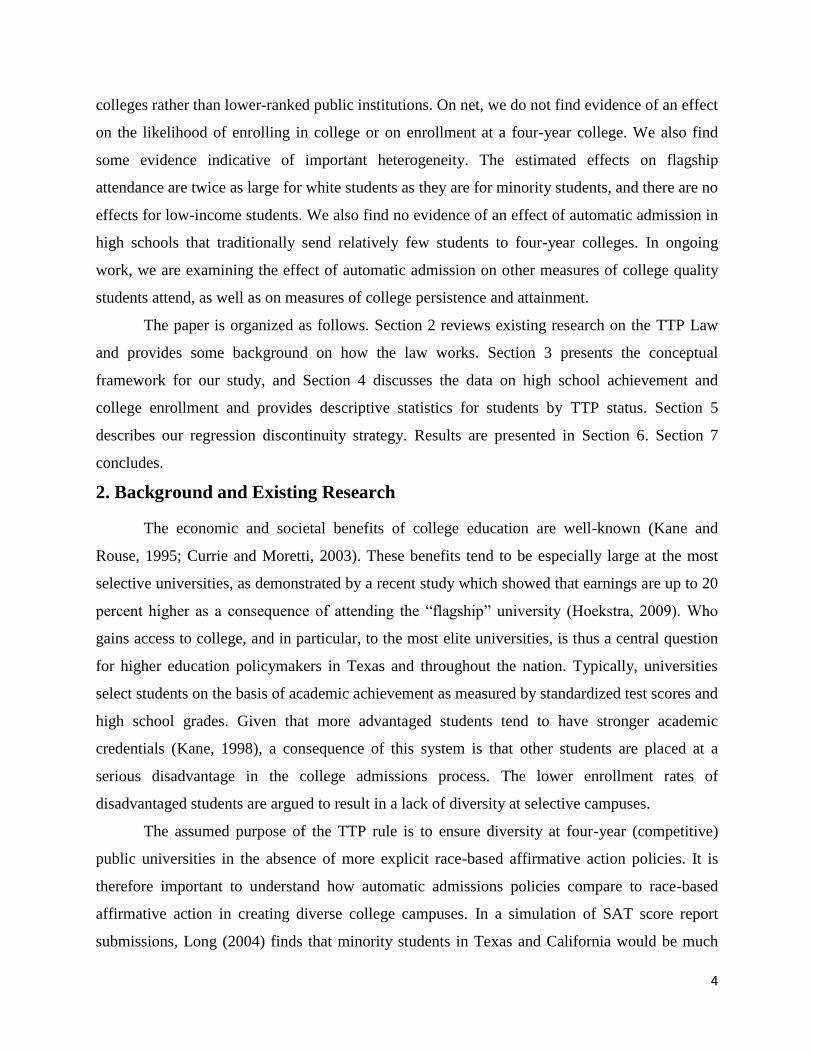
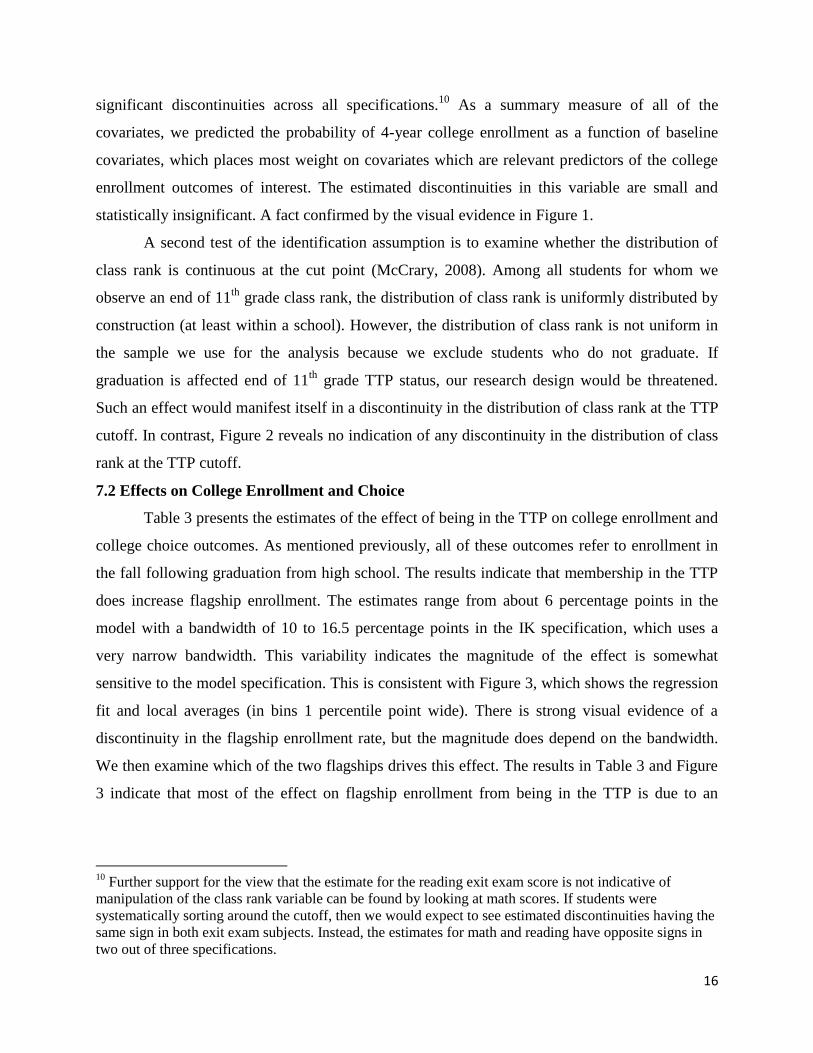
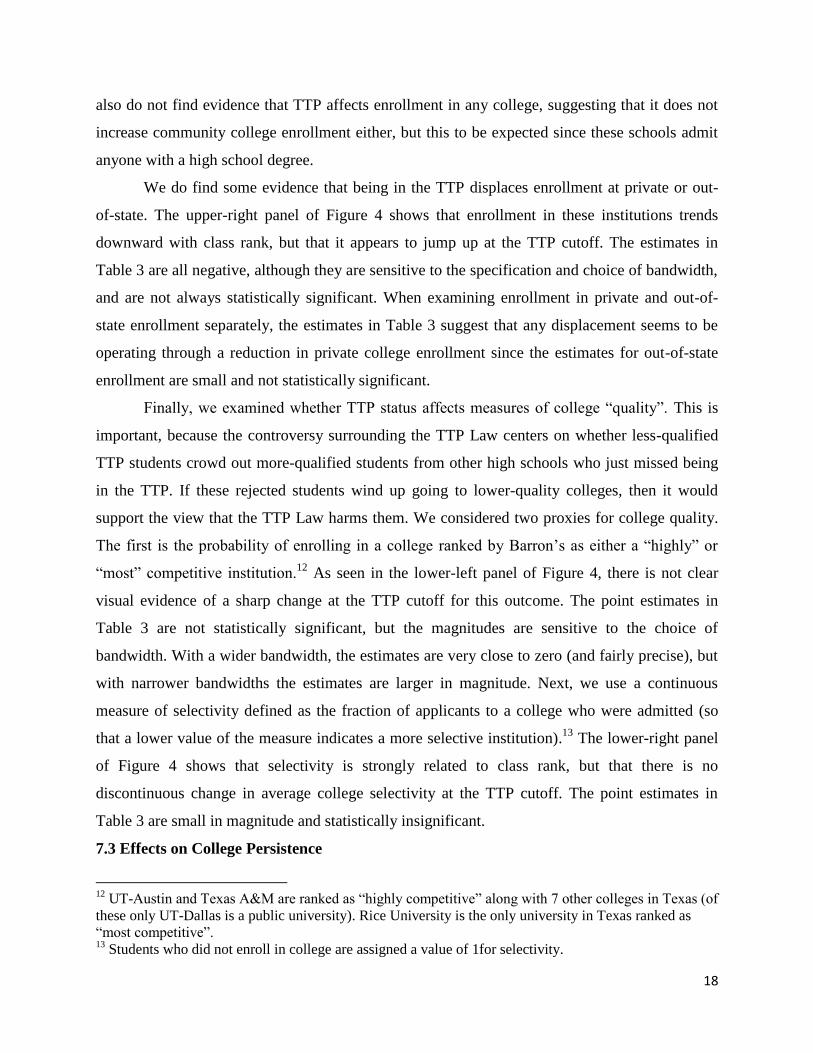
If TTP status increases the probability of flagship enrollment but does not affect the
likelihood of enrolling in college, an important question is what types of institutions are
displaced by the flagship enrollment induced by being in the TTP? One possibility is that
students who would go to a flagship if they barely make it into the TTP would go to a lower-
ranked public university if they barely missed it. We find little evidence of this type of
displacement, as we see no discontinuity in the probability of attending a public non-flagship at
the TTP cutoff. The estimates in Table 3 from the models with a bandwidth of 10 and 5 are very
close to zero. The estimates from the IK estimator are negative and larger in magnitude, but
imprecisely estimated due to the very narrow bandwidth (1.95 percentile ranking points). We
11
Two recent papers (Pei, 2011; Hullegie and Klein, 2010) propose methods to account for measurement
error in the running variable in RD designs. Unfortunately we cannot use these in our application because
they require actual treatment status (in our case, TTP status) to be observed. The measure of TTP status
used in the analysis is based on the observed (potentially noisy) class rank measure.
18
also do not find evidence that TTP affects enrollment in any college, suggesting that it does not
increase community college enrollment either, but this to be expected since these schools admit
anyone with a high school degree.
We do find some evidence that being in the TTP displaces enrollment at private or out-
of-state. The upper-right panel of Figure 4 shows that enrollment in these institutions trends
downward with class rank, but that it appears to jump up at the TTP cutoff. The estimates in
Table 3 are all negative, although they are sensitive to the specification and choice of bandwidth,
and are not always statistically significant. When examining enrollment in private and out-of-
state enrollment separately, the estimates in Table 3 suggest that any displacement seems to be
operating through a reduction in private college enrollment since the estimates for out-of-state
enrollment are small and not statistically significant.
Finally, we examined whether TTP status affects measures of college “quality”. This is
important, because the controversy surrounding the TTP Law centers on whether less-qualified
TTP students crowd out more-qualified students from other high schools who just missed being
in the TTP. If these rejected students wind up going to lower-quality colleges, then it would
support the view that the TTP Law harms them. We considered two proxies for college quality.
The first is the probability of enrolling in a college ranked by Barron’s as either a “highly” or
“most” competitive institution.12
As seen in the lower-left panel of Figure 4, there is not clear
visual evidence of a sharp change at the TTP cutoff for this outcome. The point estimates in
Table 3 are not statistically significant, but the magnitudes are sensitive to the choice of
bandwidth. With a wider bandwidth, the estimates are very close to zero (and fairly precise), but
with narrower bandwidths the estimates are larger in magnitude. Next, we use a continuous
measure of selectivity defined as the fraction of applicants to a college who were admitted (so
that a lower value of the measure indicates a more selective institution).13
The lower-right panel
of Figure 4 shows that selectivity is strongly related to class rank, but that there is no
discontinuous change in average college selectivity at the TTP cutoff. The point estimates in
Table 3 are small in magnitude and statistically insignificant.
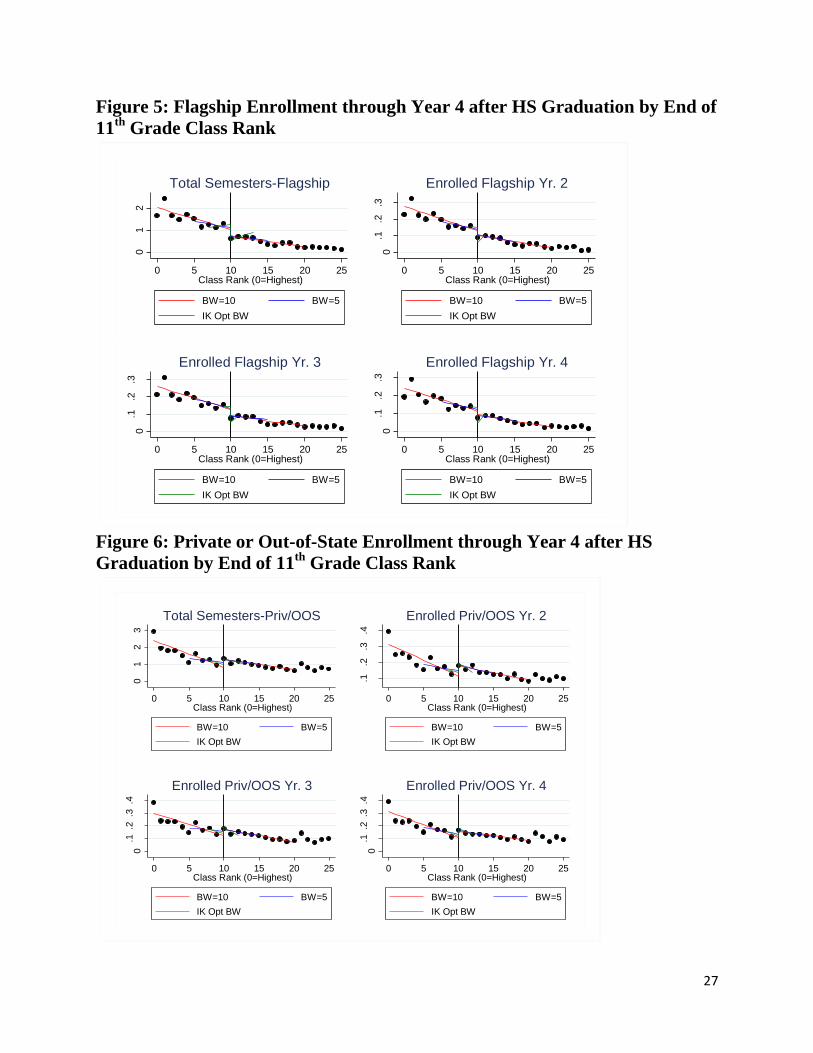
7.3 Effects on College Persistence
12
UT-Austin and Texas A&M are ranked as “highly competitive” along with 7 other colleges in Texas (of
these only UT-Dallas is a public university). Rice University is the only university in Texas ranked as
“most competitive”. 13
Students who did not enroll in college are assigned a value of 1for selectivity.
19
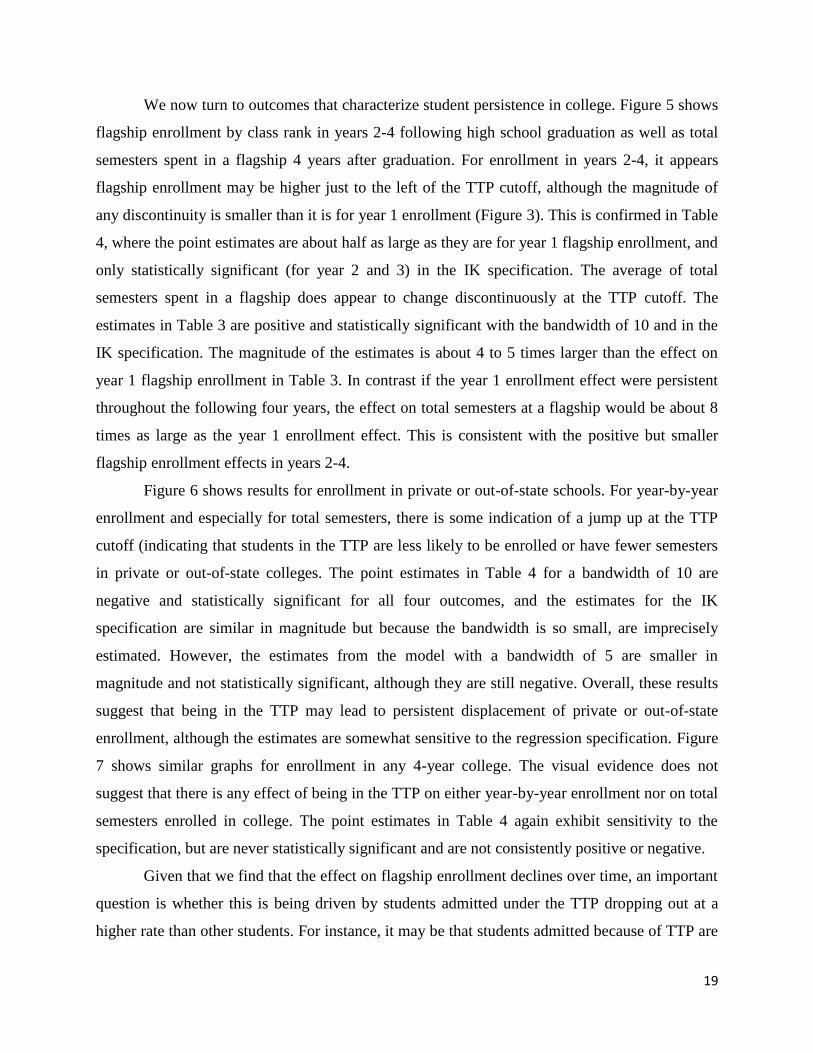
We now turn to outcomes that characterize student persistence in college. Figure 5 shows
flagship enrollment by class rank in years 2-4 following high school graduation as well as total
semesters spent in a flagship 4 years after graduation. For enrollment in years 2-4, it appears
flagship enrollment may be higher just to the left of the TTP cutoff, although the magnitude of
any discontinuity is smaller than it is for year 1 enrollment (Figure 3). This is confirmed in Table
4, where the point estimates are about half as large as they are for year 1 flagship enrollment, and
only statistically significant (for year 2 and 3) in the IK specification. The average of total
semesters spent in a flagship does appear to change discontinuously at the TTP cutoff. The
estimates in Table 3 are positive and statistically significant with the bandwidth of 10 and in the
IK specification. The magnitude of the estimates is about 4 to 5 times larger than the effect on
year 1 flagship enrollment in Table 3. In contrast if the year 1 enrollment effect were persistent
throughout the following four years, the effect on total semesters at a flagship would be about 8
times as large as the year 1 enrollment effect. This is consistent with the positive but smaller
flagship enrollment effects in years 2-4.
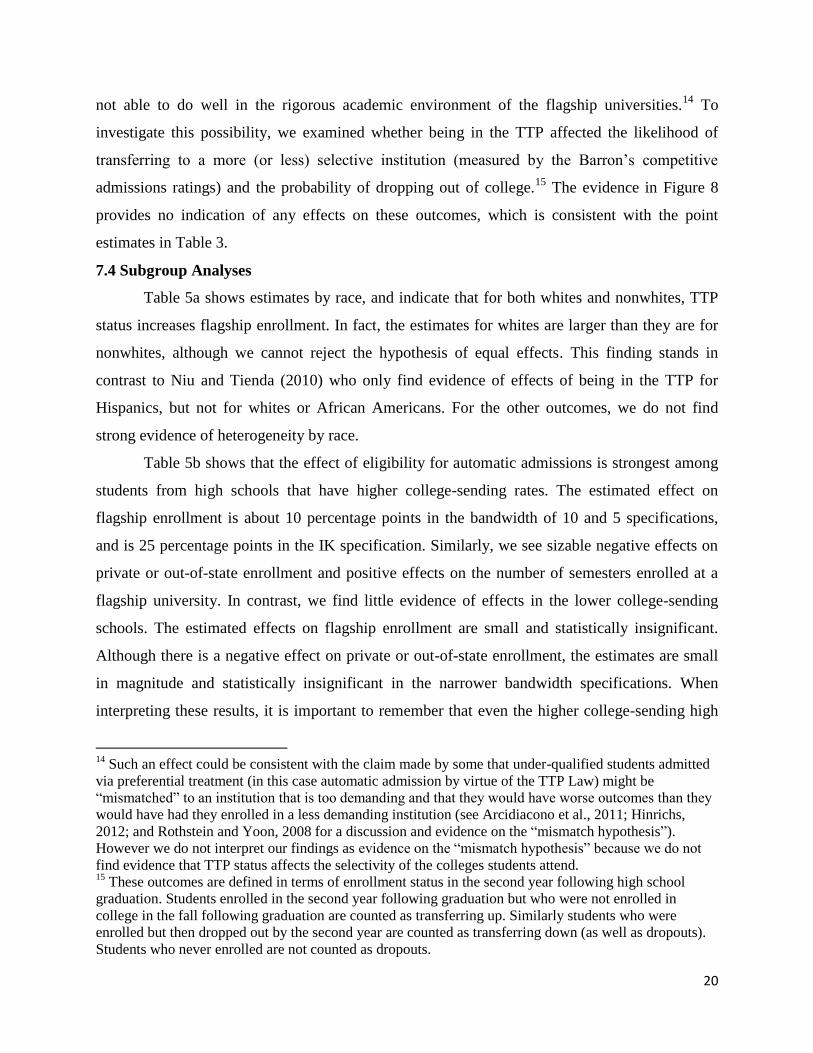
Figure 6 shows results for enrollment in private or out-of-state schools. For year-by-year
enrollment and especially for total semesters, there is some indication of a jump up at the TTP
cutoff (indicating that students in the TTP are less likely to be enrolled or have fewer semesters
in private or out-of-state colleges. The point estimates in Table 4 for a bandwidth of 10 are
negative and statistically significant for all four outcomes, and the estimates for the IK
specification are similar in magnitude but because the bandwidth is so small, are imprecisely
estimated. However, the estimates from the model with a bandwidth of 5 are smaller in
magnitude and not statistically significant, although they are still negative. Overall, these results
suggest that being in the TTP may lead to persistent displacement of private or out-of-state
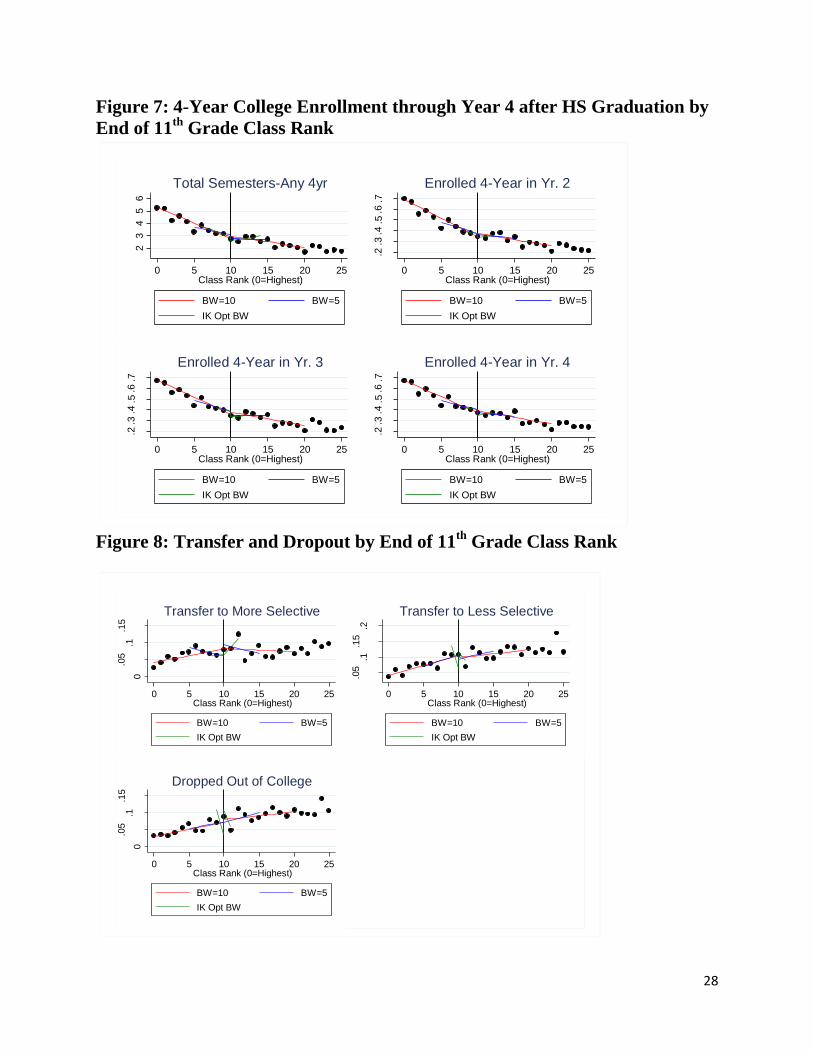
enrollment, although the estimates are somewhat sensitive to the regression specification. Figure
7 shows similar graphs for enrollment in any 4-year college. The visual evidence does not
suggest that there is any effect of being in the TTP on either year-by-year enrollment nor on total
semesters enrolled in college. The point estimates in Table 4 again exhibit sensitivity to the
specification, but are never statistically significant and are not consistently positive or negative.
Given that we find that the effect on flagship enrollment declines over time, an important
question is whether this is being driven by students admitted under the TTP dropping out at a
higher rate than other students. For instance, it may be that students admitted because of TTP are
20
not able to do well in the rigorous academic environment of the flagship universities.14
To
investigate this possibility, we examined whether being in the TTP affected the likelihood of
transferring to a more (or less) selective institution (measured by the Barron’s competitive
admissions ratings) and the probability of dropping out of college.15
The evidence in Figure 8
provides no indication of any effects on these outcomes, which is consistent with the point
estimates in Table 3.
7.4 Subgroup Analyses
Table 5a shows estimates by race, and indicate that for both whites and nonwhites, TTP
status increases flagship enrollment. In fact, the estimates for whites are larger than they are for
nonwhites, although we cannot reject the hypothesis of equal effects. This finding stands in
contrast to Niu and Tienda (2010) who only find evidence of effects of being in the TTP for
Hispanics, but not for whites or African Americans. For the other outcomes, we do not find
strong evidence of heterogeneity by race.
Table 5b shows that the effect of eligibility for automatic admissions is strongest among
students from high schools that have higher college-sending rates. The estimated effect on
flagship enrollment is about 10 percentage points in the bandwidth of 10 and 5 specifications,
and is 25 percentage points in the IK specification. Similarly, we see sizable negative effects on
private or out-of-state enrollment and positive effects on the number of semesters enrolled at a
flagship university. In contrast, we find little evidence of effects in the lower college-sending
schools. The estimated effects on flagship enrollment are small and statistically insignificant.
Although there is a negative effect on private or out-of-state enrollment, the estimates are small
in magnitude and statistically insignificant in the narrower bandwidth specifications. When
interpreting these results, it is important to remember that even the higher college-sending high
14
Such an effect could be consistent with the claim made by some that under-qualified students admitted
via preferential treatment (in this case automatic admission by virtue of the TTP Law) might be
“mismatched” to an institution that is too demanding and that they would have worse outcomes than they
would have had they enrolled in a less demanding institution (see Arcidiacono et al., 2011; Hinrichs,
2012; and Rothstein and Yoon, 2008 for a discussion and evidence on the “mismatch hypothesis”).
However we do not interpret our findings as evidence on the “mismatch hypothesis” because we do not
find evidence that TTP status affects the selectivity of the colleges students attend. 15
These outcomes are defined in terms of enrollment status in the second year following high school
graduation. Students enrolled in the second year following graduation but who were not enrolled in
college in the fall following graduation are counted as transferring up. Similarly students who were
enrolled but then dropped out by the second year are counted as transferring down (as well as dropouts).
Students who never enrolled are not counted as dropouts.
21
schools in the district have relatively low college-sending rates relative to the state as a whole.
Nonetheless, these results indicate that eligibility for automatic admissions may have little effect
on college enrollment and choice for the most disadvantaged urban high schools.
8. Conclusion
The TTP Law and automatic admissions policies in other states present an alternative to
race-conscious affirmative action policies in a climate where there is significant debate over the
legality and fairness of more explicit race-based affirmative action. Even still, they are quite
controversial since some perceive them as giving unfair advantage to arguably less-qualified
students who attend less competitive high schools.
In this paper, we estimated the impact of barely being in the top decile of one’s high
school class on college enrollment and choice outcomes using data from a large urban school
district in Texas. We used regression discontinuity methods to allow us to isolate the causal
impact of being eligible for automatic admissions by comparing the outcomes of students who
just made the cutoff for the TTP and those who just missed the cutoff. Our findings provide
evidence that membership in the TTP at the end of 11th
grade, the point at which the class rank
that is reported on most applications to selective colleges is determined, does affect college
choice decisions. In particular, students barely above the TTP cutoff are more likely to attend
flagship universities than are those who just miss the cutoff, and that after four years, enroll in
more cumulative semesters at flagship universities. Our results also suggest that eligibility for
automatic admissions to the flagship universities displaces attendance at private or out-of-state
institutions. The net effect on college enrollment or four-year college enrollment and attainment
is small and statistically insignificant. Moreover, we do not find effects on college “quality” as
measured by Barron’s rankings or the percent of applicant who are admitted to a particular
school. Taken together, these results suggests that students who miss the TTP cutoff still are able
to attend “good” colleges even if they do not attend flagship universities.
When we examine whether these effects vary by policy-relevant subgroups, we find that
these effects are present for both whites and nonwhites. However, the effects are strongest in
schools that send a large (relative to the district) percent of its graduates to college. This suggests
that eligibility for automatic admissions may not have much effect on the outcomes of students
in the most disadvantaged schools.
22
When considering these findings two important factors are important to keep in mind.
First, our estimates are based on data for only one district in Texas. However, since it serves
large numbers of lower-income and minority students, one of the TTP Law’s main intended
beneficiaries, our results still have considerable policy significance. However, our findings
cannot speak to the effects of the TTP Law on enrollment at competitive universities for
graduates from other districts across the state, in particular for students in affluent districts and
high schools. Nonetheless, the fact that students in our study district likely face larger barriers to
enrolling in high-quality colleges suggest that our finding that being in the TTP does not
appreciably improve the average selectivity of the college students attend may also be true in
higher-income districts. Second, due to the research design we use, the estimates pertain only to
students with class ranks that fall close to the TTP cutoff. This is also a policy relevant subgroup,
as they are the ones who stand to gain the most from automatic admissions since they likely have
the weakest credentials of students in the TTP. These results are also informative about the
students likely to be affected from small changes in the automatic admissions cutoff such as the
one that UT-Austin instituted in 2011. Finally, our study focuses on comparing students who are
and are not eligible for automatic admission in a regime where all students are subject to the TTP
law, our estimates are not directly informative about the effect of having a TTP policy.
23
References
Andrews, R.J., Li, J., and Lovenheim, M. (2012). Quantile Treatment Effects of College Quality
on Earnings: Evidence from Administrative Data in Texas. NBER Working Paper #
18068.
Arcidiacono, P. (2002). Affirmative Action in Higher Education: How do Admission and
Financial Aid Rules Affect Future Earnings? Unpublished manuscript, Department of
Economics, Duke University.
Arcidiacono, P., Aucejo, E., Hanming, F., and Spenner, K. (2011). “Does Affirmative Action
Lead to Mismatch? A New Test and Evidence” Quantitative Economics, 2(2011): 303-333.
Baum, S., Ma, J., and Payea, K. (2010). The Benefits of Higher Education for Individuals and
Society. Education Pays 2010: In Brief, Trends in Higher Education Series. Washington,
D.C.: College Board.
Brown, S.K. and Hirschman, C. (2006). The End of Affirmative Action in Washington State and
Its Impact on the Transition from High School to College. Sociology of Education, 79,
106-130.
Bucks, B. (2003). The Effects of the Top Ten Percent Plan on College Choice. University of
Wisconsin-Madison, Department of Economics, unpublished manuscript.
Card, D. and Krueger, A. (2005). "Would The Elimination Of Affirmative Action Affect Highly
Qualified Minority Applicants? Evidence From California And Texas," Industrial and
Labor Relations Review, 58(3), 416-434.
Cullen, J., Long, M., and R. Reback. 2011. “Jockeying for Position: Strategic High School
Choice Under Texas’ Top Ten Percent Plan.” NBER Working Paper #16663
Currie, J. and Moretti, E. (2003). Mother’s Education and the Intergenerational Transition of
Human Capital: Evidence from College Openings. Quarterly Journal of Economics,
118(4), 1495-1532.
Hinrichs, P. (2012). “Affirmative Action Bans and College Graduation Rates.” Unpublished
Manuscript.
Horn, Catherine L. and Flores, Stella M. (2003). Percent Plan in College Admissions: A
Comparative Analysis of Three States’ Experiences. Cambridge, MA: The Civil Rights
Project at Harvard University.
Hullegie, P., and Klein, T. (2010). “The Effect of Private Health Insurance on Medical Care
Utilization and Self-Assessed Health in Germany” Health Economics 19(9): 1048-62.
Kane, T. and Rouse, C.E. (1995). Labor Market Returns to Two- and Four-Year College. The
American Economic Review, 85, 600-614.
24
Imbens, G., and Kalyanaraman, K. (2009). “Optimal Bandwidth Choice for the Regression
Discontinuity Estimator.” NBER Working Paper # 14726
Imbens, G. and Lemieux, T. (2008). Regression discontinuity designs: A guide to
Practice. Journal of Econometrics, 142(2), 615-635.
Lee, D. (2008). Randomized Experiments from Non-random Selection in U.S. House Elections.
Journal of Econometrics, 142(2), 675-697.
Long, M. (2004). College Applications and the Effect of Affirmative Action. Journal of
Econometrics, 121(1-2), 319-342.
Long, M., Saenz, V., and M. Tienda. (2010). “Policy Transparency and College Enrollment: Did
the Texas Top Ten Percent Law Broaden Access to the Public Flagships?” The Annals of
the American Academy of Political and Social Science. 627(January): 82-105.
Niu, S., Tienda, M. and Cortes, K.E. (2006). College Selectivity and the Texas Top 10% Law:
How Constrained are the Options? Economics of Education Review 25(3), 259-272.
Niu, S. and Tienda, M. (2010). The Impact of the Texas Top 10 Percent Law on College
Enrollment: A Regression Discontinuity Approach. Journal of Policy Analysis and
Management, 29(1), 84-110.
Niu, Sunny X., Sullivan, T., and Tienda, M. (2006, April). Diversity by Design or Default?
Minority Students and the Texas Top 10% Law. Paper presented at the annual meeting of
the Population Association of America, Los Angeles, CA.
Pei, Z. (2011). “Regression Discontinuity Design with Measurement Error in the Assignment
Variable”. Unpublished Manuscript.
Rothstein, J., and Yoon, A. (2008). “Mismatch in Law School”. Unpublished Manuscript
Tienda, M., Alon, S, and Niu, S.X. (2008). Affirmative Action and the Texas Top 10%
Percent Admission Law: Balancing Equity and Access to Higher Education. Sociétés
Contemporaines, 79, 5-96.
THECB. 2010. Texas High School Graduates – College Enrollment Trends 2003-2009. http://www.thecb.state.tx.us/reports/PDF/2455.PDF?CFID=29991746&CFTOKEN=22384481
25
Figure 1: Probability of 4-Year College Enrollment Predicted Using Baseline
Covariates by End of 11th
Grade Class Rank .2
5.3
.35
.4
0 5 10 15 20 25Class Rank (0=Highest)
BW=10 BW=5
IK Opt BW
Figure 2: Distribution of Class Rank at end of 11
th Grade, 2002-2007 High
School Graduates
0
.00
5.0
1.0
15
Sh
are
in p
erc
en
tile
ran
k b
in
0 5 10 15 20 25 30 35 40 45 50 55 60 65 70 75 80 85 90 95 100Class Rank (0=Highest)
26
Figure 3: Flagship and 4-Year College Enrollment by End of 11th
Grade Class
Rank 0
.1.2
.3
0 5 10 15 20 25Class Rank (0=Highest)
BW=10 BW=5
IK Opt BW
Enrolled at Flagship
0
.05
.1.1
5.2
0 5 10 15 20 25Class Rank (0=Highest)
BW=10 BW=5
IK Opt BW
Enrolled at UT-Austin
0
.05
.1
0 5 10 15 20 25Class Rank (0=Highest)
BW=10 BW=5
IK Opt BW
Enrolled at Texas A&M.2
.3.4
.5.6
.7
0 5 10 15 20 25Class Rank (0=Highest)
BW=10 BW=5
IK Opt BW
Enrolled at any 4yr
Figure 4: Non-Flagship Enrollment and College Quality by End of 11th
Grade
Class Rank
.1.1
5.2
.25
.3
0 5 10 15 20 25Class Rank (0=Highest)
BW=10 BW=5
IK Opt BW
Enrolled at TX Public Non Flagship
.1.2
.3.4
0 5 10 15 20 25Class Rank (0=Highest)
BW=10 BW=5
IK Opt BW
Enrolled at Private/Out of State
0.2
.4.6
0 5 10 15 20 25Class Rank (0=Highest)
BW=10 BW=5
IK Opt BW
Enrolled at Highly/Most Comp
.7.8
.91
0 5 10 15 20 25Class Rank (0=Highest)
BW=10 BW=5
IK Opt BW
Selectivity (% Admitted)
27
Figure 5: Flagship Enrollment through Year 4 after HS Graduation by End of
11th
Grade Class Rank 0
12
0 5 10 15 20 25Class Rank (0=Highest)
BW=10 BW=5
IK Opt BW
Total Semesters-Flagship
0.1
.2.3
0 5 10 15 20 25Class Rank (0=Highest)
BW=10 BW=5
IK Opt BW
Enrolled Flagship Yr. 2
0.1
.2.3
0 5 10 15 20 25Class Rank (0=Highest)
BW=10 BW=5
IK Opt BW
Enrolled Flagship Yr. 3
0.1
.2.3
0 5 10 15 20 25Class Rank (0=Highest)
BW=10 BW=5
IK Opt BW
Enrolled Flagship Yr. 4
Figure 6: Private or Out-of-State Enrollment through Year 4 after HS
Graduation by End of 11th
Grade Class Rank
01
23
0 5 10 15 20 25Class Rank (0=Highest)
BW=10 BW=5
IK Opt BW
Total Semesters-Priv/OOS
.1.2
.3.4
0 5 10 15 20 25Class Rank (0=Highest)
BW=10 BW=5
IK Opt BW
Enrolled Priv/OOS Yr. 2
0.1
.2.3
.4
0 5 10 15 20 25Class Rank (0=Highest)
BW=10 BW=5
IK Opt BW
Enrolled Priv/OOS Yr. 3
0.1
.2.3
.4
0 5 10 15 20 25Class Rank (0=Highest)
BW=10 BW=5
IK Opt BW
Enrolled Priv/OOS Yr. 4
28
Figure 7: 4-Year College Enrollment through Year 4 after HS Graduation by
End of 11th
Grade Class Rank 2
34
56
0 5 10 15 20 25Class Rank (0=Highest)
BW=10 BW=5
IK Opt BW
Total Semesters-Any 4yr
.2.3
.4.5
.6.7
0 5 10 15 20 25Class Rank (0=Highest)
BW=10 BW=5
IK Opt BW
Enrolled 4-Year in Yr. 2
.2.3
.4.5
.6.7
0 5 10 15 20 25Class Rank (0=Highest)
BW=10 BW=5
IK Opt BW
Enrolled 4-Year in Yr. 3.2
.3.4
.5.6
.7
0 5 10 15 20 25Class Rank (0=Highest)
BW=10 BW=5
IK Opt BW
Enrolled 4-Year in Yr. 4
Figure 8: Transfer and Dropout by End of 11th
Grade Class Rank
0
.05
.1.1
5
0 5 10 15 20 25Class Rank (0=Highest)
BW=10 BW=5
IK Opt BW
Transfer to More Selective
.05
.1.1
5.2
0 5 10 15 20 25Class Rank (0=Highest)
BW=10 BW=5
IK Opt BW
Transfer to Less Selective
0
.05
.1.1
5
0 5 10 15 20 25Class Rank (0=Highest)
BW=10 BW=5
IK Opt BW
Dropped Out of College
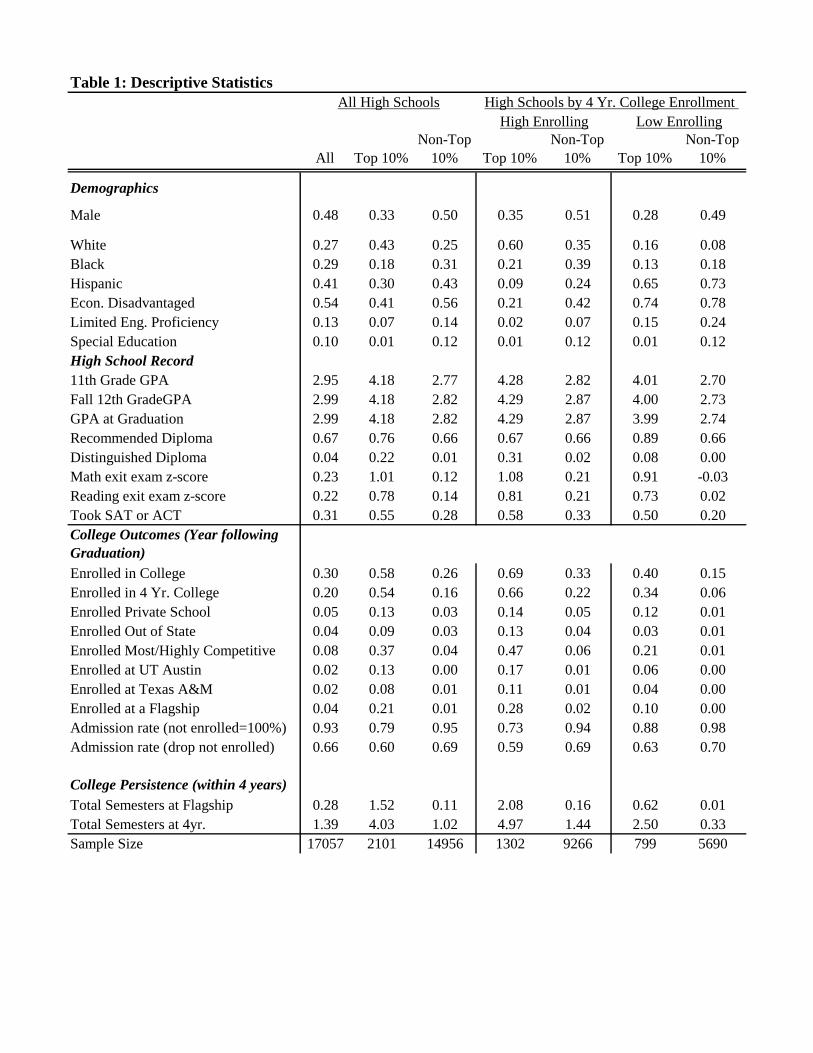
Table 1: Descriptive Statistics
All Top 10%
Non-Top
10% Top 10%
Non-Top
10% Top 10%
Non-Top
10%
Demographics
Male 0.48 0.33 0.50 0.35 0.51 0.28 0.49
White 0.27 0.43 0.25 0.60 0.35 0.16 0.08
Black 0.29 0.18 0.31 0.21 0.39 0.13 0.18
Hispanic 0.41 0.30 0.43 0.09 0.24 0.65 0.73
Econ. Disadvantaged 0.54 0.41 0.56 0.21 0.42 0.74 0.78
Limited Eng. Proficiency 0.13 0.07 0.14 0.02 0.07 0.15 0.24
Special Education 0.10 0.01 0.12 0.01 0.12 0.01 0.12
High School Record
11th Grade GPA 2.95 4.18 2.77 4.28 2.82 4.01 2.70
Fall 12th GradeGPA 2.99 4.18 2.82 4.29 2.87 4.00 2.73
GPA at Graduation 2.99 4.18 2.82 4.29 2.87 3.99 2.74
Recommended Diploma 0.67 0.76 0.66 0.67 0.66 0.89 0.66
Distinguished Diploma 0.04 0.22 0.01 0.31 0.02 0.08 0.00
Math exit exam z-score 0.23 1.01 0.12 1.08 0.21 0.91 -0.03
Reading exit exam z-score 0.22 0.78 0.14 0.81 0.21 0.73 0.02
Took SAT or ACT 0.31 0.55 0.28 0.58 0.33 0.50 0.20
College Outcomes (Year following
Graduation)
Enrolled in College 0.30 0.58 0.26 0.69 0.33 0.40 0.15
Enrolled in 4 Yr. College 0.20 0.54 0.16 0.66 0.22 0.34 0.06
Enrolled Private School 0.05 0.13 0.03 0.14 0.05 0.12 0.01
Enrolled Out of State 0.04 0.09 0.03 0.13 0.04 0.03 0.01
Enrolled Most/Highly Competitive 0.08 0.37 0.04 0.47 0.06 0.21 0.01
Enrolled at UT Austin 0.02 0.13 0.00 0.17 0.01 0.06 0.00
Enrolled at Texas A&M 0.02 0.08 0.01 0.11 0.01 0.04 0.00
Enrolled at a Flagship 0.04 0.21 0.01 0.28 0.02 0.10 0.00
Admission rate (not enrolled=100%) 0.93 0.79 0.95 0.73 0.94 0.88 0.98
Admission rate (drop not enrolled) 0.66 0.60 0.69 0.59 0.69 0.63 0.70
College Persistence (within 4 years)
Total Semesters at Flagship 0.28 1.52 0.11 2.08 0.16 0.62 0.01
Total Semesters at 4yr. 1.39 4.03 1.02 4.97 1.44 2.50 0.33
Sample Size 17057 2101 14956 1302 9266 799 5690
All High Schools High Schools by 4 Yr. College Enrollment
High Enrolling Low Enrolling
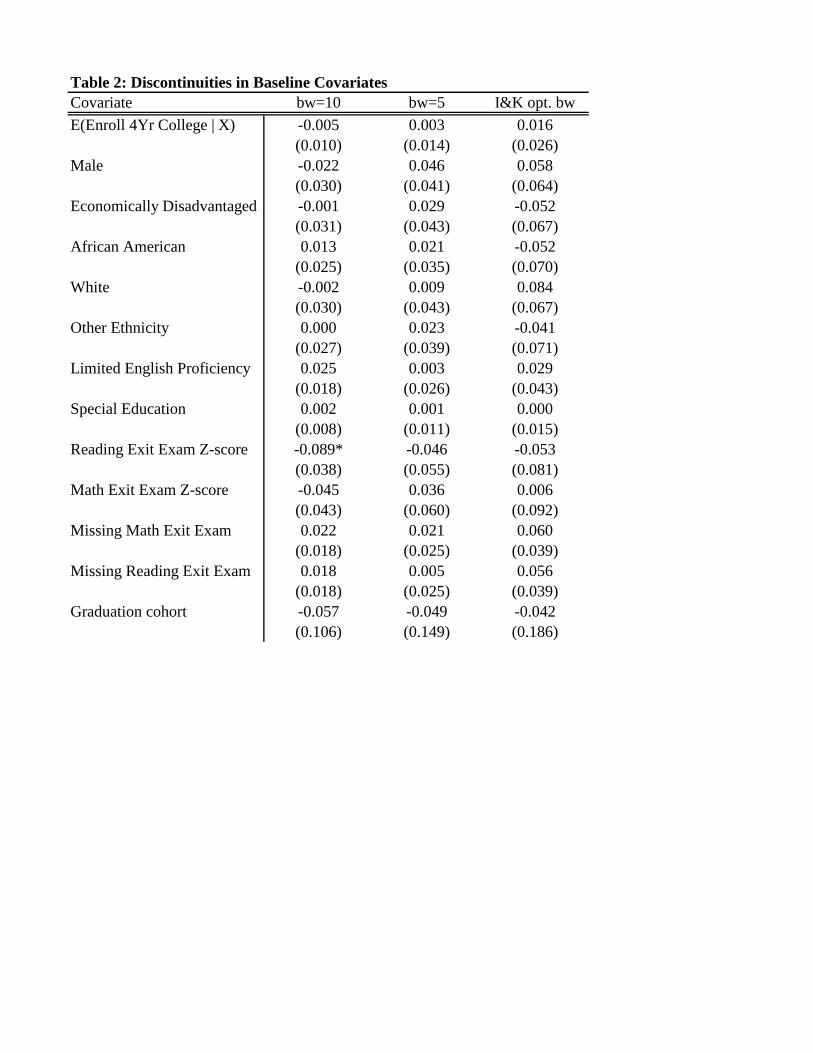
Table 2: Discontinuities in Baseline Covariates
Covariate bw=10 bw=5 I&K opt. bw
E(Enroll 4Yr College | X) -0.005 0.003 0.016
(0.010) (0.014) (0.026)
Male -0.022 0.046 0.058
(0.030) (0.041) (0.064)
Economically Disadvantaged -0.001 0.029 -0.052
(0.031) (0.043) (0.067)
African American 0.013 0.021 -0.052
(0.025) (0.035) (0.070)
White -0.002 0.009 0.084
(0.030) (0.043) (0.067)
Other Ethnicity 0.000 0.023 -0.041
(0.027) (0.039) (0.071)
Limited English Proficiency 0.025 0.003 0.029
(0.018) (0.026) (0.043)
Special Education 0.002 0.001 0.000
(0.008) (0.011) (0.015)
Reading Exit Exam Z-score -0.089* -0.046 -0.053
(0.038) (0.055) (0.081)
Math Exit Exam Z-score -0.045 0.036 0.006
(0.043) (0.060) (0.092)
Missing Math Exit Exam 0.022 0.021 0.060
(0.018) (0.025) (0.039)
Missing Reading Exit Exam 0.018 0.005 0.056
(0.018) (0.025) (0.039)
Graduation cohort -0.057 -0.049 -0.042
(0.106) (0.149) (0.186)
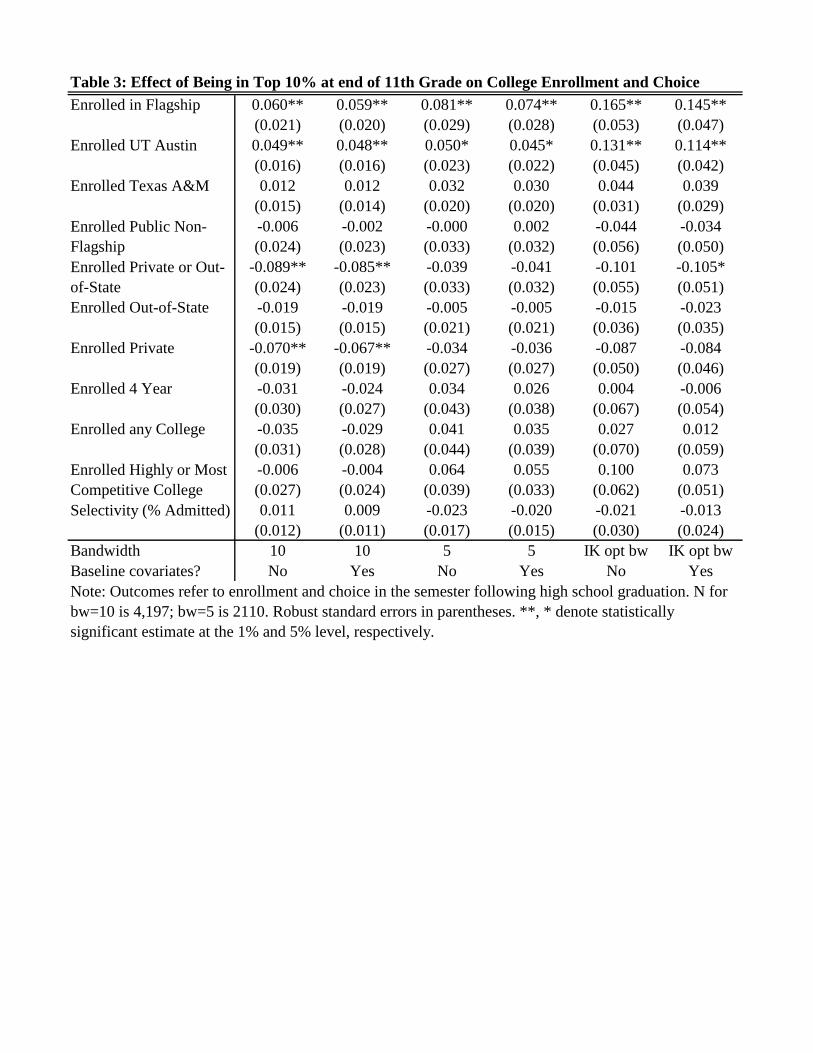
Table 3: Effect of Being in Top 10% at end of 11th Grade on College Enrollment and Choice
Enrolled in Flagship 0.060** 0.059** 0.081** 0.074** 0.165** 0.145**
(0.021) (0.020) (0.029) (0.028) (0.053) (0.047)
Enrolled UT Austin 0.049** 0.048** 0.050* 0.045* 0.131** 0.114**
(0.016) (0.016) (0.023) (0.022) (0.045) (0.042)
Enrolled Texas A&M 0.012 0.012 0.032 0.030 0.044 0.039
(0.015) (0.014) (0.020) (0.020) (0.031) (0.029)
-0.006 -0.002 -0.000 0.002 -0.044 -0.034
(0.024) (0.023) (0.033) (0.032) (0.056) (0.050)
-0.089** -0.085** -0.039 -0.041 -0.101 -0.105*
(0.024) (0.023) (0.033) (0.032) (0.055) (0.051)
Enrolled Out-of-State -0.019 -0.019 -0.005 -0.005 -0.015 -0.023
(0.015) (0.015) (0.021) (0.021) (0.036) (0.035)
Enrolled Private -0.070** -0.067** -0.034 -0.036 -0.087 -0.084
(0.019) (0.019) (0.027) (0.027) (0.050) (0.046)
Enrolled 4 Year -0.031 -0.024 0.034 0.026 0.004 -0.006
(0.030) (0.027) (0.043) (0.038) (0.067) (0.054)
Enrolled any College -0.035 -0.029 0.041 0.035 0.027 0.012
(0.031) (0.028) (0.044) (0.039) (0.070) (0.059)
-0.006 -0.004 0.064 0.055 0.100 0.073
(0.027) (0.024) (0.039) (0.033) (0.062) (0.051)
0.011 0.009 -0.023 -0.020 -0.021 -0.013
(0.012) (0.011) (0.017) (0.015) (0.030) (0.024)
Bandwidth 10 10 5 5 IK opt bw IK opt bw
Baseline covariates? No Yes No Yes No Yes
Enrolled Public Non-
Flagship
Enrolled Private or Out-
of-State
Selectivity (% Admitted)
Enrolled Highly or Most
Competitive College
Note: Outcomes refer to enrollment and choice in the semester following high school graduation. N for
bw=10 is 4,197; bw=5 is 2110. Robust standard errors in parentheses. **, * denote statistically
significant estimate at the 1% and 5% level, respectively.
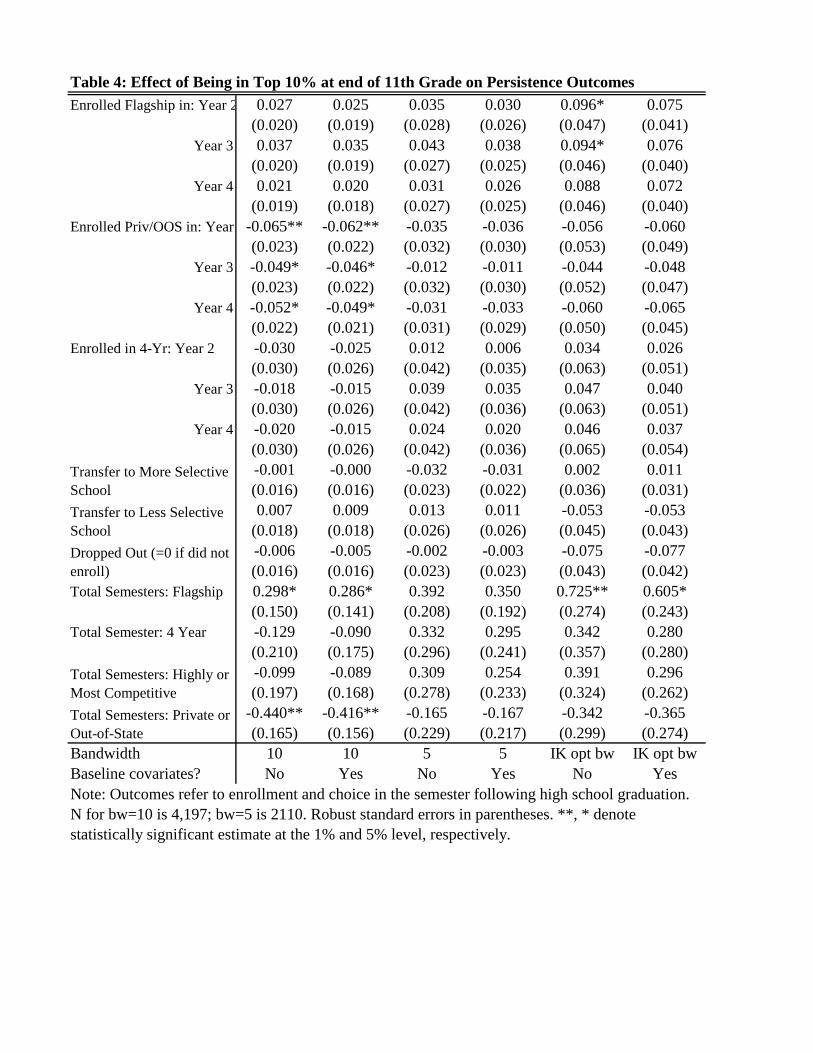
Table 4: Effect of Being in Top 10% at end of 11th Grade on Persistence Outcomes
Enrolled Flagship in: Year 2 0.027 0.025 0.035 0.030 0.096* 0.075
(0.020) (0.019) (0.028) (0.026) (0.047) (0.041)
Year 3 0.037 0.035 0.043 0.038 0.094* 0.076
(0.020) (0.019) (0.027) (0.025) (0.046) (0.040)
Year 4 0.021 0.020 0.031 0.026 0.088 0.072
(0.019) (0.018) (0.027) (0.025) (0.046) (0.040)
Enrolled Priv/OOS in: Year 2-0.065** -0.062** -0.035 -0.036 -0.056 -0.060
(0.023) (0.022) (0.032) (0.030) (0.053) (0.049)
Year 3 -0.049* -0.046* -0.012 -0.011 -0.044 -0.048
(0.023) (0.022) (0.032) (0.030) (0.052) (0.047)
Year 4 -0.052* -0.049* -0.031 -0.033 -0.060 -0.065
(0.022) (0.021) (0.031) (0.029) (0.050) (0.045)
Enrolled in 4-Yr: Year 2 -0.030 -0.025 0.012 0.006 0.034 0.026
(0.030) (0.026) (0.042) (0.035) (0.063) (0.051)
Year 3 -0.018 -0.015 0.039 0.035 0.047 0.040
(0.030) (0.026) (0.042) (0.036) (0.063) (0.051)
Year 4 -0.020 -0.015 0.024 0.020 0.046 0.037
(0.030) (0.026) (0.042) (0.036) (0.065) (0.054)
-0.001 -0.000 -0.032 -0.031 0.002 0.011
(0.016) (0.016) (0.023) (0.022) (0.036) (0.031)
0.007 0.009 0.013 0.011 -0.053 -0.053
(0.018) (0.018) (0.026) (0.026) (0.045) (0.043)
-0.006 -0.005 -0.002 -0.003 -0.075 -0.077
(0.016) (0.016) (0.023) (0.023) (0.043) (0.042)
Total Semesters: Flagship 0.298* 0.286* 0.392 0.350 0.725** 0.605*
(0.150) (0.141) (0.208) (0.192) (0.274) (0.243)
Total Semester: 4 Year -0.129 -0.090 0.332 0.295 0.342 0.280
(0.210) (0.175) (0.296) (0.241) (0.357) (0.280)
-0.099 -0.089 0.309 0.254 0.391 0.296
(0.197) (0.168) (0.278) (0.233) (0.324) (0.262)
-0.440** -0.416** -0.165 -0.167 -0.342 -0.365
(0.165) (0.156) (0.229) (0.217) (0.299) (0.274)
Bandwidth 10 10 5 5 IK opt bw IK opt bw
Baseline covariates? No Yes No Yes No Yes
Transfer to More Selective
School
Transfer to Less Selective
School
Dropped Out (=0 if did not
enroll)
Total Semesters: Highly or
Most Competitive
Total Semesters: Private or
Out-of-State
Note: Outcomes refer to enrollment and choice in the semester following high school graduation.
N for bw=10 is 4,197; bw=5 is 2110. Robust standard errors in parentheses. **, * denote
statistically significant estimate at the 1% and 5% level, respectively.
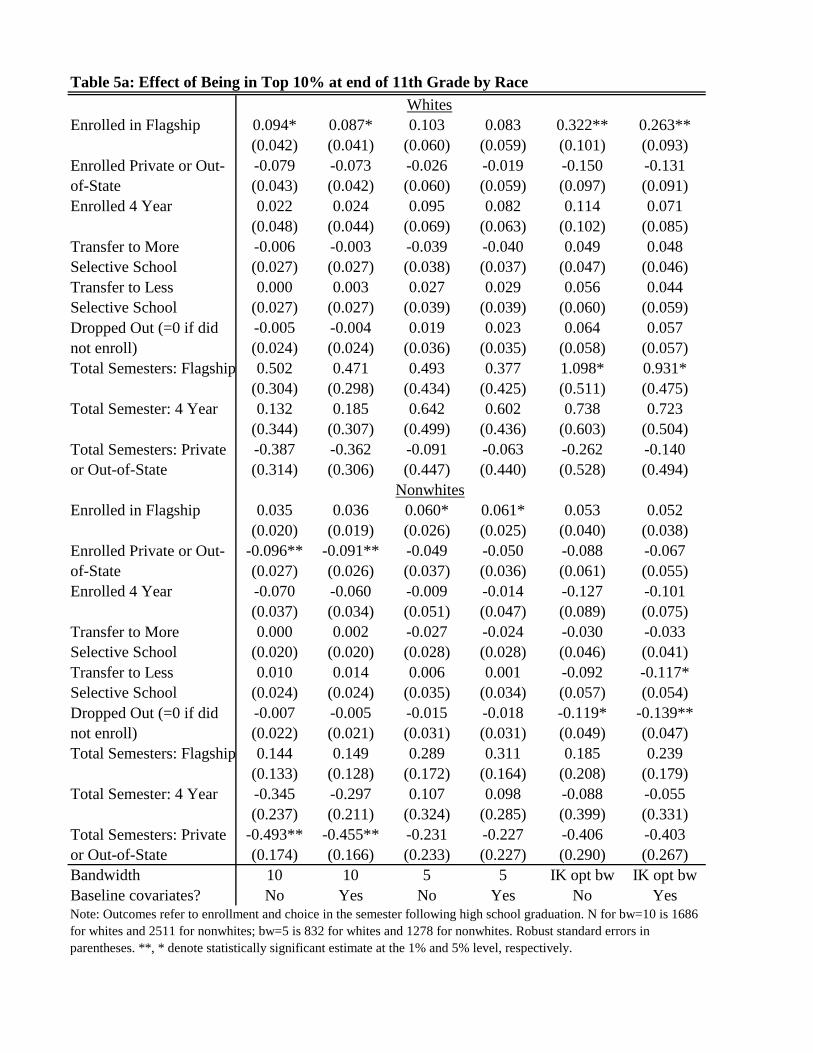
Table 5a: Effect of Being in Top 10% at end of 11th Grade by Race
Enrolled in Flagship 0.094* 0.087* 0.103 0.083 0.322** 0.263**
(0.042) (0.041) (0.060) (0.059) (0.101) (0.093)
-0.079 -0.073 -0.026 -0.019 -0.150 -0.131
(0.043) (0.042) (0.060) (0.059) (0.097) (0.091)
Enrolled 4 Year 0.022 0.024 0.095 0.082 0.114 0.071
(0.048) (0.044) (0.069) (0.063) (0.102) (0.085)
-0.006 -0.003 -0.039 -0.040 0.049 0.048
(0.027) (0.027) (0.038) (0.037) (0.047) (0.046)
0.000 0.003 0.027 0.029 0.056 0.044
(0.027) (0.027) (0.039) (0.039) (0.060) (0.059)
-0.005 -0.004 0.019 0.023 0.064 0.057
(0.024) (0.024) (0.036) (0.035) (0.058) (0.057)
Total Semesters: Flagship 0.502 0.471 0.493 0.377 1.098* 0.931*
(0.304) (0.298) (0.434) (0.425) (0.511) (0.475)
Total Semester: 4 Year 0.132 0.185 0.642 0.602 0.738 0.723
(0.344) (0.307) (0.499) (0.436) (0.603) (0.504)
-0.387 -0.362 -0.091 -0.063 -0.262 -0.140
(0.314) (0.306) (0.447) (0.440) (0.528) (0.494)
Enrolled in Flagship 0.035 0.036 0.060* 0.061* 0.053 0.052
(0.020) (0.019) (0.026) (0.025) (0.040) (0.038)
-0.096** -0.091** -0.049 -0.050 -0.088 -0.067
(0.027) (0.026) (0.037) (0.036) (0.061) (0.055)
Enrolled 4 Year -0.070 -0.060 -0.009 -0.014 -0.127 -0.101
(0.037) (0.034) (0.051) (0.047) (0.089) (0.075)
0.000 0.002 -0.027 -0.024 -0.030 -0.033
(0.020) (0.020) (0.028) (0.028) (0.046) (0.041)
0.010 0.014 0.006 0.001 -0.092 -0.117*
(0.024) (0.024) (0.035) (0.034) (0.057) (0.054)
-0.007 -0.005 -0.015 -0.018 -0.119* -0.139**
(0.022) (0.021) (0.031) (0.031) (0.049) (0.047)
Total Semesters: Flagship 0.144 0.149 0.289 0.311 0.185 0.239
(0.133) (0.128) (0.172) (0.164) (0.208) (0.179)
Total Semester: 4 Year -0.345 -0.297 0.107 0.098 -0.088 -0.055
(0.237) (0.211) (0.324) (0.285) (0.399) (0.331)
-0.493** -0.455** -0.231 -0.227 -0.406 -0.403
(0.174) (0.166) (0.233) (0.227) (0.290) (0.267)
Bandwidth 10 10 5 5 IK opt bw IK opt bw
Baseline covariates? No Yes No Yes No YesNote: Outcomes refer to enrollment and choice in the semester following high school graduation. N for bw=10 is 1686
for whites and 2511 for nonwhites; bw=5 is 832 for whites and 1278 for nonwhites. Robust standard errors in
parentheses. **, * denote statistically significant estimate at the 1% and 5% level, respectively.
Whites
Nonwhites
Enrolled Private or Out-
of-State
Transfer to More
Selective School
Transfer to Less
Selective School
Dropped Out (=0 if did
not enroll)
Total Semesters: Private
or Out-of-State
Enrolled Private or Out-
of-State
Transfer to More
Selective School
Transfer to Less
Selective School
Dropped Out (=0 if did
not enroll)
Total Semesters: Private
or Out-of-State
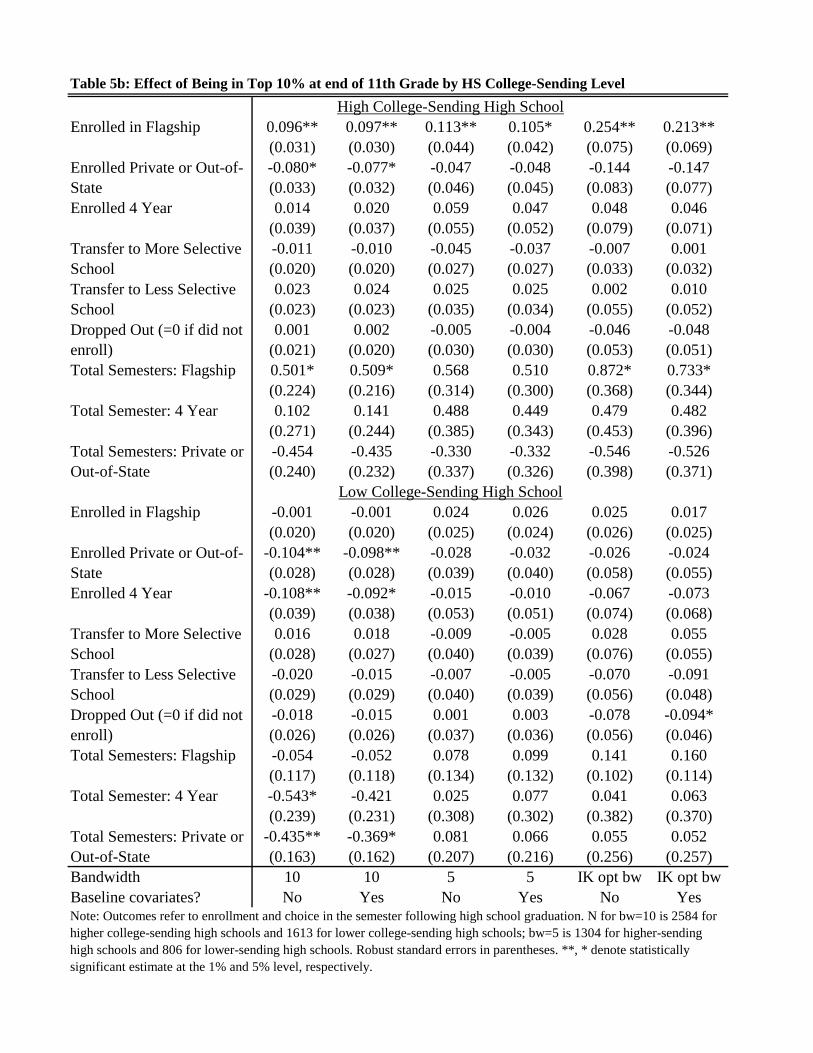
Enrolled in Flagship 0.096** 0.097** 0.113** 0.105* 0.254** 0.213**
(0.031) (0.030) (0.044) (0.042) (0.075) (0.069)
-0.080* -0.077* -0.047 -0.048 -0.144 -0.147
(0.033) (0.032) (0.046) (0.045) (0.083) (0.077)
Enrolled 4 Year 0.014 0.020 0.059 0.047 0.048 0.046
(0.039) (0.037) (0.055) (0.052) (0.079) (0.071)
-0.011 -0.010 -0.045 -0.037 -0.007 0.001
(0.020) (0.020) (0.027) (0.027) (0.033) (0.032)
0.023 0.024 0.025 0.025 0.002 0.010
(0.023) (0.023) (0.035) (0.034) (0.055) (0.052)
0.001 0.002 -0.005 -0.004 -0.046 -0.048
(0.021) (0.020) (0.030) (0.030) (0.053) (0.051)
Total Semesters: Flagship 0.501* 0.509* 0.568 0.510 0.872* 0.733*
(0.224) (0.216) (0.314) (0.300) (0.368) (0.344)
Total Semester: 4 Year 0.102 0.141 0.488 0.449 0.479 0.482
(0.271) (0.244) (0.385) (0.343) (0.453) (0.396)
-0.454 -0.435 -0.330 -0.332 -0.546 -0.526
(0.240) (0.232) (0.337) (0.326) (0.398) (0.371)
Enrolled in Flagship -0.001 -0.001 0.024 0.026 0.025 0.017
(0.020) (0.020) (0.025) (0.024) (0.026) (0.025)
-0.104** -0.098** -0.028 -0.032 -0.026 -0.024
(0.028) (0.028) (0.039) (0.040) (0.058) (0.055)
Enrolled 4 Year -0.108** -0.092* -0.015 -0.010 -0.067 -0.073
(0.039) (0.038) (0.053) (0.051) (0.074) (0.068)
0.016 0.018 -0.009 -0.005 0.028 0.055
(0.028) (0.027) (0.040) (0.039) (0.076) (0.055)
-0.020 -0.015 -0.007 -0.005 -0.070 -0.091
(0.029) (0.029) (0.040) (0.039) (0.056) (0.048)
-0.018 -0.015 0.001 0.003 -0.078 -0.094*
(0.026) (0.026) (0.037) (0.036) (0.056) (0.046)
Total Semesters: Flagship -0.054 -0.052 0.078 0.099 0.141 0.160
(0.117) (0.118) (0.134) (0.132) (0.102) (0.114)
Total Semester: 4 Year -0.543* -0.421 0.025 0.077 0.041 0.063
(0.239) (0.231) (0.308) (0.302) (0.382) (0.370)
-0.435** -0.369* 0.081 0.066 0.055 0.052
(0.163) (0.162) (0.207) (0.216) (0.256) (0.257)
Bandwidth 10 10 5 5 IK opt bw IK opt bw
Baseline covariates? No Yes No Yes No Yes
Table 5b: Effect of Being in Top 10% at end of 11th Grade by HS College-Sending Level
Note: Outcomes refer to enrollment and choice in the semester following high school graduation. N for bw=10 is 2584 for
higher college-sending high schools and 1613 for lower college-sending high schools; bw=5 is 1304 for higher-sending
high schools and 806 for lower-sending high schools. Robust standard errors in parentheses. **, * denote statistically
significant estimate at the 1% and 5% level, respectively.
High College-Sending High School
Enrolled Private or Out-of-
State
Transfer to More Selective
School
Transfer to Less Selective
School
Dropped Out (=0 if did not
enroll)
Total Semesters: Private or
Out-of-State
Low College-Sending High School
Enrolled Private or Out-of-
State
Transfer to More Selective
School
Transfer to Less Selective
School
Dropped Out (=0 if did not
enroll)
Total Semesters: Private or
Out-of-State