Admissions and Enrollment Report - umass.edu · Page 1 • Admissions and Enrollment Report, Spring...
39
Admissions and Enrollment Report Office of Institutional Research Spring 2019
Transcript of Admissions and Enrollment Report - umass.edu · Page 1 • Admissions and Enrollment Report, Spring...
Admissions and EnrollmentReport
Office of Institutional Research
Spring 2019
University of Massachusetts Amherst • Office of Institutional Research (OIR)
TABLES
ADMISSIONS (ADM) TABLES Table 1: Undergraduate Admissions …………………………………………………………… 4 Table 2: Academic Indicators of Entering Undergraduate Students ……………………… 6 Table 3: Graduate Admissions and Academic Indicators of Entering Graduate Students ………………………………………………………………………………….. 7 ENROLLMENT (ENR) TABLES (School or College Level) Table 1: Instruction to Majors and Non-Majors …………………………………………….. 10 Table 2: Student Majors ………………………………………………………………………… 11 Table 3: Instructional Service Matrix (Undergraduate and Graduate Combined ……… 12 Table 3a: Instructional Service Matrix (Undergraduate) ……………………………………. 13 Table 3b: Instructional Service Matrix (Graduate) …………………………………………… 14 ENROLLMENT TABLES (Department or Program Level) College of Humanities and Fine Arts
HFA – 1: Instruction to Majors and Non-Majors ……………………………………... 16 HFA – 2: Student Majors …………………………………………………………………. 17
College of Information and Computer Sciences CICS – 1: Instruction to Majors and Non-Majors ……………………………………... 20 CICS – 2: Student Majors …………………………………………………………………. 21
College of Natural Sciences CNS – 1: Instruction to Majors and Non-Majors ……………………………………... 22 CNS – 2: Student Majors …………………………………………………………………. 23
College of Social and Behavioral Sciences SBS – 1: Instruction to Majors and Non-Majors ……………………………………... 26 SBS – 2: Student Majors …………………………………………………………………. 27
College of Education EDUC – 1: Instruction to Majors and Non-Majors ……………………………………... 28 EDUC – 2: Student Majors …………………………………………………………………. 29
College of Engineering ENG – 1: Instruction to Majors and Non-Majors ……………………………………... 30 ENG – 2: Student Majors …………………………………………………………………. 31
Isenberg School of Management ISOM – 1: Instruction to Majors and Non-Majors ……………………………………... 32 ISOM – 2: Student Majors …………………………………………………………………. 33
College of Nursing NUR – 1: Instruction to Majors and Non-Majors ……………………………………... 34 NUR – 2: Student Majors …………………………………………………………………. 35
School of Public Health and Health Sciences PHHS – 1: Instruction to Majors and Non-Majors ……………………………………... 36 PHHS – 2: Student Majors …………………………………………………………………. 37
Other Programs OTH – 1: Instruction to Majors and Non-Majors ……………………………………... 38 OTH – 2: Student Majors …………………………………………………………………. 39
Page 1 • Admissions and Enrollment Report, Spring 2019
INTRODUCTION REPORTING ADMISSIONS AND ENROLLMENT Information for this report is drawn from the Student Information System (SPIRE). This is a transactional system that represents the campus’ official actions with respect to student admissions and enrollment. Admissions and enrollment activity is ongoing, but a “snapshot” of the data is taken at the end of the add/drop period (the fourteenth calendar day of each semester). These data are then processed and verified before they are put into table form for publication. We report enrollment activity at three levels. The school or college is the basic level of analysis. Within this, activity is shown by department or program, and within department or program by discipline or major, where appropriate (thus, enrollment of Earth Systems majors is shown within the Geosciences Department within the College of Natural Sciences). Admissions activity is reported only at the school or college level. Calculation of undergraduate enrollment data for student majors and instructed students is based upon students’ primary and secondary majors. Reporting conventions for students with multiple majors are as follows: (1) Headcount student majors are computed using all declared majors, (2) FTE student majors are distributed to all major programs, and (3) instructional credit for majors is based on students with any declared major. At the school and college level the number of primary and secondary majors is reported. Graduate enrollment is based on a student’s primary major. See Enrollment Definitions for a more detailed explanation. ADMISSIONS DEFINITIONS Admissions data for applications, acceptances (admits) and enrollments are reported based on the major to which the student applied. Entering enrollment numbers are based on the students’ actual enrolled major. Undergraduate students may be admitted into their 1st choice major or, if they have applied to a restricted program, an alternate major. An applicant to a restricted major who is not admitted to the program but admitted to the university is counted as an alternate major. An applicant to a non-restricted major who changes their major at the time of admission or enrollment is counted as a 1st choice major in their applied program. For example, an applicant to the restricted Engineering program is counted as an alternate major if they are not admitted into the Engineering program but admitted to an Exploratory Track program. An applicant to the English program, who enrolls in the History program, is counted as an applicant to English and as a 1st choice major admission in English.
Page 2 • Admissions and Enrollment Report, Spring 2019
ENROLLMENT DEFINITIONS Headcount Student Majors is the actual count of individual students who have selected a given major or pre-major. Every student is assigned a “major”, even though it may be only an administrative classification (e.g., “non-degree” or “undeclared”). At the undergraduate level, the count of student majors includes students’ declared primary and secondary majors. In the case of multiple majors, the enrollment is attributed to both departments. For example, if a student declares a primary major in Communication and a secondary major in Political Science, both departments in their respective colleges receive credit for the enrollment. Undergraduate Class Level is calculated using the number of credits earned towards graduation. The following credit ranges are used to calculate class level: first-year 0-26; sophomore 27-56; junior 57-86; and senior 87 or more. Full-Time Equivalent (FTE) Student Majors show how many headcount students there would be if all students took a “full” credit load (15 credits for undergraduates; 9 for graduate students). We look at the credits generated by students within each major regardless of where the courses are offered and then divide by 15 or 9, as appropriate. For undergraduate FTE student majors, their credits are distributed based on the number of declared majors. As in the previous example, half of the student’s total credits would be assigned to Communication, and half would be assigned to Political Science. FTE Instructed Students is a measure of instruction offered and consumed, regardless of the majors of the students taught. We look at the credits generated in the courses offered by each discipline, calculate full-time equivalency, and then distribute instruction according to “majors“ and “non-majors.” FTE instructed “majors” are defined as students with any declared major within the department or program offering the course; instructional credits for “majors” are assigned when the student taking the course is also a major in the department offering the course. All other students, including those without a declared major or pre-majors, are defined as “non-majors.” In the case of the student with majors in Communication and Political Science, FTE's generated in Communication and Political Science would be classified as instruction to majors in the respective departments. Unlike FTE Student Majors, calculation of FTE Instructed Students depends on the level of the course being taken and the level of the student taking the course. For undergraduate courses (those numbered 100-499) we always divide by 15, whether the student is undergraduate or graduate. Similarly, for graduate courses (those numbered 600-899) we always divide by 9. For courses numbered 500-599, however, we look to see what kind of student is taking the course: if undergraduate, we divide by 15; if graduate, we divide by 9.
University of Massachusetts Amherst • Office of Institutional Research (OIR)
DATA COMPARABILITY Admissions and enrollment data presented in this report are based on the current organizational structure of academic units and departments. During the course of any given semester, organizational, departmental or programmatic changes may occur. Therefore, numbers may not be directly comparable to previous semesters due to the consolidation, reassignment, or suspension of selected academic programs. In many cases, these changes (e.g., program name change, addition or consolidation of undergraduate majors) do not affect the numbers at the school or college level. In addition, enrollment numbers are not directly comparable to semesters before Fall 1995 due to the inclusion of students with multiple majors. ORGANIZATIONAL AND OTHER CHANGES The following changes are in effect for Academic Year 2018-2019:
UMass Amherst became the degree-granting authority for the Veterinary Technology (AA and BS degrees) at the Mount Ida Campus. These programs are reported under “Other Programs.”
The Engineering Exploratory Track program in the College of Engineering was discontinued.
ADMISSIONS (ADM) TABLES Table 1: Undergraduate Admissions Table 2: Academic Indicators of Entering Undergraduate Students Table 3: Graduate Admissions and Academic Indicators of Entering Graduate Students
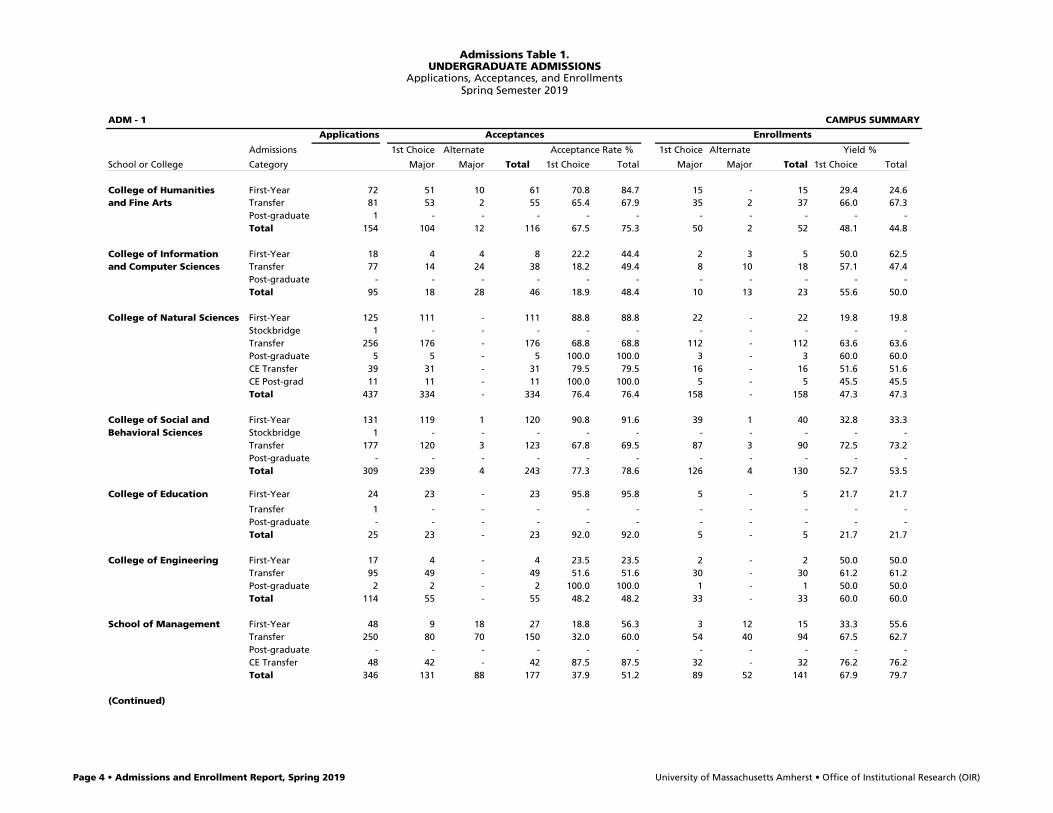
Admissions Table 1.UNDERGRADUATE ADMISSIONS
Applications, Acceptances, and EnrollmentsSpring Semester 2019
ADM - 1 CAMPUS SUMMARY
Applications Acceptances Enrollments
Admissions 1st Choice Alternate Acceptance Rate % 1st Choice Alternate Yield %
School or College Category Major Major Total 1st Choice Total Major Major Total 1st Choice Total
College of Humanities First-Year 72 51 10 61 70.8 84.7 15 - 15 29.4 24.6and Fine Arts Transfer 81 53 2 55 65.4 67.9 35 2 37 66.0 67.3
Post-graduate 1 - - - - - - - - - -Total 154 104 12 116 67.5 75.3 50 2 52 48.1 44.8
College of Information First-Year 18 4 4 8 22.2 44.4 2 3 5 50.0 62.5and Computer Sciences Transfer 77 14 24 38 18.2 49.4 8 10 18 57.1 47.4
Post-graduate - - - - - - - - - - -Total 95 18 28 46 18.9 48.4 10 13 23 55.6 50.0
College of Natural Sciences First-Year 125 111 - 111 88.8 88.8 22 - 22 19.8 19.8Stockbridge 1 - - - - - - - - - -Transfer 256 176 - 176 68.8 68.8 112 - 112 63.6 63.6Post-graduate 5 5 - 5 100.0 100.0 3 - 3 60.0 60.0CE Transfer 39 31 - 31 79.5 79.5 16 - 16 51.6 51.6CE Post-grad 11 11 - 11 100.0 100.0 5 - 5 45.5 45.5Total 437 334 - 334 76.4 76.4 158 - 158 47.3 47.3
College of Social and First-Year 131 119 1 120 90.8 91.6 39 1 40 32.8 33.3Behavioral Sciences Stockbridge 1 - - - - - - - - - -
Transfer 177 120 3 123 67.8 69.5 87 3 90 72.5 73.2Post-graduate - - - - - - - - - - -Total 309 239 4 243 77.3 78.6 126 4 130 52.7 53.5
College of Education First-Year 24 23 - 23 95.8 95.8 5 - 5 21.7 21.7
Transfer 1 - - - - - - - - - -Post-graduate - - - - - - - - - - -Total 25 23 - 23 92.0 92.0 5 - 5 21.7 21.7
College of Engineering First-Year 17 4 - 4 23.5 23.5 2 - 2 50.0 50.0Transfer 95 49 - 49 51.6 51.6 30 - 30 61.2 61.2Post-graduate 2 2 - 2 100.0 100.0 1 - 1 50.0 50.0Total 114 55 - 55 48.2 48.2 33 - 33 60.0 60.0
School of Management First-Year 48 9 18 27 18.8 56.3 3 12 15 33.3 55.6Transfer 250 80 70 150 32.0 60.0 54 40 94 67.5 62.7Post-graduate - - - - - - - - - - -CE Transfer 48 42 - 42 87.5 87.5 32 - 32 76.2 76.2Total 346 131 88 177 37.9 51.2 89 52 141 67.9 79.7
(Continued)
Page 4 • Admissions and Enrollment Report, Spring 2019 University of Massachusetts Amherst • Office of Institutional Research (OIR)

Admissions Table 1.UNDERGRADUATE ADMISSIONS
Applications, Acceptances, and EnrollmentsSpring Semester 2019
CAMPUS SUMMARY (Continued) ADM - 1
Applications Acceptances Enrollments
Admissions 1st Choice Alternate Acceptance Rate % 1st Choice Alternate Yield %
School or College Category Major Major Total 1st Choice Total Major Major Total 1st Choice Total
College of Nursing First-Year 7 - - - - - - - - - -Transfer - - - - - - - - - - -Post-graduate - - - - - - - - - - -CE Transfer 40 27 - 27 67.5 67.5 19 - 19 70.4 70.4CE Post-grad - - - - - - - - - - -Total 47 27 - 27 57.4 57.4 19 - 19 70.4 70.4
School of Public Health First-Year 47 44 - 44 93.6 93.6 12 - 12 27.3 27.3and Health Sciences Transfer 77 55 - 55 71.4 71.4 36 - 36 65.5 65.5
Post-graduate - - - - - - - - - - -Total 124 99 - 99 79.8 79.8 48 - 48 48.5 48.5
Other Programs First-Year 6 6 - 6 100.0 100.0 - - - - -Transfer - - - - - - - - - - -Post-graduate - - - - - - - - - - -CE Transfer 276 250 - 250 90.6 90.6 164 - 164 65.6 65.6Total 282 256 - 256 90.8 90.8 164 - 164 64.1 64.1
Total First-Year 495 371 33 404 74.9 81.6 100 16 116 27.0 28.7Stockbridge 2 - - - - - - - - - -Transfer 1,014 547 99 646 53.9 63.7 362 55 417 66.2 64.6Post-graduate 8 7 - 7 87.5 87.5 4 - 4 57.1 57.1Total 1,519 925 132 1,057 60.9 69.6 466 71 537 50.4 50.8
Continuing and Transfer 403 350 - 350 86.8 86.8 231 - 231 66.0 66.0Professional Education Post-graduate 11 11 - 11 100.0 100.0 5 - 5 45.5 45.5
Total 414 361 - 361 87.2 87.2 236 - 236 65.4 65.4
Definitions and NotesAcceptance Rate: The percent of applicants who were accepted in their 1st choice major (1st choice) or in either the 1st choice or alternate major (Total).Yield - 1st Choice: The percent of students accepted in their 1st choice major who enrolled in their 1st choice major.Yield - Total: The percent of all accepted students who enrolled in either the 1st choice or alternate major.Transfer: A student who earned 12 or more credits at another higher education institution prior to enrolling at UMass Amherst.
Note 1. All data reflect the current organizational structure. Note 2. Includes students enrolled in at least one credit-bearing course at the end of the fourteenth calendar day of the semester.Note 3. Numbers are reported according to the School or College affiliation of the major to which the student applied (the 1st choice major).Note 4. Some academic units have restricted the number of entering students, and many applicants are offered an alternate major. In the majority of cases, the alternate acceptance and enrollment figures do not represent acceptance or enrollment into that school or college, but acceptance or enrollment into the Exploratory Track program or an alternate major chosen by the student.Note 5. Students applying to undergraduate programs administered through CPE are reported in Continuing and Professional Education and not included in the totals.Note 6. Admissions data does not include the students continuing in the Veterinary Technology programs at the Mount Ida Campus.
Page 5 • Admissions and Enrollment Report, Spring 2019 University of Massachusetts Amherst • Office of Institutional Research (OIR)
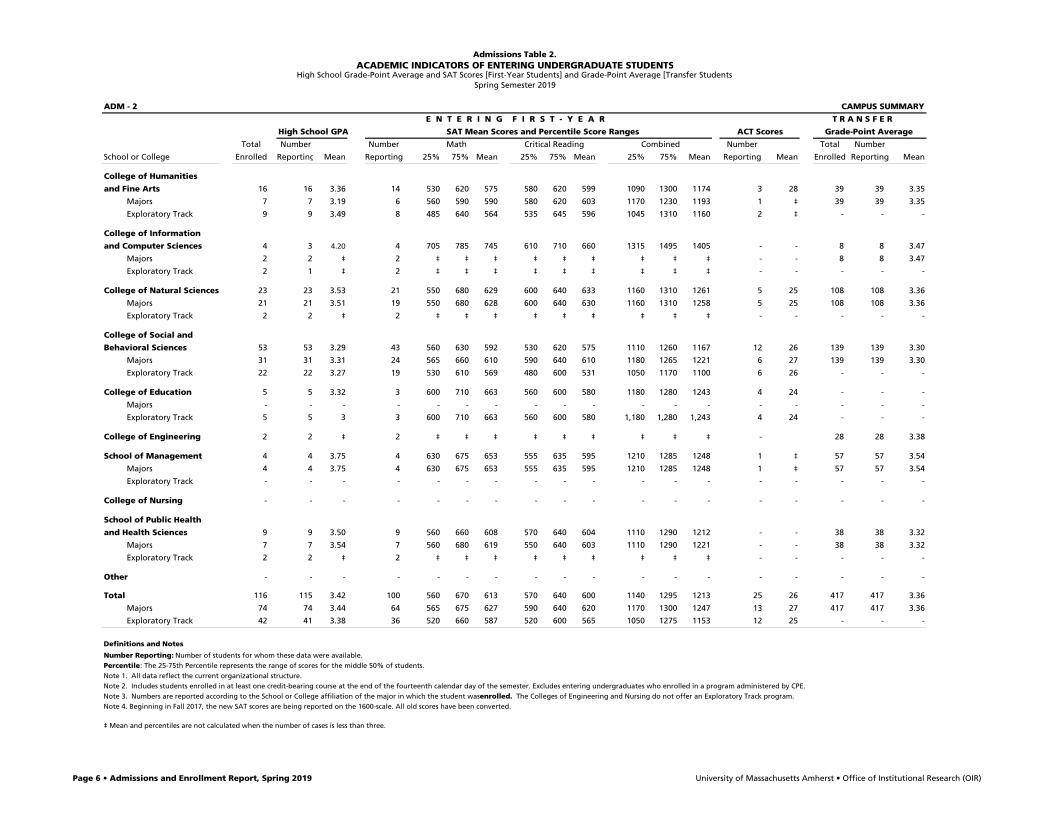
ADM - 2 CAMPUS SUMMARY
E N T E R I N G F I R S T - Y E A R T R A N S F E R
High School GPA SAT Mean Scores and Percentile Score Ranges ACT Scores Grade-Point Average
Total Number Number Math Critical Reading Combined Number Total Number
School or College Enrolled Reporting Mean Reporting 25% 75% Mean 25% 75% Mean 25% 75% Mean Reporting Mean Enrolled Reporting Mean
College of Humanities
and Fine Arts 16 16 3.36 14 530 620 575 580 620 599 1090 1300 1174 3 28 39 39 3.35
Majors 7 7 3.19 6 560 590 590 580 620 603 1170 1230 1193 1 ‡ 39 39 3.35
Exploratory Track 9 9 3.49 8 485 640 564 535 645 596 1045 1310 1160 2 ‡ - - -
College of Information
and Computer Sciences 4 3 4.20 4 705 785 745 610 710 660 1315 1495 1405 - - 8 8 3.47
Majors 2 2 ‡ 2 ‡ ‡ ‡ ‡ ‡ ‡ ‡ ‡ ‡ - - 8 8 3.47
Exploratory Track 2 1 ‡ 2 ‡ ‡ ‡ ‡ ‡ ‡ ‡ ‡ ‡ - - - - -
College of Natural Sciences 23 23 3.53 21 550 680 629 600 640 633 1160 1310 1261 5 25 108 108 3.36
Majors 21 21 3.51 19 550 680 628 600 640 630 1160 1310 1258 5 25 108 108 3.36
Exploratory Track 2 2 ‡ 2 ‡ ‡ ‡ ‡ ‡ ‡ ‡ ‡ ‡ - - - - -
College of Social and
Behavioral Sciences 53 53 3.29 43 560 630 592 530 620 575 1110 1260 1167 12 26 139 139 3.30
Majors 31 31 3.31 24 565 660 610 590 640 610 1180 1265 1221 6 27 139 139 3.30
Exploratory Track 22 22 3.27 19 530 610 569 480 600 531 1050 1170 1100 6 26 - - -
College of Education 5 5 3.32 3 600 710 663 560 600 580 1180 1280 1243 4 24 - - -
Majors - - - - - - - - - - - - - - - - - -
Exploratory Track 5 5 3 3 600 710 663 560 600 580 1,180 1,280 1,243 4 24 - - -
College of Engineering 2 2 ‡ 2 ‡ ‡ ‡ ‡ ‡ ‡ ‡ ‡ ‡ - 28 28 3.38
School of Management 4 4 3.75 4 630 675 653 555 635 595 1210 1285 1248 1 ‡ 57 57 3.54
Majors 4 4 3.75 4 630 675 653 555 635 595 1210 1285 1248 1 ‡ 57 57 3.54
Exploratory Track - - - - - - - - - - - - - - - - - -
College of Nursing - - - - - - - - - - - - - - - - - -
School of Public Health
and Health Sciences 9 9 3.50 9 560 660 608 570 640 604 1110 1290 1212 - - 38 38 3.32
Majors 7 7 3.54 7 560 680 619 550 640 603 1110 1290 1221 - - 38 38 3.32
Exploratory Track 2 2 ‡ 2 ‡ ‡ ‡ ‡ ‡ ‡ ‡ ‡ ‡ - - - - -
Other - - - - - - - - - - - - - - - - - -
Total 116 115 3.42 100 560 670 613 570 640 600 1140 1295 1213 25 26 417 417 3.36
Majors 74 74 3.44 64 565 675 627 590 640 620 1170 1300 1247 13 27 417 417 3.36
Exploratory Track 42 41 3.38 36 520 660 587 520 600 565 1050 1275 1153 12 25 - - -
Definitions and Notes
Number Reporting: Number of students for whom these data were available.Percentile: The 25-75th Percentile represents the range of scores for the middle 50% of students.Note 1. All data reflect the current organizational structure. Note 2. Includes students enrolled in at least one credit-bearing course at the end of the fourteenth calendar day of the semester. Excludes entering undergraduates who enrolled in a program administered by CPE.Note 3. Numbers are reported according to the School or College affiliation of the major in which the student was enrolled. The Colleges of Engineering and Nursing do not offer an Exploratory Track program.Note 4. Beginning in Fall 2017, the new SAT scores are being reported on the 1600-scale. All old scores have been converted.
‡ Mean and percentiles are not calculated when the number of cases is less than three.
Admissions Table 2.ACADEMIC INDICATORS OF ENTERING UNDERGRADUATE STUDENTS
High School Grade-Point Average and SAT Scores [First-Year Students] and Grade-Point Average [Transfer Students]Spring Semester 2019
Page 6 • Admissions and Enrollment Report, Spring 2019 University of Massachusetts Amherst • Office of Institutional Research (OIR)
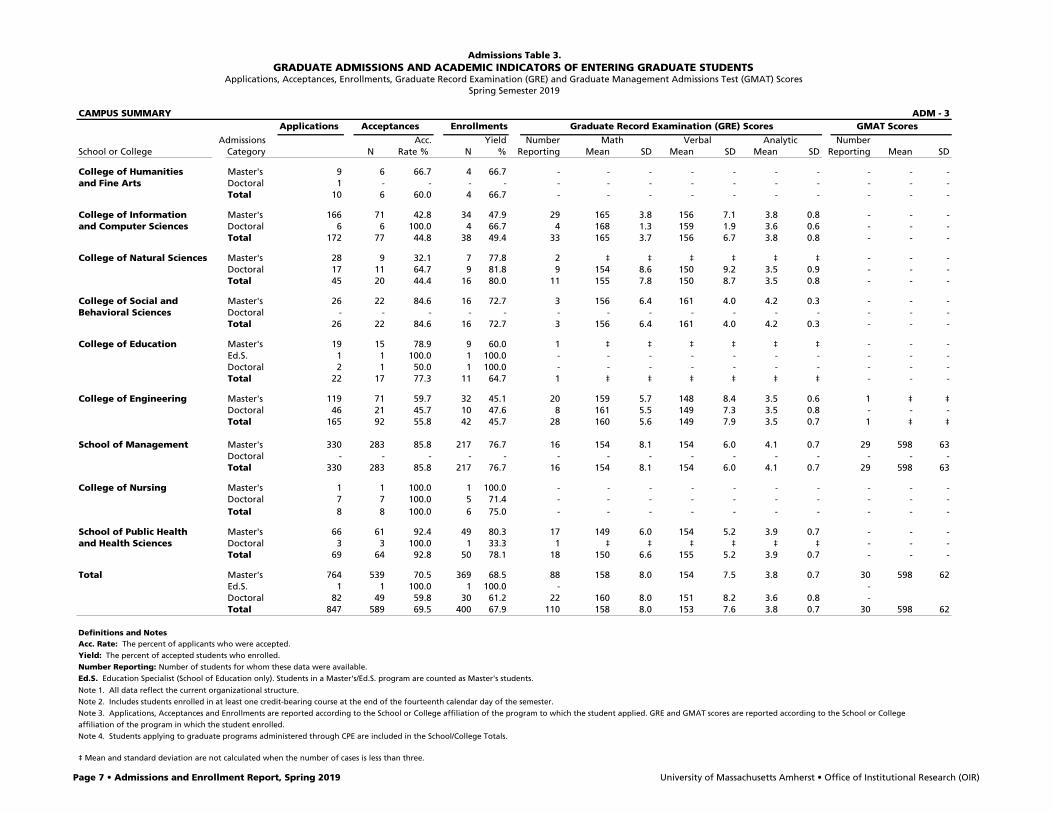
Admissions Table 3.
CAMPUS SUMMARY ADM - 3Applications Acceptances Enrollments Graduate Record Examination (GRE) Scores GMAT Scores
Admissions Acc. Yield Number Math Verbal Analytic NumberSchool or College Category N Rate % N % Reporting Mean SD Mean SD Mean SD Reporting Mean SD
College of Humanities Master's 9 6 66.7 4 66.7 - - - - - - - - - -and Fine Arts Doctoral 1 - - - - - - - - - - - - - -
Total 10 6 60.0 4 66.7 - - - - - - - - - -
College of Information Master's 166 71 42.8 34 47.9 29 165 3.8 156 7.1 3.8 0.8 - - -and Computer Sciences Doctoral 6 6 100.0 4 66.7 4 168 1.3 159 1.9 3.6 0.6 - - -
Total 172 77 44.8 38 49.4 33 165 3.7 156 6.7 3.8 0.8 - - -
College of Natural Sciences Master's 28 9 32.1 7 77.8 2 ‡ ‡ ‡ ‡ ‡ ‡ - - -Doctoral 17 11 64.7 9 81.8 9 154 8.6 150 9.2 3.5 0.9 - - -Total 45 20 44.4 16 80.0 11 155 7.8 150 8.7 3.5 0.8 - - -
College of Social and Master's 26 22 84.6 16 72.7 3 156 6.4 161 4.0 4.2 0.3 - - -Behavioral Sciences Doctoral - - - - - - - - - - - - - - -
Total 26 22 84.6 16 72.7 3 156 6.4 161 4.0 4.2 0.3 - - -
College of Education Master's 19 15 78.9 9 60.0 1 ‡ ‡ ‡ ‡ ‡ ‡ - - -Ed.S. 1 1 100.0 1 100.0 - - - - - - - - - -Doctoral 2 1 50.0 1 100.0 - - - - - - - - - -Total 22 17 77.3 11 64.7 1 ‡ ‡ ‡ ‡ ‡ ‡ - - -
College of Engineering Master's 119 71 59.7 32 45.1 20 159 5.7 148 8.4 3.5 0.6 1 ‡ ‡Doctoral 46 21 45.7 10 47.6 8 161 5.5 149 7.3 3.5 0.8 - - -Total 165 92 55.8 42 45.7 28 160 5.6 149 7.9 3.5 0.7 1 ‡ ‡
School of Management Master's 330 283 85.8 217 76.7 16 154 8.1 154 6.0 4.1 0.7 29 598 63Doctoral - - - - - - - - - - - - - - -Total 330 283 85.8 217 76.7 16 154 8.1 154 6.0 4.1 0.7 29 598 63
College of Nursing Master's 1 1 100.0 1 100.0 - ‐ ‐ ‐ ‐ ‐ ‐ - - -Doctoral 7 7 100.0 5 71.4 - - - - - - - - - -Total 8 8 100.0 6 75.0 - - - - - - - - - -
School of Public Health Master's 66 61 92.4 49 80.3 17 149 6.0 154 5.2 3.9 0.7 - - -and Health Sciences Doctoral 3 3 100.0 1 33.3 1 ‡ ‡ ‡ ‡ ‡ ‡ - - -
Total 69 64 92.8 50 78.1 18 150 6.6 155 5.2 3.9 0.7 - - -
Total Master's 764 539 70.5 369 68.5 88 158 8.0 154 7.5 3.8 0.7 30 598 62Ed.S. 1 1 100.0 1 100.0 - -Doctoral 82 49 59.8 30 61.2 22 160 8.0 151 8.2 3.6 0.8 -Total 847 589 69.5 400 67.9 110 158 8.0 153 7.6 3.8 0.7 30 598 62
Definitions and NotesAcc. Rate: The percent of applicants who were accepted.Yield: The percent of accepted students who enrolled.Number Reporting: Number of students for whom these data were available.Ed.S. Education Specialist (School of Education only). Students in a Master's/Ed.S. program are counted as Master's students.
Note 1. All data reflect the current organizational structure. Note 2. Includes students enrolled in at least one credit-bearing course at the end of the fourteenth calendar day of the semester.Note 3. Applications, Acceptances and Enrollments are reported according to the School or College affiliation of the program to which the student applied. GRE and GMAT scores are reported according to the School or College affiliation of the program in which the student enrolled.Note 4. Students applying to graduate programs administered through CPE are included in the School/College Totals.
‡ Mean and standard deviation are not calculated when the number of cases is less than three.
GRADUATE ADMISSIONS AND ACADEMIC INDICATORS OF ENTERING GRADUATE STUDENTSApplications, Acceptances, Enrollments, Graduate Record Examination (GRE) and Graduate Management Admissions Test (GMAT) Scores
Spring Semester 2019
Page 7 • Admissions and Enrollment Report, Spring 2019 University of Massachusetts Amherst • Office of Institutional Research (OIR)

ENROLLMENT (ENR) TABLES (School or College Level) Table 1: Instruction to Majors and Non-Majors Table 2: Student Majors Table 3: Instructional Service Matrix (Undergraduate and Graduate) Table 3a: Instructional Service Matrix (Undergraduate) Table 3b: Instructional Service Matrix (Graduate)
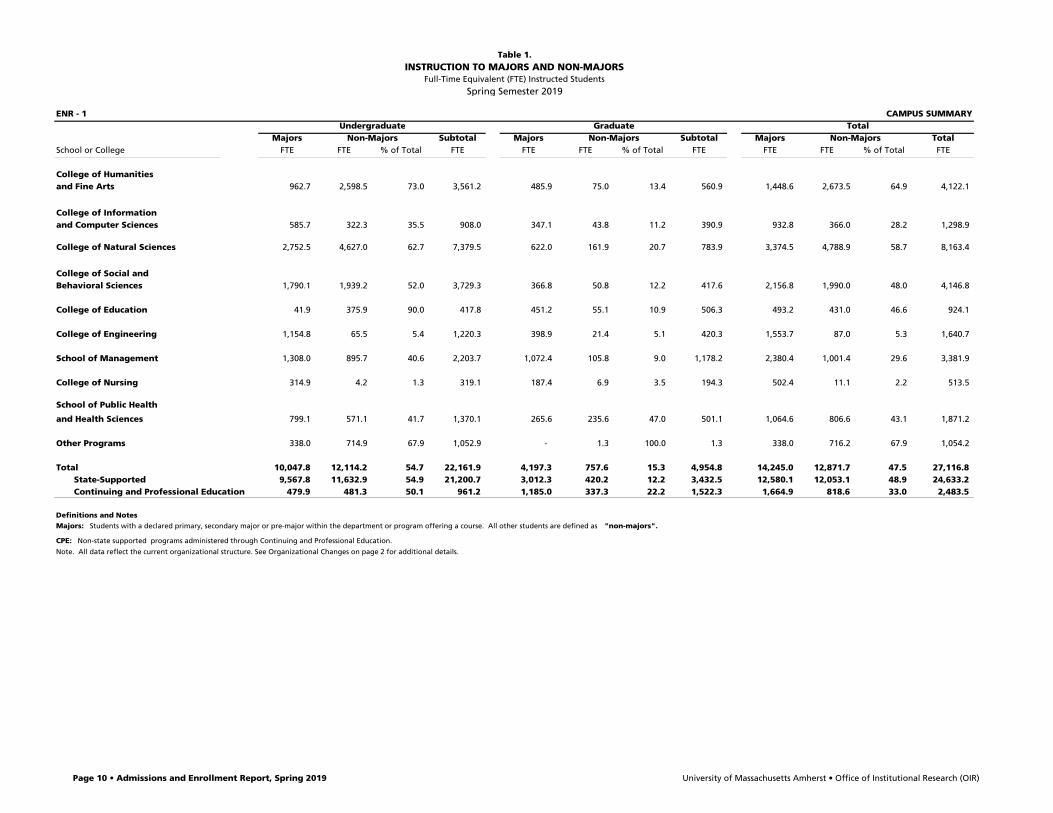
Table 1.INSTRUCTION TO MAJORS AND NON-MAJORS
Full-Time Equivalent (FTE) Instructed Students
Spring Semester 2019
ENR - 1 CAMPUS SUMMARYUndergraduate Graduate Total
Majors Non-Majors Subtotal Majors Non-Majors Subtotal Majors Non-Majors TotalSchool or College FTE FTE % of Total FTE FTE FTE % of Total FTE FTE FTE % of Total FTE
College of Humanitiesand Fine Arts 962.7 2,598.5 73.0 3,561.2 485.9 75.0 13.4 560.9 1,448.6 2,673.5 64.9 4,122.1
College of Informationand Computer Sciences 585.7 322.3 35.5 908.0 347.1 43.8 11.2 390.9 932.8 366.0 28.2 1,298.9
College of Natural Sciences 2,752.5 4,627.0 62.7 7,379.5 622.0 161.9 20.7 783.9 3,374.5 4,788.9 58.7 8,163.4
College of Social andBehavioral Sciences 1,790.1 1,939.2 52.0 3,729.3 366.8 50.8 12.2 417.6 2,156.8 1,990.0 48.0 4,146.8
College of Education 41.9 375.9 90.0 417.8 451.2 55.1 10.9 506.3 493.2 431.0 46.6 924.1
College of Engineering 1,154.8 65.5 5.4 1,220.3 398.9 21.4 5.1 420.3 1,553.7 87.0 5.3 1,640.7
School of Management 1,308.0 895.7 40.6 2,203.7 1,072.4 105.8 9.0 1,178.2 2,380.4 1,001.4 29.6 3,381.9
College of Nursing 314.9 4.2 1.3 319.1 187.4 6.9 3.5 194.3 502.4 11.1 2.2 513.5
School of Public Health
and Health Sciences 799.1 571.1 41.7 1,370.1 265.6 235.6 47.0 501.1 1,064.6 806.6 43.1 1,871.2
Other Programs 338.0 714.9 67.9 1,052.9 - 1.3 100.0 1.3 338.0 716.2 67.9 1,054.2
Total 10,047.8 12,114.2 54.7 22,161.9 4,197.3 757.6 15.3 4,954.8 14,245.0 12,871.7 47.5 27,116.8 State-Supported 9,567.8 11,632.9 54.9 21,200.7 3,012.3 420.2 12.2 3,432.5 12,580.1 12,053.1 48.9 24,633.2 Continuing and Professional Education 479.9 481.3 50.1 961.2 1,185.0 337.3 22.2 1,522.3 1,664.9 818.6 33.0 2,483.5
Definitions and NotesMajors: Students with a declared primary, secondary major or pre-major within the department or program offering a course. All other students are defined as "non-majors".
CPE: Non-state supported programs administered through Continuing and Professional Education.
Note. All data reflect the current organizational structure. See Organizational Changes on page 2 for additional details.
Page 10 • Admissions and Enrollment Report, Spring 2019 University of Massachusetts Amherst • Office of Institutional Research (OIR)
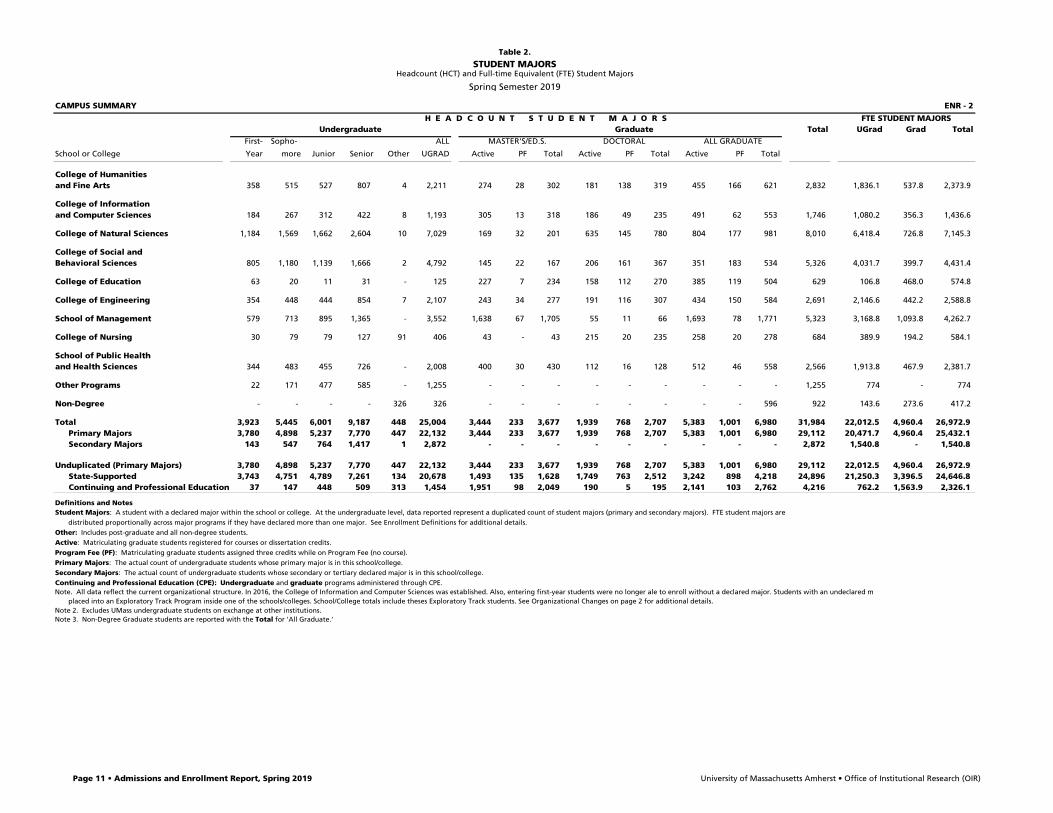
Table 2.
STUDENT MAJORSHeadcount (HCT) and Full-time Equivalent (FTE) Student Majors
Spring Semester 2019
CAMPUS SUMMARY ENR - 2
H E A D C O U N T S T U D E N T M A J O R S FTE STUDENT MAJORSUndergraduate Graduate Total UGrad Grad Total
First- Sopho- ALL MASTER'S/ED.S. DOCTORAL ALL GRADUATE
School or College Year more Junior Senior Other UGRAD Active PF Total Active PF Total Active PF Total
College of Humanitiesand Fine Arts 358 515 527 807 4 2,211 274 28 302 181 138 319 455 166 621 2,832 1,836.1 537.8 2,373.9
College of Informationand Computer Sciences 184 267 312 422 8 1,193 305 13 318 186 49 235 491 62 553 1,746 1,080.2 356.3 1,436.6
College of Natural Sciences 1,184 1,569 1,662 2,604 10 7,029 169 32 201 635 145 780 804 177 981 8,010 6,418.4 726.8 7,145.3
College of Social andBehavioral Sciences 805 1,180 1,139 1,666 2 4,792 145 22 167 206 161 367 351 183 534 5,326 4,031.7 399.7 4,431.4
College of Education 63 20 11 31 - 125 227 7 234 158 112 270 385 119 504 629 106.8 468.0 574.8
College of Engineering 354 448 444 854 7 2,107 243 34 277 191 116 307 434 150 584 2,691 2,146.6 442.2 2,588.8
School of Management 579 713 895 1,365 - 3,552 1,638 67 1,705 55 11 66 1,693 78 1,771 5,323 3,168.8 1,093.8 4,262.7
College of Nursing 30 79 79 127 91 406 43 - 43 215 20 235 258 20 278 684 389.9 194.2 584.1
School of Public Healthand Health Sciences 344 483 455 726 - 2,008 400 30 430 112 16 128 512 46 558 2,566 1,913.8 467.9 2,381.7
Other Programs 22 171 477 585 - 1,255 - - - - - - - - - 1,255 774 - 774
Non-Degree - - - - 326 326 - - - - - - - - 596 922 143.6 273.6 417.2
Total 3,923 5,445 6,001 9,187 448 25,004 3,444 233 3,677 1,939 768 2,707 5,383 1,001 6,980 31,984 22,012.5 4,960.4 26,972.9 Primary Majors 3,780 4,898 5,237 7,770 447 22,132 3,444 233 3,677 1,939 768 2,707 5,383 1,001 6,980 29,112 20,471.7 4,960.4 25,432.1 Secondary Majors 143 547 764 1,417 1 2,872 - - - - - - - - - 2,872 1,540.8 - 1,540.8
Unduplicated (Primary Majors) 3,780 4,898 5,237 7,770 447 22,132 3,444 233 3,677 1,939 768 2,707 5,383 1,001 6,980 29,112 22,012.5 4,960.4 26,972.9 State-Supported 3,743 4,751 4,789 7,261 134 20,678 1,493 135 1,628 1,749 763 2,512 3,242 898 4,218 24,896 21,250.3 3,396.5 24,646.8 Continuing and Professional Education 37 147 448 509 313 1,454 1,951 98 2,049 190 5 195 2,141 103 2,762 4,216 762.2 1,563.9 2,326.1
Definitions and NotesStudent Majors: A student with a declared major within the school or college. At the undergraduate level, data reported represent a duplicated count of student majors (primary and secondary majors). FTE student majors are
distributed proportionally across major programs if they have declared more than one major. See Enrollment Definitions for additional details.Other: Includes post-graduate and all non-degree students.Active: Matriculating graduate students registered for courses or dissertation credits.Program Fee (PF): Matriculating graduate students assigned three credits while on Program Fee (no course).Primary Majors: The actual count of undergraduate students whose primary major is in this school/college.Secondary Majors: The actual count of undergraduate students whose secondary or tertiary declared major is in this school/college.Continuing and Professional Education (CPE): Undergraduate and graduate programs administered through CPE. Note. All data reflect the current organizational structure. In 2016, the College of Information and Computer Sciences was established. Also, entering first-year students were no longer ale to enroll without a declared major. Students with an undeclared m
placed into an Exploratory Track Program inside one of the schools/colleges. School/College totals include theses Exploratory Track students. See Organizational Changes on page 2 for additional details.Note 2. Excludes UMass undergraduate students on exchange at other institutions.Note 3. Non-Degree Graduate students are reported with the Total for 'All Graduate.'
Page 11 • Admissions and Enrollment Report, Spring 2019 University of Massachusetts Amherst • Office of Institutional Research (OIR)
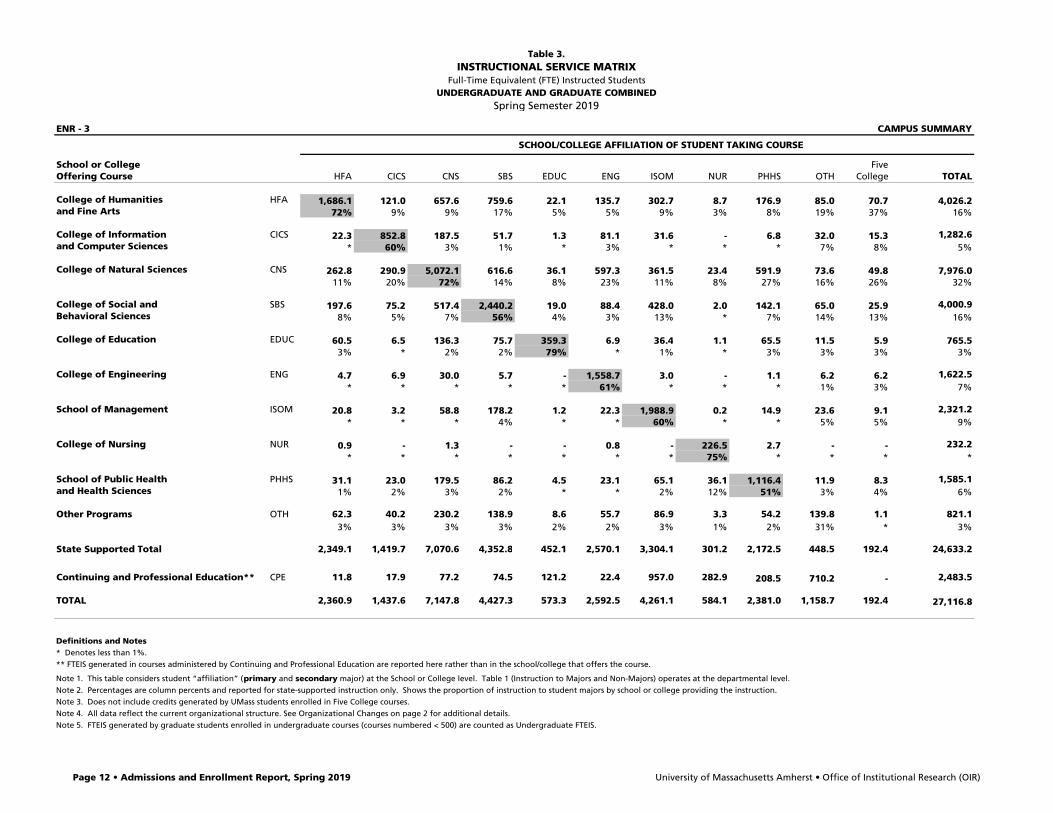
Table 3.INSTRUCTIONAL SERVICE MATRIX
Full-Time Equivalent (FTE) Instructed StudentsUNDERGRADUATE AND GRADUATE COMBINED
Spring Semester 2019
ENR - 3 CAMPUS SUMMARY
SCHOOL/COLLEGE AFFILIATION OF STUDENT TAKING COURSE
School or College FiveOffering Course HFA CICS CNS SBS EDUC ENG ISOM NUR PHHS OTH College TOTAL
College of Humanities HFA 1,686.1 121.0 657.6 759.6 22.1 135.7 302.7 8.7 176.9 85.0 70.7 4,026.2and Fine Arts 72% 9% 9% 17% 5% 5% 9% 3% 8% 19% 37% 16%
College of Information CICS 22.3 852.8 187.5 51.7 1.3 81.1 31.6 - 6.8 32.0 15.3 1,282.6and Computer Sciences * 60% 3% 1% * 3% * * * 7% 8% 5%
College of Natural Sciences CNS 262.8 290.9 5,072.1 616.6 36.1 597.3 361.5 23.4 591.9 73.6 49.8 7,976.011% 20% 72% 14% 8% 23% 11% 8% 27% 16% 26% 32%
College of Social and SBS 197.6 75.2 517.4 2,440.2 19.0 88.4 428.0 2.0 142.1 65.0 25.9 4,000.9Behavioral Sciences 8% 5% 7% 56% 4% 3% 13% * 7% 14% 13% 16%
College of Education EDUC 60.5 6.5 136.3 75.7 359.3 6.9 36.4 1.1 65.5 11.5 5.9 765.53% * 2% 2% 79% * 1% * 3% 3% 3% 3%
College of Engineering ENG 4.7 6.9 30.0 5.7 - 1,558.7 3.0 - 1.1 6.2 6.2 1,622.5* * * * * 61% * * * 1% 3% 7%
School of Management ISOM 20.8 3.2 58.8 178.2 1.2 22.3 1,988.9 0.2 14.9 23.6 9.1 2,321.2* * * 4% * * 60% * * 5% 5% 9%
College of Nursing NUR 0.9 - 1.3 - - 0.8 - 226.5 2.7 - - 232.2* * * * * * * 75% * * * *
School of Public Health PHHS 31.1 23.0 179.5 86.2 4.5 23.1 65.1 36.1 1,116.4 11.9 8.3 1,585.1and Health Sciences 1% 2% 3% 2% * * 2% 12% 51% 3% 4% 6%
Other Programs OTH 62.3 40.2 230.2 138.9 8.6 55.7 86.9 3.3 54.2 139.8 1.1 821.13% 3% 3% 3% 2% 2% 3% 1% 2% 31% * 3%
State Supported Total 2,349.1 1,419.7 7,070.6 4,352.8 452.1 2,570.1 3,304.1 301.2 2,172.5 448.5 192.4 24,633.2
Continuing and Professional Education** CPE 11.8 17.9 77.2 74.5 121.2 22.4 957.0 282.9 208.5 710.2 - 2,483.5
TOTAL 2,360.9 1,437.6 7,147.8 4,427.3 573.3 2,592.5 4,261.1 584.1 2,381.0 1,158.7 192.4 27,116.8
Definitions and Notes* Denotes less than 1%.** FTEIS generated in courses administered by Continuing and Professional Education are reported here rather than in the school/college that offers the course.
Note 1. This table considers student “affiliation” (primary and secondary major) at the School or College level. Table 1 (Instruction to Majors and Non-Majors) operates at the departmental level.Note 2. Percentages are column percents and reported for state-supported instruction only. Shows the proportion of instruction to student majors by school or college providing the instruction.Note 3. Does not include credits generated by UMass students enrolled in Five College courses.Note 4. All data reflect the current organizational structure. See Organizational Changes on page 2 for additional details.Note 5. FTEIS generated by graduate students enrolled in undergraduate courses (courses numbered < 500) are counted as Undergraduate FTEIS.
Page 12 • Admissions and Enrollment Report, Spring 2019 University of Massachusetts Amherst • Office of Institutional Research (OIR)
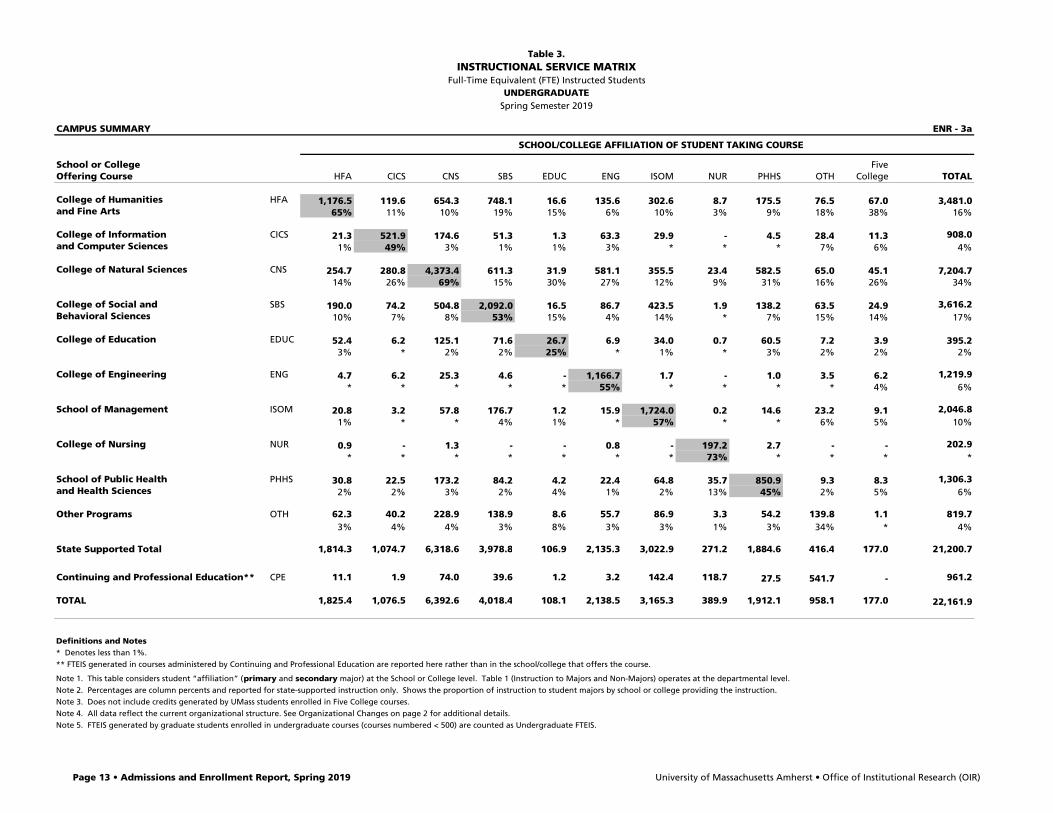
Table 3.INSTRUCTIONAL SERVICE MATRIX
Full-Time Equivalent (FTE) Instructed StudentsUNDERGRADUATE
Spring Semester 2019
CAMPUS SUMMARY ENR - 3a
SCHOOL/COLLEGE AFFILIATION OF STUDENT TAKING COURSE
School or College FiveOffering Course HFA CICS CNS SBS EDUC ENG ISOM NUR PHHS OTH College TOTAL
College of Humanities HFA 1,176.5 119.6 654.3 748.1 16.6 135.6 302.6 8.7 175.5 76.5 67.0 3,481.0and Fine Arts 65% 11% 10% 19% 15% 6% 10% 3% 9% 18% 38% 16%
College of Information CICS 21.3 521.9 174.6 51.3 1.3 63.3 29.9 - 4.5 28.4 11.3 908.0and Computer Sciences 1% 49% 3% 1% 1% 3% * * * 7% 6% 4%
College of Natural Sciences CNS 254.7 280.8 4,373.4 611.3 31.9 581.1 355.5 23.4 582.5 65.0 45.1 7,204.714% 26% 69% 15% 30% 27% 12% 9% 31% 16% 26% 34%
College of Social and SBS 190.0 74.2 504.8 2,092.0 16.5 86.7 423.5 1.9 138.2 63.5 24.9 3,616.2Behavioral Sciences 10% 7% 8% 53% 15% 4% 14% * 7% 15% 14% 17%
College of Education EDUC 52.4 6.2 125.1 71.6 26.7 6.9 34.0 0.7 60.5 7.2 3.9 395.23% * 2% 2% 25% * 1% * 3% 2% 2% 2%
College of Engineering ENG 4.7 6.2 25.3 4.6 - 1,166.7 1.7 - 1.0 3.5 6.2 1,219.9* * * * * 55% * * * * 4% 6%
School of Management ISOM 20.8 3.2 57.8 176.7 1.2 15.9 1,724.0 0.2 14.6 23.2 9.1 2,046.81% * * 4% 1% * 57% * * 6% 5% 10%
College of Nursing NUR 0.9 - 1.3 - - 0.8 - 197.2 2.7 - - 202.9* * * * * * * 73% * * * *
School of Public Health PHHS 30.8 22.5 173.2 84.2 4.2 22.4 64.8 35.7 850.9 9.3 8.3 1,306.3and Health Sciences 2% 2% 3% 2% 4% 1% 2% 13% 45% 2% 5% 6%
Other Programs OTH 62.3 40.2 228.9 138.9 8.6 55.7 86.9 3.3 54.2 139.8 1.1 819.73% 4% 4% 3% 8% 3% 3% 1% 3% 34% * 4%
State Supported Total 1,814.3 1,074.7 6,318.6 3,978.8 106.9 2,135.3 3,022.9 271.2 1,884.6 416.4 177.0 21,200.7
Continuing and Professional Education** CPE 11.1 1.9 74.0 39.6 1.2 3.2 142.4 118.7 27.5 541.7 - 961.2
TOTAL 1,825.4 1,076.5 6,392.6 4,018.4 108.1 2,138.5 3,165.3 389.9 1,912.1 958.1 177.0 22,161.9
Definitions and Notes* Denotes less than 1%.** FTEIS generated in courses administered by Continuing and Professional Education are reported here rather than in the school/college that offers the course.
Note 1. This table considers student “affiliation” (primary and secondary major) at the School or College level. Table 1 (Instruction to Majors and Non-Majors) operates at the departmental level.Note 2. Percentages are column percents and reported for state-supported instruction only. Shows the proportion of instruction to student majors by school or college providing the instruction.Note 3. Does not include credits generated by UMass students enrolled in Five College courses.Note 4. All data reflect the current organizational structure. See Organizational Changes on page 2 for additional details.Note 5. FTEIS generated by graduate students enrolled in undergraduate courses (courses numbered < 500) are counted as Undergraduate FTEIS.
Page 13 • Admissions and Enrollment Report, Spring 2019 University of Massachusetts Amherst • Office of Institutional Research (OIR)

Table 3.INSTRUCTIONAL SERVICE MATRIX
Full-Time Equivalent (FTE) Instructed StudentsGRADUATE
Spring Semester 2019
ENR - 3b CAMPUS SUMMARY
SCHOOL/COLLEGE AFFILIATION OF STUDENT TAKING COURSE
School or College FiveOffering Course HFA CICS CNS SBS EDUC ENG ISOM NUR PHHS OTH College TOTAL
College of Humanities HFA 509.6 1.4 3.3 11.4 5.6 0.1 0.1 - 1.3 8.6 3.8 545.2and Fine Arts 95% * * 3% 2% * * * * 27% 24% 16%
College of Information CICS 1.0 330.9 12.8 0.3 - 17.8 1.7 - 2.3 3.7 4.0 374.6and Computer Sciences * 96% 2% * * 4% * * * 11% 26% 11%
College of Natural Sciences CNS 8.1 10.2 698.7 5.3 4.2 16.3 6.0 - 9.4 8.6 4.7 771.32% 3% 93% 1% 1% 4% 2% * 3% 27% 30% 22%
College of Social and SBS 7.6 1.0 12.7 348.2 2.6 1.7 4.5 0.1 3.9 1.5 1.0 384.7Behavioral Sciences 1% * 2% 93% * * 2% * 1% 5% 6% 11%
College of Education EDUC 8.2 0.3 11.2 4.2 332.6 - 2.3 0.3 5.0 4.3 2.0 370.32% * 1% 1% 96% * * 1% 2% 13% 13% 11%
College of Engineering ENG - 0.7 4.8 1.1 - 392.0 1.3 - 0.1 2.7 - 402.7* * * * * 90% * * * 8% * 12%
School of Management ISOM - - 1.0 1.5 - 6.3 264.9 - 0.3 0.3 - 274.4* * * * * 1% 94% * * 1% * 8%
College of Nursing NUR - - - - - - - 29.2 - - - 29.2* * * * * * * 97% * * * *
School of Public Health PHHS 0.3 0.5 6.2 2.0 0.3 0.7 0.3 0.3 265.4 2.6 - 278.8and Health Sciences * * * * * * * 1% 92% 8% * 8%
Other Programs OTH - - 1.3 - - - - - - - - 1.3* * * * * * * * * * * *
State Supported Total 534.8 345.1 752.0 374.0 345.2 434.8 281.2 30.0 287.8 32.2 15.4 3,432.5
Continuing and Professional Education** CPE 0.7 16.0 3.2 34.9 120.0 19.2 814.7 164.2 181.0 168.4 - 1,522.3
TOTAL 535.4 361.1 755.2 408.9 465.2 454.1 1,095.8 194.2 468.8 200.6 15.4 4,954.8
Definitions and Notes* Denotes less than 1%.** FTEIS generated in courses administered by Continuing and Professional Education are reported here rather than in the school/college that offers the course.
Note 1. This table considers student “affiliation” (primary and secondary major) at the School or College level. Table 1 (Instruction to Majors and Non-Majors) operates at the departmental level.Note 2. Percentages are column percents and reported for state-supported instruction only. Shows the proportion of instruction to student majors by school or college providing the instruction.Note 3. Does not include credits generated by UMass students enrolled in Five College courses.Note 4. All data reflect the current organizational structure. See Organizational Changes on page 2 for additional details.Note 5. FTEIS generated by graduate students enrolled in undergraduate courses (courses numbered < 500) are counted as Undergraduate FTEIS.
Page 14 • Admissions and Enrollment Report, Spring 2019 University of Massachusetts Amherst • Office of Institutional Research (OIR)
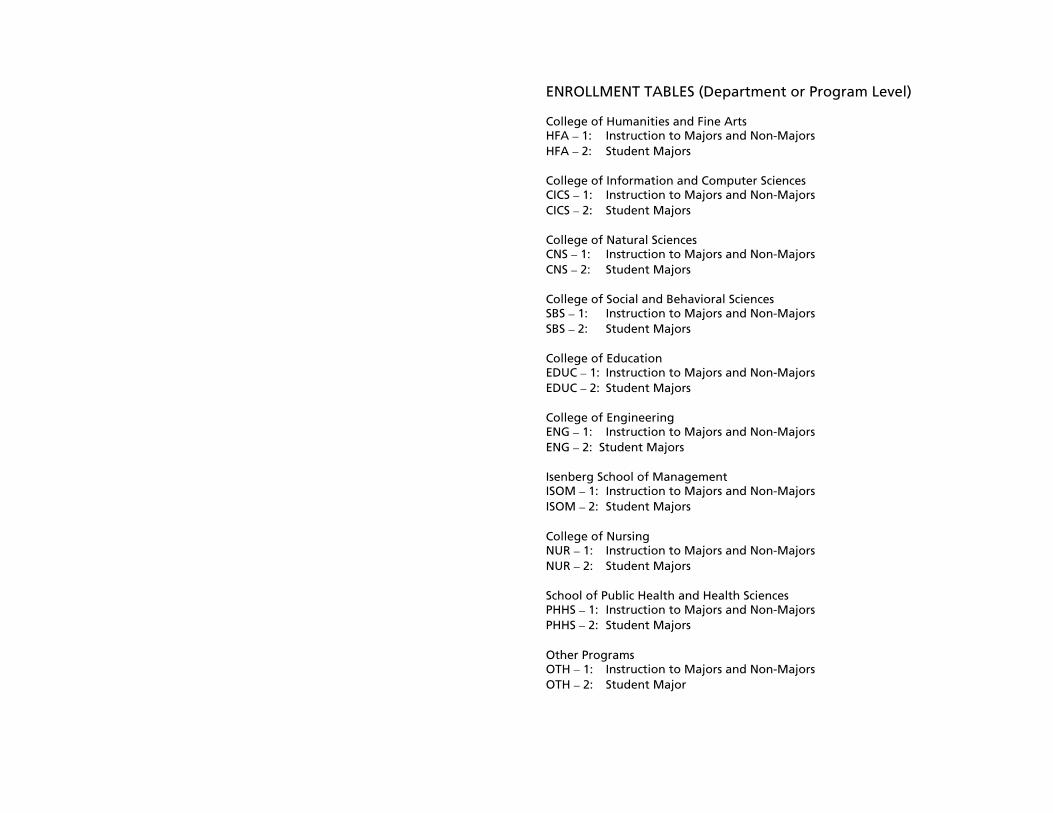
ENROLLMENT TABLES (Department or Program Level) College of Humanities and Fine Arts HFA – 1: Instruction to Majors and Non-Majors HFA – 2: Student Majors College of Information and Computer Sciences CICS – 1: Instruction to Majors and Non-Majors CICS – 2: Student Majors College of Natural Sciences CNS – 1: Instruction to Majors and Non-Majors CNS – 2: Student Majors College of Social and Behavioral Sciences SBS – 1: Instruction to Majors and Non-Majors SBS – 2: Student Majors College of Education EDUC – 1: Instruction to Majors and Non-Majors EDUC – 2: Student Majors College of Engineering ENG – 1: Instruction to Majors and Non-Majors ENG – 2: Student Majors Isenberg School of Management ISOM – 1: Instruction to Majors and Non-Majors ISOM – 2: Student Majors College of Nursing NUR – 1: Instruction to Majors and Non-Majors NUR – 2: Student Majors School of Public Health and Health Sciences PHHS – 1: Instruction to Majors and Non-Majors PHHS – 2: Student Majors Other Programs OTH – 1: Instruction to Majors and Non-Majors OTH – 2: Student Major

Table 1.INSTRUCTION TO MAJORS AND NON-MAJORS
Full-Time Equivalent (FTE) Instructed StudentsSpring Semester 2019
HFA - 1 COLLEGE OF HUMANITIES AND FINE ARTS
Undergraduate Graduate Total
Majors Non-Majors Subtotal Majors Non-Majors Subtotal Majors Non-Majors TotalDepartment or Program FTE FTE % of Total FTE FTE FTE % of Total FTE FTE FTE % of Total FTE
Afro-American Studies 12.5 149.8 92.3 162.3 20.8 5.6 21.1 26.3 33.3 155.4 82.3 188.7 Afro-American Studies 12.5 144.7 92.0 157.3 20.8 5.6 21.1 26.3 33.3 150.3 81.9 183.6 Afro-American Studies (CPE) - 5.1 100.0 5.1 - - - - - 5.1 100.0 5.1
Architecture 41.7 20.5 33.0 62.2 39.1 4.0 9.3 43.1 80.8 24.5 23.3 105.3 Architecture 41.7 20.5 33.0 62.2 38.4 3.3 8.0 41.8 80.1 23.9 23.0 104.0 Architecture (CPE) - - - - 0.7 0.7 50.0 1.3 0.7 0.7 50.0 1.3
Art 74.0 58.0 43.9 132.0 20.7 3.0 12.7 23.7 94.7 61.0 39.2 155.7 Art 72.3 58.0 44.5 130.3 20.7 3.0 12.7 23.7 92.9 61.0 39.6 153.9 Art Education 1.7 - - 1.7 - - - - 1.7 - - 1.7
Arts Extension - 20.8 100.0 20.8 - 6.0 100.0 6.0 - 26.8 100.0 26.8 Arts Extension - 13.8 100.0 13.8 - 3.0 100.0 3.0 - 16.8 100.0 16.8 Arts Extension (CPE) - 7.0 100.0 7.0 - 3.0 100.0 3.0 - 10.0 100.0 10.0
Classics 23.9 188.1 88.7 211.9 16.8 0.2 1.3 17.0 40.6 188.3 82.2 228.9 Classics 12.9 158.5 92.5 171.5 2.9 0.2 7.1 3.1 15.8 158.8 90.9 174.6 Classics (CPE) - 4.0 100.0 4.0 - - - - - 4.0 100.0 4.0 Greek 5.3 1.9 26.6 7.3 0.3 - - 0.3 5.7 1.9 25.4 7.6 Latin 5.6 23.6 80.8 29.2 11.6 - - 11.6 17.2 23.6 57.9 40.8 Latin Education - - - - 2.0 - - 2.0 2.0 - - 2.0
College of Humanities and Fine Arts 0.5 1.6 77.4 2.1 - - - - 0.5 1.6 77.4 2.1
English 203.7 155.1 43.2 358.8 118.6 16.8 12.4 135.3 322.2 171.9 34.8 494.1 English 203.1 143.7 41.4 346.8 118.6 5.4 4.4 124.0 321.6 149.2 31.7 470.8 English (CPE) 0.6 11.4 95.0 12.0 - 11.3 100.0 11.3 0.6 22.7 97.4 23.3
Five College Center for Study of World Languages - 13.5 100.0 13.5 - - - - - 13.5 100.0 13.5
History 118.7 399.9 77.1 518.6 30.3 5.7 15.7 36.0 149.1 405.5 73.1 554.6 History 117.9 375.9 76.1 493.8 30.3 5.7 15.7 36.0 148.3 381.5 72.0 529.8 History (CPE) 0.8 24.0 96.8 24.8 - - - - 0.8 24.0 96.8 24.8
History of Art and Architecture 17.1 118.1 87.3 135.3 11.0 2.3 17.5 13.3 28.1 120.5 81.1 148.6 Art History 17.1 118.1 87.3 135.3 11.0 2.3 17.5 13.3 28.1 120.5 81.1 148.6
Judaic and Near Eastern Studies 6.5 66.7 91.1 73.3 - - - - 6.5 66.7 91.1 73.3 Arabic 2.3 20.5 89.8 22.9 - - - - 2.3 20.5 89.8 22.9 Hebrew 0.2 4.8 96.0 5.0 - - - - 0.2 4.8 96.0 5.0 Judaic Studies 2.9 36.5 92.7 39.3 - - - - 2.9 36.5 92.7 39.3 Middle Eastern Studies 1.1 4.2 79.7 5.3 - - - - 1.1 4.2 79.7 5.3 Yiddish 0.1 0.7 91.7 0.8 - - - - 0.1 0.7 91.7 0.8
Languages, Literatures and Cultures 136.6 692.0 83.5 828.6 81.8 8.3 9.2 90.1 218.4 700.3 76.2 918.7 Asian Studies - 1.0 100.0 1.0 - - - - - 1.0 100.0 1.0 Catalan 1.2 1.6 57.1 2.8 - - - - 1.2 1.6 57.1 2.8 Chinese 15.8 61.8 79.6 77.6 17.8 0.3 1.8 18.1 33.6 62.1 64.9 95.7 Comparative Literature 8.1 158.0 95.1 166.1 15.0 2.3 13.5 17.3 23.1 160.3 87.4 183.4 Comparative Literature (CPE) 0.3 6.9 96.3 7.2 - - - - 0.3 6.9 96.3 7.2
(Continued)
Page 16 • Admissions and Enrollment Report, Fall 2018 University of Massachusetts Amherst • Office of Institutional Research (OIR)
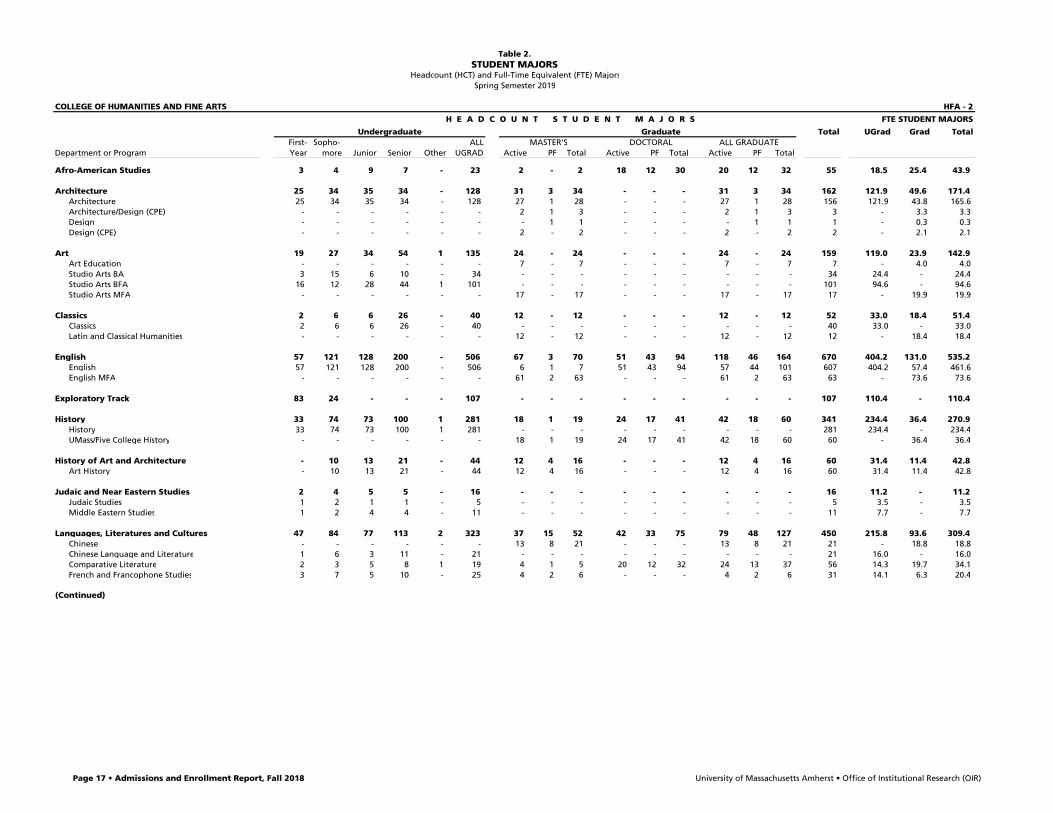
Table 2.STUDENT MAJORS
Headcount (HCT) and Full-Time Equivalent (FTE) MajorsSpring Semester 2019
COLLEGE OF HUMANITIES AND FINE ARTS HFA - 2
H E A D C O U N T S T U D E N T M A J O R S FTE STUDENT MAJORS
Undergraduate Graduate Total UGrad Grad TotalFirst- Sopho- ALL MASTER'S DOCTORAL ALL GRADUATE
Department or Program Year more Junior Senior Other UGRAD Active PF Total Active PF Total Active PF Total
Afro-American Studies 3 4 9 7 - 23 2 - 2 18 12 30 20 12 32 55 18.5 25.4 43.9
Architecture 25 34 35 34 - 128 31 3 34 - - - 31 3 34 162 121.9 49.6 171.4 Architecture 25 34 35 34 - 128 27 1 28 - - - 27 1 28 156 121.9 43.8 165.6 Architecture/Design (CPE) - - - - - - 2 1 3 - - - 2 1 3 3 - 3.3 3.3 Design - - - - - - - 1 1 - - - - 1 1 1 - 0.3 0.3 Design (CPE) - - - - - - 2 - 2 - - - 2 - 2 2 - 2.1 2.1
Art 19 27 34 54 1 135 24 - 24 - - - 24 - 24 159 119.0 23.9 142.9 Art Education - - - - - - 7 - 7 - - - 7 - 7 7 - 4.0 4.0 Studio Arts BA 3 15 6 10 - 34 - - - - - - - - - 34 24.4 - 24.4 Studio Arts BFA 16 12 28 44 1 101 - - - - - - - - - 101 94.6 - 94.6 Studio Arts MFA - - - - - - 17 - 17 - - - 17 - 17 17 - 19.9 19.9
Classics 2 6 6 26 - 40 12 - 12 - - - 12 - 12 52 33.0 18.4 51.4 Classics 2 6 6 26 - 40 - - - - - - - - - 40 33.0 - 33.0 Latin and Classical Humanities - - - - - - 12 - 12 - - - 12 - 12 12 - 18.4 18.4
English 57 121 128 200 - 506 67 3 70 51 43 94 118 46 164 670 404.2 131.0 535.2 English 57 121 128 200 - 506 6 1 7 51 43 94 57 44 101 607 404.2 57.4 461.6 English MFA - - - - - - 61 2 63 - - - 61 2 63 63 - 73.6 73.6
Exploratory Track 83 24 - - - 107 - - - - - - - - - 107 110.4 - 110.4
History 33 74 73 100 1 281 18 1 19 24 17 41 42 18 60 341 234.4 36.4 270.9 History 33 74 73 100 1 281 - - - - - - - - - 281 234.4 - 234.4 UMass/Five College History - - - - - - 18 1 19 24 17 41 42 18 60 60 - 36.4 36.4
History of Art and Architecture - 10 13 21 - 44 12 4 16 - - - 12 4 16 60 31.4 11.4 42.8 Art History - 10 13 21 - 44 12 4 16 - - - 12 4 16 60 31.4 11.4 42.8
Judaic and Near Eastern Studies 2 4 5 5 - 16 - - - - - - - - - 16 11.2 - 11.2 Judaic Studies 1 2 1 1 - 5 - - - - - - - - - 5 3.5 - 3.5 Middle Eastern Studies 1 2 4 4 - 11 - - - - - - - - - 11 7.7 - 7.7
Languages, Literatures and Cultures 47 84 77 113 2 323 37 15 52 42 33 75 79 48 127 450 215.8 93.6 309.4 Chinese - - - - - - 13 8 21 - - - 13 8 21 21 - 18.8 18.8 Chinese Language and Literature 1 6 3 11 - 21 - - - - - - - - - 21 16.0 - 16.0 Comparative Literature 2 3 5 8 1 19 4 1 5 20 12 32 24 13 37 56 14.3 19.7 34.1 French and Francophone Studies 3 7 5 10 - 25 4 2 6 - - - 4 2 6 31 14.1 6.3 20.4
(Continued)
Page 17 • Admissions and Enrollment Report, Fall 2018 University of Massachusetts Amherst • Office of Institutional Research (OIR)
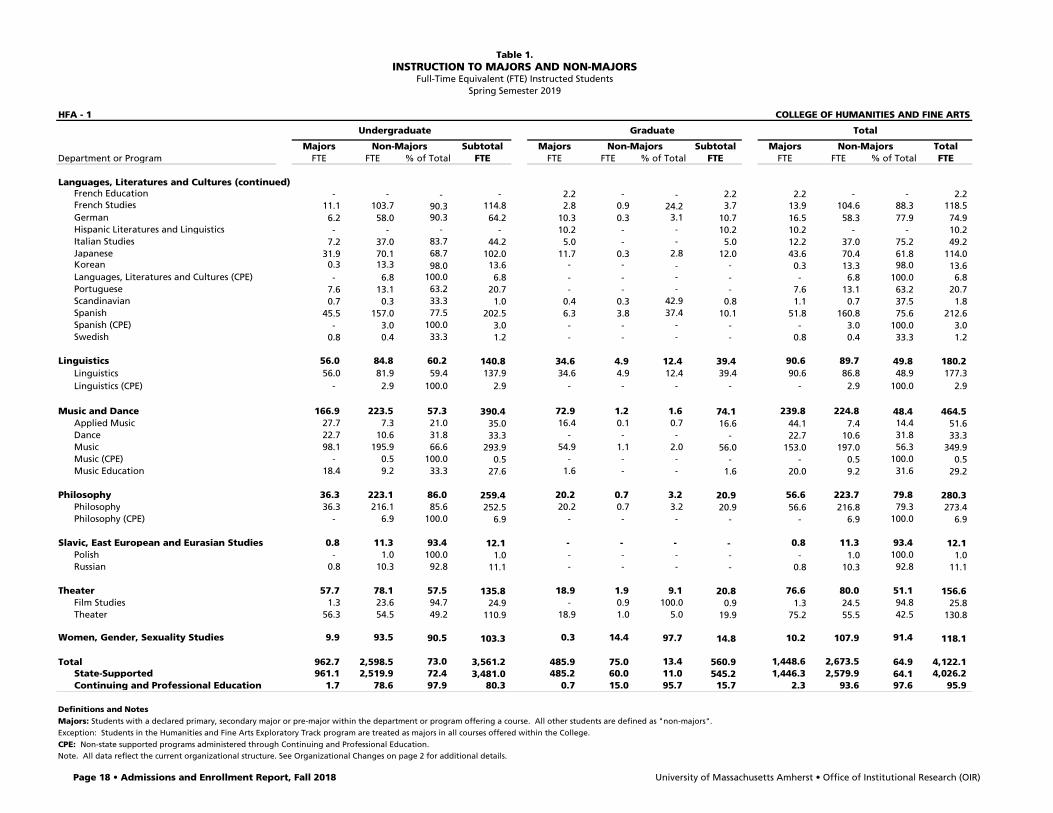
Table 1.INSTRUCTION TO MAJORS AND NON-MAJORS
Full-Time Equivalent (FTE) Instructed StudentsSpring Semester 2019
HFA - 1 COLLEGE OF HUMANITIES AND FINE ARTS
Undergraduate Graduate Total
Majors Non-Majors Subtotal Majors Non-Majors Subtotal Majors Non-Majors TotalDepartment or Program FTE FTE % of Total FTE FTE FTE % of Total FTE FTE FTE % of Total FTE
Languages, Literatures and Cultures (continued)French Education - - - - 2.2 - - 2.2 2.2 - - 2.2 French Studies 11.1 103.7 90.3 114.8 2.8 0.9 24.2 3.7 13.9 104.6 88.3 118.5 German 6.2 58.0 90.3 64.2 10.3 0.3 3.1 10.7 16.5 58.3 77.9 74.9 Hispanic Literatures and Linguistics - - - - 10.2 - - 10.2 10.2 - - 10.2 Italian Studies 7.2 37.0 83.7 44.2 5.0 - - 5.0 12.2 37.0 75.2 49.2 Japanese 31.9 70.1 68.7 102.0 11.7 0.3 2.8 12.0 43.6 70.4 61.8 114.0 Korean 0.3 13.3 98.0 13.6 - - - - 0.3 13.3 98.0 13.6 Languages, Literatures and Cultures (CPE) - 6.8 100.0 6.8 - - - - - 6.8 100.0 6.8 Portuguese 7.6 13.1 63.2 20.7 - - - - 7.6 13.1 63.2 20.7 Scandinavian 0.7 0.3 33.3 1.0 0.4 0.3 42.9 0.8 1.1 0.7 37.5 1.8 Spanish 45.5 157.0 77.5 202.5 6.3 3.8 37.4 10.1 51.8 160.8 75.6 212.6 Spanish (CPE) - 3.0 100.0 3.0 - - - - - 3.0 100.0 3.0 Swedish 0.8 0.4 33.3 1.2 - - - - 0.8 0.4 33.3 1.2
Linguistics 56.0 84.8 60.2 140.8 34.6 4.9 12.4 39.4 90.6 89.7 49.8 180.2 Linguistics 56.0 81.9 59.4 137.9 34.6 4.9 12.4 39.4 90.6 86.8 48.9 177.3 Linguistics (CPE) - 2.9 100.0 2.9 - - - - - 2.9 100.0 2.9
Music and Dance 166.9 223.5 57.3 390.4 72.9 1.2 1.6 74.1 239.8 224.8 48.4 464.5 Applied Music 27.7 7.3 21.0 35.0 16.4 0.1 0.7 16.6 44.1 7.4 14.4 51.6 Dance 22.7 10.6 31.8 33.3 - - - - 22.7 10.6 31.8 33.3 Music 98.1 195.9 66.6 293.9 54.9 1.1 2.0 56.0 153.0 197.0 56.3 349.9 Music (CPE) - 0.5 100.0 0.5 - - - - - 0.5 100.0 0.5 Music Education 18.4 9.2 33.3 27.6 1.6 - - 1.6 20.0 9.2 31.6 29.2
Philosophy 36.3 223.1 86.0 259.4 20.2 0.7 3.2 20.9 56.6 223.7 79.8 280.3 Philosophy 36.3 216.1 85.6 252.5 20.2 0.7 3.2 20.9 56.6 216.8 79.3 273.4 Philosophy (CPE) - 6.9 100.0 6.9 - - - - - 6.9 100.0 6.9
Slavic, East European and Eurasian Studies 0.8 11.3 93.4 12.1 - - - - 0.8 11.3 93.4 12.1 Polish - 1.0 100.0 1.0 - - - - - 1.0 100.0 1.0 Russian 0.8 10.3 92.8 11.1 - - - - 0.8 10.3 92.8 11.1
Theater 57.7 78.1 57.5 135.8 18.9 1.9 9.1 20.8 76.6 80.0 51.1 156.6 Film Studies 1.3 23.6 94.7 24.9 - 0.9 100.0 0.9 1.3 24.5 94.8 25.8 Theater 56.3 54.5 49.2 110.9 18.9 1.0 5.0 19.9 75.2 55.5 42.5 130.8
Women, Gender, Sexuality Studies 9.9 93.5 90.5 103.3 0.3 14.4 97.7 14.8 10.2 107.9 91.4 118.1
Total 962.7 2,598.5 73.0 3,561.2 485.9 75.0 13.4 560.9 1,448.6 2,673.5 64.9 4,122.1 State-Supported 961.1 2,519.9 72.4 3,481.0 485.2 60.0 11.0 545.2 1,446.3 2,579.9 64.1 4,026.2 Continuing and Professional Education 1.7 78.6 97.9 80.3 0.7 15.0 95.7 15.7 2.3 93.6 97.6 95.9
Definitions and NotesMajors: Students with a declared primary, secondary major or pre-major within the department or program offering a course. All other students are defined as "non-majors".Exception: Students in the Humanities and Fine Arts Exploratory Track program are treated as majors in all courses offered within the College.CPE: Non-state supported programs administered through Continuing and Professional Education.Note. All data reflect the current organizational structure. See Organizational Changes on page 2 for additional details.
Page 18 • Admissions and Enrollment Report, Fall 2018 University of Massachusetts Amherst • Office of Institutional Research (OIR)
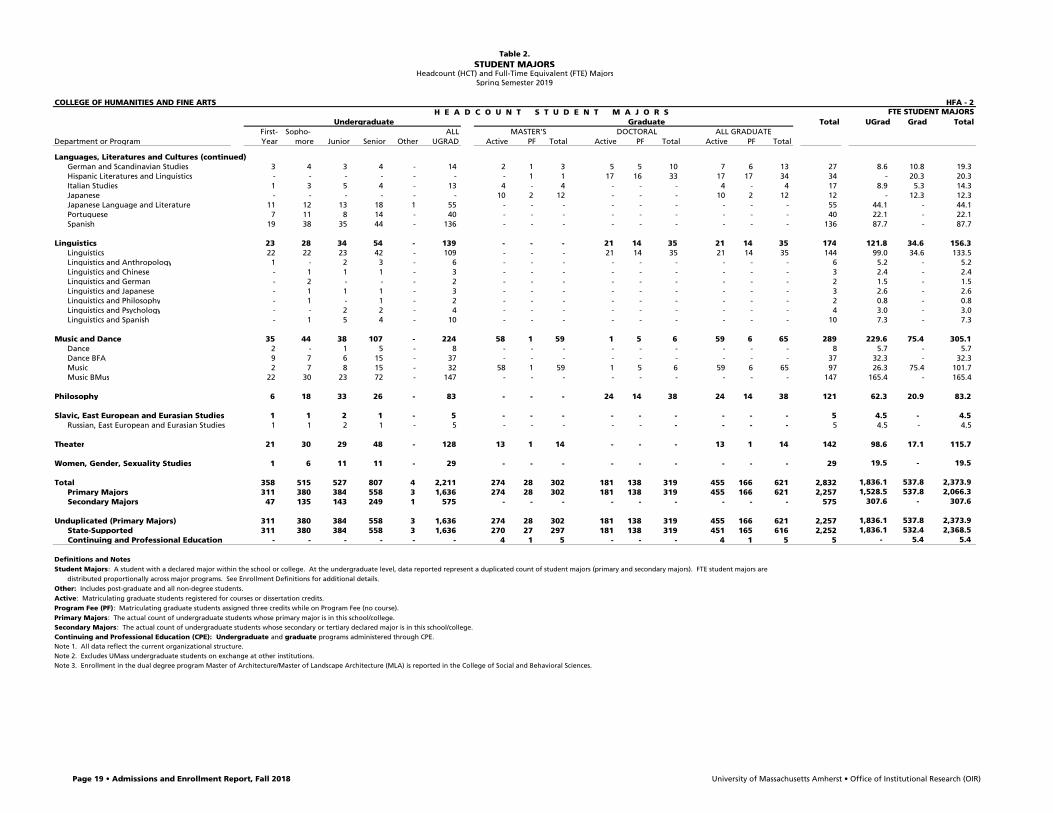
Table 2.STUDENT MAJORS
Headcount (HCT) and Full-Time Equivalent (FTE) MajorsSpring Semester 2019
COLLEGE OF HUMANITIES AND FINE ARTS HFA - 2 H E A D C O U N T S T U D E N T M A J O R S FTE STUDENT MAJORS
Undergraduate Graduate Total UGrad Grad TotalFirst- Sopho- ALL MASTER'S DOCTORAL ALL GRADUATE
Department or Program Year more Junior Senior Other UGRAD Active PF Total Active PF Total Active PF Total
Languages, Literatures and Cultures (continued)German and Scandinavian Studies 3 4 3 4 - 14 2 1 3 5 5 10 7 6 13 27 8.6 10.8 19.3 Hispanic Literatures and Linguistics - - - - - - - 1 1 17 16 33 17 17 34 34 - 20.3 20.3 Italian Studies 1 3 5 4 - 13 4 - 4 - - - 4 - 4 17 8.9 5.3 14.3 Japanese - - - - - - 10 2 12 - - - 10 2 12 12 - 12.3 12.3 Japanese Language and Literature 11 12 13 18 1 55 - - - - - - - - - 55 44.1 - 44.1 Portuguese 7 11 8 14 - 40 - - - - - - - - - 40 22.1 - 22.1 Spanish 19 38 35 44 - 136 - - - - - - - - - 136 87.7 - 87.7
Linguistics 23 28 34 54 - 139 - - - 21 14 35 21 14 35 174 121.8 34.6 156.3 Linguistics 22 22 23 42 - 109 - - - 21 14 35 21 14 35 144 99.0 34.6 133.5 Linguistics and Anthropology 1 - 2 3 - 6 - - - - - - - - - 6 5.2 - 5.2 Linguistics and Chinese - 1 1 1 - 3 - - - - - - - - - 3 2.4 - 2.4 Linguistics and German - 2 - - - 2 - - - - - - - - - 2 1.5 - 1.5 Linguistics and Japanese - 1 1 1 - 3 - - - - - - - - - 3 2.6 - 2.6 Linguistics and Philosophy - 1 - 1 - 2 - - - - - - - - - 2 0.8 - 0.8 Linguistics and Psychology - - 2 2 - 4 - - - - - - - - - 4 3.0 - 3.0 Linguistics and Spanish - 1 5 4 - 10 - - - - - - - - - 10 7.3 - 7.3
Music and Dance 35 44 38 107 - 224 58 1 59 1 5 6 59 6 65 289 229.6 75.4 305.1 Dance 2 - 1 5 - 8 - - - - - - - - - 8 5.7 - 5.7 Dance BFA 9 7 6 15 - 37 - - - - - - - - - 37 32.3 - 32.3 Music 2 7 8 15 - 32 58 1 59 1 5 6 59 6 65 97 26.3 75.4 101.7 Music BMus 22 30 23 72 - 147 - - - - - - - - - 147 165.4 - 165.4
Philosophy 6 18 33 26 - 83 - - - 24 14 38 24 14 38 121 62.3 20.9 83.2
Slavic, East European and Eurasian Studies 1 1 2 1 - 5 - - - - - - - - - 5 4.5 - 4.5 Russian, East European and Eurasian Studies 1 1 2 1 - 5 - - - - - - - - - 5 4.5 - 4.5
Theater 21 30 29 48 - 128 13 1 14 - - - 13 1 14 142 98.6 17.1 115.7
Women, Gender, Sexuality Studies 1 6 11 11 - 29 - - - - - - - - - 29 19.5 - 19.5
Total 358 515 527 807 4 2,211 274 28 302 181 138 319 455 166 621 2,832 1,836.1 537.8 2,373.9 Primary Majors 311 380 384 558 3 1,636 274 28 302 181 138 319 455 166 621 2,257 1,528.5 537.8 2,066.3 Secondary Majors 47 135 143 249 1 575 - - - - - - - - - 575 307.6 - 307.6
Unduplicated (Primary Majors) 311 380 384 558 3 1,636 274 28 302 181 138 319 455 166 621 2,257 1,836.1 537.8 2,373.9 State-Supported 311 380 384 558 3 1,636 270 27 297 181 138 319 451 165 616 2,252 1,836.1 532.4 2,368.5 Continuing and Professional Education - - - - - - 4 1 5 - - - 4 1 5 5 - 5.4 5.4
Definitions and NotesStudent Majors: A student with a declared major within the school or college. At the undergraduate level, data reported represent a duplicated count of student majors (primary and secondary majors). FTE student majors are
distributed proportionally across major programs. See Enrollment Definitions for additional details.Other: Includes post-graduate and all non-degree students.Active: Matriculating graduate students registered for courses or dissertation credits.Program Fee (PF): Matriculating graduate students assigned three credits while on Program Fee (no course).Primary Majors: The actual count of undergraduate students whose primary major is in this school/college.Secondary Majors: The actual count of undergraduate students whose secondary or tertiary declared major is in this school/college.Continuing and Professional Education (CPE): Undergraduate and graduate programs administered through CPE. Note 1. All data reflect the current organizational structure. Note 2. Excludes UMass undergraduate students on exchange at other institutions.Note 3. Enrollment in the dual degree program Master of Architecture/Master of Landscape Architecture (MLA) is reported in the College of Social and Behavioral Sciences.
Page 19 • Admissions and Enrollment Report, Fall 2018 University of Massachusetts Amherst • Office of Institutional Research (OIR)
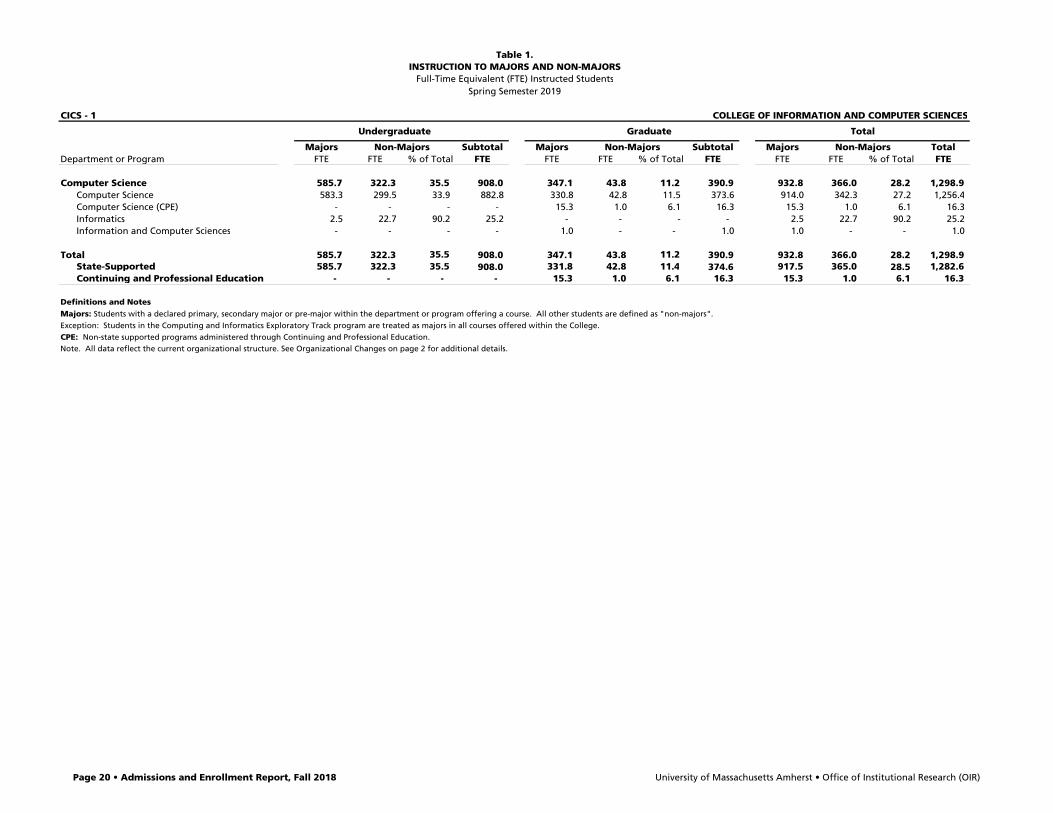
Table 1.INSTRUCTION TO MAJORS AND NON-MAJORS
Full-Time Equivalent (FTE) Instructed StudentsSpring Semester 2019
CICS - 1 COLLEGE OF INFORMATION AND COMPUTER SCIENCES
Undergraduate Graduate Total
Majors Non-Majors Subtotal Majors Non-Majors Subtotal Majors Non-Majors TotalDepartment or Program FTE FTE % of Total FTE FTE FTE % of Total FTE FTE FTE % of Total FTE
Computer Science 585.7 322.3 35.5 908.0 347.1 43.8 11.2 390.9 932.8 366.0 28.2 1,298.9 Computer Science 583.3 299.5 33.9 882.8 330.8 42.8 11.5 373.6 914.0 342.3 27.2 1,256.4 Computer Science (CPE) - - - - 15.3 1.0 6.1 16.3 15.3 1.0 6.1 16.3 Informatics 2.5 22.7 90.2 25.2 - - - - 2.5 22.7 90.2 25.2 Information and Computer Sciences - - - - 1.0 - - 1.0 1.0 - - 1.0
Total 585.7 322.3 35.5 908.0 347.1 43.8 11.2 390.9 932.8 366.0 28.2 1,298.9 State-Supported 585.7 322.3 35.5 908.0 331.8 42.8 11.4 374.6 917.5 365.0 28.5 1,282.6 Continuing and Professional Education - - - - 15.3 1.0 6.1 16.3 15.3 1.0 6.1 16.3
Definitions and NotesMajors: Students with a declared primary, secondary major or pre-major within the department or program offering a course. All other students are defined as "non-majors".Exception: Students in the Computing and Informatics Exploratory Track program are treated as majors in all courses offered within the College.CPE: Non-state supported programs administered through Continuing and Professional Education.Note. All data reflect the current organizational structure. See Organizational Changes on page 2 for additional details.
Page 20 • Admissions and Enrollment Report, Fall 2018 University of Massachusetts Amherst • Office of Institutional Research (OIR)
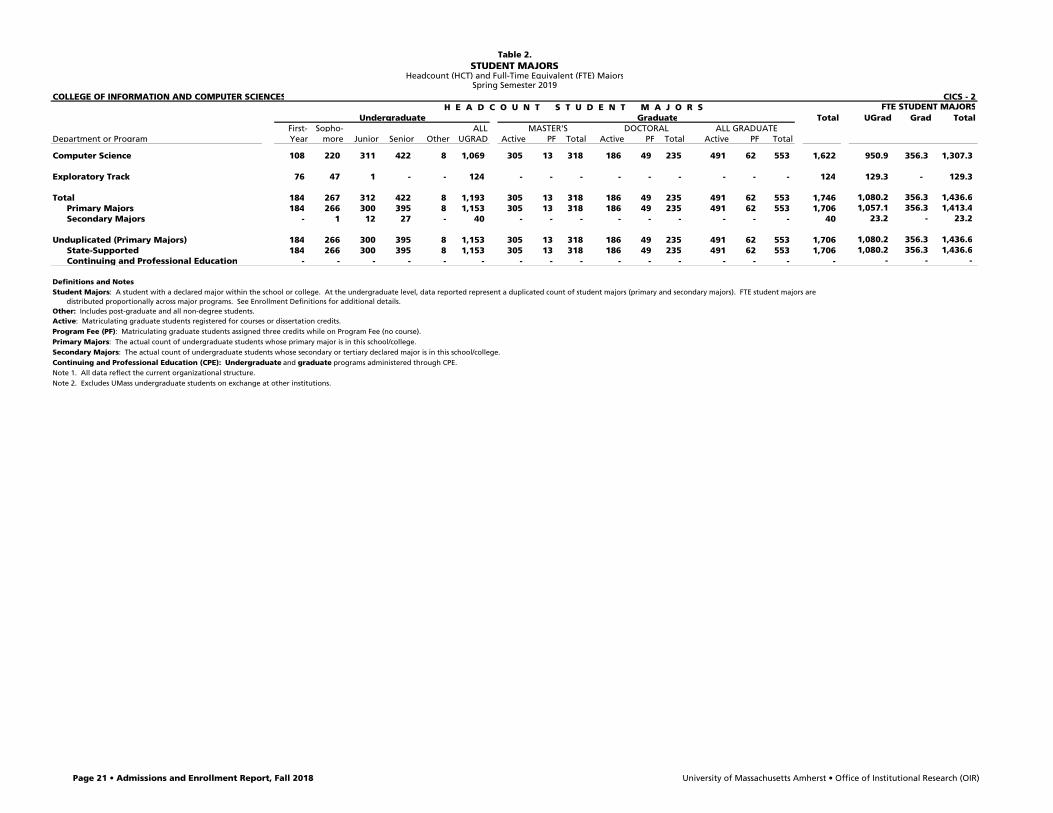
Table 2.STUDENT MAJORS
Headcount (HCT) and Full-Time Equivalent (FTE) Majors
COLLEGE OF INFORMATION AND COMPUTER SCIENCES CICS - 2 H E A D C O U N T S T U D E N T M A J O R S FTE STUDENT MAJORS
Undergraduate Graduate Total UGrad Grad TotalFirst- Sopho- ALL MASTER'S DOCTORAL ALL GRADUATE
Department or Program Year more Junior Senior Other UGRAD Active PF Total Active PF Total Active PF Total
Computer Science 108 220 311 422 8 1,069 305 13 318 186 49 235 491 62 553 1,622 950.9 356.3 1,307.3
Exploratory Track 76 47 1 - - 124 - - - - - - - - - 124 129.3 - 129.3
Total 184 267 312 422 8 1,193 305 13 318 186 49 235 491 62 553 1,746 1,080.2 356.3 1,436.6 Primary Majors 184 266 300 395 8 1,153 305 13 318 186 49 235 491 62 553 1,706 1,057.1 356.3 1,413.4 Secondary Majors - 1 12 27 - 40 - - - - - - - - - 40 23.2 - 23.2
Unduplicated (Primary Majors) 184 266 300 395 8 1,153 305 13 318 186 49 235 491 62 553 1,706 1,080.2 356.3 1,436.6 State-Supported 184 266 300 395 8 1,153 305 13 318 186 49 235 491 62 553 1,706 1,080.2 356.3 1,436.6 Continuing and Professional Education - - - - - - - - - - - - - - - - - - -
Definitions and NotesStudent Majors: A student with a declared major within the school or college. At the undergraduate level, data reported represent a duplicated count of student majors (primary and secondary majors). FTE student majors are
distributed proportionally across major programs. See Enrollment Definitions for additional details.Other: Includes post-graduate and all non-degree students.Active: Matriculating graduate students registered for courses or dissertation credits.Program Fee (PF): Matriculating graduate students assigned three credits while on Program Fee (no course).Primary Majors: The actual count of undergraduate students whose primary major is in this school/college.Secondary Majors: The actual count of undergraduate students whose secondary or tertiary declared major is in this school/college.Continuing and Professional Education (CPE): Undergraduate and graduate programs administered through CPE. Note 1. All data reflect the current organizational structure. Note 2. Excludes UMass undergraduate students on exchange at other institutions.
Spring Semester 2019
Page 21 • Admissions and Enrollment Report, Fall 2018 University of Massachusetts Amherst • Office of Institutional Research (OIR)
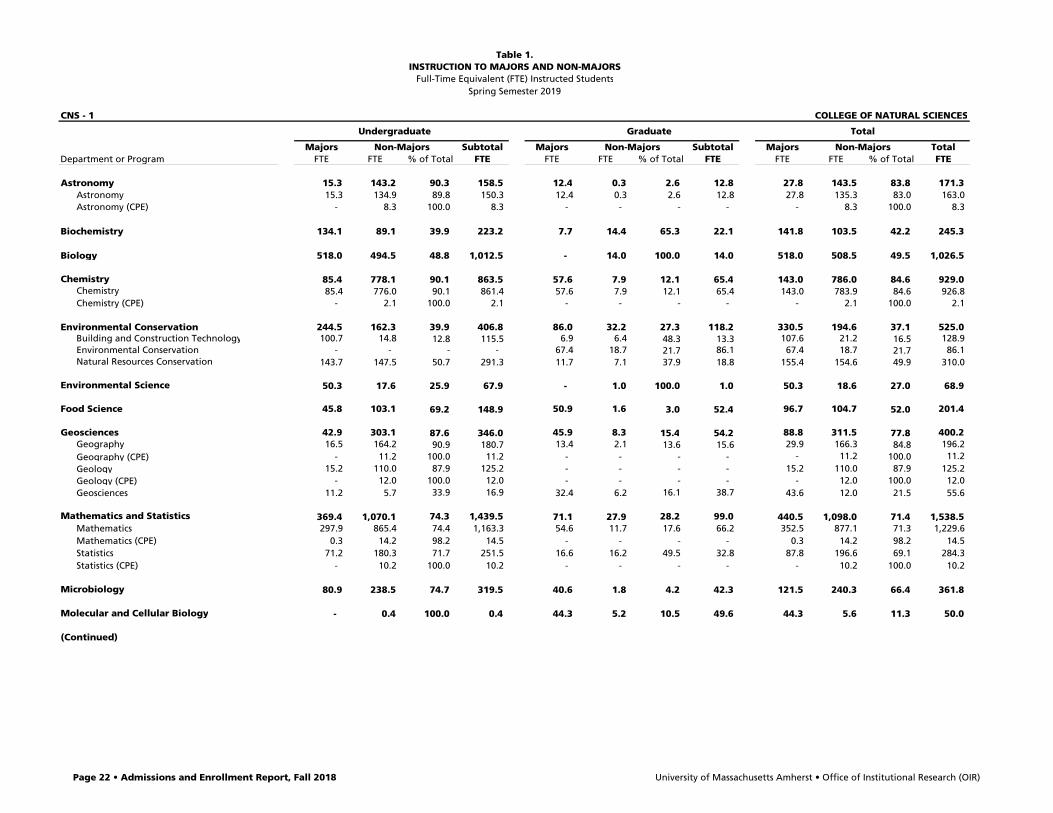
Table 1.INSTRUCTION TO MAJORS AND NON-MAJORS
Full-Time Equivalent (FTE) Instructed StudentsSpring Semester 2019
CNS - 1 COLLEGE OF NATURAL SCIENCES
Undergraduate Graduate Total
Majors Non-Majors Subtotal Majors Non-Majors Subtotal Majors Non-Majors TotalDepartment or Program FTE FTE % of Total FTE FTE FTE % of Total FTE FTE FTE % of Total FTE
Astronomy 15.3 143.2 90.3 158.5 12.4 0.3 2.6 12.8 27.8 143.5 83.8 171.3 Astronomy 15.3 134.9 89.8 150.3 12.4 0.3 2.6 12.8 27.8 135.3 83.0 163.0 Astronomy (CPE) - 8.3 100.0 8.3 - - - - - 8.3 100.0 8.3
Biochemistry 134.1 89.1 39.9 223.2 7.7 14.4 65.3 22.1 141.8 103.5 42.2 245.3
Biology 518.0 494.5 48.8 1,012.5 - 14.0 100.0 14.0 518.0 508.5 49.5 1,026.5
Chemistry 85.4 778.1 90.1 863.5 57.6 7.9 12.1 65.4 143.0 786.0 84.6 929.0 Chemistry 85.4 776.0 90.1 861.4 57.6 7.9 12.1 65.4 143.0 783.9 84.6 926.8 Chemistry (CPE) - 2.1 100.0 2.1 - - - - - 2.1 100.0 2.1
Environmental Conservation 244.5 162.3 39.9 406.8 86.0 32.2 27.3 118.2 330.5 194.6 37.1 525.0 Building and Construction Technology 100.7 14.8 12.8 115.5 6.9 6.4 48.3 13.3 107.6 21.2 16.5 128.9 Environmental Conservation - - - - 67.4 18.7 21.7 86.1 67.4 18.7 21.7 86.1 Natural Resources Conservation 143.7 147.5 50.7 291.3 11.7 7.1 37.9 18.8 155.4 154.6 49.9 310.0
Environmental Science 50.3 17.6 25.9 67.9 - 1.0 100.0 1.0 50.3 18.6 27.0 68.9
Food Science 45.8 103.1 69.2 148.9 50.9 1.6 3.0 52.4 96.7 104.7 52.0 201.4
Geosciences 42.9 303.1 87.6 346.0 45.9 8.3 15.4 54.2 88.8 311.5 77.8 400.2 Geography 16.5 164.2 90.9 180.7 13.4 2.1 13.6 15.6 29.9 166.3 84.8 196.2 Geography (CPE) - 11.2 100.0 11.2 - - - - - 11.2 100.0 11.2 Geology 15.2 110.0 87.9 125.2 - - - - 15.2 110.0 87.9 125.2 Geology (CPE) - 12.0 100.0 12.0 - - - - - 12.0 100.0 12.0 Geosciences 11.2 5.7 33.9 16.9 32.4 6.2 16.1 38.7 43.6 12.0 21.5 55.6
Mathematics and Statistics 369.4 1,070.1 74.3 1,439.5 71.1 27.9 28.2 99.0 440.5 1,098.0 71.4 1,538.5 Mathematics 297.9 865.4 74.4 1,163.3 54.6 11.7 17.6 66.2 352.5 877.1 71.3 1,229.6 Mathematics (CPE) 0.3 14.2 98.2 14.5 - - - - 0.3 14.2 98.2 14.5 Statistics 71.2 180.3 71.7 251.5 16.6 16.2 49.5 32.8 87.8 196.6 69.1 284.3 Statistics (CPE) - 10.2 100.0 10.2 - - - - - 10.2 100.0 10.2
Microbiology 80.9 238.5 74.7 319.5 40.6 1.8 4.2 42.3 121.5 240.3 66.4 361.8
Molecular and Cellular Biology - 0.4 100.0 0.4 44.3 5.2 10.5 49.6 44.3 5.6 11.3 50.0
(Continued)
Page 22 • Admissions and Enrollment Report, Fall 2018 University of Massachusetts Amherst • Office of Institutional Research (OIR)
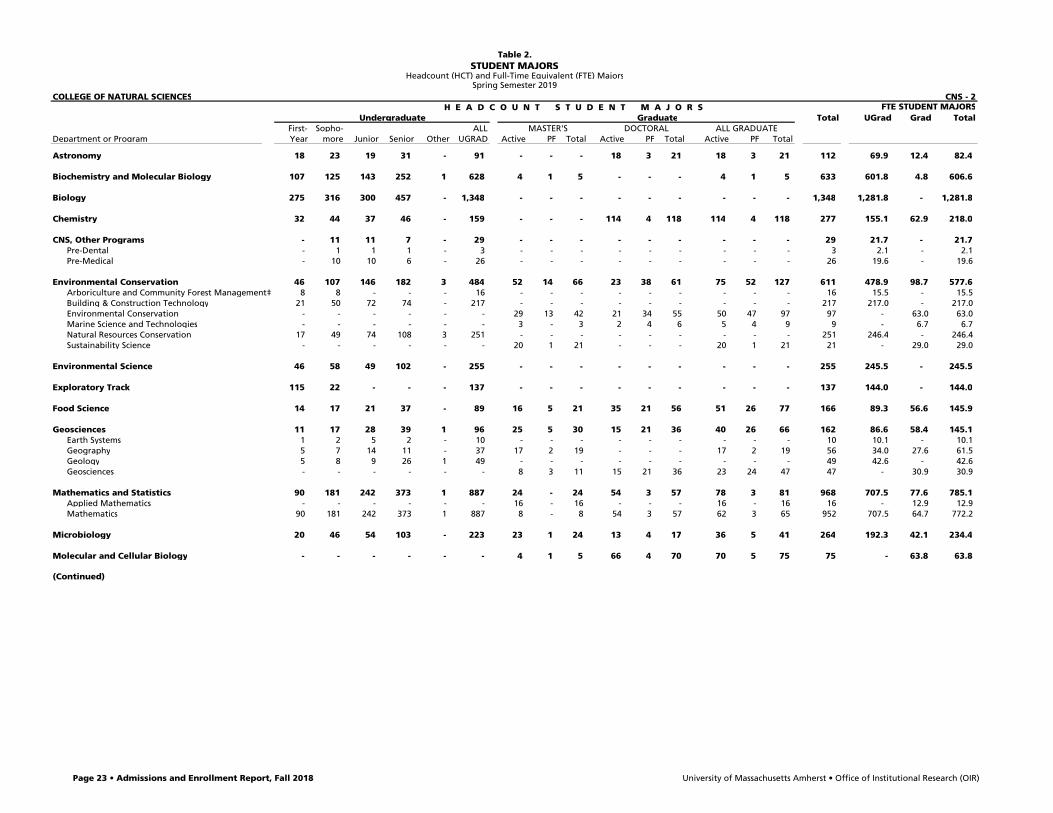
Table 2.STUDENT MAJORS
Headcount (HCT) and Full-Time Equivalent (FTE) Majors
COLLEGE OF NATURAL SCIENCES CNS - 2 H E A D C O U N T S T U D E N T M A J O R S FTE STUDENT MAJORS
Undergraduate Graduate Total UGrad Grad TotalFirst- Sopho- ALL MASTER'S DOCTORAL ALL GRADUATE
Department or Program Year more Junior Senior Other UGRAD Active PF Total Active PF Total Active PF Total
Astronomy 18 23 19 31 - 91 - - - 18 3 21 18 3 21 112 69.9 12.4 82.4
Biochemistry and Molecular Biology 107 125 143 252 1 628 4 1 5 - - - 4 1 5 633 601.8 4.8 606.6
Biology 275 316 300 457 - 1,348 - - - - - - - - - 1,348 1,281.8 - 1,281.8
Chemistry 32 44 37 46 - 159 - - - 114 4 118 114 4 118 277 155.1 62.9 218.0
CNS, Other Programs - 11 11 7 - 29 - - - - - - - - - 29 21.7 - 21.7 Pre-Dental - 1 1 1 - 3 - - - - - - - - - 3 2.1 - 2.1 Pre-Medical - 10 10 6 - 26 - - - - - - - - - 26 19.6 - 19.6
Environmental Conservation 46 107 146 182 3 484 52 14 66 23 38 61 75 52 127 611 478.9 98.7 577.6 Arboriculture and Community Forest Management‡ 8 8 - - - 16 - - - - - - - - - 16 15.5 - 15.5 Building & Construction Technology 21 50 72 74 - 217 - - - - - - - - - 217 217.0 - 217.0 Environmental Conservation - - - - - - 29 13 42 21 34 55 50 47 97 97 - 63.0 63.0 Marine Science and Technologies - - - - - - 3 - 3 2 4 6 5 4 9 9 - 6.7 6.7 Natural Resources Conservation 17 49 74 108 3 251 - - - - - - - - - 251 246.4 - 246.4 Sustainability Science - - - - - - 20 1 21 - - - 20 1 21 21 - 29.0 29.0
Environmental Science 46 58 49 102 - 255 - - - - - - - - - 255 245.5 - 245.5
Exploratory Track 115 22 - - - 137 - - - - - - - - - 137 144.0 - 144.0
Food Science 14 17 21 37 - 89 16 5 21 35 21 56 51 26 77 166 89.3 56.6 145.9
Geosciences 11 17 28 39 1 96 25 5 30 15 21 36 40 26 66 162 86.6 58.4 145.1 Earth Systems 1 2 5 2 - 10 - - - - - - - - - 10 10.1 - 10.1 Geography 5 7 14 11 - 37 17 2 19 - - - 17 2 19 56 34.0 27.6 61.5 Geology 5 8 9 26 1 49 - - - - - - - - - 49 42.6 - 42.6 Geosciences - - - - - - 8 3 11 15 21 36 23 24 47 47 - 30.9 30.9
Mathematics and Statistics 90 181 242 373 1 887 24 - 24 54 3 57 78 3 81 968 707.5 77.6 785.1 Applied Mathematics - - - - - - 16 - 16 - - - 16 - 16 16 - 12.9 12.9 Mathematics 90 181 242 373 1 887 8 - 8 54 3 57 62 3 65 952 707.5 64.7 772.2
Microbiology 20 46 54 103 - 223 23 1 24 13 4 17 36 5 41 264 192.3 42.1 234.4
Molecular and Cellular Biology - - - - - - 4 1 5 66 4 70 70 5 75 75 - 63.8 63.8
(Continued)
Spring Semester 2019
Page 23 • Admissions and Enrollment Report, Fall 2018 University of Massachusetts Amherst • Office of Institutional Research (OIR)
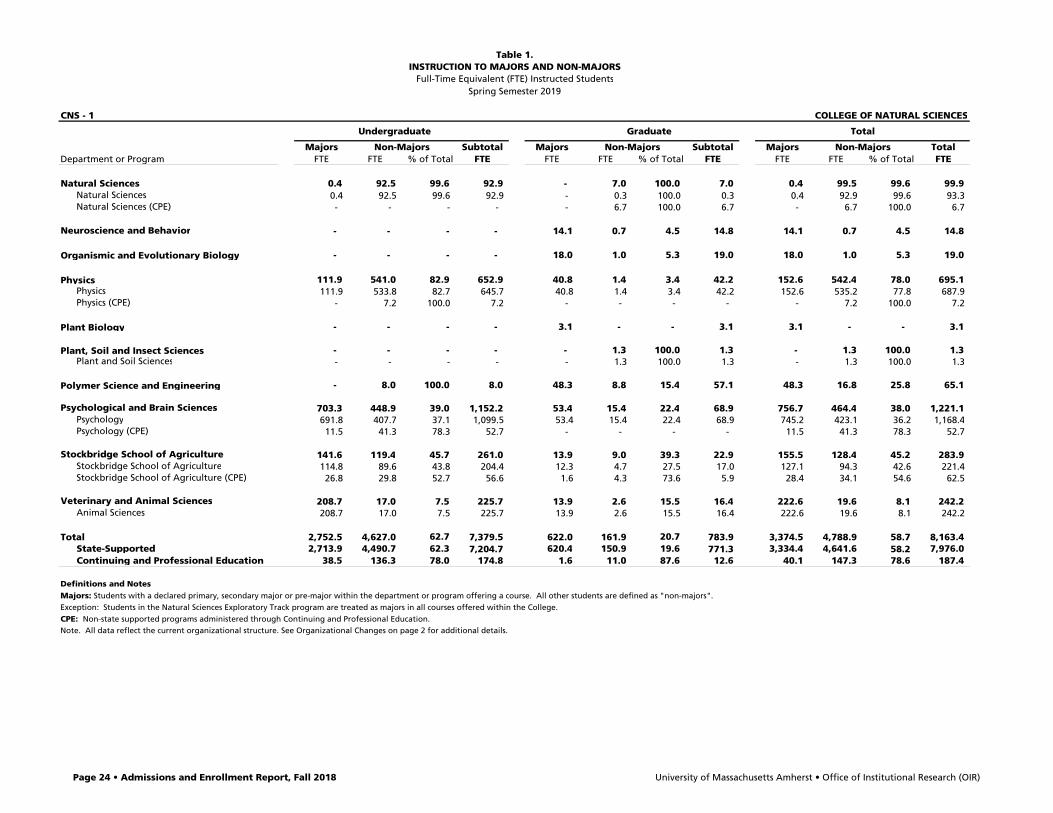
Table 1.INSTRUCTION TO MAJORS AND NON-MAJORS
Full-Time Equivalent (FTE) Instructed StudentsSpring Semester 2019
CNS - 1 COLLEGE OF NATURAL SCIENCES
Undergraduate Graduate Total
Majors Non-Majors Subtotal Majors Non-Majors Subtotal Majors Non-Majors TotalDepartment or Program FTE FTE % of Total FTE FTE FTE % of Total FTE FTE FTE % of Total FTE
Natural Sciences 0.4 92.5 99.6 92.9 - 7.0 100.0 7.0 0.4 99.5 99.6 99.9 Natural Sciences 0.4 92.5 99.6 92.9 - 0.3 100.0 0.3 0.4 92.9 99.6 93.3 Natural Sciences (CPE) - - - - - 6.7 100.0 6.7 - 6.7 100.0 6.7
Neuroscience and Behavior - - - - 14.1 0.7 4.5 14.8 14.1 0.7 4.5 14.8
Organismic and Evolutionary Biology - - - - 18.0 1.0 5.3 19.0 18.0 1.0 5.3 19.0
Physics 111.9 541.0 82.9 652.9 40.8 1.4 3.4 42.2 152.6 542.4 78.0 695.1 Physics 111.9 533.8 82.7 645.7 40.8 1.4 3.4 42.2 152.6 535.2 77.8 687.9 Physics (CPE) - 7.2 100.0 7.2 - - - - - 7.2 100.0 7.2
Plant Biology - - - - 3.1 - - 3.1 3.1 - - 3.1
Plant, Soil and Insect Sciences - - - - - 1.3 100.0 1.3 - 1.3 100.0 1.3 Plant and Soil Sciences - - - - - 1.3 100.0 1.3 - 1.3 100.0 1.3
Polymer Science and Engineering - 8.0 100.0 8.0 48.3 8.8 15.4 57.1 48.3 16.8 25.8 65.1
Psychological and Brain Sciences 703.3 448.9 39.0 1,152.2 53.4 15.4 22.4 68.9 756.7 464.4 38.0 1,221.1 Psychology 691.8 407.7 37.1 1,099.5 53.4 15.4 22.4 68.9 745.2 423.1 36.2 1,168.4 Psychology (CPE) 11.5 41.3 78.3 52.7 - - - - 11.5 41.3 78.3 52.7
Stockbridge School of Agriculture 141.6 119.4 45.7 261.0 13.9 9.0 39.3 22.9 155.5 128.4 45.2 283.9 Stockbridge School of Agriculture 114.8 89.6 43.8 204.4 12.3 4.7 27.5 17.0 127.1 94.3 42.6 221.4 Stockbridge School of Agriculture (CPE) 26.8 29.8 52.7 56.6 1.6 4.3 73.6 5.9 28.4 34.1 54.6 62.5
Veterinary and Animal Sciences 208.7 17.0 7.5 225.7 13.9 2.6 15.5 16.4 222.6 19.6 8.1 242.2 Animal Sciences 208.7 17.0 7.5 225.7 13.9 2.6 15.5 16.4 222.6 19.6 8.1 242.2
Total 2,752.5 4,627.0 62.7 7,379.5 622.0 161.9 20.7 783.9 3,374.5 4,788.9 58.7 8,163.4 State-Supported 2,713.9 4,490.7 62.3 7,204.7 620.4 150.9 19.6 771.3 3,334.4 4,641.6 58.2 7,976.0 Continuing and Professional Education 38.5 136.3 78.0 174.8 1.6 11.0 87.6 12.6 40.1 147.3 78.6 187.4
Definitions and NotesMajors: Students with a declared primary, secondary major or pre-major within the department or program offering a course. All other students are defined as "non-majors".Exception: Students in the Natural Sciences Exploratory Track program are treated as majors in all courses offered within the College.CPE: Non-state supported programs administered through Continuing and Professional Education.Note. All data reflect the current organizational structure. See Organizational Changes on page 2 for additional details.
Page 24 • Admissions and Enrollment Report, Fall 2018 University of Massachusetts Amherst • Office of Institutional Research (OIR)
COLLEGE OF NATURAL SCIENCES CNS - 2 H E A D C O U N T S T U D E N T M A J O R S FTE STUDENT MAJORS
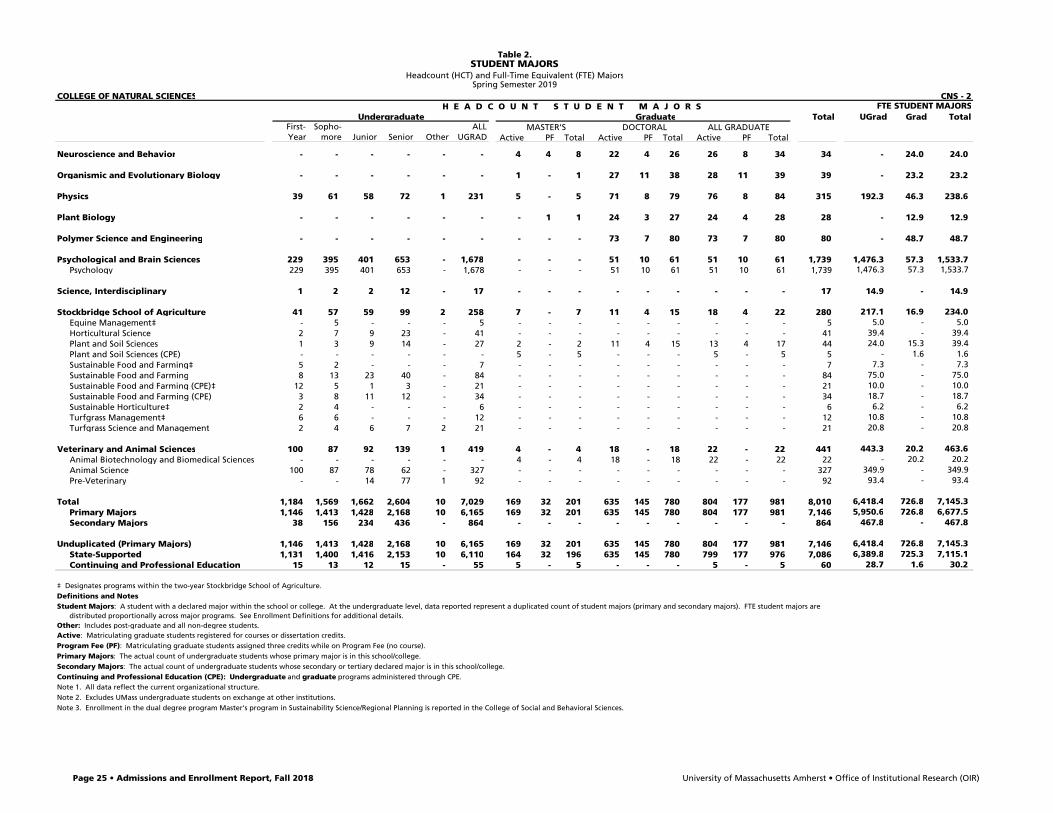
Undergraduate Graduate Total UGrad Grad TotalFirst- Sopho- ALL MASTER'S DOCTORAL ALL GRADUATEYear more Junior Senior Other UGRAD Active PF Total Active PF Total Active PF Total
Neuroscience and Behavior - - - - - - 4 4 8 22 4 26 26 8 34 34 - 24.0 24.0
Organismic and Evolutionary Biology - - - - - - 1 - 1 27 11 38 28 11 39 39 - 23.2 23.2
Physics 39 61 58 72 1 231 5 - 5 71 8 79 76 8 84 315 192.3 46.3 238.6
Plant Biology - - - - - - - 1 1 24 3 27 24 4 28 28 - 12.9 12.9
Polymer Science and Engineering - - - - - - - - - 73 7 80 73 7 80 80 - 48.7 48.7
Psychological and Brain Sciences 229 395 401 653 - 1,678 - - - 51 10 61 51 10 61 1,739 1,476.3 57.3 1,533.7 Psychology 229 395 401 653 - 1,678 - - - 51 10 61 51 10 61 1,739 1,476.3 57.3 1,533.7
Science, Interdisciplinary 1 2 2 12 - 17 - - - - - - - - - 17 14.9 - 14.9
Stockbridge School of Agriculture 41 57 59 99 2 258 7 - 7 11 4 15 18 4 22 280 217.1 16.9 234.0 Equine Management‡ - 5 - - - 5 - - - - - - - - - 5 5.0 - 5.0 Horticultural Science 2 7 9 23 - 41 - - - - - - - - - 41 39.4 - 39.4 Plant and Soil Sciences 1 3 9 14 - 27 2 - 2 11 4 15 13 4 17 44 24.0 15.3 39.4 Plant and Soil Sciences (CPE) - - - - - - 5 - 5 - - - 5 - 5 5 - 1.6 1.6 Sustainable Food and Farming‡ 5 2 - - - 7 - - - - - - - - - 7 7.3 - 7.3 Sustainable Food and Farming 8 13 23 40 - 84 - - - - - - - - - 84 75.0 - 75.0 Sustainable Food and Farming (CPE)‡ 12 5 1 3 - 21 - - - - - - - - - 21 10.0 - 10.0 Sustainable Food and Farming (CPE) 3 8 11 12 - 34 - - - - - - - - - 34 18.7 - 18.7 Sustainable Horticulture‡ 2 4 - - - 6 - - - - - - - - - 6 6.2 - 6.2 Turfgrass Management‡ 6 6 - - - 12 - - - - - - - - - 12 10.8 - 10.8 Turfgrass Science and Management 2 4 6 7 2 21 - - - - - - - - - 21 20.8 - 20.8
Veterinary and Animal Sciences 100 87 92 139 1 419 4 - 4 18 - 18 22 - 22 441 443.3 20.2 463.6 Animal Biotechnology and Biomedical Sciences - - - - - - 4 - 4 18 - 18 22 - 22 22 - 20.2 20.2 Animal Science 100 87 78 62 - 327 - - - - - - - - - 327 349.9 - 349.9 Pre-Veterinary - - 14 77 1 92 - - - - - - - - - 92 93.4 - 93.4
Total 1,184 1,569 1,662 2,604 10 7,029 169 32 201 635 145 780 804 177 981 8,010 6,418.4 726.8 7,145.3 Primary Majors 1,146 1,413 1,428 2,168 10 6,165 169 32 201 635 145 780 804 177 981 7,146 5,950.6 726.8 6,677.5 Secondary Majors 38 156 234 436 - 864 - - - - - - - - - 864 467.8 - 467.8
Unduplicated (Primary Majors) 1,146 1,413 1,428 2,168 10 6,165 169 32 201 635 145 780 804 177 981 7,146 6,418.4 726.8 7,145.3 State-Supported 1,131 1,400 1,416 2,153 10 6,110 164 32 196 635 145 780 799 177 976 7,086 6,389.8 725.3 7,115.1 Continuing and Professional Education 15 13 12 15 - 55 5 - 5 - - - 5 - 5 60 28.7 1.6 30.2
‡ Designates programs within the two-year Stockbridge School of Agriculture.Definitions and NotesStudent Majors: A student with a declared major within the school or college. At the undergraduate level, data reported represent a duplicated count of student majors (primary and secondary majors). FTE student majors are
distributed proportionally across major programs. See Enrollment Definitions for additional details.Other: Includes post-graduate and all non-degree students.Active: Matriculating graduate students registered for courses or dissertation credits.Program Fee (PF): Matriculating graduate students assigned three credits while on Program Fee (no course).Primary Majors: The actual count of undergraduate students whose primary major is in this school/college.Secondary Majors: The actual count of undergraduate students whose secondary or tertiary declared major is in this school/college.Continuing and Professional Education (CPE): Undergraduate and graduate programs administered through CPE. Note 1. All data reflect the current organizational structure. Note 2. Excludes UMass undergraduate students on exchange at other institutions.Note 3. Enrollment in the dual degree program Master's program in Sustainability Science/Regional Planning is reported in the College of Social and Behavioral Sciences.
Table 2.STUDENT MAJORS
Headcount (HCT) and Full-Time Equivalent (FTE) MajorsSpring Semester 2019
Page 25 • Admissions and Enrollment Report, Fall 2018 University of Massachusetts Amherst • Office of Institutional Research (OIR)
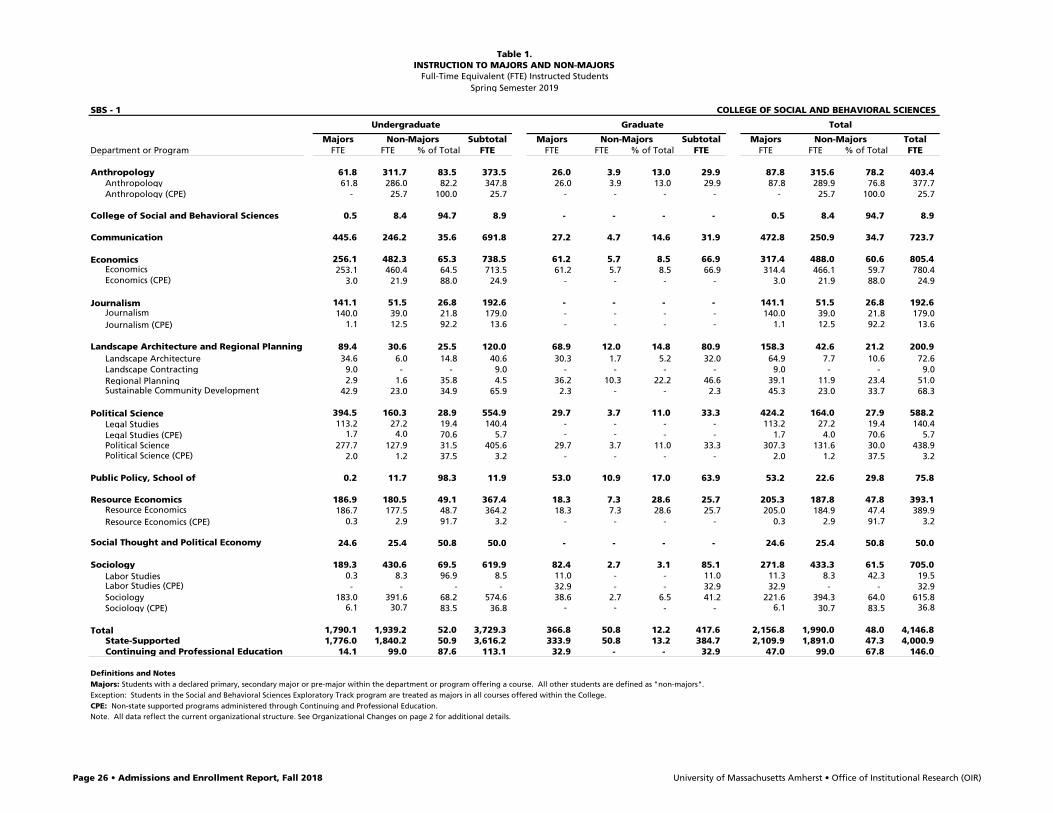
Table 1.INSTRUCTION TO MAJORS AND NON-MAJORS
Full-Time Equivalent (FTE) Instructed StudentsSpring Semester 2019
SBS - 1 COLLEGE OF SOCIAL AND BEHAVIORAL SCIENCES
Undergraduate Graduate Total
Majors Non-Majors Subtotal Majors Non-Majors Subtotal Majors Non-Majors TotalDepartment or Program FTE FTE % of Total FTE FTE FTE % of Total FTE FTE FTE % of Total FTE
Anthropology 61.8 311.7 83.5 373.5 26.0 3.9 13.0 29.9 87.8 315.6 78.2 403.4 Anthropology 61.8 286.0 82.2 347.8 26.0 3.9 13.0 29.9 87.8 289.9 76.8 377.7 Anthropology (CPE) - 25.7 100.0 25.7 - - - - - 25.7 100.0 25.7
College of Social and Behavioral Sciences 0.5 8.4 94.7 8.9 - - - - 0.5 8.4 94.7 8.9
Communication 445.6 246.2 35.6 691.8 27.2 4.7 14.6 31.9 472.8 250.9 34.7 723.7
Economics 256.1 482.3 65.3 738.5 61.2 5.7 8.5 66.9 317.4 488.0 60.6 805.4 Economics 253.1 460.4 64.5 713.5 61.2 5.7 8.5 66.9 314.4 466.1 59.7 780.4 Economics (CPE) 3.0 21.9 88.0 24.9 - - - - 3.0 21.9 88.0 24.9
Journalism 141.1 51.5 26.8 192.6 - - - - 141.1 51.5 26.8 192.6 Journalism 140.0 39.0 21.8 179.0 - - - - 140.0 39.0 21.8 179.0 Journalism (CPE) 1.1 12.5 92.2 13.6 - - - - 1.1 12.5 92.2 13.6
Landscape Architecture and Regional Planning 89.4 30.6 25.5 120.0 68.9 12.0 14.8 80.9 158.3 42.6 21.2 200.9 Landscape Architecture 34.6 6.0 14.8 40.6 30.3 1.7 5.2 32.0 64.9 7.7 10.6 72.6 Landscape Contracting 9.0 - - 9.0 - - - - 9.0 - - 9.0 Regional Planning 2.9 1.6 35.8 4.5 36.2 10.3 22.2 46.6 39.1 11.9 23.4 51.0 Sustainable Community Development 42.9 23.0 34.9 65.9 2.3 - - 2.3 45.3 23.0 33.7 68.3
Political Science 394.5 160.3 28.9 554.9 29.7 3.7 11.0 33.3 424.2 164.0 27.9 588.2 Legal Studies 113.2 27.2 19.4 140.4 - - - - 113.2 27.2 19.4 140.4 Legal Studies (CPE) 1.7 4.0 70.6 5.7 - - - - 1.7 4.0 70.6 5.7 Political Science 277.7 127.9 31.5 405.6 29.7 3.7 11.0 33.3 307.3 131.6 30.0 438.9 Political Science (CPE) 2.0 1.2 37.5 3.2 - - - - 2.0 1.2 37.5 3.2
Public Policy, School of 0.2 11.7 98.3 11.9 53.0 10.9 17.0 63.9 53.2 22.6 29.8 75.8
Resource Economics 186.9 180.5 49.1 367.4 18.3 7.3 28.6 25.7 205.3 187.8 47.8 393.1 Resource Economics 186.7 177.5 48.7 364.2 18.3 7.3 28.6 25.7 205.0 184.9 47.4 389.9 Resource Economics (CPE) 0.3 2.9 91.7 3.2 - - - - 0.3 2.9 91.7 3.2
Social Thought and Political Economy 24.6 25.4 50.8 50.0 - - - - 24.6 25.4 50.8 50.0
Sociology 189.3 430.6 69.5 619.9 82.4 2.7 3.1 85.1 271.8 433.3 61.5 705.0 Labor Studies 0.3 8.3 96.9 8.5 11.0 - - 11.0 11.3 8.3 42.3 19.5 Labor Studies (CPE) - - - - 32.9 - - 32.9 32.9 - - 32.9 Sociology 183.0 391.6 68.2 574.6 38.6 2.7 6.5 41.2 221.6 394.3 64.0 615.8 Sociology (CPE) 6.1 30.7 83.5 36.8 - - - - 6.1 30.7 83.5 36.8
Total 1,790.1 1,939.2 52.0 3,729.3 366.8 50.8 12.2 417.6 2,156.8 1,990.0 48.0 4,146.8 State-Supported 1,776.0 1,840.2 50.9 3,616.2 333.9 50.8 13.2 384.7 2,109.9 1,891.0 47.3 4,000.9 Continuing and Professional Education 14.1 99.0 87.6 113.1 32.9 - - 32.9 47.0 99.0 67.8 146.0
Definitions and NotesMajors: Students with a declared primary, secondary major or pre-major within the department or program offering a course. All other students are defined as "non-majors".Exception: Students in the Social and Behavioral Sciences Exploratory Track program are treated as majors in all courses offered within the College.CPE: Non-state supported programs administered through Continuing and Professional Education.Note. All data reflect the current organizational structure. See Organizational Changes on page 2 for additional details.
Page 26 • Admissions and Enrollment Report, Fall 2018 University of Massachusetts Amherst • Office of Institutional Research (OIR)
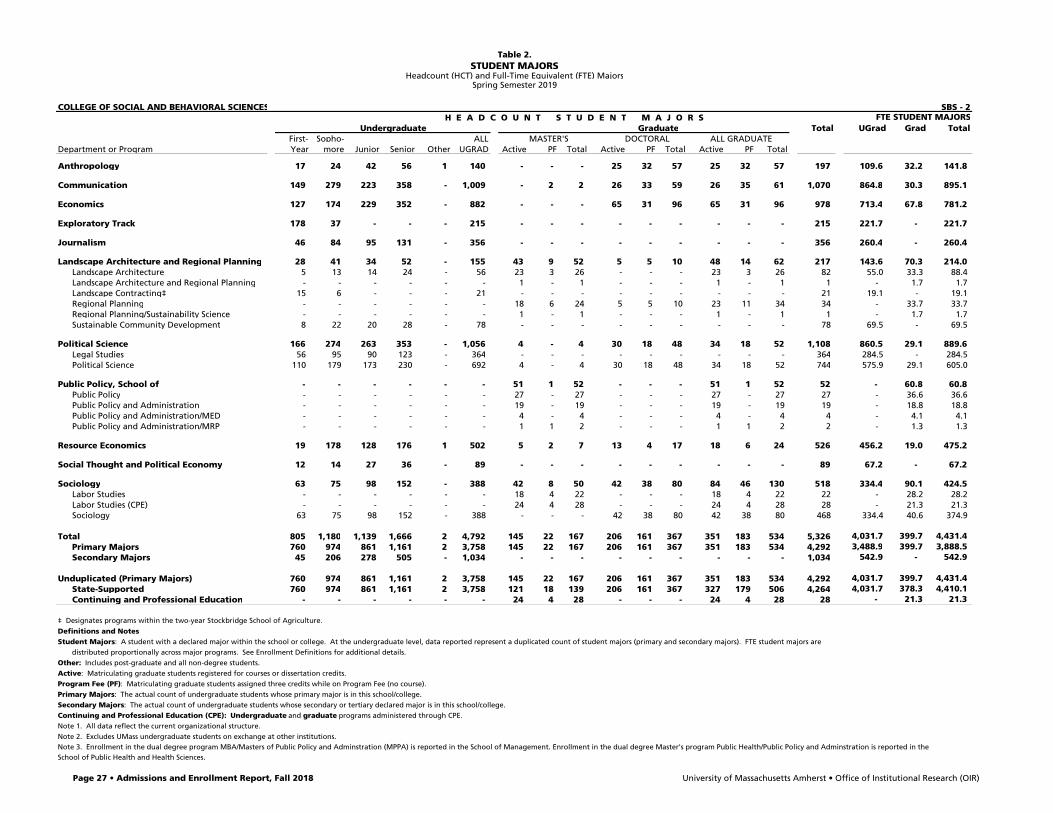
Table 2.STUDENT MAJORS
Headcount (HCT) and Full-Time Equivalent (FTE) Majors
COLLEGE OF SOCIAL AND BEHAVIORAL SCIENCES SBS - 2 H E A D C O U N T S T U D E N T M A J O R S FTE STUDENT MAJORS
Undergraduate Graduate Total UGrad Grad TotalFirst- Sopho- ALL MASTER'S DOCTORAL ALL GRADUATE
Department or Program Year more Junior Senior Other UGRAD Active PF Total Active PF Total Active PF Total
Anthropology 17 24 42 56 1 140 - - - 25 32 57 25 32 57 197 109.6 32.2 141.8
Communication 149 279 223 358 - 1,009 - 2 2 26 33 59 26 35 61 1,070 864.8 30.3 895.1
Economics 127 174 229 352 - 882 - - - 65 31 96 65 31 96 978 713.4 67.8 781.2
Exploratory Track 178 37 - - - 215 - - - - - - - - - 215 221.7 - 221.7
Journalism 46 84 95 131 - 356 - - - - - - - - - 356 260.4 - 260.4
Landscape Architecture and Regional Planning 28 41 34 52 - 155 43 9 52 5 5 10 48 14 62 217 143.6 70.3 214.0 Landscape Architecture 5 13 14 24 - 56 23 3 26 - - - 23 3 26 82 55.0 33.3 88.4 Landscape Architecture and Regional Planning - - - - - - 1 - 1 - - - 1 - 1 1 - 1.7 1.7 Landscape Contracting‡ 15 6 - - - 21 - - - - - - - - - 21 19.1 - 19.1 Regional Planning - - - - - - 18 6 24 5 5 10 23 11 34 34 - 33.7 33.7 Regional Planning/Sustainability Science - - - - - - 1 - 1 - - - 1 - 1 1 - 1.7 1.7 Sustainable Community Development 8 22 20 28 - 78 - - - - - - - - - 78 69.5 - 69.5
Political Science 166 274 263 353 - 1,056 4 - 4 30 18 48 34 18 52 1,108 860.5 29.1 889.6 Legal Studies 56 95 90 123 - 364 - - - - - - - - - 364 284.5 - 284.5 Political Science 110 179 173 230 - 692 4 - 4 30 18 48 34 18 52 744 575.9 29.1 605.0
Public Policy, School of - - - - - - 51 1 52 - - - 51 1 52 52 - 60.8 60.8 Public Policy - - - - - - 27 - 27 - - - 27 - 27 27 - 36.6 36.6 Public Policy and Administration - - - - - - 19 - 19 - - - 19 - 19 19 - 18.8 18.8 Public Policy and Administration/MED - - - - - - 4 - 4 - - - 4 - 4 4 - 4.1 4.1 Public Policy and Administration/MRP - - - - - - 1 1 2 - - - 1 1 2 2 - 1.3 1.3
Resource Economics 19 178 128 176 1 502 5 2 7 13 4 17 18 6 24 526 456.2 19.0 475.2
Social Thought and Political Economy 12 14 27 36 - 89 - - - - - - - - - 89 67.2 - 67.2
Sociology 63 75 98 152 - 388 42 8 50 42 38 80 84 46 130 518 334.4 90.1 424.5 Labor Studies - - - - - - 18 4 22 - - - 18 4 22 22 - 28.2 28.2 Labor Studies (CPE) - - - - - - 24 4 28 - - - 24 4 28 28 - 21.3 21.3 Sociology 63 75 98 152 - 388 - - - 42 38 80 42 38 80 468 334.4 40.6 374.9
Total 805 1,180 1,139 1,666 2 4,792 145 22 167 206 161 367 351 183 534 5,326 4,031.7 399.7 4,431.4 Primary Majors 760 974 861 1,161 2 3,758 145 22 167 206 161 367 351 183 534 4,292 3,488.9 399.7 3,888.5 Secondary Majors 45 206 278 505 - 1,034 - - - - - - - - - 1,034 542.9 - 542.9
Unduplicated (Primary Majors) 760 974 861 1,161 2 3,758 145 22 167 206 161 367 351 183 534 4,292 4,031.7 399.7 4,431.4 State-Supported 760 974 861 1,161 2 3,758 121 18 139 206 161 367 327 179 506 4,264 4,031.7 378.3 4,410.1 Continuing and Professional Education - - - - - - 24 4 28 - - - 24 4 28 28 - 21.3 21.3
‡ Designates programs within the two-year Stockbridge School of Agriculture.
Definitions and NotesStudent Majors: A student with a declared major within the school or college. At the undergraduate level, data reported represent a duplicated count of student majors (primary and secondary majors). FTE student majors are
distributed proportionally across major programs. See Enrollment Definitions for additional details.Other: Includes post-graduate and all non-degree students.Active: Matriculating graduate students registered for courses or dissertation credits.Program Fee (PF): Matriculating graduate students assigned three credits while on Program Fee (no course).Primary Majors: The actual count of undergraduate students whose primary major is in this school/college.Secondary Majors: The actual count of undergraduate students whose secondary or tertiary declared major is in this school/college.Continuing and Professional Education (CPE): Undergraduate and graduate programs administered through CPE. Note 1. All data reflect the current organizational structure. Note 2. Excludes UMass undergraduate students on exchange at other institutions.Note 3. Enrollment in the dual degree program MBA/Masters of Public Policy and Adminstration (MPPA) is reported in the School of Management. Enrollment in the dual degree Master's program Public Health/Public Policy and Adminstration is reported in the School of Public Health and Health Sciences.
Spring Semester 2019
Page 27 • Admissions and Enrollment Report, Fall 2018 University of Massachusetts Amherst • Office of Institutional Research (OIR)
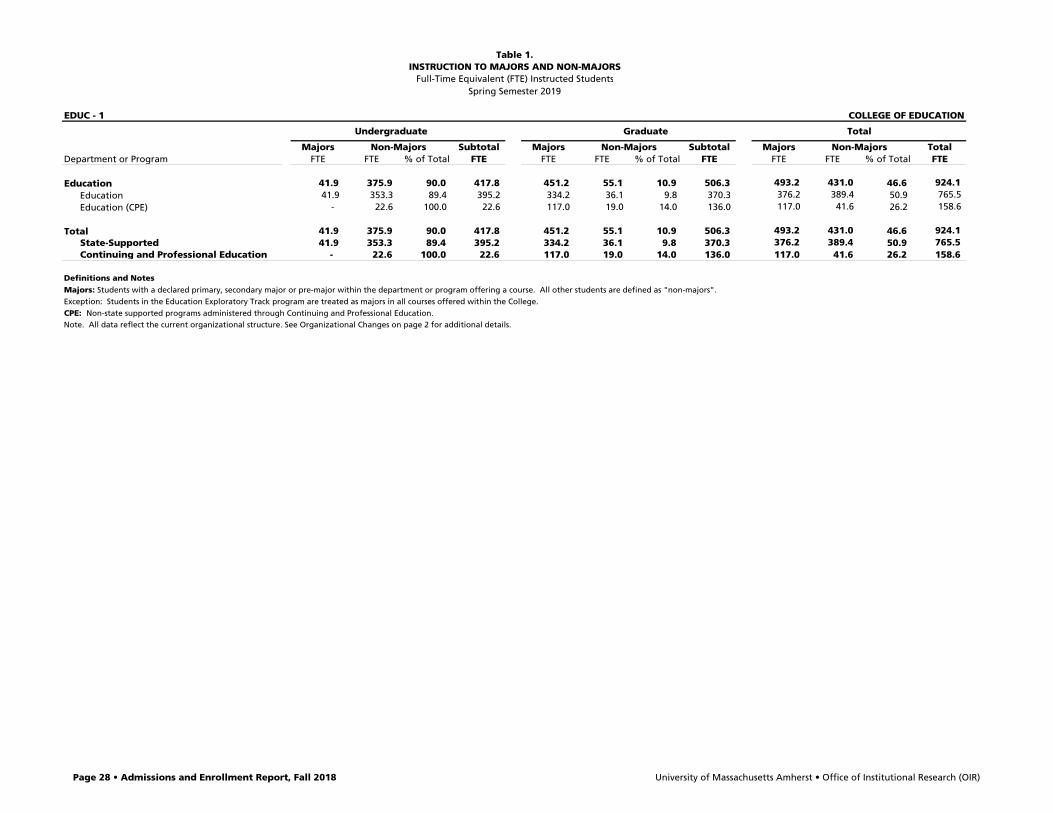
Table 1.INSTRUCTION TO MAJORS AND NON-MAJORS
Full-Time Equivalent (FTE) Instructed StudentsSpring Semester 2019
EDUC - 1 COLLEGE OF EDUCATION
Undergraduate Graduate Total
Majors Non-Majors Subtotal Majors Non-Majors Subtotal Majors Non-Majors TotalDepartment or Program FTE FTE % of Total FTE FTE FTE % of Total FTE FTE FTE % of Total FTE
Education 41.9 375.9 90.0 417.8 451.2 55.1 10.9 506.3 493.2 431.0 46.6 924.1 Education 41.9 353.3 89.4 395.2 334.2 36.1 9.8 370.3 376.2 389.4 50.9 765.5 Education (CPE) - 22.6 100.0 22.6 117.0 19.0 14.0 136.0 117.0 41.6 26.2 158.6
Total 41.9 375.9 90.0 417.8 451.2 55.1 10.9 506.3 493.2 431.0 46.6 924.1 State-Supported 41.9 353.3 89.4 395.2 334.2 36.1 9.8 370.3 376.2 389.4 50.9 765.5 Continuing and Professional Education - 22.6 100.0 22.6 117.0 19.0 14.0 136.0 117.0 41.6 26.2 158.6
Definitions and NotesMajors: Students with a declared primary, secondary major or pre-major within the department or program offering a course. All other students are defined as "non-majors".Exception: Students in the Education Exploratory Track program are treated as majors in all courses offered within the College.CPE: Non-state supported programs administered through Continuing and Professional Education.Note. All data reflect the current organizational structure. See Organizational Changes on page 2 for additional details.
Page 28 • Admissions and Enrollment Report, Fall 2018 University of Massachusetts Amherst • Office of Institutional Research (OIR)
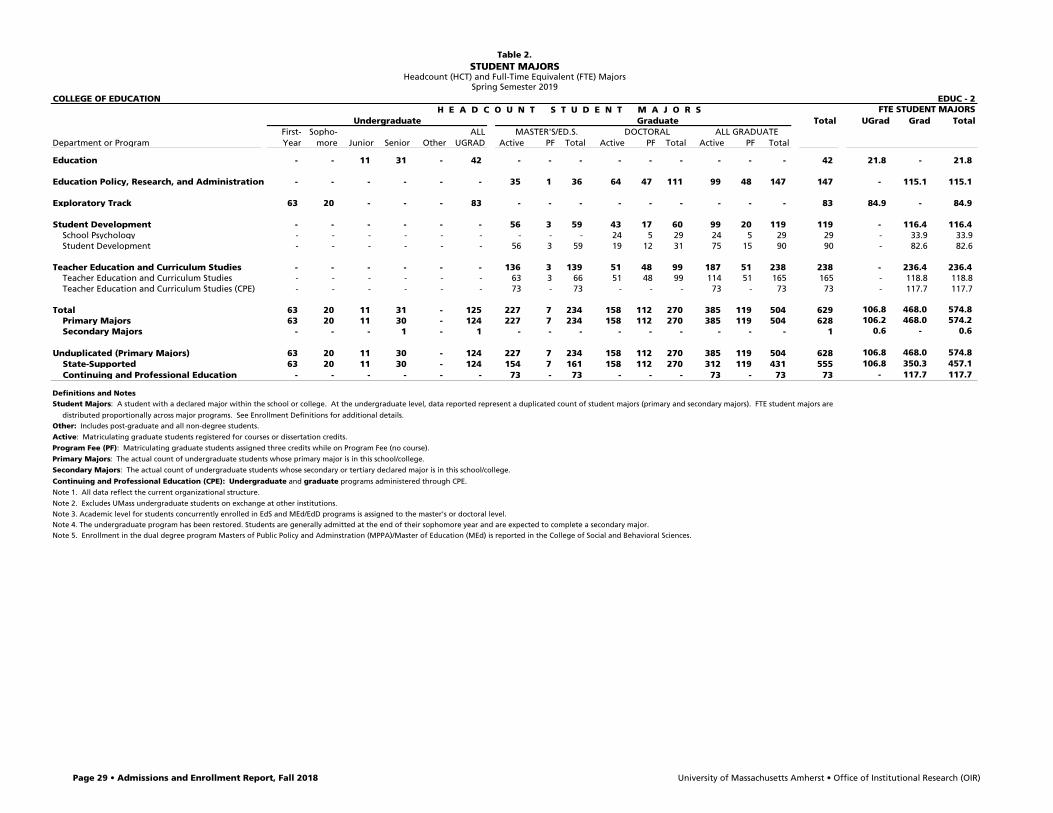
Table 2.STUDENT MAJORS
Headcount (HCT) and Full-Time Equivalent (FTE) Majors
COLLEGE OF EDUCATION EDUC - 2 H E A D C O U N T S T U D E N T M A J O R S FTE STUDENT MAJORS
Undergraduate Graduate Total UGrad Grad TotalFirst- Sopho- ALL MASTER'S/ED.S. DOCTORAL ALL GRADUATE
Department or Program Year more Junior Senior Other UGRAD Active PF Total Active PF Total Active PF Total
Education - - 11 31 - 42 - - - - - - - - - 42 21.8 - 21.8
Education Policy, Research, and Administration - - - - - - 35 1 36 64 47 111 99 48 147 147 - 115.1 115.1
Exploratory Track 63 20 - - - 83 - - - - - - - - - 83 84.9 - 84.9
Student Development - - - - - - 56 3 59 43 17 60 99 20 119 119 - 116.4 116.4 School Psychology - - - - - - - - - 24 5 29 24 5 29 29 - 33.9 33.9 Student Development - - - - - - 56 3 59 19 12 31 75 15 90 90 - 82.6 82.6
Teacher Education and Curriculum Studies - - - - - - 136 3 139 51 48 99 187 51 238 238 - 236.4 236.4 Teacher Education and Curriculum Studies - - - - - - 63 3 66 51 48 99 114 51 165 165 - 118.8 118.8 Teacher Education and Curriculum Studies (CPE) - - - - - - 73 - 73 - - - 73 - 73 73 - 117.7 117.7
Total 63 20 11 31 - 125 227 7 234 158 112 270 385 119 504 629 106.8 468.0 574.8 Primary Majors 63 20 11 30 - 124 227 7 234 158 112 270 385 119 504 628 106.2 468.0 574.2 Secondary Majors - - - 1 - 1 - - - - - - - - - 1 0.6 - 0.6
Unduplicated (Primary Majors) 63 20 11 30 - 124 227 7 234 158 112 270 385 119 504 628 106.8 468.0 574.8 State-Supported 63 20 11 30 - 124 154 7 161 158 112 270 312 119 431 555 106.8 350.3 457.1 Continuing and Professional Education - - - - - - 73 - 73 - - - 73 - 73 73 - 117.7 117.7
Definitions and NotesStudent Majors: A student with a declared major within the school or college. At the undergraduate level, data reported represent a duplicated count of student majors (primary and secondary majors). FTE student majors are
distributed proportionally across major programs. See Enrollment Definitions for additional details.Other: Includes post-graduate and all non-degree students.
Active: Matriculating graduate students registered for courses or dissertation credits.
Program Fee (PF): Matriculating graduate students assigned three credits while on Program Fee (no course).
Primary Majors: The actual count of undergraduate students whose primary major is in this school/college.
Secondary Majors: The actual count of undergraduate students whose secondary or tertiary declared major is in this school/college.
Continuing and Professional Education (CPE): Undergraduate and graduate programs administered through CPE.
Note 1. All data reflect the current organizational structure.
Note 2. Excludes UMass undergraduate students on exchange at other institutions.Note 3. Academic level for students concurrently enrolled in EdS and MEd/EdD programs is assigned to the master's or doctoral level.Note 4. The undergraduate program has been restored. Students are generally admitted at the end of their sophomore year and are expected to complete a secondary major.Note 5. Enrollment in the dual degree program Masters of Public Policy and Adminstration (MPPA)/Master of Education (MEd) is reported in the College of Social and Behavioral Sciences.
Spring Semester 2019
Page 29 • Admissions and Enrollment Report, Fall 2018 University of Massachusetts Amherst • Office of Institutional Research (OIR)
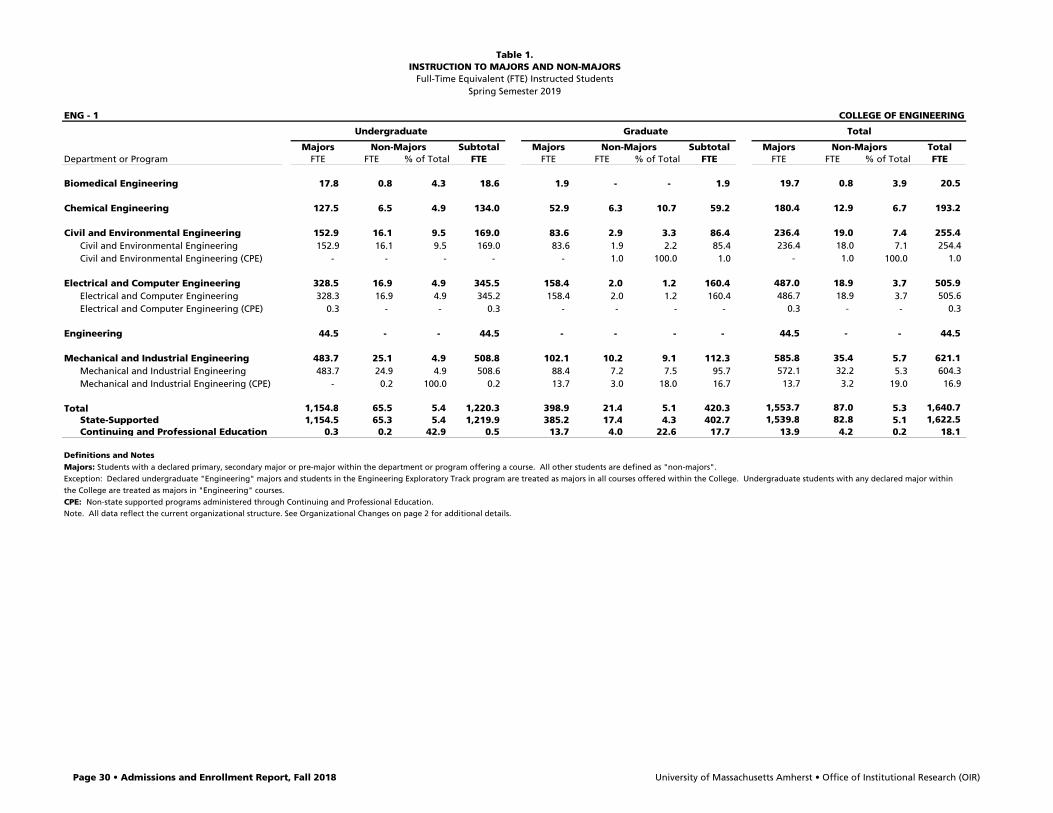
Table 1.INSTRUCTION TO MAJORS AND NON-MAJORS
Full-Time Equivalent (FTE) Instructed StudentsSpring Semester 2019
ENG - 1 COLLEGE OF ENGINEERING
Undergraduate Graduate Total
Majors Non-Majors Subtotal Majors Non-Majors Subtotal Majors Non-Majors TotalDepartment or Program FTE FTE % of Total FTE FTE FTE % of Total FTE FTE FTE % of Total FTE
Biomedical Engineering 17.8 0.8 4.3 18.6 1.9 - - 1.9 19.7 0.8 3.9 20.5
Chemical Engineering 127.5 6.5 4.9 134.0 52.9 6.3 10.7 59.2 180.4 12.9 6.7 193.2
Civil and Environmental Engineering 152.9 16.1 9.5 169.0 83.6 2.9 3.3 86.4 236.4 19.0 7.4 255.4 Civil and Environmental Engineering 152.9 16.1 9.5 169.0 83.6 1.9 2.2 85.4 236.4 18.0 7.1 254.4 Civil and Environmental Engineering (CPE) - - - - - 1.0 100.0 1.0 - 1.0 100.0 1.0
Electrical and Computer Engineering 328.5 16.9 4.9 345.5 158.4 2.0 1.2 160.4 487.0 18.9 3.7 505.9 Electrical and Computer Engineering 328.3 16.9 4.9 345.2 158.4 2.0 1.2 160.4 486.7 18.9 3.7 505.6 Electrical and Computer Engineering (CPE) 0.3 - - 0.3 - - - - 0.3 - - 0.3
Engineering 44.5 - - 44.5 - - - - 44.5 - - 44.5
Mechanical and Industrial Engineering 483.7 25.1 4.9 508.8 102.1 10.2 9.1 112.3 585.8 35.4 5.7 621.1 Mechanical and Industrial Engineering 483.7 24.9 4.9 508.6 88.4 7.2 7.5 95.7 572.1 32.2 5.3 604.3 Mechanical and Industrial Engineering (CPE) - 0.2 100.0 0.2 13.7 3.0 18.0 16.7 13.7 3.2 19.0 16.9
Total 1,154.8 65.5 5.4 1,220.3 398.9 21.4 5.1 420.3 1,553.7 87.0 5.3 1,640.7 State-Supported 1,154.5 65.3 5.4 1,219.9 385.2 17.4 4.3 402.7 1,539.8 82.8 5.1 1,622.5 Continuing and Professional Education 0.3 0.2 42.9 0.5 13.7 4.0 22.6 17.7 13.9 4.2 0.2 18.1
Definitions and NotesMajors: Students with a declared primary, secondary major or pre-major within the department or program offering a course. All other students are defined as "non-majors".Exception: Declared undergraduate "Engineering" majors and students in the Engineering Exploratory Track program are treated as majors in all courses offered within the College. Undergraduate students with any declared major withinthe College are treated as majors in "Engineering" courses.CPE: Non-state supported programs administered through Continuing and Professional Education.Note. All data reflect the current organizational structure. See Organizational Changes on page 2 for additional details.
Page 30 • Admissions and Enrollment Report, Fall 2018 University of Massachusetts Amherst • Office of Institutional Research (OIR)
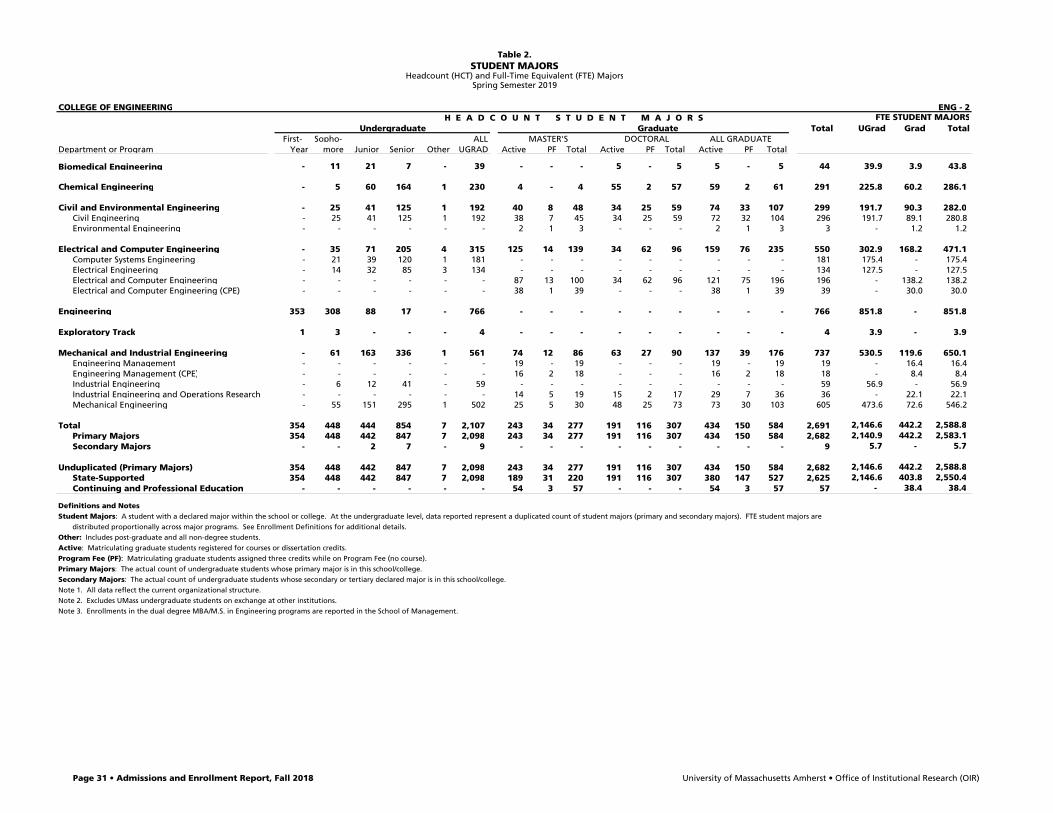
Table 2.
COLLEGE OF ENGINEERING ENG - 2 H E A D C O U N T S T U D E N T M A J O R S FTE STUDENT MAJORS
Undergraduate Graduate Total UGrad Grad TotalFirst- Sopho- ALL MASTER'S DOCTORAL ALL GRADUATE
Department or Program Year more Junior Senior Other UGRAD Active PF Total Active PF Total Active PF Total
Biomedical Engineering - 11 21 7 - 39 - - - 5 - 5 5 - 5 44 39.9 3.9 43.8
Chemical Engineering - 5 60 164 1 230 4 - 4 55 2 57 59 2 61 291 225.8 60.2 286.1
Civil and Environmental Engineering - 25 41 125 1 192 40 8 48 34 25 59 74 33 107 299 191.7 90.3 282.0 Civil Engineering - 25 41 125 1 192 38 7 45 34 25 59 72 32 104 296 191.7 89.1 280.8 Environmental Engineering - - - - - - 2 1 3 - - - 2 1 3 3 - 1.2 1.2
Electrical and Computer Engineering - 35 71 205 4 315 125 14 139 34 62 96 159 76 235 550 302.9 168.2 471.1 Computer Systems Engineering - 21 39 120 1 181 - - - - - - - - - 181 175.4 - 175.4 Electrical Engineering - 14 32 85 3 134 - - - - - - - - - 134 127.5 - 127.5 Electrical and Computer Engineering - - - - - - 87 13 100 34 62 96 121 75 196 196 - 138.2 138.2 Electrical and Computer Engineering (CPE) - - - - - - 38 1 39 - - - 38 1 39 39 - 30.0 30.0
Engineering 353 308 88 17 - 766 - - - - - - - - - 766 851.8 - 851.8
Exploratory Track 1 3 - - - 4 - - - - - - - - - 4 3.9 - 3.9
Mechanical and Industrial Engineering - 61 163 336 1 561 74 12 86 63 27 90 137 39 176 737 530.5 119.6 650.1 Engineering Management - - - - - - 19 - 19 - - - 19 - 19 19 - 16.4 16.4 Engineering Management (CPE) - - - - - - 16 2 18 - - - 16 2 18 18 - 8.4 8.4 Industrial Engineering - 6 12 41 - 59 - - - - - - - - - 59 56.9 - 56.9 Industrial Engineering and Operations Research - - - - - - 14 5 19 15 2 17 29 7 36 36 - 22.1 22.1 Mechanical Engineering - 55 151 295 1 502 25 5 30 48 25 73 73 30 103 605 473.6 72.6 546.2
Total 354 448 444 854 7 2,107 243 34 277 191 116 307 434 150 584 2,691 2,146.6 442.2 2,588.8 Primary Majors 354 448 442 847 7 2,098 243 34 277 191 116 307 434 150 584 2,682 2,140.9 442.2 2,583.1 Secondary Majors - - 2 7 - 9 - - - - - - - - - 9 5.7 - 5.7
Unduplicated (Primary Majors) 354 448 442 847 7 2,098 243 34 277 191 116 307 434 150 584 2,682 2,146.6 442.2 2,588.8 State-Supported 354 448 442 847 7 2,098 189 31 220 191 116 307 380 147 527 2,625 2,146.6 403.8 2,550.4 Continuing and Professional Education - - - - - - 54 3 57 - - - 54 3 57 57 - 38.4 38.4
Definitions and NotesStudent Majors: A student with a declared major within the school or college. At the undergraduate level, data reported represent a duplicated count of student majors (primary and secondary majors). FTE student majors are
distributed proportionally across major programs. See Enrollment Definitions for additional details.Other: Includes post-graduate and all non-degree students.Active: Matriculating graduate students registered for courses or dissertation credits.Program Fee (PF): Matriculating graduate students assigned three credits while on Program Fee (no course).Primary Majors: The actual count of undergraduate students whose primary major is in this school/college.Secondary Majors: The actual count of undergraduate students whose secondary or tertiary declared major is in this school/college.Note 1. All data reflect the current organizational structure. Note 2. Excludes UMass undergraduate students on exchange at other institutions.Note 3. Enrollments in the dual degree MBA/M.S. in Engineering programs are reported in the School of Management.
STUDENT MAJORSHeadcount (HCT) and Full-Time Equivalent (FTE) Majors
Spring Semester 2019
Page 31 • Admissions and Enrollment Report, Fall 2018 University of Massachusetts Amherst • Office of Institutional Research (OIR)
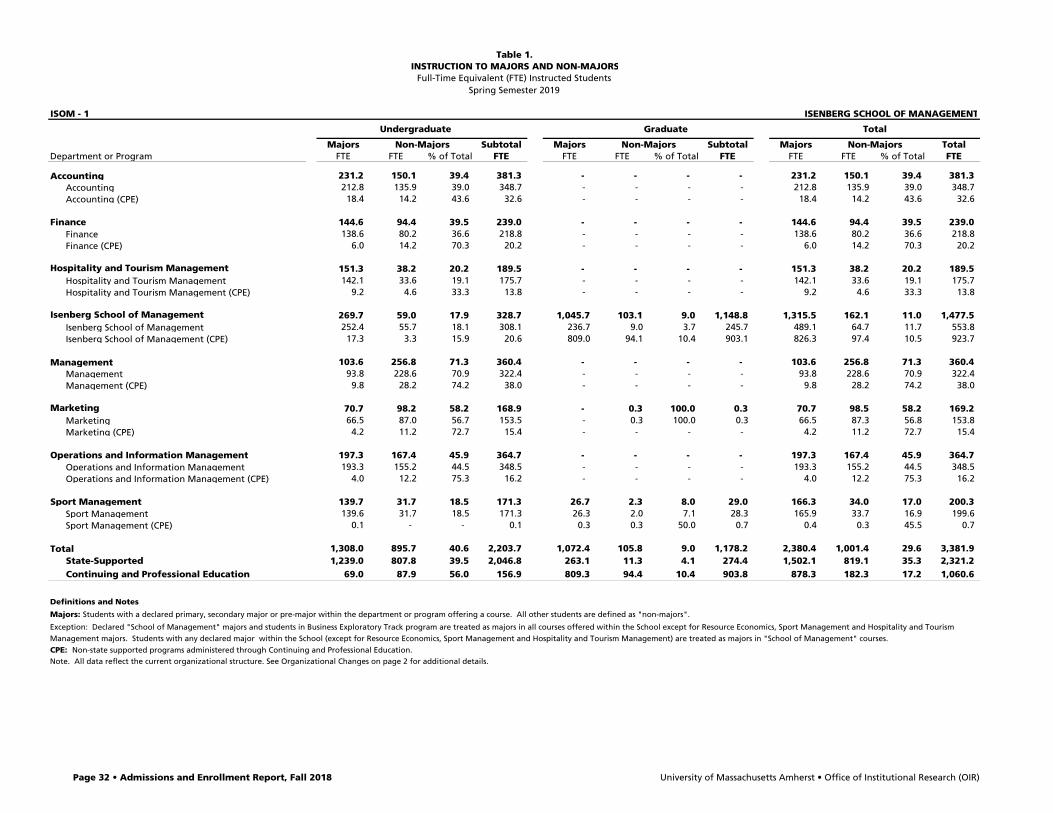
Table 1.INSTRUCTION TO MAJORS AND NON-MAJORS
Full-Time Equivalent (FTE) Instructed StudentsSpring Semester 2019
ISOM - 1 ISENBERG SCHOOL OF MANAGEMENT
Undergraduate Graduate Total
Majors Non-Majors Subtotal Majors Non-Majors Subtotal Majors Non-Majors TotalDepartment or Program FTE FTE % of Total FTE FTE FTE % of Total FTE FTE FTE % of Total FTE
Accounting 231.2 150.1 39.4 381.3 - - - - 231.2 150.1 39.4 381.3 Accounting 212.8 135.9 39.0 348.7 - - - - 212.8 135.9 39.0 348.7 Accounting (CPE) 18.4 14.2 43.6 32.6 - - - - 18.4 14.2 43.6 32.6
Finance 144.6 94.4 39.5 239.0 - - - - 144.6 94.4 39.5 239.0 Finance 138.6 80.2 36.6 218.8 - - - - 138.6 80.2 36.6 218.8 Finance (CPE) 6.0 14.2 70.3 20.2 - - - - 6.0 14.2 70.3 20.2
Hospitality and Tourism Management 151.3 38.2 20.2 189.5 - - - - 151.3 38.2 20.2 189.5 Hospitality and Tourism Management 142.1 33.6 19.1 175.7 - - - - 142.1 33.6 19.1 175.7 Hospitality and Tourism Management (CPE) 9.2 4.6 33.3 13.8 - - - - 9.2 4.6 33.3 13.8
Isenberg School of Management 269.7 59.0 17.9 328.7 1,045.7 103.1 9.0 1,148.8 1,315.5 162.1 11.0 1,477.5 Isenberg School of Management 252.4 55.7 18.1 308.1 236.7 9.0 3.7 245.7 489.1 64.7 11.7 553.8 Isenberg School of Management (CPE) 17.3 3.3 15.9 20.6 809.0 94.1 10.4 903.1 826.3 97.4 10.5 923.7
Management 103.6 256.8 71.3 360.4 - - - - 103.6 256.8 71.3 360.4 Management 93.8 228.6 70.9 322.4 - - - - 93.8 228.6 70.9 322.4 Management (CPE) 9.8 28.2 74.2 38.0 - - - - 9.8 28.2 74.2 38.0
Marketing 70.7 98.2 58.2 168.9 - 0.3 100.0 0.3 70.7 98.5 58.2 169.2 Marketing 66.5 87.0 56.7 153.5 - 0.3 100.0 0.3 66.5 87.3 56.8 153.8 Marketing (CPE) 4.2 11.2 72.7 15.4 - - - - 4.2 11.2 72.7 15.4
Operations and Information Management 197.3 167.4 45.9 364.7 - - - - 197.3 167.4 45.9 364.7 Operations and Information Management 193.3 155.2 44.5 348.5 - - - - 193.3 155.2 44.5 348.5 Operations and Information Management (CPE) 4.0 12.2 75.3 16.2 - - - - 4.0 12.2 75.3 16.2
Sport Management 139.7 31.7 18.5 171.3 26.7 2.3 8.0 29.0 166.3 34.0 17.0 200.3 Sport Management 139.6 31.7 18.5 171.3 26.3 2.0 7.1 28.3 165.9 33.7 16.9 199.6 Sport Management (CPE) 0.1 - - 0.1 0.3 0.3 50.0 0.7 0.4 0.3 45.5 0.7
Total 1,308.0 895.7 40.6 2,203.7 1,072.4 105.8 9.0 1,178.2 2,380.4 1,001.4 29.6 3,381.9 State-Supported 1,239.0 807.8 39.5 2,046.8 263.1 11.3 4.1 274.4 1,502.1 819.1 35.3 2,321.2 Continuing and Professional Education 69.0 87.9 56.0 156.9 809.3 94.4 10.4 903.8 878.3 182.3 17.2 1,060.6
Definitions and Notes
Majors: Students with a declared primary, secondary major or pre-major within the department or program offering a course. All other students are defined as "non-majors".
Exception: Declared "School of Management" majors and students in Business Exploratory Track program are treated as majors in all courses offered within the School except for Resource Economics, Sport Management and Hospitality and TourismManagement majors. Students with any declared major within the School (except for Resource Economics, Sport Management and Hospitality and Tourism Management) are treated as majors in "School of Management" courses.CPE: Non-state supported programs administered through Continuing and Professional Education.Note. All data reflect the current organizational structure. See Organizational Changes on page 2 for additional details.
Page 32 • Admissions and Enrollment Report, Fall 2018 University of Massachusetts Amherst • Office of Institutional Research (OIR)
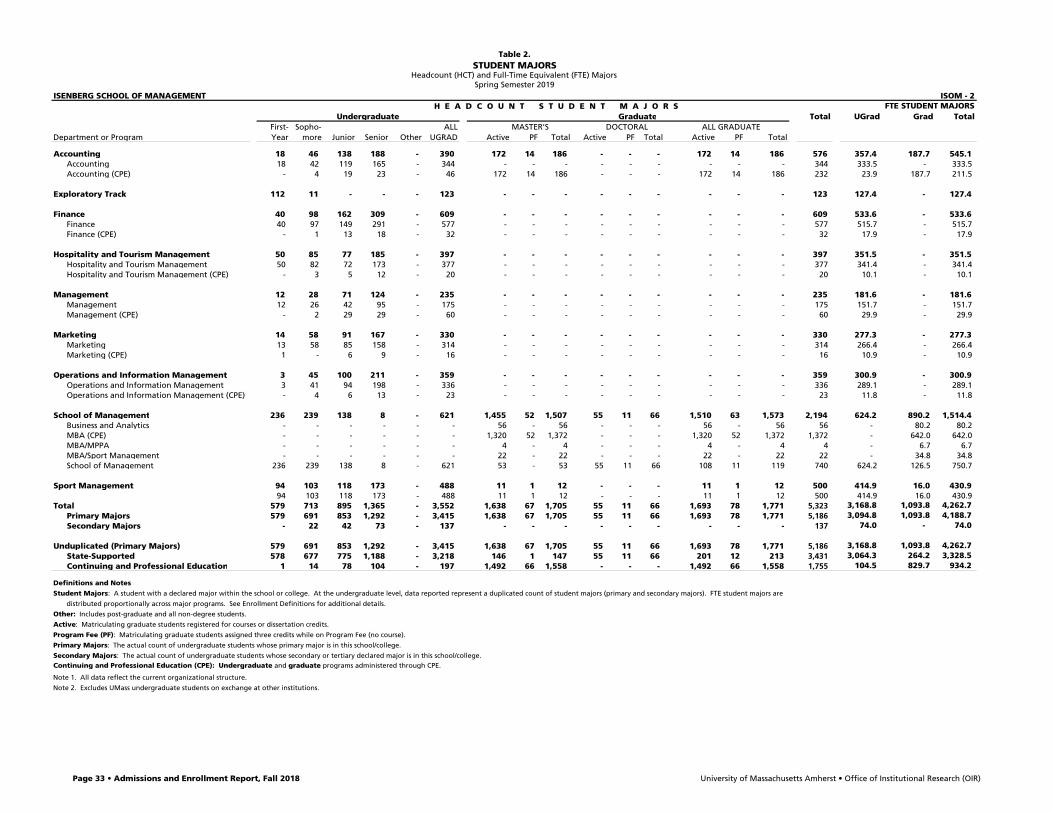
Table 2.STUDENT MAJORS
Headcount (HCT) and Full-Time Equivalent (FTE) Majors
ISENBERG SCHOOL OF MANAGEMENT ISOM - 2 H E A D C O U N T S T U D E N T M A J O R S FTE STUDENT MAJORS
Undergraduate Graduate Total UGrad Grad TotalFirst- Sopho- ALL MASTER'S DOCTORAL ALL GRADUATE
Department or Program Year more Junior Senior Other UGRAD Active PF Total Active PF Total Active PF Total
Accounting 18 46 138 188 - 390 172 14 186 - - - 172 14 186 576 357.4 187.7 545.1 Accounting 18 42 119 165 - 344 - - - - - - - - - 344 333.5 - 333.5 Accounting (CPE) - 4 19 23 - 46 172 14 186 - - - 172 14 186 232 23.9 187.7 211.5
Exploratory Track 112 11 - - - 123 - - - - - - - - - 123 127.4 - 127.4
Finance 40 98 162 309 - 609 - - - - - - - - - 609 533.6 - 533.6 Finance 40 97 149 291 - 577 - - - - - - - - - 577 515.7 - 515.7 Finance (CPE) - 1 13 18 - 32 - - - - - - - - - 32 17.9 - 17.9
Hospitality and Tourism Management 50 85 77 185 - 397 - - - - - - - - - 397 351.5 - 351.5 Hospitality and Tourism Management 50 82 72 173 - 377 - - - - - - - - - 377 341.4 - 341.4 Hospitality and Tourism Management (CPE) - 3 5 12 - 20 - - - - - - - - - 20 10.1 - 10.1
Management 12 28 71 124 - 235 - - - - - - - - - 235 181.6 - 181.6 Management 12 26 42 95 - 175 - - - - - - - - - 175 151.7 - 151.7 Management (CPE) - 2 29 29 - 60 - - - - - - - - - 60 29.9 - 29.9
Marketing 14 58 91 167 - 330 - - - - - - - - - 330 277.3 - 277.3 Marketing 13 58 85 158 - 314 - - - - - - - - - 314 266.4 - 266.4 Marketing (CPE) 1 - 6 9 - 16 - - - - - - - - - 16 10.9 - 10.9
Operations and Information Management 3 45 100 211 - 359 - - - - - - - - - 359 300.9 - 300.9 Operations and Information Management 3 41 94 198 - 336 - - - - - - - - - 336 289.1 - 289.1 Operations and Information Management (CPE) - 4 6 13 - 23 - - - - - - - - - 23 11.8 - 11.8
School of Management 236 239 138 8 - 621 1,455 52 1,507 55 11 66 1,510 63 1,573 2,194 624.2 890.2 1,514.4 Business and Analytics - - - - - - 56 - 56 - - - 56 - 56 56 - 80.2 80.2 MBA (CPE) - - - - - - 1,320 52 1,372 - - - 1,320 52 1,372 1,372 - 642.0 642.0 MBA/MPPA - - - - - - 4 - 4 - - - 4 - 4 4 - 6.7 6.7 MBA/Sport Management - - - - - - 22 - 22 - - - 22 - 22 22 - 34.8 34.8 School of Management 236 239 138 8 - 621 53 - 53 55 11 66 108 11 119 740 624.2 126.5 750.7
Sport Management 94 103 118 173 - 488 11 1 12 - - - 11 1 12 500 414.9 16.0 430.9 94 103 118 173 - 488 11 1 12 - - - 11 1 12 500 414.9 16.0 430.9
Total 579 713 895 1,365 - 3,552 1,638 67 1,705 55 11 66 1,693 78 1,771 5,323 3,168.8 1,093.8 4,262.7 Primary Majors 579 691 853 1,292 - 3,415 1,638 67 1,705 55 11 66 1,693 78 1,771 5,186 3,094.8 1,093.8 4,188.7 Secondary Majors - 22 42 73 - 137 - - - - - - - - - 137 74.0 - 74.0
Unduplicated (Primary Majors) 579 691 853 1,292 - 3,415 1,638 67 1,705 55 11 66 1,693 78 1,771 5,186 3,168.8 1,093.8 4,262.7 State-Supported 578 677 775 1,188 - 3,218 146 1 147 55 11 66 201 12 213 3,431 3,064.3 264.2 3,328.5 Continuing and Professional Education 1 14 78 104 - 197 1,492 66 1,558 - - - 1,492 66 1,558 1,755 104.5 829.7 934.2
Definitions and Notes
Student Majors: A student with a declared major within the school or college. At the undergraduate level, data reported represent a duplicated count of student majors (primary and secondary majors). FTE student majors are
distributed proportionally across major programs. See Enrollment Definitions for additional details.
Other: Includes post-graduate and all non-degree students.
Active: Matriculating graduate students registered for courses or dissertation credits.
Program Fee (PF): Matriculating graduate students assigned three credits while on Program Fee (no course).
Primary Majors: The actual count of undergraduate students whose primary major is in this school/college.
Secondary Majors: The actual count of undergraduate students whose secondary or tertiary declared major is in this school/college.Continuing and Professional Education (CPE): Undergraduate and graduate programs administered through CPE.
Note 1. All data reflect the current organizational structure.
Note 2. Excludes UMass undergraduate students on exchange at other institutions.
Spring Semester 2019
Page 33 • Admissions and Enrollment Report, Fall 2018 University of Massachusetts Amherst • Office of Institutional Research (OIR)
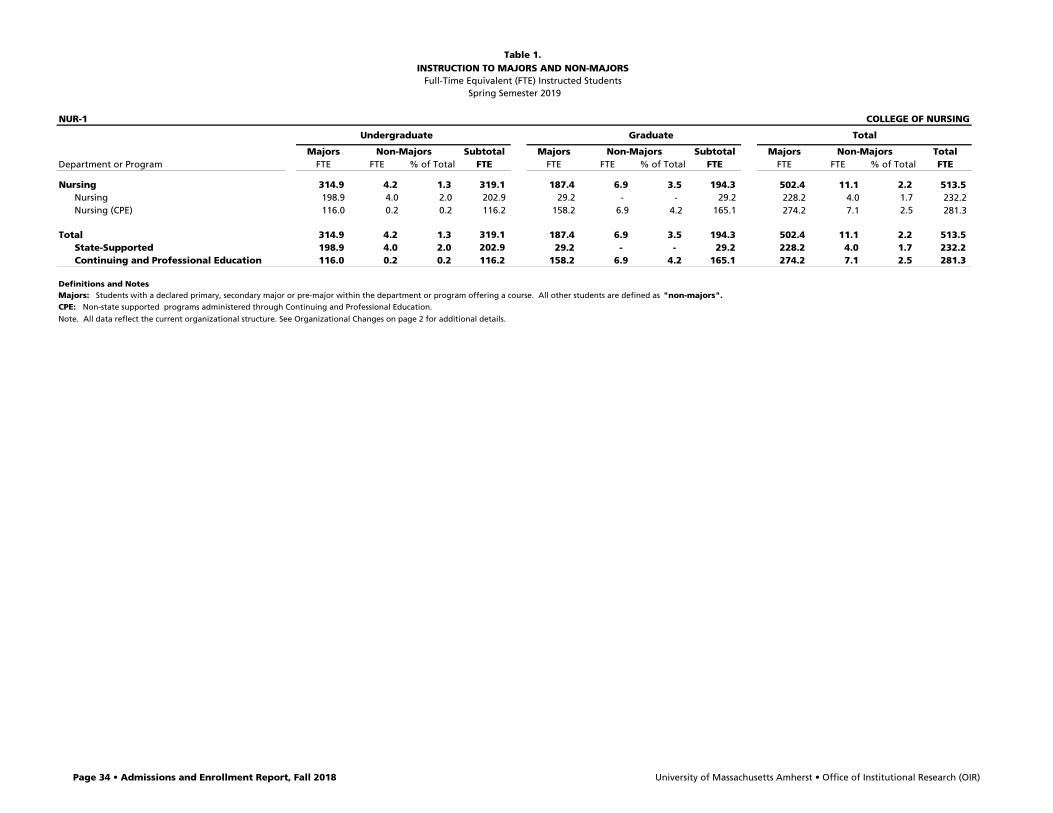
Table 1.INSTRUCTION TO MAJORS AND NON-MAJORS
Full-Time Equivalent (FTE) Instructed Students
NUR-1 COLLEGE OF NURSING
Undergraduate Graduate Total
Majors Non-Majors Subtotal Majors Non-Majors Subtotal Majors Non-Majors TotalDepartment or Program FTE FTE % of Total FTE FTE FTE % of Total FTE FTE FTE % of Total FTE
Nursing 314.9 4.2 1.3 319.1 187.4 6.9 3.5 194.3 502.4 11.1 2.2 513.5 Nursing 198.9 4.0 2.0 202.9 29.2 - - 29.2 228.2 4.0 1.7 232.2 Nursing (CPE) 116.0 0.2 0.2 116.2 158.2 6.9 4.2 165.1 274.2 7.1 2.5 281.3
Total 314.9 4.2 1.3 319.1 187.4 6.9 3.5 194.3 502.4 11.1 2.2 513.5 State-Supported 198.9 4.0 2.0 202.9 29.2 - - 29.2 228.2 4.0 1.7 232.2 Continuing and Professional Education 116.0 0.2 0.2 116.2 158.2 6.9 4.2 165.1 274.2 7.1 2.5 281.3
Definitions and NotesMajors: Students with a declared primary, secondary major or pre-major within the department or program offering a course. All other students are defined as "non-majors".CPE: Non-state supported programs administered through Continuing and Professional Education.
Note. All data reflect the current organizational structure. See Organizational Changes on page 2 for additional details.
Spring Semester 2019
Page 34 • Admissions and Enrollment Report, Fall 2018 University of Massachusetts Amherst • Office of Institutional Research (OIR)

Table 2.STUDENT MAJORS
Headcount (HCT) and Full-Time Equivalent (FTE) Majors
COLLEGE OF NURSING NUR - 2 H E A D C O U N T S T U D E N T M A J O R S FTE STUDENT MAJORS
Undergraduate Graduate Total UGrad Grad TotalFirst- Sopho- ALL MASTER'S DOCTORAL ALL GRADUATE
Department or Program Year more Junior Senior Other UGRAD Active PF Total Active PF Total Active PF Total
Nursing 30 79 79 127 91 406 43 - 43 215 20 235 258 20 278 684 389.9 194.2 584.1 Nursing 29 73 58 112 - 272 1 - 1 25 15 40 26 15 41 313 272.9 29.7 302.6 Nursing (CPE) - - - - - - 42 - 42 - - - 42 - 42 42 - 27.8 27.8 Nursing DNP (CPE) - - - - - - - - - 190 5 195 190 5 195 195 - 136.8 136.8 Nursing Post-Baccalaureate (CPE) - - - - 91 91 - - - - - - - - - 91 96.2 - 96.2 Nursing RN to BSN (CPE) 1 6 21 15 - 43 - - - - - - - - - 43 20.7 - 20.7
Total 30 79 79 127 91 406 43 - 43 215 20 235 258 20 278 684 389.9 194.2 584.1 Primary Majors 30 79 79 127 91 406 43 - 43 215 20 235 258 20 278 684 389.9 194.2 584.1 Secondary Majors - - - - - - - - - - - - - - - - - - -
Unduplicated (Primary Majors) 30 79 79 127 91 406 43 - 43 215 20 235 258 20 278 684 389.9 194.2 584.1 State-Supported 29 73 58 112 - 272 1 - 1 25 15 40 26 15 41 313 272.9 29.7 302.6 Continuing and Professional Education 1 6 21 15 91 134 42 - 42 190 5 195 232 5 237 371 116.9 164.6 281.5
Definitions and NotesStudent Majors: A student with a declared major within the school or college. At the undergraduate level, data reported represent a duplicated count of student majors (primary and secondary majors). FTE student majors are
distributed proportionally across major programs. See Enrollment Definitions for additional details.Other: Includes post-graduate and all non-degree students.Active: Matriculating graduate students registered for courses or dissertation credits.Program Fee (PF): Matriculating graduate students assigned three credits while on Program Fee (no course).Primary Majors: The actual count of undergraduate students whose primary major is in this school/college.Secondary Majors: The actual count of undergraduate students whose secondary or tertiary declared major is in this school/college.Continuing and Professional Education (CPE): Undergraduate and graduate programs administered through CPE. Note 1. All data reflect the current organizational structure. Note 2. Excludes UMass undergraduate students on exchange at other institutions.
Spring Semester 2019
Page 35 • Admissions and Enrollment Report, Fall 2018 University of Massachusetts Amherst • Office of Institutional Research (OIR)

Table 1.INSTRUCTION TO MAJORS AND NON-MAJORS
Full-Time Equivalent (FTE) Instructed Students
PHHS - 1 SCHOOL OF PUBLIC HEALTH AND HEALTH SCIENCES
Undergraduate Graduate Total
Majors Non-Majors Subtotal Majors Non-Majors Subtotal Majors Non-Majors TotalDepartment or Program FTE FTE % of Total FTE FTE FTE % of Total FTE FTE FTE % of Total FTE
Biostatistics and Epidemiology - 0.2 100.0 0.2 43.3 67.3 60.8 110.7 43.3 67.5 60.9 110.9 Biostatistics - - - - 25.7 9.3 26.7 35.0 25.7 9.3 26.7 35.0 Biostatistics (CPE) - 0.2 100.0 0.2 - 22.3 100.0 22.3 - 22.5 100.0 22.5 Epidemiology - - - - 17.7 15.7 47.0 33.3 17.7 15.7 47.0 33.3 Epidemiology (CPE) - - - - - 20.0 100.0 20.0 - 20.0 100.0 20.0
Communication Disorders 99.6 47.2 32.2 146.8 103.6 0.3 0.3 103.9 203.2 47.5 19.0 250.7 Communication Disorders 99.2 37.9 27.7 137.1 78.9 0.3 0.4 79.2 178.1 38.3 17.7 216.4 Communication Disorders (CPE) 0.4 9.3 95.9 9.7 24.7 - - 24.7 25.1 9.3 27.0 34.3
Environmental Health Sciences - 2.8 100.0 2.8 9.3 23.4 71.5 32.8 9.3 26.2 73.8 35.6 Environmental Health Sciences - 2.4 100.0 2.4 9.3 8.8 48.5 18.1 9.3 11.2 54.5 20.5 Environmental Health Sciences (CPE) - 0.4 100.0 0.4 - 14.7 100.0 14.7 - 15.1 100.0 15.1
Health Promotion and Policy - 2.8 100.0 2.8 41.0 127.0 75.6 168.0 41.0 129.8 76.0 170.8 Health Promotion and Policy - 2.6 100.0 2.6 39.3 5.7 12.6 45.0 39.3 8.3 17.4 47.6 Health Promotion and Policy (CPE) - 0.2 100.0 0.2 1.7 121.3 98.6 123.0 1.7 121.5 98.6 123.2
Kinesiology 281.1 210.3 42.8 491.4 33.9 1.8 5.0 35.7 315.0 212.1 40.2 527.1 Kinesiology 276.8 190.2 40.7 467.0 33.9 1.8 5.0 35.7 310.7 192.0 38.2 502.7 Kinesiology (CPE) 4.3 20.1 82.5 24.4 - - - - 4.3 20.1 82.5 24.4
Nutrition 75.0 138.6 64.9 213.6 27.8 8.7 23.8 36.4 102.8 147.3 58.9 250.0 Nutrition 74.8 130.0 63.5 204.8 17.8 1.0 5.3 18.8 92.6 131.0 58.6 223.6 Nutrition (CPE) 0.2 8.6 97.7 8.8 10.0 7.7 43.4 17.7 10.2 16.3 61.5 26.5
Public Health 343.4 169.1 33.0 512.5 6.7 7.0 51.2 13.7 350.1 176.1 33.5 526.2 Public Health 336.0 156.4 31.8 492.4 6.7 7.0 51.2 13.7 342.7 163.4 32.3 506.1 Public Health (CPE) 7.4 12.7 63.2 20.1 - - - - 7.4 12.7 63.2 20.1
Total 799.1 571.1 41.7 1,370.1 265.6 235.6 47.0 501.1 1,064.6 806.6 43.1 1,871.2 State-Supported 786.8 519.5 39.8 1,306.3 229.2 49.6 17.8 278.8 1,016.0 569.1 35.9 1,585.1 Continuing and Professional Education 12.3 51.5 80.8 63.8 36.3 186.0 83.7 222.3 48.6 237.5 83.0 286.1
Definitions and NotesMajors: Students with a declared primary, secondary major or pre-major within the department or program offering a course. All other students are defined as "non-majors".
Exception: Students in the Public Health and Health Sciences Exploratory Track program are treated as majors in all courses offered within the College.CPE: Non-state supported programs administered through Continuing and Professional Education.
Note. All data reflect the current organizational structure. See Organizational Changes on page 2 for additional details.
Spring Semester 2019
Page 36 • Admissions and Enrollment Report, Fall 2018 University of Massachusetts Amherst • Office of Institutional Research (OIR)
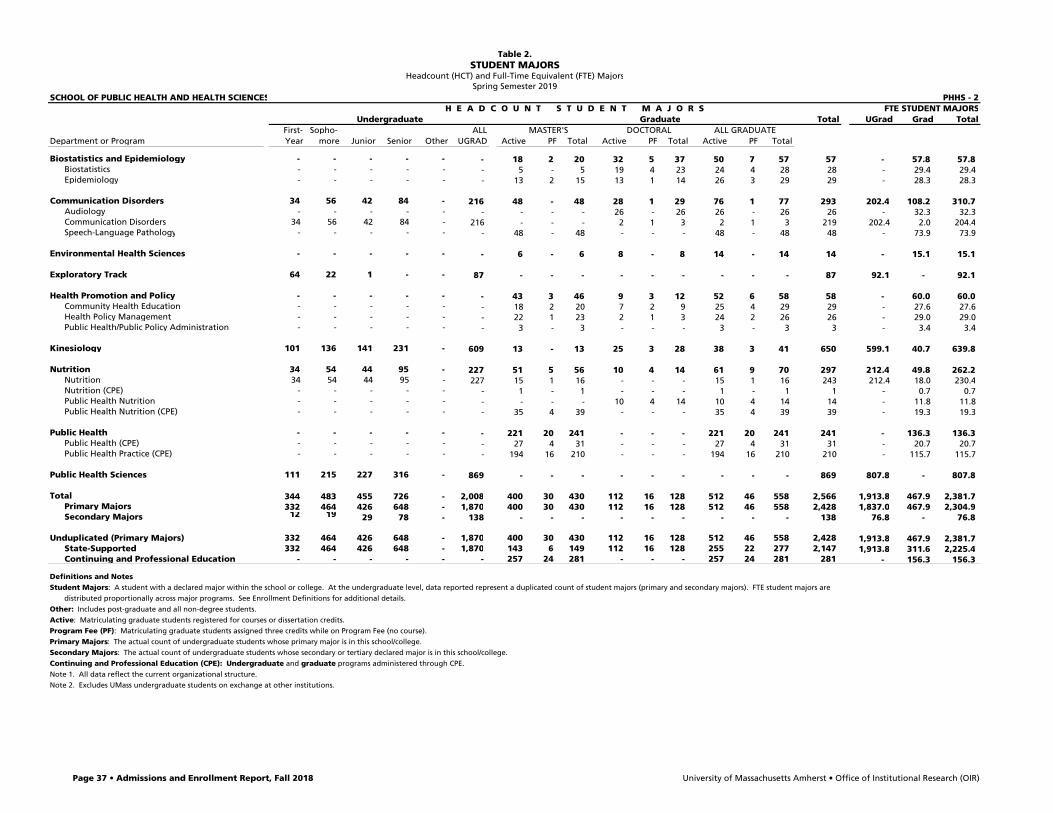
Table 2.STUDENT MAJORS
Headcount (HCT) and Full-Time Equivalent (FTE) Majors
SCHOOL OF PUBLIC HEALTH AND HEALTH SCIENCES PHHS - 2 H E A D C O U N T S T U D E N T M A J O R S FTE STUDENT MAJORS
Undergraduate Graduate Total UGrad Grad TotalFirst- Sopho- ALL MASTER'S DOCTORAL ALL GRADUATE
Department or Program Year more Junior Senior Other UGRAD Active PF Total Active PF Total Active PF Total
Biostatistics and Epidemiology - - - - - - 18 2 20 32 5 37 50 7 57 57 - 57.8 57.8 Biostatistics - - - - - - 5 - 5 19 4 23 24 4 28 28 - 29.4 29.4 Epidemiology - - - - - - 13 2 15 13 1 14 26 3 29 29 - 28.3 28.3
Communication Disorders 34 56 42 84 - 216 48 - 48 28 1 29 76 1 77 293 202.4 108.2 310.7 Audiology - - - - - - - - - 26 - 26 26 - 26 26 - 32.3 32.3 Communication Disorders 34 56 42 84 - 216 - - - 2 1 3 2 1 3 219 202.4 2.0 204.4 Speech-Language Pathology - - - - - - 48 - 48 - - - 48 - 48 48 - 73.9 73.9
Environmental Health Sciences - - - - - - 6 - 6 8 - 8 14 - 14 14 - 15.1 15.1
Exploratory Track 64 22 1 - - 87 - - - - - - - - - 87 92.1 - 92.1
Health Promotion and Policy - - - - - - 43 3 46 9 3 12 52 6 58 58 - 60.0 60.0 Community Health Education - - - - - - 18 2 20 7 2 9 25 4 29 29 - 27.6 27.6 Health Policy Management - - - - - - 22 1 23 2 1 3 24 2 26 26 - 29.0 29.0 Public Health/Public Policy Administration - - - - - - 3 - 3 - - - 3 - 3 3 - 3.4 3.4
Kinesiology 101 136 141 231 - 609 13 - 13 25 3 28 38 3 41 650 599.1 40.7 639.8
Nutrition 34 54 44 95 - 227 51 5 56 10 4 14 61 9 70 297 212.4 49.8 262.2 Nutrition 34 54 44 95 - 227 15 1 16 - - - 15 1 16 243 212.4 18.0 230.4 Nutrition (CPE) - - - - - - 1 - 1 - - - 1 - 1 1 - 0.7 0.7 Public Health Nutrition - - - - - - - - - 10 4 14 10 4 14 14 - 11.8 11.8 Public Health Nutrition (CPE) - - - - - - 35 4 39 - - - 35 4 39 39 - 19.3 19.3
Public Health - - - - - - 221 20 241 - - - 221 20 241 241 - 136.3 136.3 Public Health (CPE) - - - - - - 27 4 31 - - - 27 4 31 31 - 20.7 20.7 Public Health Practice (CPE) - - - - - - 194 16 210 - - - 194 16 210 210 - 115.7 115.7
Public Health Sciences 111 215 227 316 - 869 - - - - - - - - - 869 807.8 - 807.8
Total 344 483 455 726 - 2,008 400 30 430 112 16 128 512 46 558 2,566 1,913.8 467.9 2,381.7 Primary Majors 332 464 426 648 - 1,870 400 30 430 112 16 128 512 46 558 2,428 1,837.0 467.9 2,304.9 Secondary Majors 12 19 29 78 - 138 - - - - - - - - - 138 76.8 - 76.8
Unduplicated (Primary Majors) 332 464 426 648 - 1,870 400 30 430 112 16 128 512 46 558 2,428 1,913.8 467.9 2,381.7 State-Supported 332 464 426 648 - 1,870 143 6 149 112 16 128 255 22 277 2,147 1,913.8 311.6 2,225.4 Continuing and Professional Education - - - - - - 257 24 281 - - - 257 24 281 281 - 156.3 156.3
Definitions and NotesStudent Majors: A student with a declared major within the school or college. At the undergraduate level, data reported represent a duplicated count of student majors (primary and secondary majors). FTE student majors are
distributed proportionally across major programs. See Enrollment Definitions for additional details.Other: Includes post-graduate and all non-degree students.Active: Matriculating graduate students registered for courses or dissertation credits.Program Fee (PF): Matriculating graduate students assigned three credits while on Program Fee (no course).Primary Majors: The actual count of undergraduate students whose primary major is in this school/college.Secondary Majors: The actual count of undergraduate students whose secondary or tertiary declared major is in this school/college.Continuing and Professional Education (CPE): Undergraduate and graduate programs administered through CPE. Note 1. All data reflect the current organizational structure. Note 2. Excludes UMass undergraduate students on exchange at other institutions.
Spring Semester 2019
Page 37 • Admissions and Enrollment Report, Fall 2018 University of Massachusetts Amherst • Office of Institutional Research (OIR)
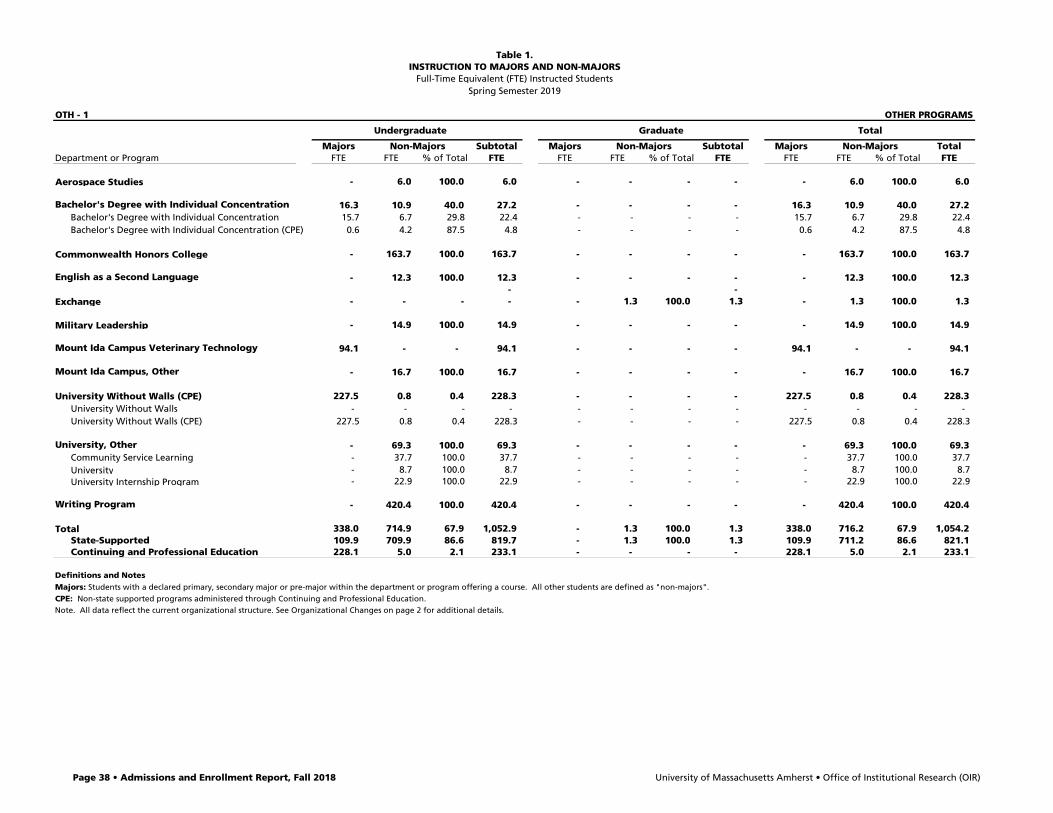
Table 1.INSTRUCTION TO MAJORS AND NON-MAJORS
Full-Time Equivalent (FTE) Instructed StudentsSpring Semester 2019
OTH - 1 OTHER PROGRAMS
Undergraduate Graduate Total
Majors Non-Majors Subtotal Majors Non-Majors Subtotal Majors Non-Majors TotalDepartment or Program FTE FTE % of Total FTE FTE FTE % of Total FTE FTE FTE % of Total FTE
Aerospace Studies - 6.0 100.0 6.0 - - - - - 6.0 100.0 6.0
Bachelor's Degree with Individual Concentration 16.3 10.9 40.0 27.2 - - - - 16.3 10.9 40.0 27.2 Bachelor's Degree with Individual Concentration 15.7 6.7 29.8 22.4 - - - - 15.7 6.7 29.8 22.4 Bachelor's Degree with Individual Concentration (CPE) 0.6 4.2 87.5 4.8 - - - - 0.6 4.2 87.5 4.8
Commonwealth Honors College - 163.7 100.0 163.7 - - - - - 163.7 100.0 163.7
English as a Second Language - 12.3 100.0 12.3 - - - - - 12.3 100.0 12.3 - -
Exchange - - - - - 1.3 100.0 1.3 - 1.3 100.0 1.3
Military Leadership - 14.9 100.0 14.9 - - - - - 14.9 100.0 14.9
Mount Ida Campus Veterinary Technology 94.1 - - 94.1 - - - - 94.1 - - 94.1
Mount Ida Campus, Other - 16.7 100.0 16.7 - - - - - 16.7 100.0 16.7
University Without Walls (CPE) 227.5 0.8 0.4 228.3 - - - - 227.5 0.8 0.4 228.3 University Without Walls - - - - - - - - - - - - University Without Walls (CPE) 227.5 0.8 0.4 228.3 - - - - 227.5 0.8 0.4 228.3
University, Other - 69.3 100.0 69.3 - - - - - 69.3 100.0 69.3 Community Service Learning - 37.7 100.0 37.7 - - - - - 37.7 100.0 37.7 University - 8.7 100.0 8.7 - - - - - 8.7 100.0 8.7 University Internship Program - 22.9 100.0 22.9 - - - - - 22.9 100.0 22.9
Writing Program - 420.4 100.0 420.4 - - - - - 420.4 100.0 420.4
Total 338.0 714.9 67.9 1,052.9 - 1.3 100.0 1.3 338.0 716.2 67.9 1,054.2 State-Supported 109.9 709.9 86.6 819.7 - 1.3 100.0 1.3 109.9 711.2 86.6 821.1 Continuing and Professional Education 228.1 5.0 2.1 233.1 - - - - 228.1 5.0 2.1 233.1
Definitions and NotesMajors: Students with a declared primary, secondary major or pre-major within the department or program offering a course. All other students are defined as "non-majors".CPE: Non-state supported programs administered through Continuing and Professional Education.Note. All data reflect the current organizational structure. See Organizational Changes on page 2 for additional details.
Page 38 • Admissions and Enrollment Report, Fall 2018 University of Massachusetts Amherst • Office of Institutional Research (OIR)

Table 2.STUDENT MAJORS
Headcount (HCT) and Full-Time Equivalent (FTE) Majors
OTHER PROGRAMS OTH - 2 H E A D C O U N T S T U D E N T M A J O R S FTE STUDENT MAJORS
Undergraduate Graduate* Total UGrad Grad TotalFirst- Sopho- ALL MASTER'S DOCTORAL ALL GRADUATE
Department or Program Year more Junior Senior Other UGRAD Active PF Total Active PF Total Active PF Total
Bachelor of General Studies (CPE) - - - - - - - - - - - - - - - - - - -
Bachelor's Degree with Individual Concentration 2 36 92 146 - 276 - - - - - - - - - 276 212.6 - 212.6
Non-Degree - - - - 326 326 - - - - - - - - 596 922 143.6 273.6 417.2 Continuing and Professional Education - - - - 222 222 - - - - - - - - 518 740 76.3 228.9 305.2 Exchange Program - - - - 61 61 - - - - - - - - 12 73 55.6 12.8 68.4 Non-Degree - - - - 43 43 - - - - - - - - 66 109 11.7 31.9 43.6
University Without Walls (CPE) 20 114 337 377 - 848 - - - - - - - - - 848 436.2 - 436.2
Veterinary Technology (Mount Ida Campus) - 21 48 62 - 131 - - - - - - - - - 131 125.4 - 125.4 Veterinary Technology (AA) - 4 4 5 - 13 - - - - - - - - - 13 9.3 - 9.3 Veterinary Technology (BS) - 17 44 57 - 118 - - - - - - - - - 118 116.1 - 116.1
Total 22 171 477 585 326 1,581 - - - - - - - - 596 2,177 917.8 273.6 1,191.4 Primary Majors 21 163 453 544 326 1,507 - - - - - - - - 596 2,103 878.0 273.6 1,151.6 Secondary Majors 1 8 24 41 - 74 - - - - - - - - - 74 39.8 - 39.8
Unduplicated (Primary Majors) 21 163 453 544 326 1,507 - - - - - - - - 596 2,103 917.8 273.6 1,191.4 State-Supported 1 49 116 169 104 439 - - - - - - - - 78 517 405.8 44.7 450.4 Continuing and Professional Education 20 114 337 375 222 1,068 - - - - - - - - 518 1,586 512.1 228.9 741.0
* Graduate Non-Degree students have no degree level. They appear in this table aggregated under Graduate Total.
Definitions and NotesStudent Majors: A student with a declared major within the school or college. At the undergraduate level, data reported represent a duplicated count of student majors (primary and secondary majors). FTE student majors are
distributed proportionally across major programs. See Enrollment Definitions for additional details.Other: Includes post-graduate and all non-degree students.Active: Matriculating graduate students registered for courses or dissertation credits.Program Fee (PF): Matriculating graduate students assigned three credits while on Program Fee (no course).Primary Majors: The actual count of undergraduate students whose primary major is in this school/college.Secondary Majors: The actual count of undergraduate students whose secondary or tertiary declared major is in this school/college.
Continuing and Professional Education (CPE): Undergraduate and graduate programs administered through CPE. Note 1. All data reflect the current organizational structure. Note 2. Excludes UMass undergraduate students on exchange at other institutions.
Spring Semester 2019
Page 39 • Admissions and Enrollment Report, Fall 2018 University of Massachusetts Amherst • Office of Institutional Research (OIR)