Pension reform: Issues for the future - KWSP
27
Pension reform: Issues for the future Edward Whitehouse Head of Pension Policy Analysis OECD Dynamic Evolution of the Pensions World, Kuala Lumpur, April 2012
Transcript of Pension reform: Issues for the future - KWSP

Pension reform:
Issues for the
future
Edward Whitehouse
Head of Pension Policy Analysis
OECD
Dynamic Evolution of the Pensions World,
Kuala Lumpur, April 2012
Key policy issues
• Coverage
• Early withdrawals
• Annuitisation
• Indexation• Indexation
• Financial sustainability

Coverage
1
Coverage

Coverage
BRNESP
SGP
CHENORCZE
PRT
GRC
ITA
JPN
Active members of pension system, per cent of labour force
75
100BLR
BGRHKG
MDA EGY
UKRBIH
KAZ
BRACHL
RUS
500 1000 2500 5000 10000 25000 50000
SGP
Gross national income per head, USD, 2009, log scale
0
25
50 MYS
IND
TUN
ARG
MEX
PAK
IDN
CHN
MNG
PHLLKA
VNMTHA
MDA EGY BRA TUR
KGZ
LBNVEN

Closing the coverage gap
• Will economic growth and development deal with
the problem?
• Most policies designed to expand coverage have
not succeeded
• Voluntary, matched defined-contribution schemes• Voluntary, matched defined-contribution schemes
• Social pensions

Social pensions
• Currently, play only a small role in Asia/Pacific:
– about 1% of older people in Singapore, 5% in Hong
Kong and maximum of 10-15% in India

Safety-net benefits: recipiency
Spain
Italy
France
Finland
Sweden
Denmark
Portugal
Australia
Greece
0 10 20 30 40 50 60 70 80
Germany
Japan
Hungary
United States
Switzerland
Poland
United Kingdom
Ireland
OECD
Canada
Spain
Safety-net benefits
Contributory minimum

Social pensions
• Currently, play only a small role in Asia/Pacific:
– about 1% of older people in Singapore, 5% in Hong
Kong and maximum of 10-15% in India
• Policy issues with social pensions
– What level?– What level?
– From which age?
– Targeted or not?

Social pension design
• Advantages
• universal benefit is simple
to understand, cheap to
administer and covers all
• incentives to work and
contribute to income-
Retirementincome
contribute to income-
replacement pension
• Disadvantages
• potentially costly,
threatening long-term
financial sustainability
Income-replacement pension
Universal pension(Non-contributory)
Earnings when working

Social pension design
• Advantages
• targeting cuts costs
compared with universal
benefit
• Disadvantages
Retirementincome
10
• Disadvantages
• reduced (but still positive)
incentives to work and
contribute for low earners
• means-testing can be
expensive to administer
correctlyUniversal pension(Non-contributory)
Targeted benefit
Earnings when working
Income-replacement pension

Pension systems in Asia/Pacific
2
Pension systems in Asia/Pacific

Mandatory income-replacement plans
Source: OECD (2012), Pensions at a Glance: Asia/Pacific

Gross pension replacement rates
Source: OECD (2012), Pensions at a Glance: Asia/Pacificper cent of individual earnings

Withdrawals
• ‘Pension’ = periodic payment to most people
• Many Asian countries do not provide ‘pensions’
– purely lump sums (Malaysia, Sri Lanka)
– spread over five years (Indonesia)
– lump-sum option (Hong Kong)– lump-sum option (Hong Kong)
– BUT Singapore moving to mandatory annuities
• Annuities improve welfare: longevity insurance
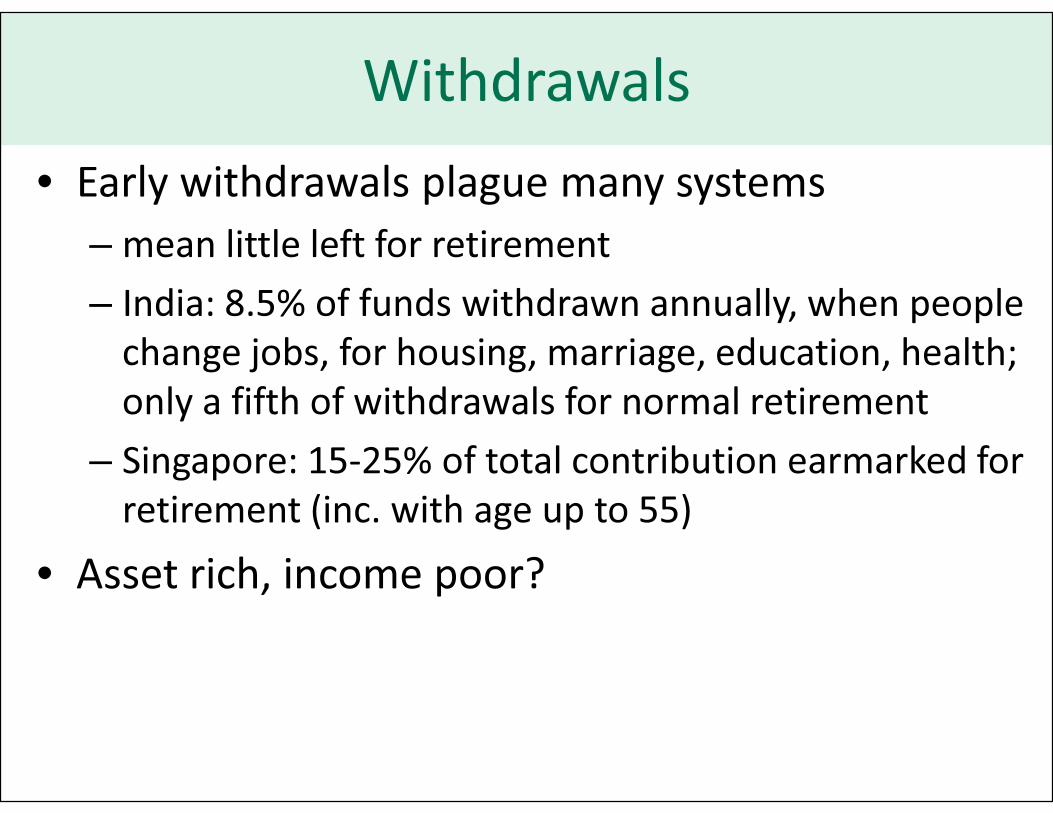
Withdrawals
• Early withdrawals plague many systems
– mean little left for retirement
– India: 8.5% of funds withdrawn annually, when people
change jobs, for housing, marriage, education, health;
only a fifth of withdrawals for normal retirementonly a fifth of withdrawals for normal retirement
– Singapore: 15-25% of total contribution earmarked for
retirement (inc. with age up to 55)
• Asset rich, income poor?

Modernising defined-benefit plans
• Earnings measures:
– final-salary schemes are distortionary, costly and
unnecessary to protect real pension values
– all OECD countries with public/mandatory private
defined-benefit schemes use lifetime average salarydefined-benefit schemes use lifetime average salary
– in Asia/Pacific, only Viet Nam, but not India, Pakistan,
Philippines, Thailand
• Indexation:
– adjustment of pensions needed to preserve adequacy
– China, Philippines and Viet Nam automatically increase
benefits, but not India, Pakistan, Thailand

Financial sustainability
3
Financial sustainability

Public pension spending
EU-27
Sweden
Germany
Greece
France
Italy
Poland
0 5 10 15 20 25
Australia
Ireland
United States
Canada
Netherlands
United Kingdom
OECD-28
Spain
EU-27
Level in 2007
Projected
change,
2007-60
Public expenditure on old-age and survivors’ benefits, per cent of GDPNote: 2050 for Australia

Demographic (in)determinism
15
20
25 Public expenditure on
pensions, per cent of GDP
2010
R2=0.586France
Italy
0 10 20 30 40 50 60 70
0
5
10
Dependency ratio: percentage of adult population aged 65+
Turkey
Mexico
Korea
Austria
France
Sweden
Germany
United Kingdom,
Estonia, Switzerland
Ireland
Poland
Canada, New Zealand,
United States, Australia
Netherlands

Demographic (in)determinism
15
20
25 Public expenditure on
pensions, per cent of GDP
2010
R2=0.586
0 10 20 30 40 50 60 70
0
5
10
Dependency ratio: percentage of adult population aged 65+

Demographic (in)determinism
15
20
25 Public expenditure on
pensions, per cent of GDP
2010
R2=0.586
Luxembourg
Slovenia
Spain
Italy
PortugalNorway
Belgium
Greece
0 10 20 30 40 50 60 70
0
5
10
Dependency ratio: percentage of adult population aged 65+
United
Kingdom
Turkey
United
States
Mexico
Korea
Australia
Canada
Poland
Portugal
Germany
Norway
2050
R2=0.112

Pension ages and life expectancy
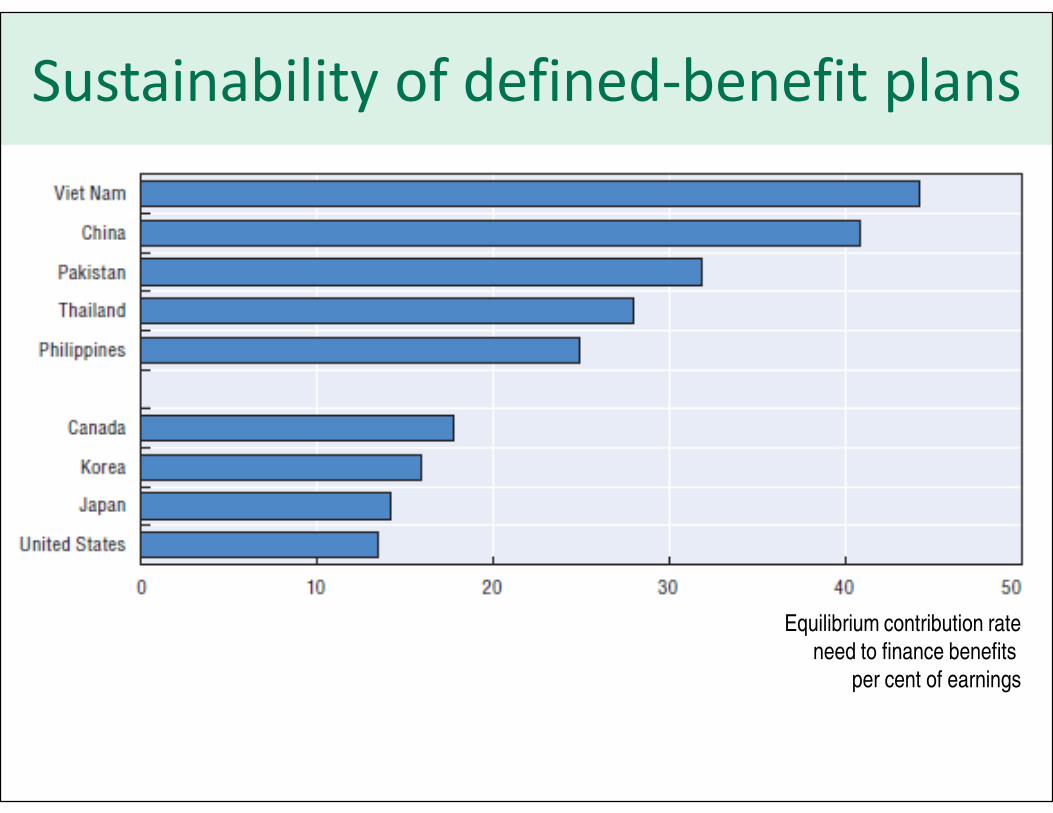
Sustainability of defined-benefit plans
Equilibrium contribution rate
need to finance benefits
per cent of earnings

Conclusions
4
Conclusions

Ageing Asia’s pension problems
• Coverage
• Adequacy
• Sustainability

Pensions at a Glance 2011
RETIREMENT-INCOME SYSTEMS IN
OECD AND G20 COUNTRIES
www.oecd.org/els/social/pensionswww.oecd.org/els/social/pensions

Pensions at a Glance 2011
RETIREMENT-INCOME SYSTEMS IN
OECD AND G20 COUNTRIES
www.oecd.org/els/social/pensionswww.oecd.org/els/social/pensions