Pediatric anesthesia monitoring with the help of EEG and · PDF file ·...
31
HAL Id: inserm-00134400 http://www.hal.inserm.fr/inserm-00134400 Submitted on 10 Apr 2007 HAL is a multi-disciplinary open access archive for the deposit and dissemination of sci- entific research documents, whether they are pub- lished or not. The documents may come from teaching and research institutions in France or abroad, or from public or private research centers. L’archive ouverte pluridisciplinaire HAL, est destinée au dépôt et à la diffusion de documents scientifiques de niveau recherche, publiés ou non, émanant des établissements d’enseignement et de recherche français ou étrangers, des laboratoires publics ou privés. Pediatric anesthesia monitoring with the help of EEG and ECG. Lotfi Senhadji, Guy Carrault, Hervé Gauvrit, Eric Wodey, Patrick Pladys, François Carré To cite this version: Lotfi Senhadji, Guy Carrault, Hervé Gauvrit, Eric Wodey, Patrick Pladys, et al.. Pediatric anes- thesia monitoring with the help of EEG and ECG.. Acta Biotheor, 2000, 48 (3-4), pp.289-302. <10.1023/A:1010233615281>. <inserm-00134400>
Transcript of Pediatric anesthesia monitoring with the help of EEG and · PDF file ·...

HAL Id: inserm-00134400http://www.hal.inserm.fr/inserm-00134400
Submitted on 10 Apr 2007
HAL is a multi-disciplinary open accessarchive for the deposit and dissemination of sci-entific research documents, whether they are pub-lished or not. The documents may come fromteaching and research institutions in France orabroad, or from public or private research centers.
L’archive ouverte pluridisciplinaire HAL, estdestinée au dépôt et à la diffusion de documentsscientifiques de niveau recherche, publiés ou non,émanant des établissements d’enseignement et derecherche français ou étrangers, des laboratoirespublics ou privés.
Pediatric anesthesia monitoring with the help of EEGand ECG.
Lotfi Senhadji, Guy Carrault, Hervé Gauvrit, Eric Wodey, Patrick Pladys,François Carré
To cite this version:Lotfi Senhadji, Guy Carrault, Hervé Gauvrit, Eric Wodey, Patrick Pladys, et al.. Pediatric anes-thesia monitoring with the help of EEG and ECG.. Acta Biotheor, 2000, 48 (3-4), pp.289-302.<10.1023/A:1010233615281>. <inserm-00134400>
PEDIATRIC ANESTHESIA MONITORING WITH THE HELP OF EEG AND ECG
L. Senhadji, G. Carrault, H. Gauvrit, E. Wodey, P. Pladys, F. Carré
Correspondance : Laboratoire Traitement du Signal et de l'Image (LTSI), INSERM, Université de Rennes 1, Rennes, France.
email : [email protected]
The original publication is available at www.springerlink.com
HA
L author manuscript inserm
-00134400, version 1
HAL author manuscriptActa Biotheor 12/2000; 48(3-4): 289-302
PEDIATRIC ANESTHESIA MONITORING WITH THE HELP OF EEG AND ECG
L. Senhadji, G. Carrault, H. Gauvrit, E. Wodey, P. Pladys,
F. Carré
Correspondance : Laboratoire Traitement du Signal et de l'Image (LTSI), INSERM, Université de Rennes 1, Rennes, France. email : [email protected]
Abstract
This paper presents research regarding the monitoring of the brain and the adequacy of anesthesia
during surgery. Particular variables are derived from EEG and ECG signals and are correlated to
anesthetic gas (sevoflurane) concentration, in pediatric anesthesia. The methods used for parameter
extraction are based on change detection theory and time-frequency representation. Preliminary
results show that the expired anesthetic gas concentration modulates both the heart rate variability
and the duration of the burst suppression. Monitors of the central nervous system and autonomic
nervous system activities can be expected based on these variables.
I Introduction
During general anesthesia direct testing of the central nervous system (CNS) by means of
physical examination still remains difficult. Hence, the occurrence of a CNS injury may not be
detected during surgery, resulting in irreversible brain damage. Under these conditions, the
monitoring of the cerebral function appears highly desirable.
The electroencephalogram is currently the most popular monitor of neurological function
during general anesthesia. Various physiological perturbations, the administration of specific drugs
and the depth of anesthesia may alter the structure of the EEG (Drader et al., 1997). The first
marker is generally a change in frequency distribution with suppression of both alpha and beta
HA
L author manuscript inserm
-00134400, version 1

frequency bands and the predominance of slower frequency components (Mahla, 1997). During
severe cortical deterioration, burst suppression appears progressing to an isoelectric pattern (Prior,
1996). Similar patterns occur with many different classes of anesthetic agents (Mahla, 1997) and
with induced hypothermia during cardiac surgery.
In the operating room, EEG might then be included in the monitoring for brain damage as
well as for the assessment of the depth of anesthesia which, in clinical practice, is estimated from
indirect and non specific signs including haemodynamic, respiratory, muscle and autonomic signs
(Langford, 1996). Many attempts have been made to determine an accurate monitor for the
adequacy and the depth of anesthesia based on variables extracted from EEG recording. The main
parameters presently used are derived from the amplitude of the EEG and from its power spectrum
(Bloom, 1997). Recently monitors based on the bispectrum of the EEG (Rampil, 1998) (Gajraj et
al., 1998) or on the quantitative analysis of middle latency auditory evoked potentials (MLAEP)
have been introduced (Huowg et al., 1999). The techniques based on temporal and spectral
representation appear insufficient, those based on MLAEP and bispectrum analysis need further
validation (Todd, 1998) (Gajraj et al., 1998) (Hall and Lockwood, 1998). None of these monitors
provide information of high specificity and they have to be interpreted in relation to the context and
the nature of the surgical operation.
The ECG signal is routinely monitored during general anesthesia. Normal sinus rhythm
results from the influence of cardiac autonomic nervous system on the electrophysiology of the
sino-atrial node. Beat to beat variability of the heart rate (HR) is caused by a fluctuating balance of
sympathetic to parasympathetic tone and reflects the influence of autonomic nervous system on
cardiac functioning.
HA
L author manuscript inserm
-00134400, version 1
Power spectrum analysis has been shown to be of significance in the evaluation of HR
variability and in providing an estimation of sympathetic/parasympathetic balance (Akselrod et al.,
1981) (Malliani et al., 1991). The high frequency (HF) spectral components correspond to
parasympathetic vagal activity mediated by the respiratory center (respiratory arrhythmia). The
lower frequency (mid frequencies = MF and low frequencies = LF) are influenced by both
sympathetic and parasympathetic activity. General anesthesia has been shown to depress HR
variability (Ireland et al., 1996 ; Galletly et al., 1998 ; Kato et al., 1992 ; Kawamoto et al., 1994 ;
Mazerolles et al., 1996) and to inhibit HR response to changes in blood pressure (Schubert et al.,
1997). Moreover a dose related decrease in the cardiac autonomic nervous system activity in both
vagal and sympathetic nerves activity has been found after isoflurane. Donchin et al., (1985) have
shown that the amplitude of respiratory sinus arrhythmia decreases in the course of isoflurane-
nitrous oxide anesthesia and that all the components of power spectral analysis of the HR variability
increase in the recovery period. The effect of general anesthesia with inhalation anesthetic has been
further investigated by Galletly (et al., 1998) who found that total power and powers in the three
frequency bands decreased under general anesthesia and that the depression was significantly
greater in MF components without any difference between halothane and isoflurane. These results
are confirmed by Deutschman et al., (1994) who have found that in adult patients, propofol, an IV
anesthetic, reduces high frequency variability to a lesser degree than low frequency variability and
that the power spectral profile evolves with the level of anesthesia. Such significant variations of
HR power spectrum parameters were also reported by Schubert (et al., 1997) during general
anesthesia for abdominal surgery with a combination of thiopental sodium, fentanyl, isoflurane or
enflurane and nitrous oxide and after pentobarbital in dogs (Kawamoto et al., 1994).
The final aim of this work is to monitor the brain activity and the adequacy of the anesthesia
during surgery. To do so, both EEG and ECG signals, recorded in children, in the operating room
have been studied. The EEG analysis focuses on the spatio-temporal distribution and evolution of
HA
L author manuscript inserm
-00134400, version 1
burst suppression patterns, their characterization (in time domain, frequency domain and time-
frequency domain), in relation to their origin (pharmacological, physiological, pathological), and
their correlation with the RR intervals, derived from the ECG. Other studies for CNS monitoring
using the EEG, both in operating room and intensive care units, are being conducted in the
framework of the European Project IBIS (Ibis, 1997).
A preliminary database, presented in the next section, was recorded and analyzed during
minor surgical operations in which a single rather than a combination of anesthetic agents was
appropriate clinically and where the risk of cerebral injuries was very low. Therefore the changes in
the ECG and EEG signals will only be correlated to the concentration of the anesthetic gas used
here (sevolurane). As mentioned in the previous paragraph, abrupt modifications appear in the EEG
and ECG signals during general anesthesia. The determination of the time of their occurrence is the
first step toward a quantitative study of anesthesia. This is the objective of section III where two
specific algorithms, based upon rupture detection theory (Basseville and Nikiforov, 1993), are
described. Results of segmentation are discussed in section IV and promising perspectives are
mentioned.
II Data base
Ten ASA physical status I or II1 children (2-5 years old) who required elective surgery were
studied after the protocol had been approved by the Human Studies Committee and informed
parental consent had been obtained. All children were premedicated 30 min. before induction of
anesthesia with 0.3 mg/kg rectal midazolam and were NPO (nil per os) for 4 hr. preoperatively. An
inhaled induction of anesthesia was started with sevoflurane (8%) in oxygen, without nitrous oxide,
through an open circuit without soda lime absorber. Children were breathing spontaneously during
1 Classification of patient status provided by the American Society of Anesthesiologists. I : A normal healthy patient, II : A patient with mild systemic disease.
HA
L author manuscript inserm
-00134400, version 1

induction until endotracheal intubation. After placement of an intravenous line, the trachea was
intubated and the lungs were ventilated, to maintain normocarbia at the same frequency (30
cycles/min) for all children. Inspired concentration of sevoflurane was maintained, at 8% until a
steady state was obtained, then inspired concentration of the anesthetics gas was decreased every
minute about 1%. When clinical depth of anesthesia appeared inadequate, decrease in sevoflurane
concentration was stopped and a rapid increase was performed in order to obtain an appropriate
depth of anesthesia for starting the surgical procedure. Anesthetic gas concentration and carbon
dioxide concentration were measured from gas samples continuously aspirated from an elbow
connector added to the endotracheal tube. ECG, EEG, capnograms as well as inspired and expired
gas concentrations (sevoflurane) were recorded simultaneously and continuously. The EEG signals
were recorded by means of bi-frontal electrodes.
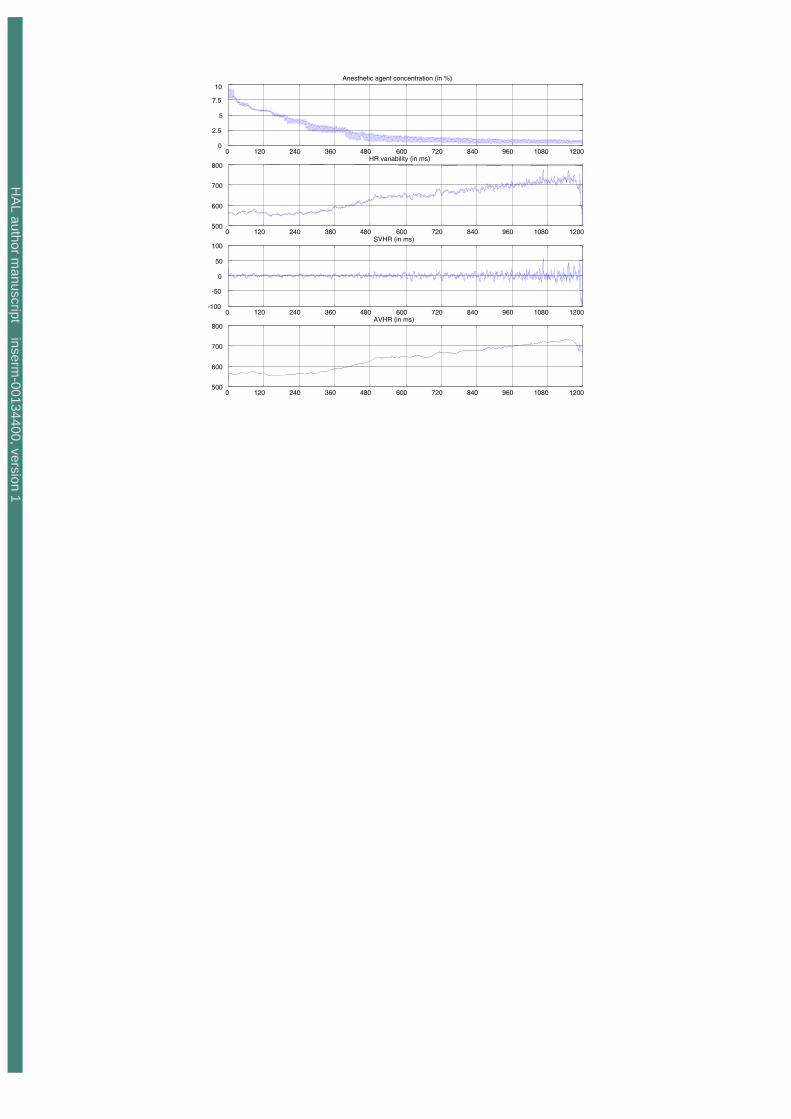
Since pediatric anesthesia has not attracted particular attention during recent years, a unique
indicator of consciousness from HR signals is not clearly established. Evidence for early expression
of possible awareness was experimentally retrieved from the HR signal. Figure 1 shows a typical
sequence of the expired gas concentration, the RR interval, its rapid fluctuation (spontaneous heart
rate variability SHRV) and its slow trend (absolute values of heart Rate AVHR). Just before the
awareness (anesthetic concentration is close to zero), we observed a decrease in the HR frequency
and a progressive variability in rate. At the onset of awareness, HR frequency increases abruptly
and the variability becomes more important. This typical evolution was observed on 9 of the ten
patients, the 10th having slightly different behavior (Figure 2).
Figure 1
HA
L author manuscript inserm
-00134400, version 1

Figure 2
In patient 10, HR variability is always present suggesting that the autonomic nervous system
is not completely depressed even though the patient has been correctly anesthetized. Despite this
last remark, It could be noticed that just before and after the onset of awareness a similar global
behavior is observed (decrease in cardiac frequency, the evidence of variability and rapid increase
in cardiac frequency).
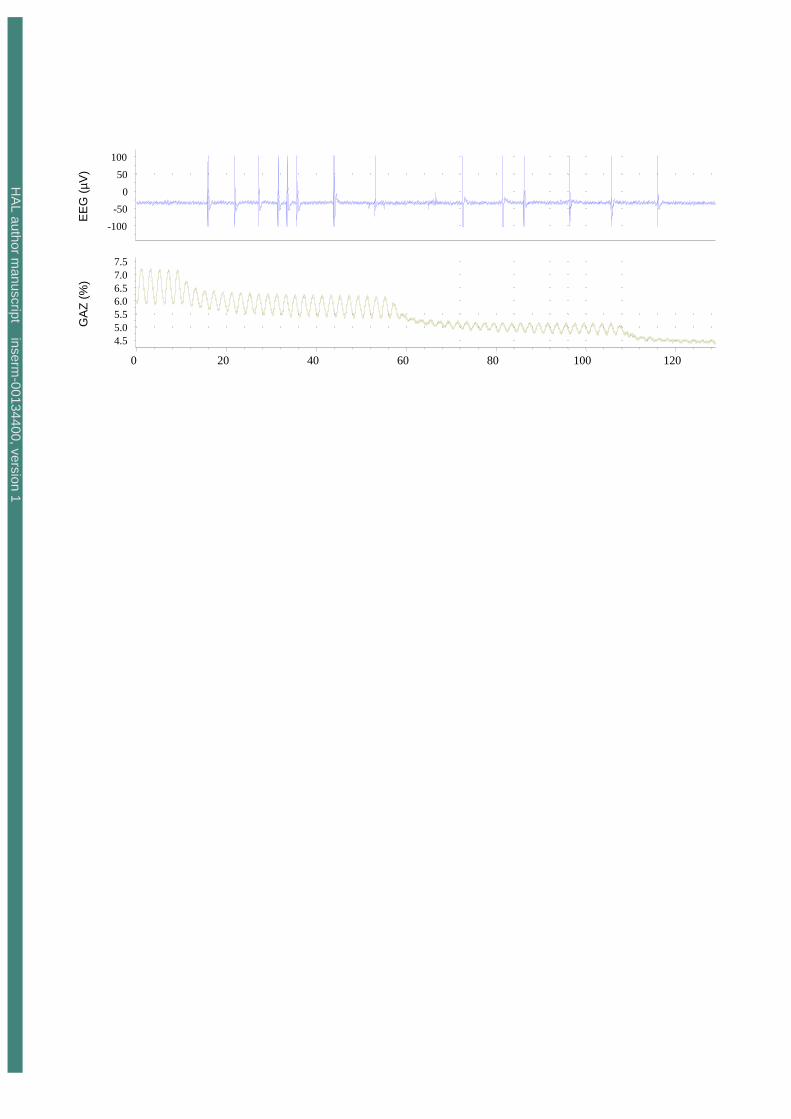
The behavior of the EEG signal (left channel) for patient n°1 and patient n°10 are reported
respectively in Figure 3 and Figure 4.
Figure 3
Figure 4
Even for comparable gas concentration, the characteristics / components of the EEG varied
from one patient to another. Figure 3, shows the EEG dynamics for the patient n°10 where a "spike-
like" activity appeared and a long-term stationary signal is only observed at an expired sevoflurane
concentration around 3%. For patient n°1, the anesthetic agent induced only a burst suppression
activity. As for patient 10, a long-term stationary signal is recovered for an expired gas
concentration close to 4% (Figure 4).
III Change detection in a signal
HA
L author manuscript inserm
-00134400, version 1

From a formal point of view, this problem belongs to the so-called rupture detection which
consists of confronting the two following composite hypotheses:
1
011
0
model the follow ... ' model the follow ... :
model the follow ... :
θθ
θ
nr
ro
noo
xxxxHxxH
− (1)
where θ. is a family of models. From a practical point of view, we have to choose between the two
previous hypotheses Ho and H1, to localize the time instant of change r and, if necessary, to estimate
the models θo, θ’o and θ1 before and after the rupture. Since the models θo, θ’o and θ1 are generally
unknown, the choice between the two hypotheses is done using the generalized likelihood ratio.
III.1 Detection of bursts and suppressions in the EEG signal
A typical situation observed during an anesthesia is reported in Figure 5. The goal is to detect
the abrupt changes occurring within the signal that alternate between silent periods (the
suppressions) and important neuronal discharges (the bursts).
Figure 5
The examination of this previous situation suggests testing the two following hypotheses:
( )( )
( )nrn
ror
nono
,...,xx Pxx,...,xxPxxH
,...,xxPxxH
1r
101o1
0o
law thefollow ,..., law thefollow ,..., :
law thefollow ,..., :
−−
HA
L author manuscript inserm
-00134400, version 1
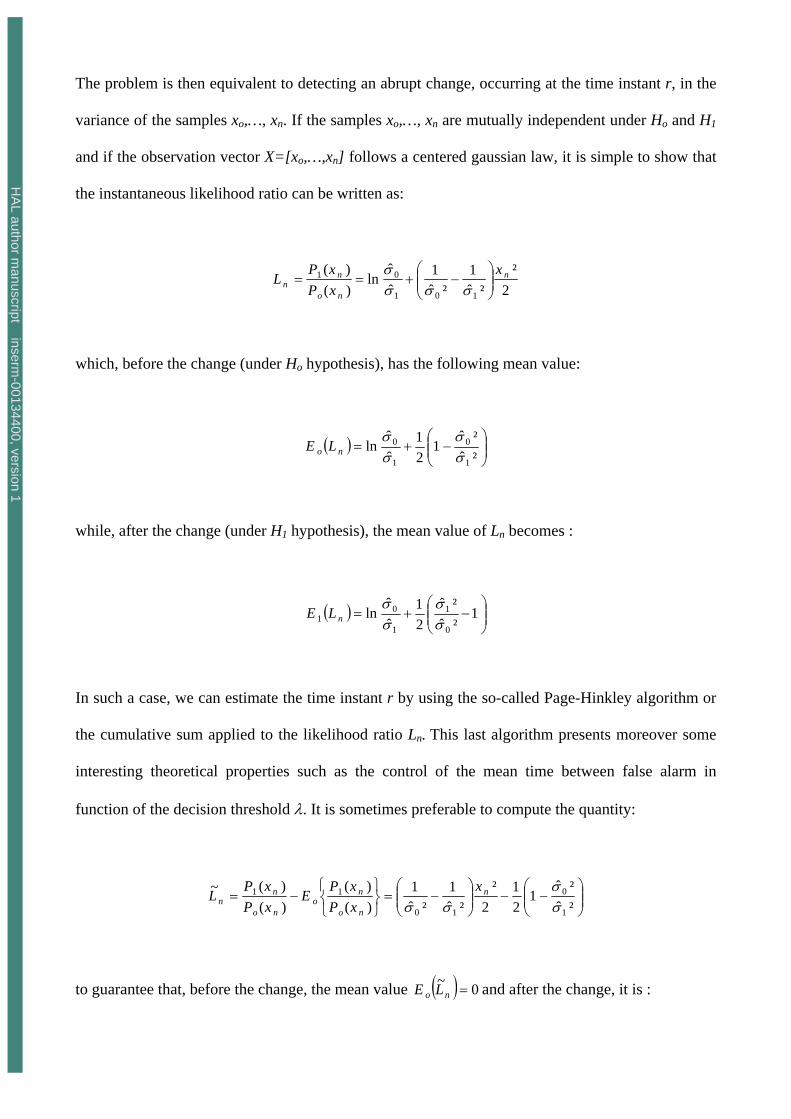
The problem is then equivalent to detecting an abrupt change, occurring at the time instant r, in the
variance of the samples xo,…, xn. If the samples xo,…, xn are mutually independent under Ho and H1
and if the observation vector X=[xo,…,xn] follows a centered gaussian law, it is simple to show that
the instantaneous likelihood ratio can be written as:
2²
²ˆ1
²ˆ1
ˆˆ
ln)()(
101
01 n
no
nn
xxPxP
L ⎟⎟⎠
⎞⎜⎜⎝
⎛−+==
σσσσ
which, before the change (under Ho hypothesis), has the following mean value:
( ) ⎟⎟⎠
⎞⎜⎜⎝
⎛−+=
²ˆ²ˆ
121
ˆˆ
ln1
0
1
0
σσ
σσ
no LE
while, after the change (under H1 hypothesis), the mean value of Ln becomes :
( ) ⎟⎟⎠
⎞⎜⎜⎝
⎛−+= 1
²ˆ²ˆ
21
ˆˆ
ln0
1
1
01 σ
σσσ
nLE
In such a case, we can estimate the time instant r by using the so-called Page-Hinkley algorithm or
the cumulative sum applied to the likelihood ratio Ln. This last algorithm presents moreover some
interesting theoretical properties such as the control of the mean time between false alarm in
function of the decision threshold λ. It is sometimes preferable to compute the quantity:
⎟⎟⎠
⎞⎜⎜⎝
⎛−−⎟⎟
⎠
⎞⎜⎜⎝
⎛−=
⎭⎬⎫
⎩⎨⎧
−=²ˆ²ˆ
121
2²
²ˆ1
²ˆ1
)()(
)()(~
1
0
10
11
σσ
σσn
no
no
no
nn
xxPxP
ExPxP
L
to guarantee that, before the change, the mean value ( ) 0~ =no LE and after the change, it is :
HA
L author manuscript inserm
-00134400, version 1
( ) 1²ˆ²ˆ
²ˆ²ˆ
21~
1
0
0
11 −⎟⎟
⎠
⎞⎜⎜⎝
⎛−=
σσ
σσ
nLE
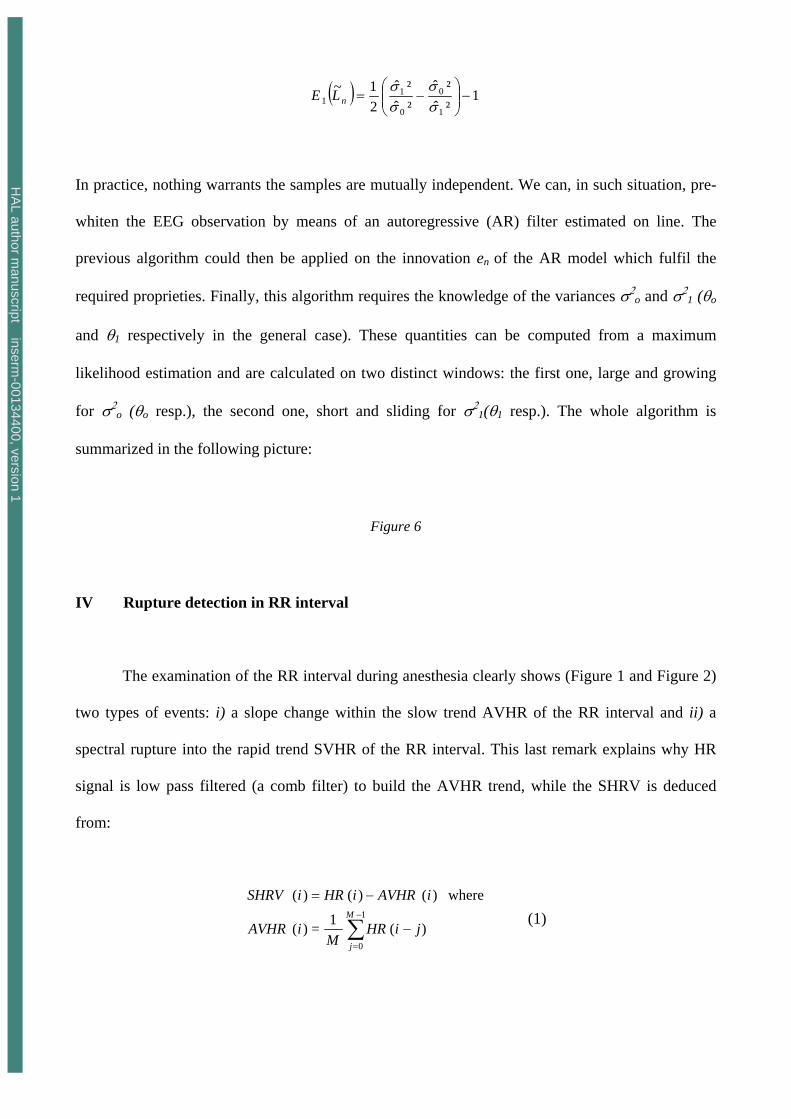
In practice, nothing warrants the samples are mutually independent. We can, in such situation, pre-
whiten the EEG observation by means of an autoregressive (AR) filter estimated on line. The
previous algorithm could then be applied on the innovation en of the AR model which fulfil the
required proprieties. Finally, this algorithm requires the knowledge of the variances σ2o and σ2
1 (θo
and θ1 respectively in the general case). These quantities can be computed from a maximum
likelihood estimation and are calculated on two distinct windows: the first one, large and growing
for σ2o (θo resp.), the second one, short and sliding for σ2
1(θ1 resp.). The whole algorithm is
summarized in the following picture:
Figure 6
IV Rupture detection in RR interval
The examination of the RR interval during anesthesia clearly shows (Figure 1 and Figure 2)
two types of events: i) a slope change within the slow trend AVHR of the RR interval and ii) a
spectral rupture into the rapid trend SVHR of the RR interval. This last remark explains why HR
signal is low pass filtered (a comb filter) to build the AVHR trend, while the SHRV is deduced
from:
∑−
=
−
−=1
0
)(1=)(
where )()()(M
j
jiHRM
iAVHR
iAVHRiHRiSHRV (1)
HA
L author manuscript inserm
-00134400, version 1

Since abrupt changes in the AVHR and SHRV may provide an indicator of awareness in depth
anesthesia, rupture detection algorithms as described in the last section, can be considered for their
estimation. The whole processing scheme is depicted Figure 7. Data are first filtered in order to
eliminate low frequency drift and high frequency components, merged with the signal, due mainly
to the patient's movements in the initial and final phases of the anaesthesia. The ECG signal is then
processed by the length transformation proposed by Gritzali (1988) and an optimal threshold is
computed to detect the QRS occurrence in order to construct the HR variability sequence.
Figure 7
IV.1 Change within AVHR
The analysis of the AVHR trend suggests the modeling of the observations as a linear slope
embedded in a centered white Gaussian noise, with variance σ2 (figure 1 and figure 2). In this
context, the set of parameter θ is then (a, b, σ2) and (1) becomes:
NkrkebkakyrkkebkakyHNkkebkakyH
ooo
oooo
≤≤=
−≤≤=
≤≤=
for )(+ +)1-( )( 11 for )(+ +)1-( )( :
1 for )(+ +)1-( )( :
111
1
In this context and after straightforward calculation, Lk corrected by its mean under Ho is equivalent
to :
⎥⎥⎦
⎤
⎢⎢⎣
⎡⎟⎟⎠
⎞⎜⎜⎝
⎛+−+⎟⎟
⎠
⎞⎜⎜⎝
⎛−= 2
2
2
21
21
2
21
21
2 )(1)()(21
2)(
ooo
o
o
o kekekekw o
σσσ
σσσ
σσ
HA
L author manuscript inserm
-00134400, version 1
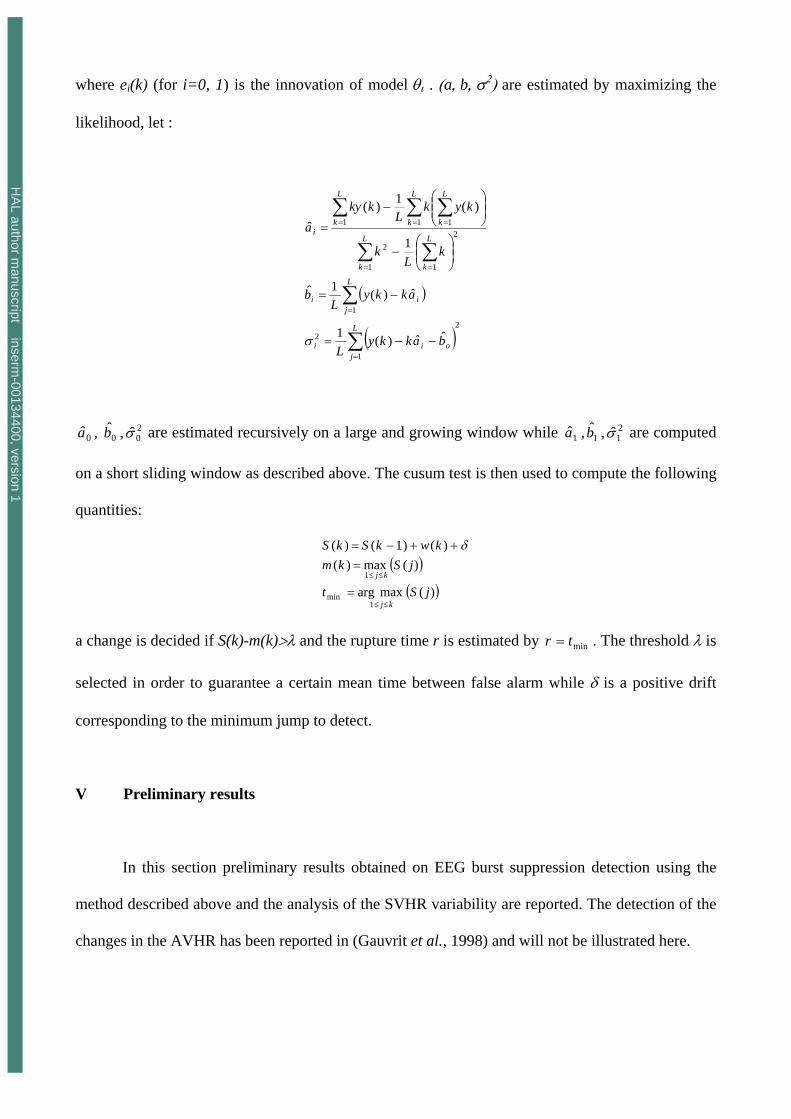
where ei(k) (for i=0, 1) is the innovation of model θι . (a, b, σ2) are estimated by maximizing the
likelihood, let :
( )
( )2
1
2
1
1
2
1
2
1 11
ˆˆ)(1
ˆ)(1ˆ
1
)(1)(ˆ
∑
∑
∑ ∑
∑ ∑∑
=
=
= =
= ==
−−=
−=
⎟⎟⎠
⎞⎜⎜⎝
⎛−
⎟⎟⎠
⎞⎜⎜⎝
⎛−
=
L
joii
L
jii
L
k
L
k
L
k
L
k
L
ki
bakkyL
akkyL
b
kL
k
kykL
kkya
σ
0a , , 0b 2
0σ are estimated recursively on a large and growing window while , , are computed
on a short sliding window as described above. The cusum test is then used to compute the following
quantities:
1a 1b 21σ
( )( ))(maxarg
)(max)()()1()(
1min
1
jSt
jSkmkwkSkS
kj
kj
≤≤
≤≤
=
=++−= δ
a change is decided if S(k)-m(k)>λ and the rupture time r is estimated by mintr = . The threshold λ is
selected in order to guarantee a certain mean time between false alarm while δ is a positive drift
corresponding to the minimum jump to detect.
V Preliminary results
In this section preliminary results obtained on EEG burst suppression detection using the
method described above and the analysis of the SVHR variability are reported. The detection of the
changes in the AVHR has been reported in (Gauvrit et al., 1998) and will not be illustrated here.
HA
L author manuscript inserm
-00134400, version 1

Figure 8a depicts an example of the segmentation procedure applied to the EEG signal. The
burst suppression patterns continue and are well detected in the first minute or so after the expired
sevoflurane concentration starts to decrease (Figure 8c), the burst duration increasing while the
suppression duration decreases (Figure 8b). Similar behavior has been observed in the other patients
but at different individual expired anesthetic concentration levels. Burst activity appears for expired
gas concentration between 3.5% and 5.5% for patient n°10, while for patient n°1 such activity
occurs between 3% and 4.5%.
Figure 8
The study of the SVHR curves has been conducted by means of a time-frequency analysis.
Figure 9 shows the time-frequency evolution of the SVHR component when the anesthetic agent
concentration decreases. We observe in the first part of the time frequency plan (before time 400s) a
unique frequency component at 0.5 Hz. It is induced by the artificial respirator and not by the
autonomic nervous system which is strongly depressed. When anesthetic agent concentration
decreases (after 400s), the autonomic activities appear and sympathetic and parasympathetic
influences are highlighted by the time frequency representation. Figure 10 is the analogue of the
Figure 9 but for patient n°10. With the artificial respirator contribution, low frequency components
are observed underlining the fact that the autonomic nervous system is not total depressed. After
300 s and as in the previous example, effects of sympathetic and parasympathetic tonus can be
retrieved from the time frequency plan.
Figure 9
Figure 10
HA
L author manuscript inserm
-00134400, version 1
These two examples point out the difficulty of assessing adequacy and depth of anesthesia
when they are evaluated based on indirect indicators or minimum alveolar concentration (MAC).
An indicator based on the rate of depression of the autonomic nervous system could be used to
evaluate the adequacy of anesthesia. Rupture detection framework, as previously described, can
then be applied to detect a change in the SVHR signal using a time frequency representation, rather
than the raw data; studies are presently being conducted in this direction.
VI Conclusion
One focus of this work was to show how rupture detection could be adapted to the
monitoring of anesthesia. This approach has already shown its value in the biomedical field for
SEEG segmentation in epilepsy (Wendling et al., 1997) and for multi-hypothesis classification in
EMG (Khalil and Duchêne, 1999).
Two different strategies can be adopted. The first one, which has been reported here,
consists of transforming the original data into a new sequence such that, if a change occurs, it
appears clearly on the new sequence by a jump into its mean value. The second one consists of
transforming the signal and applying the previous framework on the new domain.
Our research is still in progress, so only preliminary results are shown here. However, its
feasibility was investigated in several patients and satisfactory results were shown. Further
developments are directed towards increasing the information that could be extracted from our
protocol analysis. It is motivated by the fact that the ECG and the EEG signals are not fully
exploited for assessing the depth and adequacy of anesthesia especially in the pediatric context. It is
also motivated by the following :
HA
L author manuscript inserm
-00134400, version 1

1. Anaesthetic concentrations are currently used by clinicians as an indicator of depth of
anesthesia. Standard concentration values such as MAC (minimum alveolar concentration) are
established as a function of the patient's age. They give a pseudo gold standard to measure the
powerfulness of each anaesthetic gas. They also give a reference value to quantify the depth of
anesthesia. However, they are not specific or necessarily equally appropriate in every patient.
2. Regulation of the heart rate by autonomic nervous system is now well established.
Pharmacological effects of volatile anesthetics agent on the ANS and its regulation would allow
a better understanding of the relationships between gas, ANS and the effects on the central
nervous system during pharmacological sleep.
3. If robust markers and robust relationships (reproducible for a given population), between gas
concentration (GC) and the depth of anaesthesia (DA), could be defined from heart rate
variability or EEG analysis, the influence of others drugs, such as morphine used for analgesia,
would be better identified and their usefulness, particularly during classical anesthesia, might
then be quantifiable taking into account the previous relation GC-DA, pain and drug.
VII References
Akselrod, S., D. Gordon, F. Ubel, D. Shannon, A. Berger and R. Cohen (1981). Power spectrum
analysis of heart rate fluctuation: a quantitative probe of beat to beat cardiovascular control. Science
213:220.
Basseville, M. and I. Nikiforov (1993). Detection of abrupt changes, Theory and application.
Prentice-Halle, Englewood Cliffs, NJ.
HA
L author manuscript inserm
-00134400, version 1
Bloom, M.J. (1997). EEG monitoring: intraoperative application. Anesthesiology clinics of North
America. 15: 551-571.
Deutschman, C.S., A.P. Harris and L.A. Fleisher (1994). Changes in heart rate variability under
propofol anesthesia: a possible explanation for propofol induced bradycardia. Anesthesia Analgesia.
79 : 373-377.
Donchin, Y., J.M. Feld and S.W. Porges (1985). Respiratory sinus arrhythmia during recovery from
isoflurane-nitrous oxide anesthesia. Anesthesia Analgesia. 64: 811-815.
Drader, K.S. and I.A. Herrick (1997). Carotid endarterectomy: monitoring and its effect on
outcome. Anesthesiology clinics of North America 15: 613-628.
Gajraj, R.J., M. Doi, H. Mantzonidis and G.N.C. Kenny (1998). Analysis of the EEG bispectrum,
auditory evoked potentials and the EEG power spectrum during repeated transitions from
consciousness to unconsciousness. British Journal of Anesthesia 80: 46-52.
Galletly, D.C., A.M. Westenberg, B.J. Robinson and T. Corfiatis (1998). Effect of halothane,
isoflurane and fentanyl on spectral components of heart rate variability. British Journal of
Anaesthesia 80: 72:77.
Gauvrit, H., G. Carrault, P. Pladys, E. Wodey and F. Carré (1998). Monitoring of heart rate during
paediatric anesthesia, Proc. CIC, 1998.
Gritzali, F. (1988). Towards a generalized scheme for QRS detection in ECG waveforms. Signal
Processing 15: 183-192.
Hall, J.D. and G.G. Lockwood (1998). Bispectral index: comparison of two montages. British
Journal of Anesthesia 80: 342-344.
Huowg, J.W. , Ying-Ying Lu, A. Nayak and R.J. Roy (1999). Depth of anesthesia estimation and
control IEEE-Transaction in Biomedical Engineering 46: 71-81.
IBIS (1997), Improved Monitoring for Brain Dysfunction in Intensive Care and Surgery. EC
contract n° BMH4-97-2570, 1997.
HA
L author manuscript inserm
-00134400, version 1

Ireland, N., J. Meagher, J.W. Sleigh and J.D. Henderson (1996). Heart rate variability in patients
recovering from general anaesthesia. British Journal of Anaesthesia 76: 57-62.
Kato, M., T. Komatsu, T. Kimura, F. Sugiyama, K. Nakashima and Y. Shimada (1992). Spectral
analysis of heart rate variability during isoflurane anesthesia. Anesthesiology 77: 669-674.
Kawamoto, M., K. Kaneko, K. Hardian and O. Yuge (1994). Heart rate variability during artificial
ventilation and apnea in brain damaged rabbits. Am J Physiol 6: 271; H410.
Khalil, M and J. Duchêne (1999) Detection and classification of multiple events in piecewise
stationary signals: comparison between autoregressive and multiscale approaches. Signal
Processing 75: 239-252.
Langford, R.M. (1996). Clinical applications of cerebral monitoring. Computer methods and
programs in biomedicine. 51: 29-33.
M.E. Mahla, M.E. (1997). The electroencephalogram in operating room. Seminar in anesthesia, 16:
pp. 3-13.
Malliani, A., M. Pagani, F. Lombardi and S. Cerutti (1991). Cardiovascular neural regulation
explored in the frequency domain. Circulation 84: 482-92.
Mazerolles, M., J.M. Senard, P. Verwaerde, M.A. Tran, J.L. Montastruc, C. Virenque and P.
Montastruc (1996). Effects of pentobarbital and etomidate on plasma catecholamine levels and
spectral analysis of blood pressure and heart rate in dogs. Fundam Clin Pharmacology 10: 298-303.
P.F. Prior, P.F. (1996). The rational and utility of neurological investigations in clinical monitoring
for brain and spinal cord ischaemia during surgery and intensive care. Computer methods and
programs in biomedicine. 51:13-27.
Rampil, I.J. (1998). A primer for EEG signal processing in anesthesia. Anesthesiology. 89: 980-
1002.
Schubert A., J.A. Palazzolo, J.M. Brum, M.P. Ribeiro and M. Tan (1997). Heart rate, heart rate
variability, and blood pressure during perioperative stressor events in abdominal surgery. J Clin
Anesth. 9: 52-60.
HA
L author manuscript inserm
-00134400, version 1

Todd, M.M, (1998). EEGs, EEG processing and the bispectral index. Anesthesiology. 89: 815-817.
Wendling, F., G. Carrault and J.M. Badier (1997). Segmentation of Depth-EEG Seizure Signals :
Method Based on a Physiological Parameter and Comparative Study. Annals of Biomedical
Engineering 25: 1026-1039.
HA
L author manuscript inserm
-00134400, version 1

0 100 200 300 400 500 600 700 800 9000
1.5
3
4.5
6
7.5
Anesthetic agent concentration (in %)
0 100 200 300 400 500 600 700 800 900500
600
700
800HR variability (in ms)
0 100 200 300 400 500 600 700 800 900500
600
700
800AVHR (in ms)
0 100 200 300 400 500 600 700 800 900-50
-30
-10
10
30
50SVHR (in ms)
HA
L author manuscript inserm
-00134400, version 1
0 120 240 360 480 600 720 840 960 1080 12000
2.5
5
7.5
10Anesthetic agent concentration (in %)
0 120 240 360 480 600 720 840 960 1080 1200500
600
700
800HR variability (in ms)
0 120 240 360 480 600 720 840 960 1080 1200-100
-50
0
50
100SVHR (in ms)
0 120 240 360 480 600 720 840 960 1080 1200500
600
700
800AVHR (in ms)
HA
L author manuscript inserm
-00134400, version 1
EE
G (µ
V)
-100-50
050
100
GA
Z (%
)
4.55.05.56.06.57.07.5
0 20 40 60 80 100 120
HA
L author manuscript inserm
-00134400, version 1

E
EG (µ
V)
-400
-200
0
200
400
GAZ
(%)
4.0
4.5
5.0
5.5
6.0
20 40 60 80 100 120
HA
L author manuscript inserm
-00134400, version 1

HA
L author manuscript inserm
-00134400, version 1

1.4 1.42 1.44 1.46 1.48 1.5 x 10 4
1
r
n
n 1
Ho
H1
HA
L author manuscript inserm
-00134400, version 1

EEG signal :sn
Ln : log likelihood ratio
( )2
²²ˆ
1²ˆ
1ˆˆ
ln
)()(ln
0
101
0
0
1
μσσσ
σ −⎟⎟⎠
⎞⎜⎜⎝
⎛−+=
=
n
n
nn
sspspL
∑=
=n
kkn LS
1
CUSUM
threshold
tchange,minimum
Decision of change at talarm :CUSUM - minimum > λ
Change time at tchange i.e. the minimum.
²ˆ0σ ²ˆ1σ
HA
L author manuscript inserm
-00134400, version 1

+-
Lowband filter
Passband filter
Gritzali detector
HR AVHR
ECG
SHRV
HA
L author manuscript inserm
-00134400, version 1

0 20 40 60 80 100-500
0
500a) EEG
0 20 40 60 80 1000
5
10
15
20
25
30
time in s
Tb T
s
b) Bursts and suppressions (- -) lengths (in s)
0 20 40 60 80 1003.5
4
4.5
5
5.5
c) Expired gaz concentration (in %)
time in s
time in s
B
S
HA
L author manuscript inserm
-00134400, version 1

0 100 200 300 400 500 600 700 800 900550
600
650
700
750
800
time [s]
RR
[ms]
0 100 200 300 400 500 600 700 800 900-40
-20
0
20
40
60
SVH
R [m
s]
time [s]Smoothed Pseudo Wigner-Ville distribution
frequ
ency
[Hz]
100 200 300 400 500 600 700 800 900
0.2
0.4
0.6
0.8
1
time [s]
HA
L author manuscript inserm
-00134400, version 1

0 200 400 600 800 1000 1200500550600650700750800
time [s]
RR
[ms]
0 200 400 600 800 1000-40
-20
0
20
40
60
SVH
R [m
s]
Smoothed Pseudo Wigner-Ville Distribution
frequ
ency
[Hz]
100 200 300 400 500 600 700 800 900 1000 1100
0.2
0.4
0.6
0.8
1
1200time [s]
time [s]1200
HA
L author manuscript inserm
-00134400, version 1
Legends
Figure 1: Behavior of the HR and anesthetic agent concentration up to awareness (patient n°1).
Figure 2: Behavior of the HR and anesthetic agent concentration up to awareness (patient n°10).
Figure 3: EEG behavior and anesthetic gas concentration for patient n°10 (time in sec).
Figure 4: EEG behavior and anesthetic gas concentration for patient n°1.(time in sec).
Figure 5: EEG signal showing burst suppression patterns.
Figure 6: Description of the Burst Suppression Algorithm.
Figure 7: Extaction of the HR variability curves.
Figure 8: Burst Suppression activity for the patient n°1.
Figure 9:SVHR variability, up to awareness, of the patient n° 1.
Figure 10: SVHR variability, up to awareness, for the patient n°10
HA
L author manuscript inserm
-00134400, version 1