
Running head: IMPLEMENTATION OF A DIABETES ... OF A DIABETES TREATMENT ALGORITHM 3 Abstract Diabetes...
50
The Henderson Repository is a free resource of the Honor Society of Nursing, Sigma Theta Tau International. It is dedicated to the dissemination of nursing research, research- related, and evidence-based nursing materials. Take credit for all your work, not just books and journal articles. To learn more, visit www.nursingrepository.org Item type DNP Capstone Project Format Text-based Document Title Implementation of a Diabetes Treatment Algorithm in Primary Care for Use in the Adult Hispanic Population Authors Dillenbeck, Heidi Marshall Downloaded 11-May-2018 19:09:24 Link to item http://hdl.handle.net/10755/622565
Transcript of Running head: IMPLEMENTATION OF A DIABETES ... OF A DIABETES TREATMENT ALGORITHM 3 Abstract Diabetes...

The Henderson Repository is a free resource of the HonorSociety of Nursing, Sigma Theta Tau International. It isdedicated to the dissemination of nursing research, research-related, and evidence-based nursing materials. Take credit for allyour work, not just books and journal articles. To learn more,visit www.nursingrepository.org
Item type DNP Capstone Project
Format Text-based Document
Title Implementation of a Diabetes Treatment Algorithm inPrimary Care for Use in the Adult Hispanic Population
Authors Dillenbeck, Heidi Marshall
Downloaded 11-May-2018 19:09:24
Link to item http://hdl.handle.net/10755/622565

Running head: IMPLEMENTATION OF A DIABETES TREATMENT
ALGORITHM
1
Implementation of a Diabetes Treatment Algorithm in Primary Care for Use in the Adult
Hispanic Population
Heidi Dillenbeck, MSN, FNP-C
Submitted in Partial Fulfillment of the Requirements for the Northern Arizona University School
of Nursing Doctor of Nursing Practice Program
May 8, 2017

Running head: IMPLEMENTATION OF A DIABETES TREATMENT
ALGORITHM
2
Acknowledgements
The completion of this Doctor of Nursing Practice project was made possible with the
support of several people. I would like to sincerely thank my Mentor, Dr. Stetina, for her support
and guidance throughout this journey. A special thank you to Dr. Reynolds and the Northern
Arizona University faculty for their encouragement and inspiration. My very special thanks to
my good friend and colleague, Dr. Jennifer Allen. You helped me more than you know and your
level head and knowledge kept me focus and grounded. I owe you! To my best friend, colleague,
and partner in most things we do in life, Emma Edwards. You know as well as I do that if not for
you, I would not have accomplished this amazing feat. Thanks for always being there. To my
amazing sons, Luke and Owen, you guys are the greatest kids I could ever ask for, and I can
finally say I have no more homework to do! To my family and friends, your love,
encouragement, and patience got me through this, and I could not have done this without any of
you.

IMPLEMENTATION OF A DIABETES TREATMENT ALGORITHM
3
Abstract
Diabetes Mellitus Type 2 (DM2) is a growing problem in the United States. Hispanic Americans
have a higher prevalence of diabetes than Non-Hispanic Whites and suffer from more severe
complications of the disease. Although advances in diabetes treatment over the last decade has
improved, management of diabetes in primary care is inconsistent despite well-publicized
guidelines from the American Diabetes Association (ADA) and the American Association of
Clinical Endocrinologists (AACE). With the growth of the Hispanic population expected to
reach 25 % of the U.S. population by 2050, practice changes must be made to improve diabetes
management. The literature supports the use of standardized clinical practice algorithms to
provide structure and consistency in clinical decision making and diabetes treatment plans. The
purpose of this doctor of nursing practice project was to implement a diabetes treatment
algorithm in a primary care community health center for use during patient visits by the primary
care provider (PCP) with Hispanic diabetic patients. The participating PCPs were educated on
the use of the algorithm and encouraged to utilize the tool at each visit with qualified patients.
The tool contains several categories including documentation of an annual foot exam, bi-annual
glycated hemoglobin (A1C), A1C number, annual lipid panel, microalbumin, and glomerular
filtration rate (GFR), documentation of statin, aspirin, and angiotensin-converting-enzyme
inhibitor (ACEI) or an angiotensin II receptor blocker (ARB) use if indicated, titration of
medications, documented weight at each visit, and weight management. Chart audits were
performed to determine utilization of the tool by pulling data from these categories. During the
30-day study period, 87 patient charts were audited all of which used the algorithm to some
degree. Data was analyzed using descriptive statistics and frequency distributions. Of the 87
charts audited, 86 (98.9 %) contained a documented A1C in the treatment algorithm with a mean

IMPLEMENTATION OF A DIABETES TREATMENT ALGORITHM
4
A1C of 7.6 percent. Documentation of GFR and aspirin therapy were seen in about half of
audited charts. Adherence to recommended annual foot exams, documented microalbumin, and
addition or titration of DM medications fell well below 50 %. Weight management through an
RD referral was the worst measurement in guideline adherence with only 11 out of 87 patients
referred to a dietician. Following the completion of this project, it is evident that adherence to the
recommended standards of care is suboptimal in this practice setting. The goal of this practice
change project was to improve documentation and guideline adherence through a systems change
by implementing a DM treatment algorithm to be utilized by the PCP when treating Hispanic
adults with DM2. This process must be sustained and improved upon to close the gap between
the national evidence-based recommendations and current clinical practice.

IMPLEMENTATION OF A DIABETES TREATMENT ALGORITHM
5
Implementation of a Diabetes Treatment Algorithm in Primary Care for Use in the
Hispanic Population
Although advances in diabetes treatment over the last decade have improved,
management of diabetes in primary care is poor (Guzek, Guzek, Murphy, Gallacher, & Lesneski,
2009; Maeng, Yan, Graf, & Steele, Jr, 2016). The purpose of this paper is to describe the
implementation of a doctorate of nursing practice quality improvement project that introduced a
diabetes mellitus type 2 (DM2) treatment algorithm into primary care for use with adult Hispanic
patients at a community health center in Phoenix, Arizona. This paper will discuss the
intervention design, implementation plan, project outcomes, results, discussion, and implications
of these results for healthcare.
Introduction to the Problem
Background Knowledge
The America Diabetes Association (ADA) and the American Association of
Endocrinologists (AACE) have well-publicized guidelines and algorithms for the treatment of
DM2. The recommendations included are diagnostic and therapeutic actions that are known or
believed to favorably affect health outcomes of patients with diabetes (ADA, 2016). These two
organizations recommend lifestyle therapy including medically supervised weight loss. Weights
should be recorded at every patient visit. The ADA recommends every patient with DM2 meet
with a registered dietician for medical nutrition therapy (MNT). Further recommendations
include an annual A1C evaluation with a goal of < 6.5 % for patients without concurrent serious
illness and at low hypoglycemic risk and > 6.5 % for patients with concurrent serious illness or
high risk for hypoglycemia (AACE, 2017). If a patient is at goal, then an A1C should be
performed and documented twice yearly. Patients who are not at goal or who have had
IMPLEMENTATION OF A DIABETES TREATMENT ALGORITHM
6
medication adjustments should have A1C performed quarterly (ADA, 2016). Medications should
be added or titrated every three months until the patient has met an A1C goal. Foot exams should
be performed annually, as well as, annual documentation of a fasting lipid panel, microalbumin,
and glomerular filtration rate (GFR). Blood pressure should be controlled with a systolic goal of
< 140mmHg and a diastolic goal of < 90mmHg. The addition of and angiotensin-converting-
enzyme inhibitor (ACEI) or an angiotensin II receptor blocker (ARB) is recommended if goals
are not met. In patients less than 40 years old with no cardiovascular disease (CVD) risk, no
statin therapy is indicated. However, the ADA (2015) recommends statin therapy for all patients
with diabetes age 40 and older regardless of CVD risk. Similarly, aspirin therapy is only
recommended for diabetic patients with increased CVD risk which is usually diabetic patients
over age 50 with CVD, hypertension, and/or dyslipidemia (ADA, 2015).
Significance
Diabetes Mellitus type 2 (DM2) has increased exponentially over recent years with over
29 million Americans living with DM2 (CDC, 2014). Diabetes Mellitus is especially common
among the Hispanic population affecting nearly 13 % of all Hispanic Americans compared to
only 7.6 % of non-Hispanic Whites (Centers for Disease Control and Prevention [CDC], 2014).
Diabetic retinopathy is 84 % higher in Hispanic Americans versus Caucasian Americans, and
end-stage renal disease is 41 % higher among this ethnic minority than their Caucasian
counterparts (Congdon, Eldridge, & Truong, 2013). Moreover, Hispanic Americans have limited
access to healthcare, increased difficulty controlling symptoms of diabetes, more frequent
emergency room visits and hospitalizations, and a higher incidence of diabetes-related
complications (Glazier, Bacjar, Kennie, & Willson, 2006; Welch et al., 2011). Many patient-
level factors may influence the Hispanic population from receiving DM care such as economic

IMPLEMENTATION OF A DIABETES TREATMENT ALGORITHM
7
barriers, work/life demands, low literacy, and cultural and social traditions (Welch, et al., 2011).
This topic is especially important as the number of Hispanic Americans in the United States is
expected to reach 25 % of the population by 2050 (McKinlay, Piccolo, & Marceau, 2012).
The majority of diabetes morbidity and mortality is due to cardiovascular, and
microvascular complications and studies have shown that tighter glucose control does reduce
these risks (Welch et al., 2011). The use of a set of standardized clinical practice algorithms
provides structure and consistency in clinical decision making and diabetes treatment plans
(Welch et al., 2011). The Institute of Medicine (IOM) (2001) supports system redesign to
improve chronic disease management through the use of evidence-based practice treatment
guidelines through carefully designed decision support algorithms.
The Clinical Problem and Project Purpose
Although advances in diabetes treatment and medications have improved, it is widely
recognized that diabetes management by primary care providers is substandard and unwarranted
variation in diabetes care remains (Guzek et al., 2009; Maeng, Yan, Graf, & Steele, Jr, 2016).
The problem is that although guidelines for the management of DM2 are well publicized,
implementation practices are limited and need further improvement. Gaps exist between the
national evidence-based recommendations and current clinical practice. This reflects a lack of
clinical systems and practice tools to support clinician decision-making, communication, and
collaboration (Welch et al., 2011). Improvements in the treatment of diabetes require a change in
the care system. An institutional priority in most successful care systems is providing a high
quality of care. Changes that have been shown to increase the quality of diabetes care include
basing care on evidence-based guidelines; expanding the role of teams to implement more
intensive disease management strategies; redesigning the care process; and implementing

IMPLEMENTATION OF A DIABETES TREATMENT ALGORITHM
8
electronic health record tools (ADA, 2016). Through informal interviews, direct observation, and
chart audit, it was noted that no standardized treatment algorithm or electronic health record tool
is utilized in the chosen practice setting to improve the quality of DM care in Hispanic diabetics.
Thus, the purpose of this project is to improve documentation and guideline adherence through a
systems change by implementing a DM treatment algorithm to be utilized by the PCP when
treating Hispanic adults with DM2. This electronic health record tool will serve to base care on
evidence-based guidelines.
Clinical Question
Does implementation of a diabetes treatment algorithm by the primary care provider
improve adherence to treatment guidelines and improve documentation in the care of Hispanic
adults?
Comprehensive Review of the Literature
Define the Search
An exhaustive search of the literature was performed using CINAHL Complete, Medline
(Ovid), Cochrane Library, and Google Scholar (including Grey literature) to identify
interventions to improve glycated A1C in the Hispanic population. Search strategies differed
slightly by database. Keyword combinations include algorithm, treatment algorithm, diabetes
management, A1C, Hispanic, and primary care. Articles were selected for review based on if the
title, abstract, or text contained any of the keywords or combinations of the keywords. After
initial keywords and combinations had yielded results, limiters were applied to all searches that
included publishing dates of 2011-2016 and English language.
Databases
IMPLEMENTATION OF A DIABETES TREATMENT ALGORITHM
9
CINAHL Complete yielded 29,619 initial results when algorithm alone was searched.
Combinations of the keywords A1C then Hispanic generated 209 and 12 results respectively.
The limiters of dates, text, and language were applied yielding zero results. The limiters were
removed resulting in 12 results of which one article was retained because of its usage of an
algorithm to treat chronic disease. With key words of treatment algorithms producing 6,447
articles then combined with diabetes (416) and improved outcomes (30). After limiters had been
applied two results were returned, one of which was retained. A1C was searched alone (10,597)
and combined with disease management (695) and primary care (169) and after limits applied
produced 17 results one of which was kept. Keyword of clinical decision tool was searched
(5780) then combined with chronic disease (196) and after limits applied produced 43 results one
of which was retained. In Medline (Ovid), key words produced 194,188 results and when
combined with the same keywords returned between 3 and 53 results. After limits had been
applied, no results were found. Limiters were removed again, but this yield did not reveal any
applicable articles; thus, no literature was retained from this search.
Web-based searches
The search of Cochrane Library delivered 5,823 initial results on algorithms alone,
combined with diabetic management (295), A1C (35), and Hispanic (20). The limits were
applied, but added trials resulted in 64 results of which four studies were kept. Google Scholar
had an initial yield of 2,710,000 based on treatment algorithms, combined with diabetes
(147,000) and combined with Hispanic (19,900). Full-text and date limits applied returned
14,400 results. This number was further reduced by combining with primary care and improved
outcomes to yield 2,780 results. Nine articles were retained from the complete Google Scholar
search as these articles directly related to the use of treatment algorithms in a primary care

IMPLEMENTATION OF A DIABETES TREATMENT ALGORITHM
10
setting to improve outcomes in the Hispanic population. After completion of the literature
search, ten articles were reviewed and retained based on content and strength of the evidence.
Level and strength of evidence
The level of evidence and strength of the research varied significantly. Of the research
retained, six results were randomized control trials (RCT), level II evidence. Other studies varied
from meta-analysis to expert committee reports, to level III controlled trials without
randomization. Also, systematic reviews of RCTs (Level I) were obtained as well as descriptive
data (Level VI), qualitative (Level VI), and implementation studies. The systematic reviews that
were kept detailed interventions to improve diabetes and management of chronic conditions
including the use of algorithms in disadvantaged populations (Glazier, 2006; Shaw, 2014).
Literature Review
Several studies were retained and will be used to guide and support the implementation of
a treatment algorithm in the primary care setting in the Hispanic diabetic patient (see Appendix
A for evaluation table). Multiple authors used various interventions to improve diabetes
outcomes, but the common theme among the studies is the use of a treatment algorithm. Three
out of the ten studies incorporated cultural tailoring aspects to the intervention. These studies
employed bilingual clinic support staff, diabetes education materials printed in Spanish, and
culturally tailored diet plans which improved patient outcomes and overcame barriers that often
prevent cultural minorities from receiving healthcare (Fanning, Selwyn, Larme, & DeFronzo,
2004; Glazier et al., 2006; Guzek et al., 2009; Welch et al., 2011). The majority of the studies
provided individualized care plans that incorporated diabetes education. Six of the ten studies
placed emphasis on behavioral modifications that included exercise, diet modifications, self-
blood glucose monitoring, and formulation of care goals which improved LDL, A1C, and

IMPLEMENTATION OF A DIABETES TREATMENT ALGORITHM
11
systolic blood pressure (BP) in study subjects. This individualized care is more successful than
group treatments or education alone for reaching DM goals (Allen et al., 2011; Welch et al.,
2011).
Outcome measures varied across the studies; however, all but one study measured
glycated A1C as a primary outcome. Out of the nine studies that did measure A1C, all showed
improvement after the intervention. This is important as intensive glucose control reduces
microvascular risks associated with DM (Rothman et al., 2005) Other outcome measures
included blood pressure, lipids, fasting blood sugar, body mass index (BMI) or weight, treatment
adherence, documented eye and foot exams, aspirin use, and diabetes knowledge. In a systematic
review by Glazier et al. (2006), 17 randomized-controlled trials (RCTs), controlled trials, and
before-and-after studies were reviewed to assess interventions aimed at improving diabetic
outcomes in socially disadvantaged populations. The use of a treatment algorithm was identified
in six of the 17 studies and was successful in reducing A1C in all six studies (p<0.0001). A
similar RCT in adult Hispanic patients with poorly controlled DM2 utilized a nurse-led
comprehensive diabetes management program (CDMP) which followed a clinical decision-
making algorithm to meet evidence-based guidelines in DM care. The results did show
improvements in A1C, blood pressure control, and annual eye screening goals but showed no
difference in the initiation of aspirin therapy (Welch et al., 2011).
Few studies provided a thorough explanation of the components of the algorithms. Of
those that did, components included dietary and exercise consults, medication reviews,
documented eye and foot exams, and medication initiation and titration (Mader et al., 2014).
Allen et al. (2011) included a detailed treatment algorithm for diabetes, as well as, for
cardiovascular disease prevention, and blood pressure management. In this study, 525 patients

IMPLEMENTATION OF A DIABETES TREATMENT ALGORITHM
12
with CV disease, DM2, hyperlipidemia, or hypertension were assigned to control or intervention
that was delivered by an NP/CHW team using treat-to-target algorithms. The intervention group
has improved LDL (p< 0.0001), improved systolic BP (p= 0.018), and Improved A1C (p=
0.016). One algorithm simply focused on preventing complications of DM by ensuring that
preventive care such as diabetic foot exams and eye exams were completed annually (see
Appendix B for synthesis tables) (Guzek et al., 2009).
Each of the studies employed various healthcare providers or a combination of providers
to deliver the intervention. Eight of the ten studies utilized a registered nurse (RN) who had
received additional DM training to incorporate the intervention. However, only two of these
eight studies allowed the RN to function independently (Ishani et al., 2011; Shaw et al., 2014).
The remaining studies integrated the intervention through a collaborative model that included a
clinical pharmacist, an advanced practice nurse, a physician, or a combination of these providers.
Two studies utilized a lay community health worker who received thorough DM training and a
nurse or advanced practice nurse team to deliver the intervention. This combination utilized
individualized treatment regimens based on treat-to-target algorithms to improve DM outcomes
and improve perceptions of illness (Allen et al., 2011; Glazier et al., 2006). Settings of the
interventions varied as did the patient population. Of the ten studies, only three focused primarily
on the Hispanic culture (Congdon et al., 2013; Fanning et al., 2004; Welch et al., 2011) whereas
the remaining studies included African Americans, Caucasian Americans, Native Americans,
Asian Americans, and recent immigrants. The studies focused on low income, low literacy
populations where interventions were tailored to specific population needs. Settings varied from
both urban and rural medical centers, primary care settings, and community health centers which
were the main focus of most studies. The studies varied in the components of the algorithms, the

IMPLEMENTATION OF A DIABETES TREATMENT ALGORITHM
13
measured outcomes, the provider who delivers the intervention and the settings. The themes are
consistent in the use of an algorithm, no matter the setting, the population, or the interventionist,
is useful in achieving desired outcomes specifically improved glycated A1C. Identified gaps in
the literature included the fact that many of the studies utilized multiple components to the
algorithm making it difficult to determine the exact cause of the result. An additional gap is
understanding why implementing treatment guidelines into practice is seldom performed.
Further studies examined provider adherence to guidelines and clinical tools to improve
guideline adherence and diabetes care. Diab, Johnson, and Hudson (2012) aimed to design and
apply a medication assessment tool (MAT) to determine the level of adherence to internationally
recognized guideline recommendations in the treatment of DM2. A 38-criteria MAT was created
and utilized to audit charts of 305 patients and found that 68.1 % of charts adhered to guidelines
on applicable criteria. The MAT was also able to identify some areas which lacked appropriate
documentation of clinical information in patients’ records (Diab et al., 2012). In a similar study
by Muzaffar, Fatima, Fawwad, and Riaz (2013), a retrospective chart review of patients with
DM2 was conducted on 691 patients to evaluate evidence of documentation of testing and
treatment. Deficiencies were observed in most areas of diabetes care. HbA1c and lipid profile
were noted in 44.57% and 40.08% of the patients respectively. Foot exams were documented in
44 % of patients’ records, while 30.53 % had funduscopic eye exams noted. Study findings
showed that most of the medical records of patients were inadequately filled, lacked proper
documentation, and adherence to ADA guidelines was suboptimal (Muzaffar et al., 2013). A
study by Pruthu et al. (2015) performed retrospective chart audits of 156 patients with DM2.
Care processes were considered optimal went patients had undergone BP measurement at every
visit, blood sugars documented monthly or every three months based on medication treatment,

IMPLEMENTATION OF A DIABETES TREATMENT ALGORITHM
14
lipid and renal profiles every six months, annual eye exams, and annual electrocardiographic
monitoring. After these care processes were audited and notated as poor, the practicing providers
were made aware of these results and given an orientation to the current standard practicing
guidelines. One year later the chart audit was repeated which showed an improvement in BP
measurement by 35 %, blood glucose monitoring by 20 %, lipid profiles by 36 %, and renal
profiles by 56 %. The results did show an improvement in guideline adherence through
utilization of a clinical audit cycle tool (Pruthu et al., 2015). These research studies support the
methods of this project in examining the providers’ roles in guideline adherence.
Conceptual and Theoretical Frameworks
The literature review studies included concepts of different theories and models to
design and execute a project. For the development of the project idea of implementing
algorithms to improve diabetes care among Hispanic patients Lewin’s change theory model will
be applied (see Appendix C). Kurt Lewin’s change theory has three major forces that include
driving forces, restraining forces, and equilibrium (Butts & Rich, 2015). His theory includes
three steps for unfreezing, moving, and refreezing. Unfreezing means unlearning old behaviors
that were ineffective. The moving stage is where the change process of new thoughts, behaviors,
or actions occur. Then the refreezing stage establishes the change as a new habit and equilibrium
is restored (Butts & Rich, 2015). To successfully institute and utilize a treatment algorithm to
manage diabetes in Hispanic patients in a primary care setting, providers and staff must unlearn
past behaviors. This means prior treatments that followed no guidelines should be unlearned so
that new change can take place. Providers must unfreeze the status quo of misaligned practices
with national guideline standards. Then movement towards change is in the form of a

IMPLEMENTATION OF A DIABETES TREATMENT ALGORITHM
15
standardized DM treatment algorithm. Once the algorithm is implemented, it must be used every
visit on every patient. Then this change should be refrozen as the new way of practice.
Project Implementation and Methodology
The DNP project was determined to be exempt after review by the institutional review
board (IRB) at Northern Arizona University (See Appendix D). With approval from the clinical
site (see Appendix E), the implementation of the DM treatment algorithm took place in a
community health center (CHC) in Phoenix that provides primary care to the underserved and
underprivileged. It was here that observations were made that no clinical tool was utilized to
promote guideline adherence in the treatment of DM among vulnerable populations such as
Hispanic patients. Internal evidence shows 72 % of patients at this clinic identify as
Hispanic/Latino. Thus, the idea to implement a DM treatment algorithm to utilize during visits
with Hispanic patients was formed.
The algorithm was created through collaboration with provider champions based on ADA
guidelines with categories for annual foot exam and eye exam, referrals to integrated services
such as a clinical pharmacist (CP), behavioral health consultant (BH), and a registered dietician
(RD), laboratory values, medications, and BP and weight measurements (see Appendix F). For
the purpose of this algorithm, the criteria includes: foot exam documented once yearly, A1C
documented twice per year if at goal and every three months if not at goal, lipid panel,
microalbumin, and GFR once yearly, statin therapy if the patient is at increased CVD risk and/or
LDL > 100 mg/dL, aspirin therapy if the patient is at increased CVD risk, > 50 years old, has
hypertension, is a smoker, or has dyslipidemia, use of an ACEI or an ARB if the patient has
hypertension defined as systolic BP > 140 or diastolic > 90 mmHg or microalbuminuria. Per
ADA guidelines and for measurement criteria for this project, diabetes medications should be

IMPLEMENTATION OF A DIABETES TREATMENT ALGORITHM
16
added or titrated every three months until the patient is at goal A1C (ADA, 2016). Weight should
be documented at every patient visit and patients with a body mass index (BMI) greater than 25
% require referral to an RD. In collaboration with the electronic health record (EHR) champions,
the algorithm was placed into the EHR and accessed through the patients’ charts. This algorithm
is easily accessible to providers with expected outcomes of use to include improved adherence to
national guidelines, decreased variability in treatment, and improved provider documentation. A
convenience sampling of four family practice providers within the health clinic was utilized.
The participants include two Medical Doctors (MD), one Doctor of Osteopathic Medicine (DO),
and one Family Nurse Practitioner (FNP). Inclusion criteria are providers who specialize in
family practice, who treat adult patients, and who are full-time employees. As the focus of this
project is on evaluation of the algorithm in Hispanic diabetic patients, audits were performed on
charts that met the conditions of Hispanic adults 18 years of age or older with a diagnosis of
diabetes type 2 (DM2). Prior to implementation, the participating providers were educated on the
use of the algorithm through a PowerPoint presentation. No additional costs were incurred for
project implementation as the algorithm utilization is done at regular patient visits during regular
business hours. The creation of the algorithm and its addition to the EMR incurred no cost. The
training on the use of the algorithm occurred at a regularly scheduled provider meeting, and any
additional, individual assistance or training took place throughout the work day. Thus, any
indirect costs were absorbed by the project site.
The clinical site supported this project in its entirety as the agency fosters an environment
of learning and practices evidence-based care. Additional support came from the stakeholders
and the medical director of the organization. Resources included an established EHR with the
capabilities of adding an algorithm, willing participants, and support staff. Barriers to the project

IMPLEMENTATION OF A DIABETES TREATMENT ALGORITHM
17
involved time constraints as providers generally see 20 to 26 patients per day and an additional
step in care can seem inconvenient to a busy provider. Also, providers are often resistant to
change which can be challenging to overcome.
A chart audit tool was created to organize collected data (see Appendix G). The chart
audit form contains the DM ICD-10 code, documentation of an annual foot exam, bi-annual
A1C, A1C number, annual lipid panel, microalbumin, and glomerular filtration rate (GFR),
documentation of statin, aspirin, and ACEI/ARB use if indicated, titration of medications,
documented weight at each visit, and weight management. The chart audit form received face
validity from practicing providers. The data collection measures are based on the American
Diabetes Association (ADA) standards of care guidelines (2016) to assess appropriate care in
diabetes management.
The treatment algorithm was implemented into practice on December 23, 2016. The data
was collected over a 30-day period following implementation of the clinical decision support
tool to promote system change. Qualified patient data was pulled from the electronic algorithm
and input into the chart audit tool and answered as yes, no, not applicable, or with a number
value. The timeline of the entire project from initiation, planning, and implementation to
completion took place from the fall of 2015 to spring of 2017 (see Appendix H).
Evaluation and Data Analysis
A total of 885 patient charts were reviewed, 87 of which met criteria. The Hispanic
descent was determined by patient self-identification in the patient demographics section of the
chart. The data collected from these 87 charts were input in the audit form then uploaded into the
statistical package for the social sciences (SPSS) version 24 software. Descriptive statistics were
used to describe the provider sample (see Appendix I). Frequency distributions were examined

IMPLEMENTATION OF A DIABETES TREATMENT ALGORITHM
18
for each category of the chart audit form to measure usage of the tool and appropriate care and
documentation per guidelines. Frequencies were determined for each criterion, and then a
percentage score was calculated. A mean A1C was calculated, and average patient age was
reported. This evaluation plan was appropriate for the project as it is an outcome-based
evaluation of a system change process, which includes a retrospective chart audit to measure
usage of the algorithm tool and adherence to treatment guidelines.
Results
The mean patient age of the 87 audited charts was 54.8. Of the 87 charts audited, 86 (98.9
%) contained a documented A1C in the treatment algorithm with a mean A1C of 7.6 %. Thirty
(34.5 %) charts documented an annual foot exam. Lipid panels were documented in 67 (77 %) of
the 87 charts, microalbumin values were documented in 31 charts (35.6 %), and GFR was
documented in 44 (50.6 %) charts within the treatment algorithm. Documented use of a statin
was noted in 61 (70.1 %) of the 87 charts, 8 (9.2 %) did not document a statin when it was
appropriate, and 18 (20.7 %) charts were not applicable for statin use. Appropriate use of aspirin
therapy was documented in 50 charts (57.5 %), 15 (17.2 %) charts did not accurately document
aspirin use, and aspirin use was not indicated in 22 charts (25.3 %). ACEI/ARB use was properly
documented in 63 (72.4 %) of reviewed charts, 5 (5.7 %) charts had no documentation of
ACEI/ARB use when it was indicated, and 19 (21.8 %) had no indication for the use of an
ACEI/ARB. Addition of or titration of diabetic medications was documented in the algorithm of
33 (37.9 %) reviewed charts, 10 (11.5 %) charts did not document additions or adjustments of
medication when it was appropriate based on guidelines, and 44 (50.6 %) charts had no
indication for medication changes. Patient weight was documented in the algorithm in 85 (97.7
%) of the 87 audited charts, but only 11 charts documented a referral to the registered dietician

IMPLEMENTATION OF A DIABETES TREATMENT ALGORITHM
19
(RD) for weight management. Seventy-four percent should have had weight management
counseling while another 12.6 percent did not meet criteria that required weight management
counseling. Counts and percentages are shown in Appendix J.
Discussion, Recommendations, and Conclusion
All 87 charts utilized the treatment algorithm to some degree. Compliance was highest
among A1C documentation and lipid panels, weight measurements, and statin and ACEI/ARB
therapies. Documentation of GFR and aspirin therapy were seen in about half of audited charts.
Adherence to recommended annual foot exams, documented microalbumin, and addition or
titration of DM medications fell well below 50 %. Weight management through an RD referral
was the worst measurement in guideline adherence with only 11 out of 87 patients referred to a
dietician. Following the completion of this project, it is evident that adherence to the
recommended standards of care is suboptimal in this practice setting. The ADA recommends
these screenings and therapies for all diabetic patients, however, an analysis by researchers at the
CDC suggest that < 5 % of diabetic patients receive care that conforms to the ADA guidelines
(CDC, 2015). Although, patient reports from the state of Arizona found that 72.5 % of surveyed
patients reported receiving an annual foot exam and 67.3 % reported having their A1C checked
at least twice per year (CDC, 2015).
This algorithm serves to align with the recommended treatments for DM and to follow
the algorithm will improve guideline adherence, thus improving care delivered to diabetic
patients. The project goals align with goals established by Healthy People 2020 to decrease the
burden of DM through redesign of healthcare systems and delivery (Office of Disease Prevention
and Health Promotion, 2017). The project is sustainable as the algorithm is a practice change that
is easy to comply with through the use of the EHR. This projected change will impact the local
IMPLEMENTATION OF A DIABETES TREATMENT ALGORITHM
20
community by improving diabetes management within the Hispanic population, thereby reducing
complications of the disease, hospitalizations, and healthcare costs. This improvement may also
increase patient satisfaction thereby improving the reputation of the facility which may increase
the patient panel. The community health center will further benefit by achieving improved
quality measures, supporting patient-centered medical home concepts, and increase revenue
through pay for performance initiatives. Recommendations for this practice change will be
implemented within all five offices of the community health center in the Phoenix area and
expand to include all diabetic patients thus, providing high quality, efficient, and cost-effective
care to more patients. The algorithm serves the provider as an easy reminder of recommended
therapies and screenings. Future studies should include measurement of patient outcomes such as
A1C and follow-up chart audit in the future could prove useful. The addition of a post-
implementation provider satisfaction survey is a recommended consideration that may provide
valuable information into the tool and provide a guide for future improvements.
Several limitations were recognized during this project with key lessons identified. First,
it was discovered that some of the criteria could be found in the patient note, but this data was
not carried over to the algorithm. In most cases, this was likely a glitch in the EHR. At times, this
was human error as it was noted that some patients actually were referred to or seen by an RD
but the provider neglected to input this into the algorithm. Occasionally, patient compliance or
adherence was noted as a problem. For example, when searching through a patient record, lipid
panels, microalbumin, and GFR may have been ordered, but the patient did not complete the
tests. Therefore, the information was not transferred to the algorithm. Finally, some patients were
new to the practice or newly diagnosed diabetics. Hence, past results were not available, and
medications could not be titrated. Some key lessons learned included use of previously

IMPLEMENTATION OF A DIABETES TREATMENT ALGORITHM
21
established patients with a diagnosis of DM II for greater than one year would have better served
this project. But most importantly, the success of this practice change is dependent on providers’
acceptance of a practice change, understanding of collaboration, and willingness to work towards
common goals.
In conclusion, a diabetic treatment algorithm is a simple tool to promote practice change
to improve adherence to diabetic treatment recommendations which, in turn, improves patient
outcomes. As the majority of individuals with diabetes in the U.S. receive care for the condition
from primary care physicians (CDC, 2015) it is important that providers are given tools such as
an EHR DM treatment algorithm to guide care, minimize variability, and adhere to national
guidelines. During their lifetimes, half of all Hispanic people will develop DMII (CDC, 2015)
making the need for quality DM care imperative among this population. The goal of this practice
change project was to improve documentation and guideline adherence through a systems change
by implementing a DM treatment algorithm to be utilized by the PCP when treating Hispanic
adults with DM2. This process must be sustained and improved upon to close the gap between
the national evidence-based recommendations and current clinical practice.

IMPLEMENTATION OF A DIABETES TREATMENT ALGORITHM
22
References
Allen, J., Dennison-Himmelfarb, C., Szanton, S., Bone, L., Hill, M., Levine, D.,…& Anderson,
K. (2011). A randomized, controlled trial of nurse practitioner/community health worker
cardiovascular disease risk reduction in urban community health centers. Circulation-
Cardiovascular Quality Outcomes, 4, 595-602. doi:10.1161/961573
American Association of Clinical Endocrinologists (AACE). (2017). Consensus statement by the
American Association of Clinical Endocrinologists and American College of
Endocrinology on the comprehensive type 2 diabetes management algorithm-2017
executive summary. Retrieved from https://www.aace.com/sites/all/files/diabetes-
algorithm-executive-summary.pdf
American Diabetes Association (ADA). (2016). American Diabetes Association standards of
medical care in diabetes-2016. Retrieved from
http://care.diabetesjournals.org/content/suppl/2015/12/21/39.Supplement_1.DC2/2016-
Standards-of-Care.pdf
Butts, J., & Rich, K. (2015). Philosophies and theories for advanced nursing practice (2nd ed.).
Burlington, MA: Jones & Bartlett.
Center for Disease Control and Prevention (CDC). (2014). National diabetes statistics report,
2014: Estimates of its burden in the United States. Retrieved from
http://www.cdc.gov/diabetes/pubs/statsreport14/national-diabetes-report-web.pdf
Congdon, C., Eldridge, B., & Truong, T. (2013). Development and implementation of a
navigator-facilitated care coordination algorithm to improve clinical outcomes of
underserved Latino patients with uncontrolled diabetes. Journal of Health Care for the
Poor and Underserved, 24, 1604-1613. doi:10.1353/hpu.2013.0181

IMPLEMENTATION OF A DIABETES TREATMENT ALGORITHM
23
Cummings, S., Bridgman, T., & Brown, K. (2016). Unfreezing change as three steps: Rethinking
Kurt Lewin’s legacy for change management. Human Relations, 69, 33-60. doi:
10.1177/0018726715577707
Fanning, E., Selwyn, B., Larme, A., & DeFronzo, R. (2004). Improving efficacy of diabetes
Diab, M., Johnson, B., & Hudson, S. (2013). Adherence to clinical guidelines in management of
diabetes. International Journal of Clinical Pharmacy, 35, 101-112. doi:10.1007/s11096-
012-9714-3
Fanning, E., Selwyn, B., Larme, A., & DeFronzo, R. (2004). Improving efficacy of diabetes
management using treatment algorithms in a mainly Hispanic population. Diabetes Care,
27(7), 1638-1646. doi:10.2337/diacare.27.7.1638
Glazier, R., Bacjar, J., Kennie, N., & Willson, K. (2006). A systematic review of interventions to
improve diabetes care in socially disadvantaged populations. Diabetes Care, 29(7), 1675-
1688. doi:10.2337/dc05-1942
Guzek, J., Guzek, A., Murphy, K., Gallacher, P., & Lesneski, C. (2009). Improving diabetes care
using a multitiered quality improvement model. American Journal of Medical Quality,
24(6), 505-511. doi:10.1177/1062860609346348
Institute of Medicine (IOM). (2001). Crossing the quality chasm: A new health system for the
21st century. Retrieved from
http://www.nationalacademies.org/hmd/Reports/2001/Crossing-the-Quality-Chasm-A-
New-Health-System-for-the-21st-Century.aspx
Ishani, A., Greer, N., Taylor, B., Kubes, L., Cole, P., Atwood, M.... & Ercan-Fang, N. (2011).
Effect of nurse case management compared with usual care on controlling cardiovascular

IMPLEMENTATION OF A DIABETES TREATMENT ALGORITHM
24
risk factors in patients with diabetes. Diabetes Care, 34, 1689-1694. doi:10.2337/dc10-
2121
Mader, J., Neubauer, K., Schaupp, L., Augustin, T., Beck, P., Spat, S.... & Plank, J. (2014).
Efficacy, usability and sequence of operations of a work-flow integrated algorithm for
basal-bolus insulin therapy in hospitalized type 2 diabetes patients. Diabetes, Obesity,
and Metabolism, 16, 137-146. doi:10.1111/dom.12186
Maeng, D., Yan, X., Graf, T., & Steele, Jr, G. (2016). Value of Primary Care Diabetes
Management: Long-term Cost Impacts. The American Journal of Managed Care, 22(3),
e88-e94. Retrieved from
http://www.chartis.com/resources/files/AJMC_03_2016_Maeng-final_Graf.pdf
McKinlay, J., Piccolo, R., & Marceau, L. (2012). An additional cause of health care disparities:
The variable clinical decisions of primary care doctors. Journal of Evaluation in Clinical
Practice, 19, 664-673. doi:10.1111/jep.12015
Muzaffar, F., Fatima, N., Fawwad, A., & Riaz, M. (2013). Adherence of healthcare professionals
to American Diabetes Association 2004 guidelines for the care of patients with type 2
diabetes at peripheral diabetes clinics in Karachi, Pakistan. Pakistan Journal of Medical
Sciences, 29(2), 474-478. doi:http://dx.doi.org/10.12669/pjms.292.3149
Office of Disease Prevention and Health Promotion. (2017). Diabetes. Retrieved from
https://www.healthypeople.gov/2020/topics-objectives/topic/diabetes
Pruthu, T. K., Majella, M. G., Nair, D., Ramaswamy, G., Palanivel, C., Subitha, L., Ganesh
Kumar, S., & Sekhar Kar, S. (2015). Does audit improve diabetes care in a primary care
setting? A management tool to address health system gaps. Journal of Natural Science,
Biology and Medicine, 6(1), s58-s62. doi:10.4103/0976-9668.166087
IMPLEMENTATION OF A DIABETES TREATMENT ALGORITHM
25
Rothman, R., Malone, R., Bryant, B., Shintani, A., Crigler, B., Dewalt, D.,… & Pignone, M.
(2005). A randomized trial of a primary care-based disease management program to
improve cardiovascular risk factors and glycated hemoglobin levels in patients with
diabetes. The American Journal of Medicine, 118, 276-284.
doi:10.1016/j.amjmed.2004.09.017
Shaw, R., McDuffie, J., Hendrix, C., Edie, A., Lindsey-Davis, L., Nagi, A.,…& Williams Jr, J.
(2014). Effects of nurse-managed protocols in the outpatient management of adults with
chronic conditions. Annals of Internal Medicine, 161(2), 113-121. doi:10.7326/m13-2567
Welch, G., Allen, N., Zagarins, S., Stamp, K., Bursell, S., & Kedziora, R. (2011).
Comprehensive diabetes management program for poorly controlled Hispanic type 2
Patients at a community health center. The Diabetes Educator, 37(5), 680-688.
doi:10.1177/0145721711416257

Running head: IMPLEMENTATION OF A DIABETES TREATMENT
ALGORITHM
26
Appendix A
Evaluation Tables
Table 1
Author and
Title
Conceptual
Framework
Design/Method Sample/
Setting
Major
Variables
Studied
Measurement
of Major
Variables
Data Analysis Study Findings Level &
Quality of Evidence.
Study Strengths and
Weaknesses
1) Glazier, R.,
Bajcar, J.,
Kennie, N., & Willson, K.
(2006)
A systematic
review of interventions to
improve diabetes
care in socially disadvantaged
populations
None stated Health promotion
Behavioral change
model principles implied
Systematic review 17 studies included
10 RCT
5 CS 2 PCS
Inclusion Criteria: 1)Targeted interventions
for disadvantaged adults with DM
2)RCTs, controlled, or
before/after studies with comtemporaneous
control group
3)Includes measures of patient, provider, or
system outcomes
N= 17 n= 3979
A=35-70
G=M/F
R=varies,
AA, MA,NA,
Asian, Cauc,
Ed=
predominantl
y low SES, low literacy,
< 12 grade
ed Settings:
CHC, PC,
Inner city, Rural
IV=
SBGM, diet,
exercise,
scheduled appts,
diagnosis,
prescribing, educational
material, counseling,
referrals,
followed algorithms,
clinical
outcomes
IV2= Control
groups
DV1=
A1C
DV2=
BP
DV3=
Weight
DV4=
BMI
DV5=
Lipids
A1C levels, Serum lipids,
BP, BMI, DM-
related knowledge,
FBG, DRS
(Gary, 2003) PAI, TIPS
(Clancy, et al., 2003) PCAT,
Data analyzed based on 5
categories:
Intervention target,
intervention
design, setting,
delivery of intervention,
intensity and
duration of intervention.
Reviewers
used analytical
approach to
determine statistically
and clinically
significant outcomes
1)Treatment algorithm groups had greater
reduction in A1C
(p<0.0001) 2)Improvement in
activity, nutrition, and
lipids in first 3 months but declined after 6
months 3)No significant change
in BMI
Finding of interest= All
but one study showed
improved A1C level after intervention
Level of Evidence:
Level I
USPSTF grading
schema:
Grade: B
Quality of Evidence: Good
Strengths:
Use of RCTs
Weaknesses:
Multiple components to
interventions cannot clearly identify which
intervention was most
effective; Small number of studies; Heterogeneity;
varying interventions;
short-term duration;
Conclusions:
Identified features of interventions to improve
DM in disadvantaged
populations included culturally tailored
education, one-on-one
intervention, and incorporating treatment
algorithms

IMPLEMENTATION OF A DIABETES TREATMENT ALGORITHM
27
Author and
Title
Conceptual
Framework
Design/Method Sample/
Setting
Major
Variables
Studied
Measurement
of Major
Variables
Data Analysis Study Findings Level &
Quality of Evidence.
Study Strengths and
Weaknesses
2) Shaw, R.,
McDuffie, J.,
Hendrix, C., Edie, A.,
Lindsey-Davis,
L., Nagi, A.... & Williams Jr., J.
(2014)
Effects of nurse-
managed
protocols in the outpatient
management of
adults with chronic
conditions
None stated Chronic care model
principles implied
Systematic review and meta-analysis
16 RCTs 2 Controlled before and
after
Inclusion Criteria:
1)Involvement of RN
functioning beyond usual scope
2)Use of treatment
protocol
N=17 n= 23,004
A= median 53.3 years
G= M/F
R= Not
reported
Ed= Not
reported
Settings:
General medical
hospital, Specialty
hospital, PC
IV=
Nurse led
treatment
protocol Medication
education
Self-management
plan
IV2=
Control group
DV1=
Glucose
DV2=
A1C
DV3=
Lipids
DV4=
BP
DV5=
Behavior
adherence
DV6=
Protocol
adherence
A1C levels, Serum lipids,
BP, Patient
adherence to treatment (scale
not discussed),
Adherence to protocols (scale
not discussed),
Adverse effects (scale not
discussed),
Resource use (scale not
discussed)
A1C measured in %
BP measured
in mmHg Total
cholesterol
measured in mmol/L
1)Nurse-managed protocols decreased A1C
0.4% (95% CI)
2)Decreased systolic BP by 3.68 mmHg (CI, 1.05
to -6.31 mmHg) and
diastolic BP by 1.56 mmHg (CI, 0.36 to 2.76
mmHg)
3)Decreased total cholesterol by 0.24
mmol/L (CI, 0.54
mmol/L decrease to 0.05 mmol/L increase)
4)Improved behavior
adherence (P= 0.03) 5)When compared with
usual care group, nurses followed protocol and
initiated lipid lowering
medication more often and doses of other
medications were titrated
more often 6)Adverse effects
reported in one study of
increase from 1.5% to 2.9 % occurrence of severely
low blood glucose
(P=0.158) 7)Resource use reported
in 3 studies found lower
salary costs and lower medication costs
Level of Evidence:
Level I
USPSTF grading
schema:
Grade: B
Quality of Evidence: Good
Strengths:
Protocol intervention had
consistently positive
effect on chronically ill patients
Duration of study 12
months for 8 studies and <12 months for 8 studies
Weaknesses:
Limited description of
interventions and protocols
Most studies showed
moderate risk of bias Two studies were high
risk for bias due to
inadequate randomization
Conclusion:
This systematic review and meta-analysis found
that use of nurse-
managed treatment protocols may have
positive effects on the
outpatient management of adults with chronic illness
such as DM,
hypertension, and dyslipidemia

IMPLEMENTATION OF A DIABETES TREATMENT ALGORITHM
28
Author and
Title Conceptual
Framework Design/Method Sample/
Setting Major
Variables
Studied
Measurement
of Major
Variables
Data Analysis Study Findings Level &
Quality of Evidence.
Study Strengths and
Weaknesses
3) Ishani, A., Greer,
N., Taylor, B.,
Kubes, L., Cole, P., Atwood, M....
& Ercan-Fang,
N. (2011)
Effect of nurse
case management
compared with
usual care on controlling
cardiovascular
risk factors in patients with
diabetes
None stated Health promotion and
ICCM principles
implied
RCT
Trial of diabetic patients
with BP >140/90, A1C >9.0%, or LDL >100
mg/dl received case
management versus usual care over 1-year
period.
Case management consisted of patient
collaborating with a
nurse who established lifestyle modification,
action plans, and
medication adjustments based on established
protocols.
N= 556
A= Mean
65.4
G= M 98.6%
R=
AA 12.5%
Cauc 93.2% Other 1.6%
Ed= Not reported
Settings: MVAHCS
IV1=
Case
management
N= 278
IV2=
Usual care
N=278
DV1=
BP < 130/80mm/Hg
and LDL < 100
mm/Hg and A1C < 8.0 %
DV2=
% of patients
meeting
individual treatment goals
% of patients meeting DV1.
Results
measured by usual standards
Two-sided Pearson X2
test and
ANOVA
DV1= BP < 130/80mm/Hg and LDL
< 100 mm/Hg and A1C <
8.0 %
IV1= 21.9 % (P= <0.001)
IV2= 10.1 % (P=0.047)
Secondary outcomes: Individual without all 3
above criteria met:
A1C < 8.0 % with baseline > 9.0 % =
IV1= 40.5 %
IV2= 24.6 %
LDL < 100 mg/dL with
baseline LDL > 100mg/dL=
IV1= 40.9 %
IV2= 27.7 %
BP < 130/80 mmHg with
baseline BP >140/90 mmHg=
IV1= 40.6 %
IV2= 15.9 %
Level of Evidence:
Level II
USPSTF grading
schema:
Grade:
Quality of Evidence:
Strengths:
Large sample size with
minimal exclusion criteria
Generalizable
Study detected
differences in achieving 3
CV risk factors as opposed to one which
increased acceptability by
patients
Weaknesses:
Inappropriate randomization of patients
that did not meet criteria
but were later excluded
Multiple components to
interventions cannot clearly identify which
intervention was most
effective
Conclusion:
In patients with diabetes, nurse case managers
using a treatment
algorithm can effectively improve the number of
individuals with control
of A1C, LDL, and BP at 1 year

IMPLEMENTATION OF A DIABETES TREATMENT ALGORITHM
29
Author and
Title Conceptual
Framework Design/Method Sample/
Setting Major
Variables
Studied
Measurement
of Major
Variables
Data Analysis Study Findings Level &
Quality of Evidence.
Study Strengths and
Weaknesses
4)
Mader, J., Neubauer, K.,
Schaupp, L.,
Augustin, T., Beck, P., Spat,
S.... & Plank, J.
(2014)
Efficacy,
usability and sequence of
operations of a
work-flow integrated
algorithm for basal-bolus
insulin therapy
in hospitalized type 2 diabetes
patients
None stated Ward-controlled study
74 DM type 2 patients
were assigned to either
algorithm-based treatment with basal-
bolus insulin therapy or
to standard glycemic management
Aim was to assess the
efficacy, workflow, and usability of an algorithm
in hospitalized patients
with DM type 2
N= 74
A= Mean 68
G= F 24
BMI= 30 +/-
7
R= not
reported
Setting:
Two medical units at
Medical Center in
Austria
IV1=
Algorithm group
N= 37
IV2=
Usual care
N=37
DV1=
BGL
DV2=
Physician adherence to
the algorithm-
calculated TDD
Glycemic
control measured by
point of care
testing four times daily and
continuous
BGL monitoring for
algorithm group
Compliance of
physician
adherence was documented
and any deviation
recorded to
measure noncompliance
Questionnaire completed at
the end of study
to assess efficacy and
usability
One-tailed
matched pairs t-test with 2.5
% level of
significance, power of 80 %
and a
correlation between
paired
measurements (Beginning
and end of
treatment)
Pearson’s chi-squared tests
used to
analyze nominal data
DV1= BGL decreased
from 11.3 mmol/L to 8.2 mmol/L in IV1 group
DV2= 95 % physician adherence to the
algorithm TDD
Level of Evidence:
Level III
USPSTF grading
schema:
Grade:
Quality of Evidence:
Strengths:
High level of staff
adherence
Improved glycemic
control
Weaknesses:
Study lengths varied
dependent on length of hospitalization but all
concluded at 21 days or at
discharge
Not randomized
Conclusion:
The workflow integrated
algorithm for basal-bolus therapy was effective in
attaining glycemic control
and found to be usable and effective by staff
IMPLEMENTATION OF A DIABETES TREATMENT ALGORITHM
30
Author and
Title
Conceptual
Framework Design/Method Sample/
Setting Major
Variables
Studied
Measurement
of Major
Variables
Data Analysis Study Findings Level &
Quality of Evidence.
Study Strengths and
Weaknesses
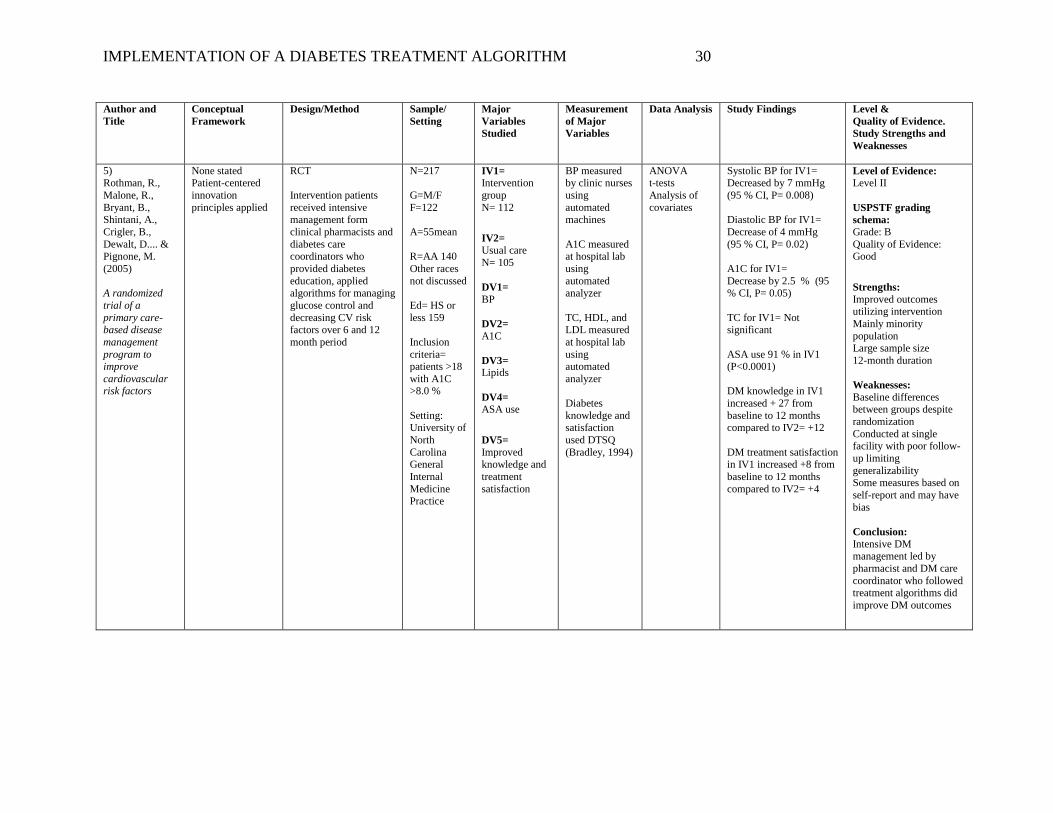
5) Rothman, R.,
Malone, R.,
Bryant, B., Shintani, A.,
Crigler, B.,
Dewalt, D.... & Pignone, M.
(2005)
A randomized
trial of a
primary care-based disease
management
program to improve
cardiovascular risk factors
None stated Patient-centered
innovation
principles applied
RCT
Intervention patients
received intensive management form
clinical pharmacists and
diabetes care coordinators who
provided diabetes
education, applied algorithms for managing
glucose control and
decreasing CV risk factors over 6 and 12
month period
N=217
G=M/F
F=122
A=55mean
R=AA 140
Other races
not discussed
Ed= HS or
less 159
Inclusion
criteria= patients >18
with A1C >8.0 %
Setting: University of
North
Carolina General
Internal
Medicine Practice
IV1=
Intervention
group
N= 112
IV2=
Usual care
N= 105
DV1=
BP
DV2=
A1C
DV3=
Lipids
DV4=
ASA use
DV5=
Improved knowledge and
treatment
satisfaction
BP measured by clinic nurses
using
automated machines
A1C measured at hospital lab
using
automated analyzer
TC, HDL, and LDL measured
at hospital lab
using automated
analyzer
Diabetes
knowledge and satisfaction
used DTSQ
(Bradley, 1994)
ANOVA t-tests
Analysis of
covariates
Systolic BP for IV1= Decreased by 7 mmHg
(95 % CI, P= 0.008)
Diastolic BP for IV1=
Decrease of 4 mmHg
(95 % CI, P= 0.02)
A1C for IV1=
Decrease by 2.5 % (95 % CI, P= 0.05)
TC for IV1= Not significant
ASA use 91 % in IV1 (P<0.0001)
DM knowledge in IV1
increased + 27 from
baseline to 12 months compared to IV2= +12
DM treatment satisfaction in IV1 increased +8 from
baseline to 12 months
compared to IV2= +4
Level of Evidence:
Level II
USPSTF grading
schema:
Grade: B
Quality of Evidence: Good
Strengths:
Improved outcomes utilizing intervention
Mainly minority
population Large sample size
12-month duration
Weaknesses:
Baseline differences between groups despite
randomization
Conducted at single facility with poor follow-
up limiting
generalizability Some measures based on
self-report and may have
bias
Conclusion:
Intensive DM management led by
pharmacist and DM care
coordinator who followed treatment algorithms did
improve DM outcomes

IMPLEMENTATION OF A DIABETES TREATMENT ALGORITHM
31
Author and
Title Conceptual
Framework Design/Method Sample/
Setting Major
Variables
Studied
Measurement
of Major
Variables
Data Analysis Study Findings Level &
Quality of Evidence.
Study Strengths and
Weaknesses
6) Allen, J.,
Dennison-
Himmelfarb, C., Szanton, S.,
Bone, L., Hill,
M., Lewis-Boyer, L.... &
Anderson, K.
(2011)
A randomized,
controlled trial of nurse
practitioner/com
munity health worker
cardiovascular
disease risk reduction in
urban
community health centers
CPBR RCT
525 patients with CV
disease, DM2, hyperlipidemia, or
hypertension were
assigned to control or intervention that was
delivered by an
NP/CHW team using treat-to-target
algorithms
N=525
G=M/F
F=374
A=54 mean
R=AA 417
Non-AA 108
Ed= HS or less 380
Inclusion criteria=
patients >21
with diagnosis of
CVD,
hypertension, or DM2
receiving
therapy
Setting:
Two community
health
centers in Baltimore
IV1=
Intervention
group
N= 261
IV2=
Usual care
N= 264
DV1=
BP
DV2=
A1C
DV3=
Lipids
DV4=
Patient perception of
the quality of
their chronic illness care
BP measured using digital
cuff according
to JNC VII guidelines
A1C measured using high-
pressure liquid
chromatography
Lipids measured at
Johns Hopkins
University lab
PACIC
(Glascow, 2005)used for
DV4
t-test x2 test
IV1 = Improved LDL (75 % versus 58% in IV2,
P=<0.001)
IV1= Improved systolic
BP (82% versus 74 % in
IV2,P= 0.018)
IV1= Improved A1C
(60% versus 47 % in IV2, P= 0.016)
IV1= Improved patients’ assessment of their
chronic illness care
Level of Evidence:
Level II
USPSTF grading
schema:
Grade: B
Quality of Evidence: Good
Strengths:
Improved outcomes utilizing intervention
94 % of participants
completed 1-year assessment
Large sample size
12-month duration
Weaknesses:
Predominately female and
AA lessening
generalizability Conducted in one setting
Physicians had patients in
both groups which may have influenced care in
the non-intervention
group
Conclusion:
Use of treat-to-target algorithms led by
NP/CHW can be effective
to improve risk factors status and perceptions of
illness care in high-risk
patients

IMPLEMENTATION OF A DIABETES TREATMENT ALGORITHM
32
Author and
Title Conceptual
Framework Design/Method Sample/
Setting Major
Variables
Studied
Measurement
of Major
Variables
Data Analysis Study Findings Level &
Quality of Evidence.
Study Strengths and
Weaknesses
7) Welch, G.,
Allen, N.,
Zagarins, S., Stamp, K.,
Bursell, S., &
Kedziora, R. (2011)
Comprehensive diabetes
management
program for poorly
controlled
Hispanic type 2 Patients at a
community
health center
CCM ICCM
RCT
An RCT in adult
Hispanic patients with poorly controlled DM2
utilized a nurse-led
CDMP which followed a clinical decision-
making algorithm to
meet evidence-based guidelines in DM care
(lower A1C, BP, DM
distress, and increase adherence to annual foot
and eye exams and
increase aspirin use)
N= 39
G=M/F
F= 65 %
A= 56 mean
R= MA
Ed= >HS 40.2 %
Inclusion criteria=
Age 30-85
DM2 diagnosis > 1
year
A1C >7.5% Hispanic
ethnicity
Setting:
Urban CHC
in Springfield,
MA
IV1=
Intervention
group (IC)
N= 25
IV2=
Attention
control condition (AC)
N= 21
DV1=
A1C
DV2=
DM Distress
DV3=
Systolic BP
DV4=
Eye screening
DV5=
Foot screening
A1C measurement
method not
discussed
BP measured
with an aneroid BP monitor
after 5-minute
rest period
Eye screening
and use of ASA obtained from
self-report
questionnaire
PAID scale
(Welsh, 1997) used to measure
DM specific
emotional distress
ANOVA Chi-square
Fisher exact
Paired t tests
IV1 = 45 % met goal (A1C <7.0 %) compared
to IV2 28 %
(P=0.27)
IV1= 55 % met BP goal (
<130/80) compared to IV2 28 % (P= 0.09)
IV1= 65 % met criteria for low DM distress
compared to IV2 33 %
(P= 0.05)
IV1= 95 % met annual
eye screening goal compared to IV2 78 %
(P= 0.27)
IV1= 100 % ASA
adherence
IV2= 100 % ASA adherence
Level of Evidence:
Level II
USPSTF grading
schema:
Grade: B
Quality of Evidence: Good
Strengths:
Improved outcomes
utilizing intervention
Use of nurse-led clinical decision-making
algorithm
Included strong cultural sensitivity component
High participation rate of
providers 12-month length of study
Detailed intervention
described
Weaknesses:
Small sample size Possible contamination
the educators from the
intervention group trained and supervised the AC
staff
Conclusion:
Use of the CDMP model
was effective in helping patients meet evidence-
based guidelines for DM
care

IMPLEMENTATION OF A DIABETES TREATMENT ALGORITHM
33
Author and
Title Conceptual
Framework Design/Method Sample/
Setting Major
Variables
Studied
Measurement
of Major
Variables
Data Analysis Study Findings Level &
Quality of Evidence.
Study Strengths and
Weaknesses
8) Fanning, E.,
Selwyn, B.,
Larme, A., & DeFronzo, R.
(2004)
Improving
efficacy of
diabetes management
using treatment
algorithms in a mainly Hispanic
population
Not stated CCM and ICCM
principles implied
Observational group comparison
Treatment intervention for DM2 was
implemented to evaluate
the effectiveness of treatment algorithms
versus standard care in
improving glycemic control and CV risk
factors in low-income,
DM2 MA
Participants divided into
3 groups: CC-TA
UC-TA
CC-SC
N= 358
G=M/F
F= 66 %
A= 46 mean
R= 90 %
MA
Other races not discussed
Ed= average completed
grade level=
9th
Inclusion
criteria= DM
diagnosis
within 1 year Never have
taken insulin,
lipid-lowering or
antihypertens
ive medication,
and no oral
agents used within 6
months
No retinopathy
and normal
serum creatinine
Setting: Three CHC
in San Antonio, TX
IV1=
CC-TA
N=106
IV2=
UC-TA
N= 170
IV3=
CC-SC N= 82
DV1= Primary
outcome:
A1C
DV2=
FBG
DV3=
Lipids
DV4=
Eye screening
DV5=
Foot screening
A1C analyzed by Cobas
Integra Glucose
HK Liquid Diagnostic
Reagent System
Plasma glucose
analyzed by
Glucose Oxidase
Analyzer
TC, HDL, and
triglycerides
analyzed by Cobas Integra
Direct Reagent
System
Eye
screening/Foot screening from
chart review
ANOVA
CC-TA = 49 % of patients achieved A1C of
<7.0 %
Patients with elevated TC, LDL, triglycerides
and reduced HDL= 35 %
Eye and foot exams = 90 %
UC-TA = 51 % of patients achieved A1C of
<7.0 %
Patients with elevated TC, LDL, triglycerides
and reduced HDL= 55 %
Eye and foot exams = 83 %
CC-SC= 26 % of patients achieved A1C of
<7.0 %
Patients with elevated TC, LDL, triglycerides
and reduced HDL= 69 %
Eye and foot exams = 60 %
No statistical significance in systolic BP among all
3 groups
Level of Evidence:
Level IV
USPSTF grading
schema:
Grade: B
Quality of Evidence: Good
Strengths:
Large sample size
Inclusion of detailed
algorithm Barriers to treatment
discussed
Weaknesses:
Not randomized
Non-compliance of patients observed in all 3
groups
Conclusion:
Adherence to treatment
algorithms in newly diagnosed DM2 patients
is more effective to
achieve blood glucose and lipid control than
usual care

IMPLEMENTATION OF A DIABETES TREATMENT ALGORITHM
34
Author and
Title Conceptual
Framework Design/Method Sample/
Setting Major
Variables
Studied
Measurement
of Major
Variables
Data Analysis Study Findings Level &
Quality of Evidence.
Study Strengths and
Weaknesses
9) Guzek, J.,
Guzek, A.,
Murphy, K., Gallacher, P., &
Lesneski, C.
(2009)
Improving
diabetes care using a
multitiered
quality improvement
model
Not stated Process
improvement
principles implied
Quality improvement process study
Objective was to increase annual rate of
recommended tests and
exams for patients with DM and to reduce A1C,
BP, and LDL through
protocol-driven electronic prompts for
clinicians which
included built-in clinical decision tools
N= 1592 No other
patient
characteristics stated
Inclusion criteria:
All active
patients in electronic
database >
18 years old with DM
diagnosis
Setting:
Medium-
sized community
group
practice in WI with 12
clinicians
No control group
Process
improvement implementation
applied to all
included patients
Process measures:
Measurement
of: A1C in prior 6
months
BP in prior 6 months
LDL in prior 12
months HDL in prior
12 months
Triglycerides in prior 12 months
Urinary
microalbumin in prior 12
months
Performance of
eye exam and
foot exam in prior 12 months
Outcomes measures:
Most recent
A1C < 7.0 % BP < 130/80
mmHg
LDL < 100 mg/dL
HDL > 45
mg/dL
12 study indicators;
For each study
indicator, the proportion
corresponded
to the % of DM patients
who met the
target Summary
measure DSI
(Guzek, et al., 2016)
reflected the
average % of the 12 targets
met by
patients
Average DSI at baseline was 61.2 %
After 12 months of utilizing process
improvement methods,
DSI increased to 70.1 % Statistically significant
improvement for 5 of 8
process measures and for 2 outcome measures
Level of Evidence:
Level IV
USPSTF grading
schema:
Grade: C
Quality of Evidence: Fair
Strengths:
12 study indicators
identified with overall
improvement in majority Clinician buy-in
Clinician feedback
provided
Weaknesses:
Not RCT Protocols and built-in
electronic tools not well
described Not generalizable to
clinician groups not fully
functioning with EMR
Conclusion:
Findings support use of built-in protocols and
advanced clinical decision
tools to improve healthcare outcomes with
rapid rates of
improvement noted

IMPLEMENTATION OF A DIABETES TREATMENT ALGORITHM
35
Author and
Title Conceptual
Framework Design/Method Sample/
Setting Major
Variables
Studied
Measurement
of Major
Variables
Data Analysis Study Findings Level &
Quality of Evidence.
Study Strengths and
Weaknesses
10) Congdon, H.,
Eldridge, B., &
Truong, T. (2013)
Development and
implementation
of a navigator-facilitated care
coordination
algorithm to improve clinical
outcomes of
underserved Latino patients
with
uncontrolled diabetes
Not stated BHT and IMB
principles implied
Report on Quality improvement process
study
NAVCOM was created to direct underserved
Hispanic patients with
DM2 into group or individual DSME,
nutrition counseling,
and/or MTM based on specific patient criteria;
integrated into patient
care plan and measured clinical outcomes
N= 58 for referral
services
45 with A1C data
available
32 of 45 were
identified as
Latino other 13 race not
identified
Inclusion
criteria:
Using computerize
d registry,
Latino patients with
A1C >9.0 %
were identified
and were
contacted by phone
according to
the algorithm
Setting:
CHC in Montgomery
County, MD
IV1= NAVCOM
No control
group
Process
improvement implementation
applied to all
included patients
DV1= A1C
Scales to measure A1C
not described
At the time of data
collection,
patients had participated
for up to 6
months
A1C average decreased from 10.6 % to 8.8 %
Level of Evidence:
Level VII
USPSTF grading
schema:
Grade: C
Quality of Evidence: Fair
Strengths:
Supports use of
algorithms to improve
DM care in minority populations
Supports collaboration of
healthcare professionals and multi-dimensional
approach to improve DM
outcomes Identified barriers to care
Algorithm included in
study
Weaknesses:
Not an RCT Data analysis not
described
Small sample size
Conclusion:
Use of NAVCOM demonstrated that patient
navigation combined with
use of a consistent patient algorithm and
interprofessional
collaboration had a positive impact on
clinical outcomes,
specifically A1C, for low-income, uninsured,
primarily Latino patients with DM

IMPLEMENTATION OF A DIABETES TREATMENT ALGORITHM
36
Key:
A= Age, AA= African American, BGL= Blood glucose level, BHT= Behavioral health theory, BP= Blood pressure, CCM= Chronic care model, CBPR=
Community-based participatory research, CC-TA= Community clinic following treatment algorithm, CC-SC= Community clinic following standard care,
CDMP= comprehensive diabetes management program, CHC= Community health center, CS= Comparative Study, CV= Cardiovascular, DRS= dietary risk
score, DSI= Diabetes summary index, DSME= Diabetic self-management education, DTSQ= Diabetes Treatment Satisfaction Questionnaire, EMR= Electronic
medical records, FBG= Fasting blood glucose, G= Gender, HDL= High-density lipoprotein, HS= High school, ICCM= Improved care coordination models,
IM=Internal Medicine, IMB= Information-motivation-behavioral skills model, LDL= Low-density lipoprotein, MA= Mexican American, MTM= Medication
therapy management, MVAHCS= Minneapolis VA Health Care System, NA= Native American, NAVCOM= Navigator-facilitated care coordination algorithm,
PACIC= Patient Assessment of Chronic Illness Care Survey, PAID= Problem areas in diabetes scale, PC= Primary Care, PAI= Physical activity index PCS=
Prospective controlled study, PCAT= Patient Care assessment tool, RCT= Randomized controlled trial, R= Race, Ed= Education, SES= Socioeconomic status,
SBGM= Self blood glucose monitoring, TC= Total cholesterol, TDD= total daily insulin dose, TIPS= Trust in physician scale, UC-TA= University clinic
following treatment algorithm
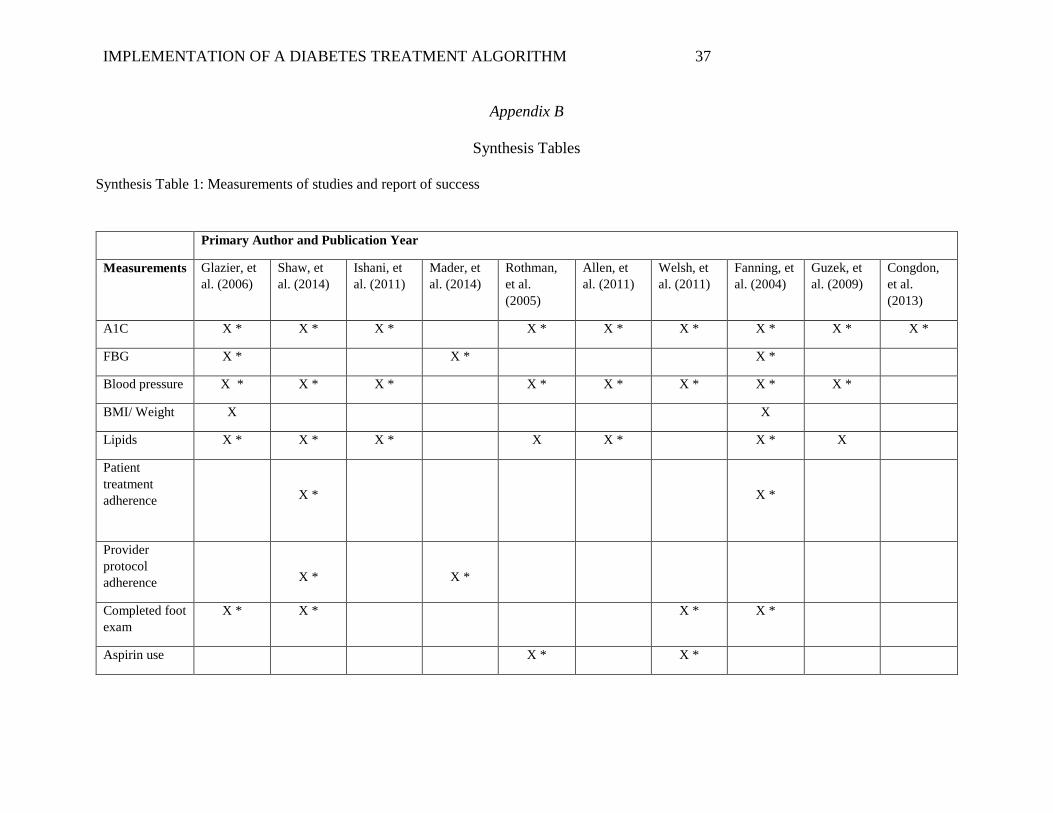
IMPLEMENTATION OF A DIABETES TREATMENT ALGORITHM
37
Appendix B
Synthesis Tables
Synthesis Table 1: Measurements of studies and report of success
Primary Author and Publication Year
Measurements Glazier, et
al. (2006)
Shaw, et
al. (2014)
Ishani, et
al. (2011)
Mader, et
al. (2014)
Rothman,
et al.
(2005)
Allen, et
al. (2011)
Welsh, et
al. (2011)
Fanning, et
al. (2004)
Guzek, et
al. (2009)
Congdon,
et al.
(2013)
A1C X * X * X * X * X * X * X * X * X *
FBG X * X * X *
Blood pressure X * X * X * X * X * X * X * X *
BMI/ Weight X X
Lipids X * X * X * X X * X * X
Patient
treatment
adherence
X *
X *
Provider
protocol
adherence
X *
X *
Completed foot
exam
X * X * X * X *
Aspirin use X * X *

IMPLEMENTATION OF A DIABETES TREATMENT ALGORITHM
38
Completed eye
exam
X * X * X * X *
Diabetes-
related
knowledge
X *
X *
X *
Key: * indicates success in measured outcome after intervention

IMPLEMENTATION OF A DIABETES TREATMENT ALGORITHM
39
Synthesis Table 2: Components of Algorithms
Primary Author and Publication Year
Components of
Algorithm
Ishani, et al.
(2011)
Mader, et al.
(2014)
Rothman, et al.
(2005)
Allen, et al.
(2011)
Welsh, et al.
(2011)
Fanning, et al.
(2004)
Guzek, et al.
(2009)
Congdon, et al.
(2013)
Diet consult X X X X X
Exercise consult X X X
Review
medications
X X X X
Document eye
exam
X
Document foot
exam
X
Initiate
medication
therapy
X
X
X
X
X
X
X
Step up therapy X X X X X X X
Add ACEI/ARB X X X X X

IMPLEMENTATION OF A DIABETES TREATMENT ALGORITHM
40
Synthesis Table 3: Provider of intervention, setting, and Hispanic Ethnicity
Primary Author and Publication Year
Who delivered
intervention
Glazier, et
al. (2006)
Shaw, et
al. (2014)
Ishani, et
al. (2011)
Mader, et
al. (2014)
Rothman,
et al.
(2005)
Allen, et
al. (2011)
Welsh, et
al. (2011)
Fanning, et
al. (2004)
Guzek, et
al. (2009)
Congdon,
et al.
(2013)
Registered Nurse X X X X X X X X
Nurse
Practitioner
X X
Clinical
Pharmacist
X X X
Community lay
worker
X X
Other Medical
Provider
X X X X X X
Settings
Medical Center X X X X
Community
Health Center
X X X X X X
Primary Care
Office
X X X
Hispanic/Latino
as primary
patient
population
NO
NO
NO
NO
NO
NO
YES
YES
NO
YES
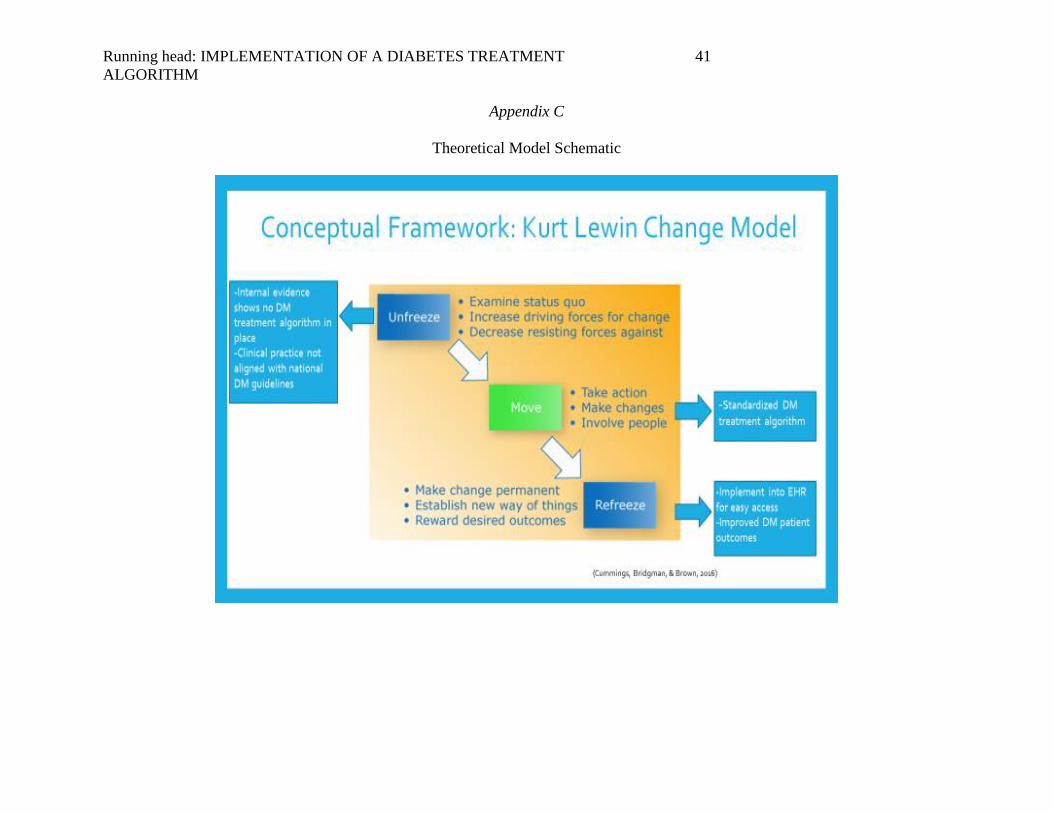
Running head: IMPLEMENTATION OF A DIABETES TREATMENT
ALGORITHM
41
Appendix C
Theoretical Model Schematic

Running head: IMPLEMENTATION OF A DIABETES TREATMENT
ALGORITHM
42
Appendix D
IRB Letter

IMPLEMENTATION OF A DIABETES TREATMENT ALGORITHM
43
Appendix E
Site Approval Letter
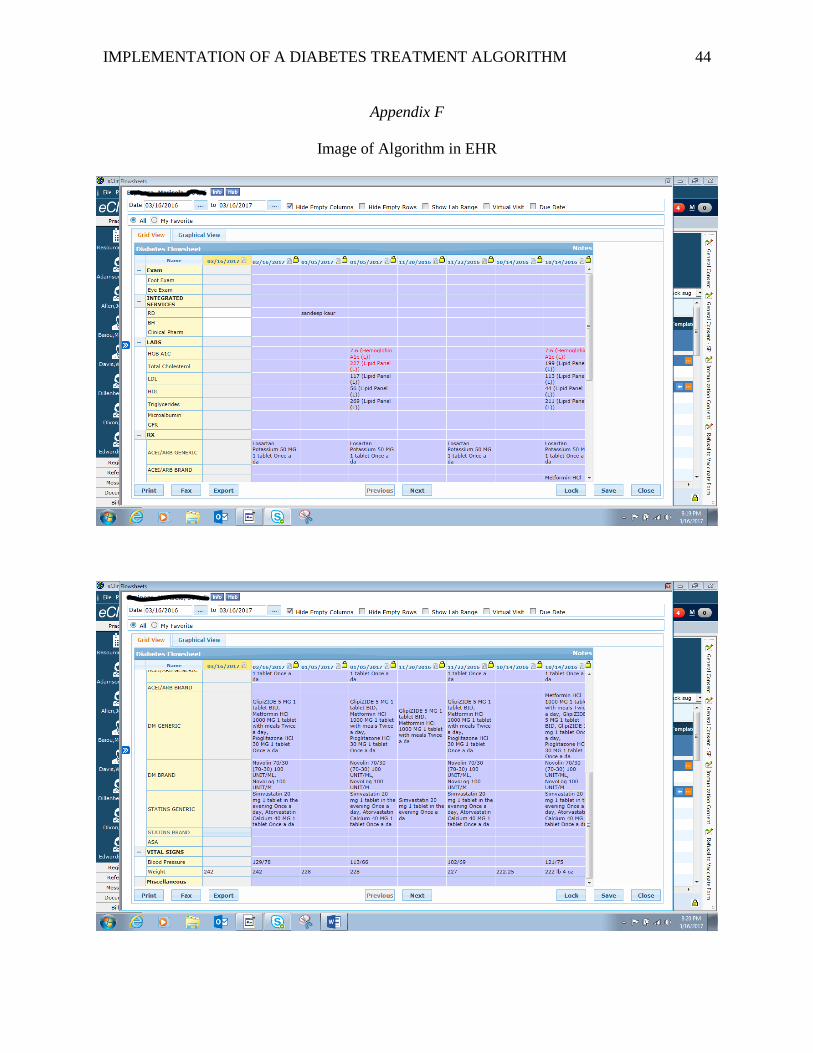
IMPLEMENTATION OF A DIABETES TREATMENT ALGORITHM
44
Appendix F
Image of Algorithm in EHR

IMPLEMENTATION OF A DIABETES TREATMENT ALGORITHM
45
Appendix G
Audit Tool
ID # DM code Annual Foot examA1C A1C number Lipid panel Microalbumin GFR Statin ASA ACEI/ARB DM meds added/titratedWt. documented Wt mgmt
1 E11.9 N Y 8.1 N N Y Y N Y N Y N/A
2 E11.9 N Y 8.4 Y Y Y Y Y Y Y Y Y
3 E11.9 Y Y 6.7 Y Y Y Y N/A N/A N/A Y N
4 E11.9 N Y 7 Y N N Y Y Y Y Y Y
5 E11.9 N Y 10.3 N N N Y N Y Y Y N
6 E11.9 N Y 7.1 Y Y Y N N N/A N/A Y N/A
7 E11.9 N Y 9.2 Y Y Y Y Y Y Y Y N
8 E11.9 Y Y 8.2 Y N N Y Y Y Y Y N
9 E11.9 N Y 6.5 Y N N Y N N N/A Y N/A
10 E11.9 N Y 7.9 Y Y Y Y Y Y Y Y Y
11 E11.9 N Y 6.2 Y N N Y Y Y N/A Y N
12 E11.9 N Y 8.6 Y Y Y Y Y Y Y Y N
13 E11.9 N Y 6.7 Y Y Y Y Y Y N/A Y N
14 E11.9 N Y 6.6 Y Y Y Y Y N/A N/A Y N
15 E11.9 Y N N/A N N N N N/A Y N/A Y Y
16 E11.9 N Y 8.4 Y N N Y N N/A Y Y N
17 E11.9 N Y 8.1 Y Y Y Y Y Y N Y N
18 E11.9 Y Y 9.5 Y Y Y Y Y Y Y Y N
19 E11.9 N Y 7.4 Y Y Y Y Y Y Y Y N
20 E11.9 N Y 8.6 Y Y Y Y Y Y Y Y N
1 E11.9 Y Y 7.1 Y N N Y Y Y N/A Y N
2 E11.9 Y Y 9.2 Y Y Y Y Y Y Y Y N

IMPLEMENTATION OF A DIABETES TREATMENT ALGORITHM
46
Appendix H
Project Timeline
Project Phase Milestone Estimated Completion
Initiation Identified practice change
project. PICOT established
Completed
Critical appraisal, evaluation,
and synthesis of evidence
Completed
Planning Formulate practice
recommendations. Algorithm
Completed
Develop treatment algorithm
and chart audit form
6/2016
Identify population.
Family practice providers (2
MD, 1 DO, 1 NP)
With focus on Adult Hispanic
patients with DMII
6/2016
Meet with EHR champion to
input algorithm into EHR
7/2016
Scholarly project proposal 8/2016
IRB approval 8/2016-9/2016
Implementation Educate providers on use of
algorithm, including ppt with
significance of problem.
9/2016
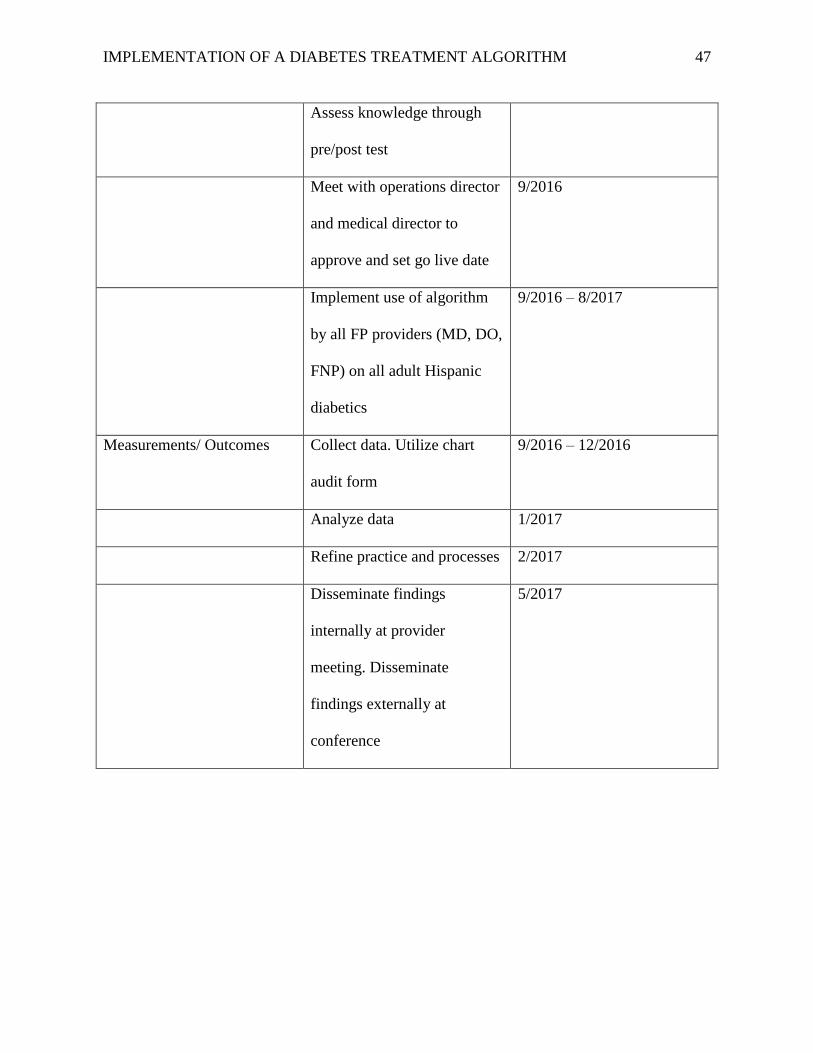
IMPLEMENTATION OF A DIABETES TREATMENT ALGORITHM
47
Assess knowledge through
pre/post test
Meet with operations director
and medical director to
approve and set go live date
9/2016
Implement use of algorithm
by all FP providers (MD, DO,
FNP) on all adult Hispanic
diabetics
9/2016 – 8/2017
Measurements/ Outcomes Collect data. Utilize chart
audit form
9/2016 – 12/2016
Analyze data 1/2017
Refine practice and processes 2/2017
Disseminate findings
internally at provider
meeting. Disseminate
findings externally at
conference
5/2017

IMPLEMENTATION OF A DIABETES TREATMENT ALGORITHM
48
Appendix I
Participating Providers’ Characteristics
Characteristic Frequency Percent Mean ± SD
Age (y) 4 100 37 ± 2.160
Gender
Male 1 25
Female 3 75
Race
Asian-Hispanic 1 25
East Indian 1 25
White 2 50
Job Title
Medical Doctor 2 50
Doctor of
Osteopathic
Medicine
1 25
Family Nurse
Practitioner
1 25
Years of Experience
≤ 2 years 2 50
3-5 years 1 25
≥ 5 years 1 25

IMPLEMENTATION OF A DIABETES TREATMENT ALGORITHM
49
Appendix J
Counts and percentages of occurrence of documentation in the algorithm by category
Category Documented Not Documented Not Applicable
Counts
(n= 87)
Percent Counts Percent Counts Percent
A1C 86 98.9 1 1.1
Annual Foot Exam 30 34.5 57 65.5
Lipid Panel 67 77 18 20.7 2 2.3
Microalbumin 31 35.6 56 64.4
GFR 44 50.6 43 49.4
Statin 61 70.1 8 9.2 18 20.7
Aspirin 50 57.5 15 17.2 22 25.3
ACEI/ARB 63 72.4 5 5.7 19 21.8
Med Added/Titrated 33 37.9 10 11.5 44 50.6
Weight Measured 85 97.7 2 2.3
Weight Management 11 12.6 65 74.7 11 12.6