Habitat creation for animals by teredinid bivalves in ... creation for animals by teredinid bivalves...
262
i Habitat creation for animals by teredinid bivalves in Indonesian mangrove ecosystems A thesis submitted in partial fulfilment of the requirements for the award of the degree of Doctor of Philosophy of the University of Portsmouth By Ian Wyndom Hendy Institute of Marine Sciences, School of Biological Sciences University of Portsmouth PO4 9LY October 2012
Transcript of Habitat creation for animals by teredinid bivalves in ... creation for animals by teredinid bivalves...

i
Habitat creation for animals by teredinid bivalves in Indonesian
mangrove ecosystems
A thesis submitted in partial fulfilment of the requirements for the award of the
degree of Doctor of Philosophy of the University of Portsmouth
By
Ian Wyndom Hendy
Institute of Marine Sciences, School of Biological Sciences
University of Portsmouth
PO4 9LY
October 2012
ii
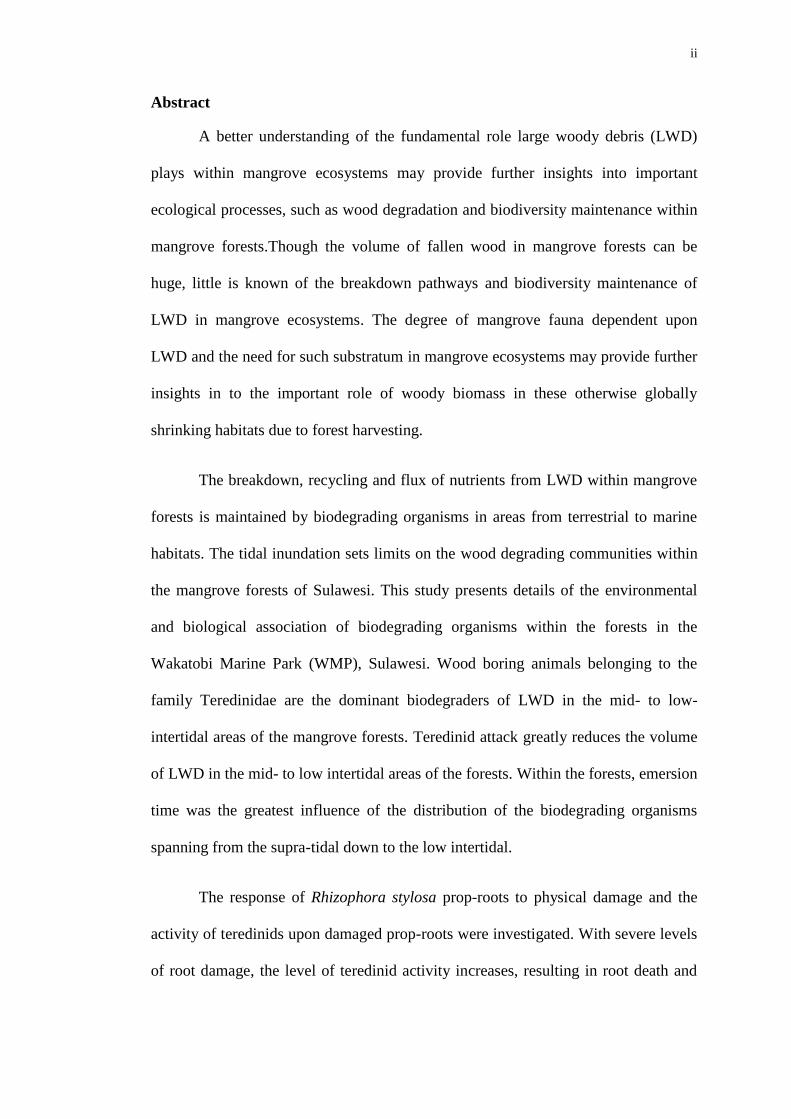
Abstract
A better understanding of the fundamental role large woody debris (LWD)
plays within mangrove ecosystems may provide further insights into important
ecological processes, such as wood degradation and biodiversity maintenance within
mangrove forests.Though the volume of fallen wood in mangrove forests can be
huge, little is known of the breakdown pathways and biodiversity maintenance of
LWD in mangrove ecosystems. The degree of mangrove fauna dependent upon
LWD and the need for such substratum in mangrove ecosystems may provide further
insights in to the important role of woody biomass in these otherwise globally
shrinking habitats due to forest harvesting.
The breakdown, recycling and flux of nutrients from LWD within mangrove
forests is maintained by biodegrading organisms in areas from terrestrial to marine
habitats. The tidal inundation sets limits on the wood degrading communities within
the mangrove forests of Sulawesi. This study presents details of the environmental
and biological association of biodegrading organisms within the forests in the
Wakatobi Marine Park (WMP), Sulawesi. Wood boring animals belonging to the
family Teredinidae are the dominant biodegraders of LWD in the mid- to low-
intertidal areas of the mangrove forests. Teredinid attack greatly reduces the volume
of LWD in the mid- to low intertidal areas of the forests. Within the forests, emersion
time was the greatest influence of the distribution of the biodegrading organisms
spanning from the supra-tidal down to the low intertidal.
The response of Rhizophora stylosa prop-roots to physical damage and the
activity of teredinids upon damaged prop-roots were investigated. With severe levels
of root damage, the level of teredinid activity increases, resulting in root death and
iii
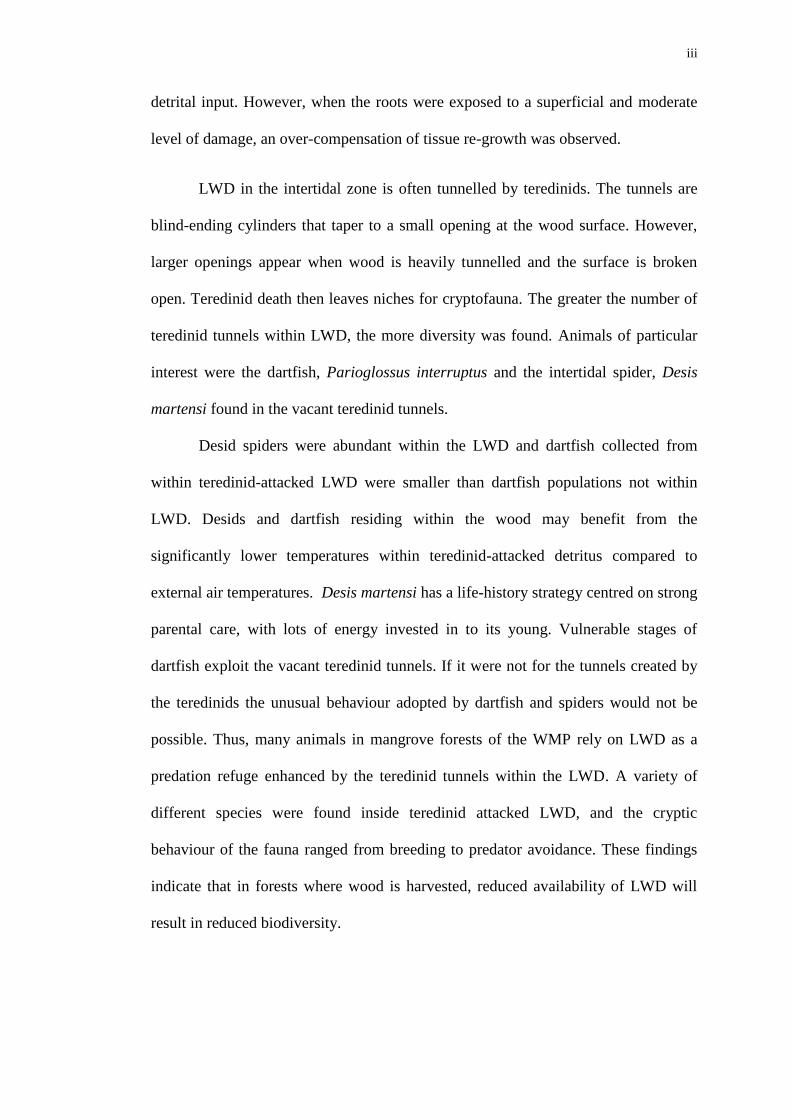
detrital input. However, when the roots were exposed to a superficial and moderate
level of damage, an over-compensation of tissue re-growth was observed.
LWD in the intertidal zone is often tunnelled by teredinids. The tunnels are
blind-ending cylinders that taper to a small opening at the wood surface. However,
larger openings appear when wood is heavily tunnelled and the surface is broken
open. Teredinid death then leaves niches for cryptofauna. The greater the number of
teredinid tunnels within LWD, the more diversity was found. Animals of particular
interest were the dartfish, Parioglossus interruptus and the intertidal spider, Desis
martensi found in the vacant teredinid tunnels.
Desid spiders were abundant within the LWD and dartfish collected from
within teredinid-attacked LWD were smaller than dartfish populations not within
LWD. Desids and dartfish residing within the wood may benefit from the
significantly lower temperatures within teredinid-attacked detritus compared to
external air temperatures. Desis martensi has a life-history strategy centred on strong
parental care, with lots of energy invested in to its young. Vulnerable stages of
dartfish exploit the vacant teredinid tunnels. If it were not for the tunnels created by
the teredinids the unusual behaviour adopted by dartfish and spiders would not be
possible. Thus, many animals in mangrove forests of the WMP rely on LWD as a
predation refuge enhanced by the teredinid tunnels within the LWD. A variety of
different species were found inside teredinid attacked LWD, and the cryptic
behaviour of the fauna ranged from breeding to predator avoidance. These findings
indicate that in forests where wood is harvested, reduced availability of LWD will
result in reduced biodiversity.

iv
Acknowledgements
First and foremost, I wish express my sincere and total gratitude to Simon
Cragg, for seeing something in me which I believed I was not capable of. I thank
Simon for his tireless work ethic and professionalism. Thank you for your support,
encouragement and guidance.
I am very grateful towards Operation Wallacea for providing research
funding and providing the resources to make this project possible. I also want to give
my sincerest thanks to Amat and Kungdan – my wonderful mangrove posse who
worked with me with enthusiasm and passion, in long hard days when in the field. I
miss those guys. In addition, I also wish to give an extended very large Ian bear-hug
to several Hoga stalwarts – like Simon, you have been a role-model and inspiration
to me, Richard Barnes and Chris Todd.
To the dynamic and cheerful IMS team – it has been a pleasure to have been
a part of this institution for a number of years. The enthusiasm, passion and drive of
each and every one of you are infectious. In the early years, the support network
provided by Maureen and Ray and during the completion of my study Lucy, Graham,
Amaia, and Matt has been a constant source of encouragement, thank you.
I would also like to give a big thank you to Scott Armbruster, for his expert
opinions and rapid feed-back with various drafts of this thesis. My gratitude and
appreciation also goes out to David Jones (The Natural History Museum of London)
for identification of termites. J. Lawrence for his identification of coleopteran larvae,
and G. Jones and L. Ryvarden for their help towards identification of the

v
basidiomycetes fruiting bodies. A big thank you goes out to Trevor Willis, for his
expert advice on using the PRIMER statistical package.
Furthermore, I would like to thank my very hard working American
colleagues who I have worked with on Hoga Island. Wayne, John and Theresa, each
of you have been a pleasure to work with. I have learnt so much with other scientific
disciplines – all of which is thanks to you guys. The seemingly hard endless hours
you all put in to your lab-work was a lesson in itself.
A special mention must go to Peter Chivers – another role model of mine.
Although you are gone and missed, you have never been forgotten - your
encouragement and belief in me during my A- levels and GCSEs when attending
Highbury College was such a boost. Also, very special thanks go out to Tricia
Farnham, my A- level biology teacher.
Combined with my collaborators and colleagues, to my family and friends –
your support and constant belief in me throughout has been amazing and a real
source of energy. Clare, thank you for putting up with me over the last year, you
have been a ray of sunlight. Mum, Matt thank you both for supporting me all the
way. To my boys at the gym, you must be the only bodybuilders who know what
teredinid bivalves are! Thank you all, for being so understanding and patient.
Grandpa, although you are no longer with us – this PhD is dedicated to you, I
miss you…
vi
List of contents
Chapter 1
General introduction
1.1 Overview 1
1.1.1 Indo-Pacific mangrove systems 2
1.1.2 Mangrove biomass and partitioning 6
1.1.3 Detrital input and breakdown pathways 8
1.1.4 Role of fallen mangrove wood 10
1.2 The Teredinidae (Mollusca: Bivalvia) 13
1.3 Study site, the Wakatobi Marine Park 15
1.4 Research aims and objectives 18
Chapter 2
MANGROVE FORESTS OF THE WMP, EAST SULAWESI, INDONESIA
2.1 Introduction 20
2.2 Materials and methods
2.2.1 Belt transects, tree identification, and measurements of emersion time
and salinity 22
2.2.2 Mangrove forest descriptions 23
2.2.3 Tree densities and species basal area 29
2.3 Data analysis 31
2.4 Results 32

vii
2.4.1 Mangrove area and botanical distributions 32
2.4.2 Environmental factors 34
2.4.3 Canopy-forming trees and forest characteristics 36
2.4.4 Tree species dominance – basal areas, biomass and tree densities
43
2.4.5 Site similarity and tree species diversity 55
2.5 Discussion 58
Chapter 3
INVESTIGATION OF WOOD BIODEGRADATION IN MANGROVE
ECOSYSTEMS
3.1 Introduction 66
3.2 Materials and methods 71
3.2.1 Measurement of wood-loss in panels 71
3.2.2 The measurement and collection of dead wood and arbitrary scale
classification and wood-loss from teredinid attack 72
3.2.3 Wood degrading organisms and environmental factors in the Galua and
Laulua mangrove forests 75
3.3 Data analysis 76
3.4 Results 77
3.4.1 Wood degradation within the landward, Sombano and seaward, Langira
forests 77
3.4.2 Sombano, Langira and Kal 1 panel analysis – wood loss 77
3.4.3 The biodegrading organisms found on LWD 78
3.4.4 The volume of LWD in mangrove forests 87
3.4.5 Wood-degrading organism distribution and environmental variables –
emersion, distance from the land and salinity 89
viii
3.4.6 The change between terrestrial and marine wood-degrading organisms
94
3.4.7 Teredinid panel-fragmentation 96
3.5 Discussion 97
Chapter 4
THE EFFECT OF TEREDINID TUNNELLING ON MANGROVE PROP-
ROOTS
4.1 Introduction 110
4.2 Materials and methods 115
4.2.1 Root scar experiment 115
4.2.2 Root biscuit analysis 116
4.3 Data analysis 118
4.4 Results 118
4.4.1 Root scar analysis upon live roots 118
4.4.2 Root biscuit analysis 123
4.4.3 Atypical growth of lignified tissues 125
4.5 Discussion 127
Chapter 5
HABITAT CREATION FOR ANIMALS BY TEREDINIDS
5.1 Introduction 132
5.2 Materials and methods 134
ix
5.2.1 Assessing the sediment macro-infauna, root epifauna and LWD cryptic
fauna 134
5.2.2 Assessing the effect of teredinid tunnelling on LWD in mangrove
forests 135
5.2.3 Recruitment and succession of animals to drilled wooden blocks
mimicking teredinid-attacked LWD 136
5.3 Data analysis 137
5.4 Results 138
5.4.1 Comparisons of animal diversity in different substrata 138
5.4.2 Biodiversity in teredinid tunnelled wood 142
5.4.3 Recruitment and succession of animals within drilled wooden blocks
mimicking teredinid tunnels 158
5.5 Discussion 166
Chapter 6
BIODIVERSITY MAINTENANCE BY VACANT TEREDINID TUNNELS
6.1 Introduction 172
6.2 Materials and methods 175
6.2.1 Field studies 175
6.2.2 Laboratory studies 177
6.3 Data analysis 180
6.3.1 Field studies 180
6.3.2 Laboratory studies 181
6.4 Results 182

x
6.4.1 Temperature analysis 182
6.4.2 Parioglossus interruptus autecology analysis 185
6.4.3 Desis martensi autecology analysis 190
6.5 Discussion 193
Chapter 7
GENERAL DISCUSSION 202
Reference list 215

xi
Contribution of collaborators
Section Contributions of collaborators of work reported in this thesis Institution
3.1 Jason Williams prepared all arc G.I.S mangrove forest maps (Figure 3.1) Texas A&M University – Corpus
Christi
6.2.2 John Eme performed all thermal tolerance experiments for Parioglossus interruptus University of North Texas
6.2.2 Wayne Bennett and Theresa Dabruzzi designed the wind tunnel used for the wood cooling experiment University of West Florida

0
Declaration
While registered as a candidate for a doctorate degree, I have not been registered
for any other research reward. The results and conclusions embodied in this thesis are
the work of the named candidate and have not been submitted for any other academic
post-graduate degree.
Ian Wyndom Hendy
xii
xii
1
Chapter 1
GENERAL INTRODUCTION
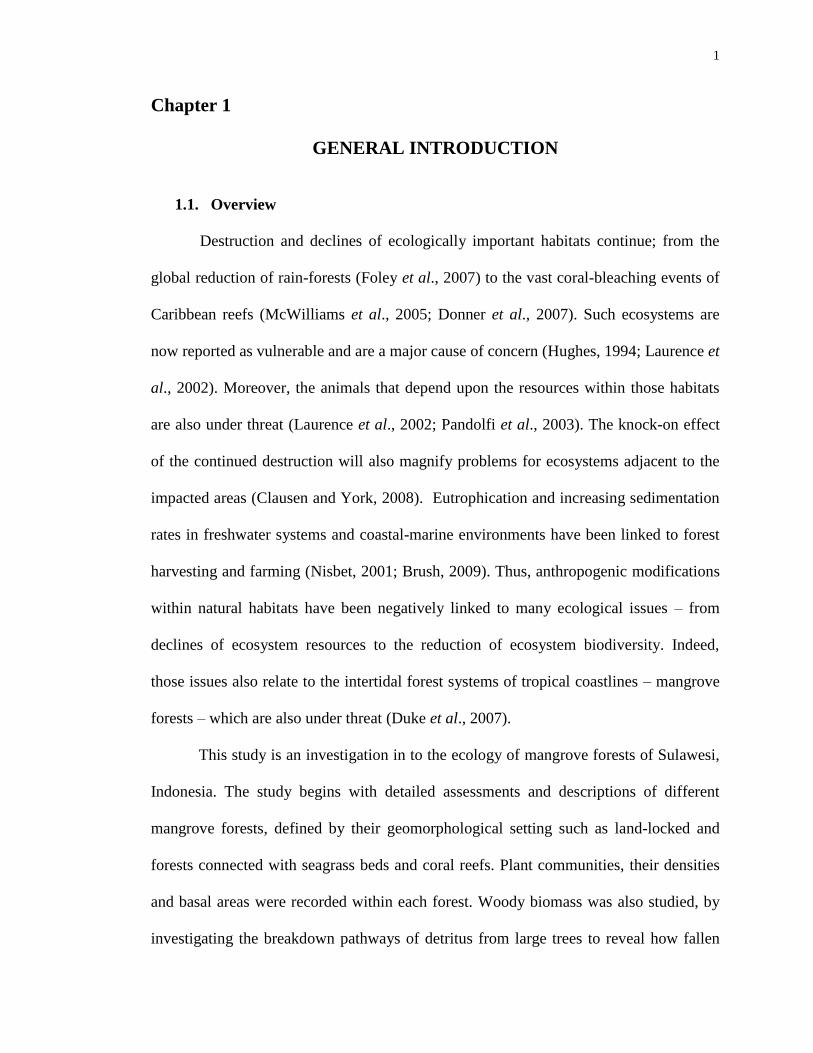
1.1. Overview
Destruction and declines of ecologically important habitats continue; from the
global reduction of rain-forests (Foley et al., 2007) to the vast coral-bleaching events of
Caribbean reefs (McWilliams et al., 2005; Donner et al., 2007). Such ecosystems are
now reported as vulnerable and are a major cause of concern (Hughes, 1994; Laurence et
al., 2002). Moreover, the animals that depend upon the resources within those habitats
are also under threat (Laurence et al., 2002; Pandolfi et al., 2003). The knock-on effect
of the continued destruction will also magnify problems for ecosystems adjacent to the
impacted areas (Clausen and York, 2008). Eutrophication and increasing sedimentation
rates in freshwater systems and coastal-marine environments have been linked to forest
harvesting and farming (Nisbet, 2001; Brush, 2009). Thus, anthropogenic modifications
within natural habitats have been negatively linked to many ecological issues – from
declines of ecosystem resources to the reduction of ecosystem biodiversity. Indeed,
those issues also relate to the intertidal forest systems of tropical coastlines – mangrove
forests – which are also under threat (Duke et al., 2007).
This study is an investigation in to the ecology of mangrove forests of Sulawesi,
Indonesia. The study begins with detailed assessments and descriptions of different
mangrove forests, defined by their geomorphological setting such as land-locked and
forests connected with seagrass beds and coral reefs. Plant communities, their densities
and basal areas were recorded within each forest. Woody biomass was also studied, by
investigating the breakdown pathways of detritus from large trees to reveal how fallen

2
wood is recycled and processed in areas of each mangrove forest that have different
biodegradation processes by organisms found in terrestrial to marine areas of the forests,
such as fungi, coleopteran larvae, termites and teredinids. In greater detail, wood-boring
molluscs were investigated. Teredinids are the primary focus of this study upon fallen
wood in the mid- to low- intertidal areas of mangrove forests. Fallen wood was split
apart and all fauna were identified to their lowest achievable taxonomic classification.
This study demonstrates that teredinid-attacked fallen wood in mangrove ecosystems
enhances the biodiversity of fauna. However, this study also demonstrates that sea level
rise and decreasing pH due to global warming may impact the degradation of LWD in
the mangrove forests of Sulawesi.
1.1.1. Indo-Pacific mangrove systems
This study was conducted in eight unusual mangrove forests from the Wakatobi
Marine Park (WMP), Tukang Besi Archipelago, Sulawesi, Indonesia. More than 17,000
Indonesian islands are carbonate in origin (Tomascik et al., 1997). Eastern Indonesia is
situated at the junction of three major tectonic plate regions. There are five major fault
zones, sutures that separate the tectonic plates. These sutures run along Molucca,
Sorong, Borneo, Sulawesi and the Banda Sea (Hall and Wilson, 2000). It is these major
fault regions that may give rise to the numerous fissured rocky islands that have coral-
rock intertidal zones. Most Indonesian mangrove forests are associated with muddy
fluvial deposits - sediments derived from rivers and streams. Nonetheless, some
mangrove forests have developed on calcareous coral-plateaus (Tomascik et al., 1997).
3
Mangrove forests develop best where low wave energy and shelter enhance the
deposition of fine particles, which enables these salt-tolerant trees to establish roots and
grow (Alongi 2002). The retention of sediments within mangrove environments reduces
the turbidity of the surrounding ocean waters (Engelhart et al., 2007), which enhances
the photosynthetic ability of the zooxanthellae within coral colonies as turbid water
reduces sunlight penetration (Kleypas 1996). Mangroves are the only trees living at the
interface where the terrestrial environment meets the marine environment along tropical
coastal regions (Figure 1.1) (Sherman et al., 2003, Middleton and Mckee 2001).
Mangrove forests consist of groups of trees that form distinct zones occupying the
eulittoral and also dominating the supralittoral fringes (Woodroffe, 1982; Morton, 1983;
Tomascik et al., 1997). In Indonesia, zones of mangrove trees often include genera such
as Rhizophora and Sonneratia, commonly found at the low intertidal zone (Tomascik et
al., 1997; Giesen et al., 2006) and trees such as Avicennia, Xylocarpus, Bruguiera and
Excoecaria commonly found further in to the upper to high intertidal zone (Tomascik et
al., 1997; Giesen et al., 2006). Zonations of mangrove trees are controlled by
environmental factors such as hydrology, salinity, soil chemistry, nutrient availability,
predation, competition and also immersion time (Tomascik et al., 1997; McKee and
Faulkner, 2000; Pi et al., 2009). Mangrove zonation is also dependent upon substratum
type. Sonneratia alba frequently dominates sandy substrata whereas Avicennia marina
are commonly found on muddy areas (Giesen et al., 2006).

4
Indonesia has the largest area of mangrove forests of any country, covering 45,
421 km2 (Spalding et al., 1997); almost one quarter of the World’s mangrove forests.
Such forests are important along Indonesian coastal areas as they play a vital role in the
ecological, economic and social development of coastal Indonesian communities
(Tomascik et al., 1997; Alongi, 2007). Indonesian mangrove forests also provide habitat
for many transient animals between adjacent ecosystems such as seagrass beds and coral
reefs (Sheaves, 2005). Many juvenile and vulnerable fish species enter the mangrove
forests at hightide – seeking the refuge of mangrove roots to avoid predation
(Laegdsgaard and Johnson, 2001). Those fish will then follow the ebbing tide to seek
refuge with adjacent reefs (Sheaves, 2005). Mangrove forests also support biodiversity
within adjacent coral reefs as they deliver organic nutrients to sessile reef-inhabitating
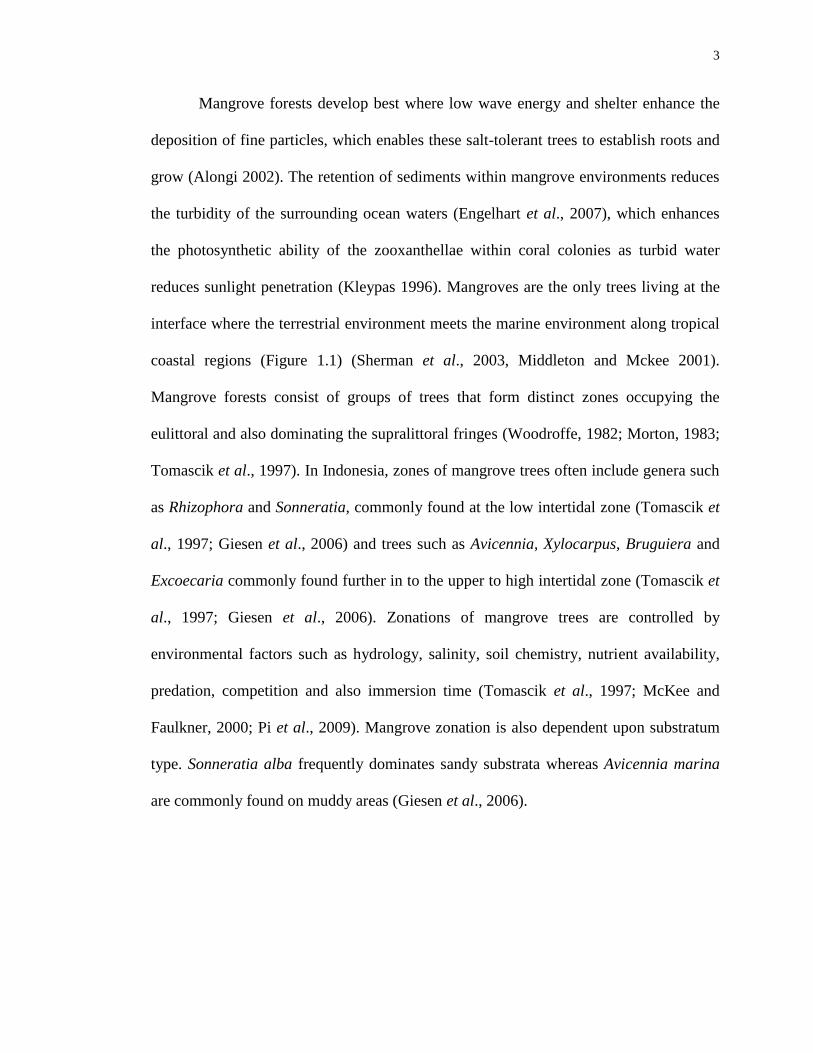
Figure 1.1, A Rhizophora-dominated Indonesian mangrove forest at low tide. When
flooded, seawater will immerse the exposed Rhizophora stylosa prop-roots that extend
up to 1.5 meters above the sediments.
5
invertebrates (Granek et al., 2009). Thus, the connectivity between mangrove
ecosystems and coral reefs enhances the survival of the fauna from both habitats. Such
connectivity has rarely been studied in Indonesia even though the Indo-Pacific bioregion
is considered to be a biodiversity hotspot, containing the world’s richest diversity of
marine life (Roberts et al., 2002; Allen, 2008).
Indonesia is in the top ten percent of countries with ecosystems containing a high
level of marine animal diversity coupled with high animal endemism (Roberts et al.,
2002; Allen, 2008). When considering mangrove trees, Indonesia has 52 of the world’s
70 mangrove species (Giesen et al., 2006). Thus, mangrove forests have their center of
biodiversity richness located in the Indo-West-Pacific, where these forests have
important biological and physical functions (Tomascik et al., 1997; Kathiresan and
Bingham, 2001).
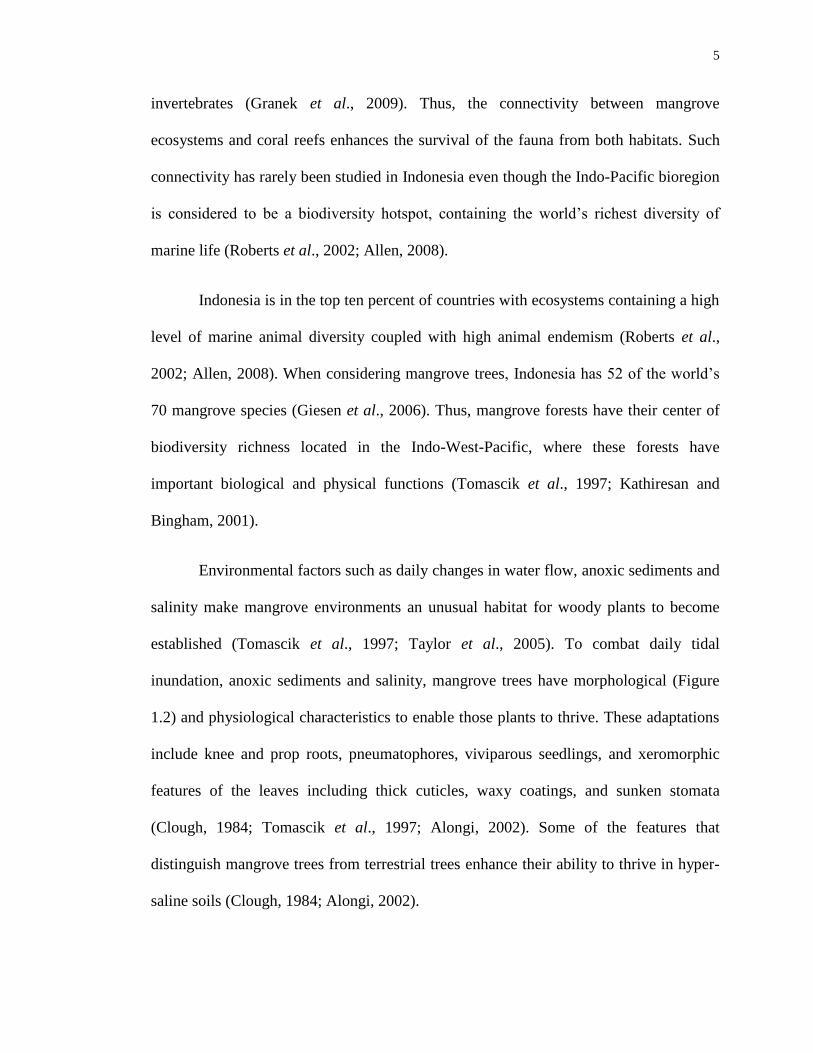
Environmental factors such as daily changes in water flow, anoxic sediments and
salinity make mangrove environments an unusual habitat for woody plants to become
established (Tomascik et al., 1997; Taylor et al., 2005). To combat daily tidal
inundation, anoxic sediments and salinity, mangrove trees have morphological (Figure
1.2) and physiological characteristics to enable those plants to thrive. These adaptations
include knee and prop roots, pneumatophores, viviparous seedlings, and xeromorphic
features of the leaves including thick cuticles, waxy coatings, and sunken stomata
(Clough, 1984; Tomascik et al., 1997; Alongi, 2002). Some of the features that
distinguish mangrove trees from terrestrial trees enhance their ability to thrive in hyper-
saline soils (Clough, 1984; Alongi, 2002).
6
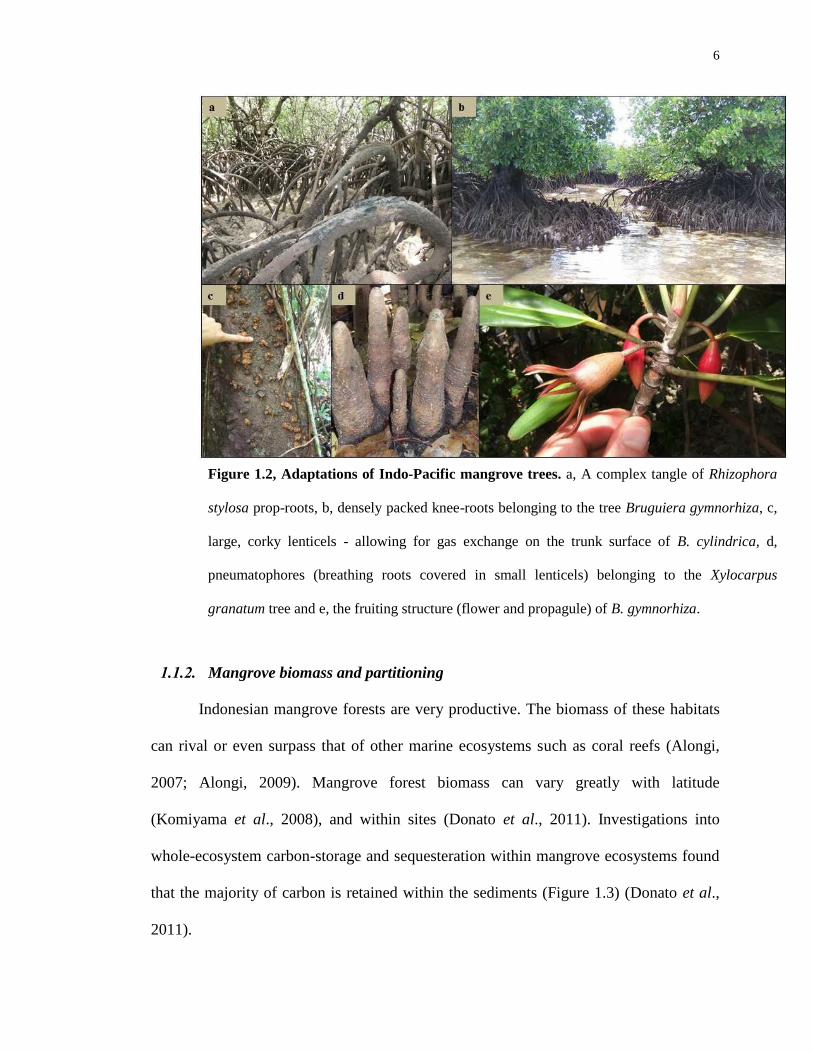
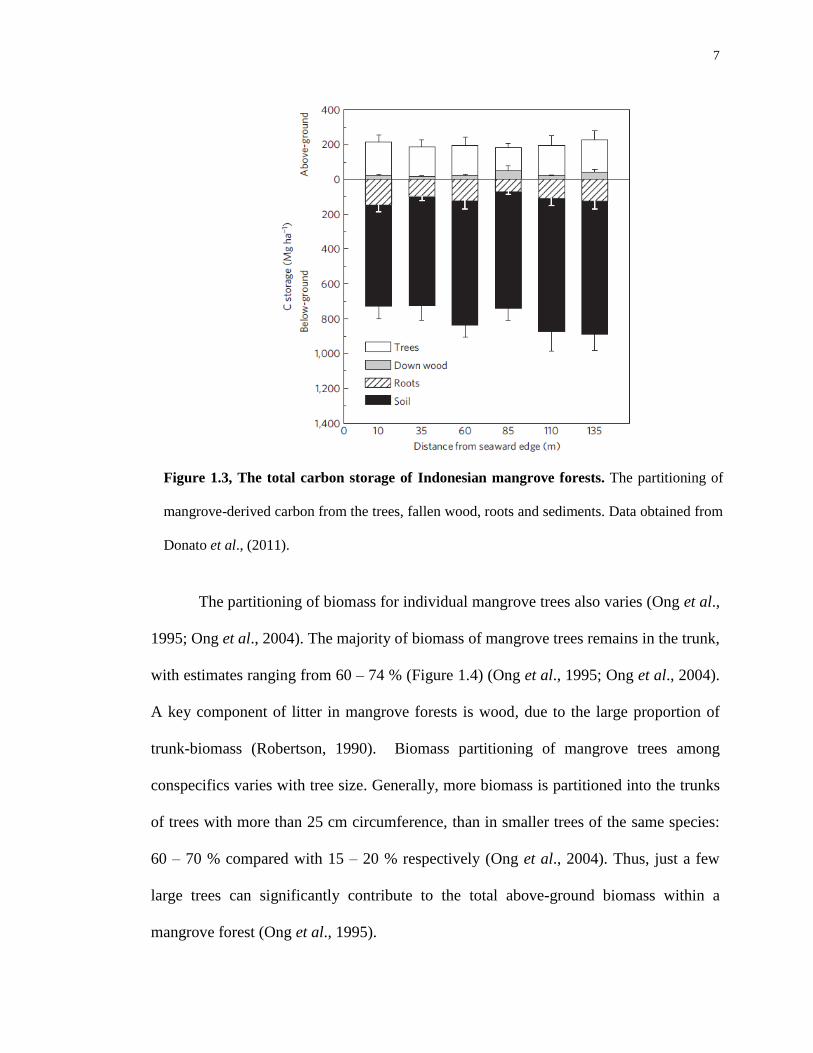
1.1.2. Mangrove biomass and partitioning
Indonesian mangrove forests are very productive. The biomass of these habitats
can rival or even surpass that of other marine ecosystems such as coral reefs (Alongi,
2007; Alongi, 2009). Mangrove forest biomass can vary greatly with latitude
(Komiyama et al., 2008), and within sites (Donato et al., 2011). Investigations into
whole-ecosystem carbon-storage and sequesteration within mangrove ecosystems found
that the majority of carbon is retained within the sediments (Figure 1.3) (Donato et al.,
2011).
Figure 1.2, Adaptations of Indo-Pacific mangrove trees. a, A complex tangle of Rhizophora
stylosa prop-roots, b, densely packed knee-roots belonging to the tree Bruguiera gymnorhiza, c,
large, corky lenticels - allowing for gas exchange on the trunk surface of B. cylindrica, d,
pneumatophores (breathing roots covered in small lenticels) belonging to the Xylocarpus
granatum tree and e, the fruiting structure (flower and propagule) of B. gymnorhiza.
7
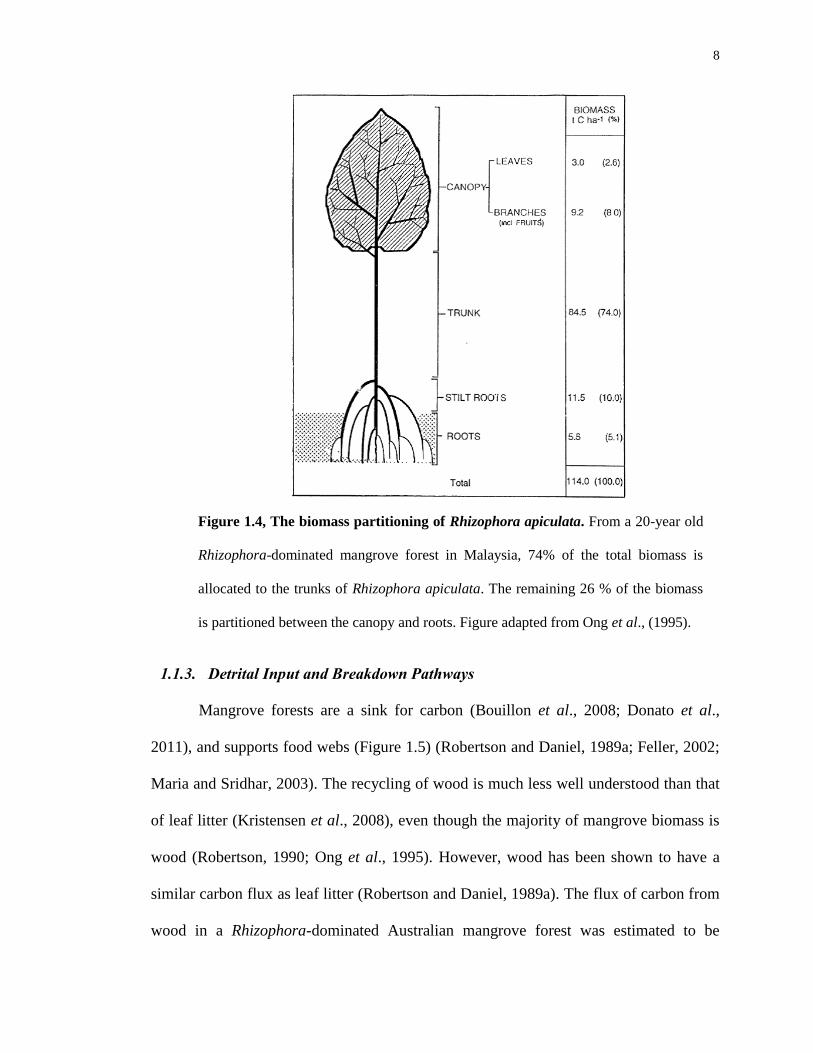
The partitioning of biomass for individual mangrove trees also varies (Ong et al.,
1995; Ong et al., 2004). The majority of biomass of mangrove trees remains in the trunk,
with estimates ranging from 60 – 74 % (Figure 1.4) (Ong et al., 1995; Ong et al., 2004).
A key component of litter in mangrove forests is wood, due to the large proportion of
trunk-biomass (Robertson, 1990). Biomass partitioning of mangrove trees among
conspecifics varies with tree size. Generally, more biomass is partitioned into the trunks
of trees with more than 25 cm circumference, than in smaller trees of the same species:
60 – 70 % compared with 15 – 20 % respectively (Ong et al., 2004). Thus, just a few
large trees can significantly contribute to the total above-ground biomass within a
mangrove forest (Ong et al., 1995).
Figure 1.3, The total carbon storage of Indonesian mangrove forests. The partitioning of
mangrove-derived carbon from the trees, fallen wood, roots and sediments. Data obtained from
Donato et al., (2011).
8
1.1.3. Detrital Input and Breakdown Pathways
Mangrove forests are a sink for carbon (Bouillon et al., 2008; Donato et al.,
2011), and supports food webs (Figure 1.5) (Robertson and Daniel, 1989a; Feller, 2002;
Maria and Sridhar, 2003). The recycling of wood is much less well understood than that
of leaf litter (Kristensen et al., 2008), even though the majority of mangrove biomass is
wood (Robertson, 1990; Ong et al., 1995). However, wood has been shown to have a
similar carbon flux as leaf litter (Robertson and Daniel, 1989a). The flux of carbon from
wood in a Rhizophora-dominated Australian mangrove forest was estimated to be
Figure 1.4, The biomass partitioning of Rhizophora apiculata. From a 20-year old
Rhizophora-dominated mangrove forest in Malaysia, 74% of the total biomass is
allocated to the trunks of Rhizophora apiculata. The remaining 26 % of the biomass
is partitioned between the canopy and roots. Figure adapted from Ong et al., (1995).

9
similar to that of leaves with 44g C m-2
y-1
compared with 62g C m-2
y-1
from the
consumption of leaves by crabs (Robertson and Daniel, 1989a).
Sesarmid crabs process mangrove leaf litter (Robertson and Daniel, 1989a;
Nordhaus and Wolff, 2007) and shrimps consume much of the mangrove-derived leaf
litter detritus (Ronnback et al., 2002; Kenyon et al., 2004). Fallen wood is processed by
fungi (Anandar and Sridhar, 2004), coleopteran larvae (Feller, 2002) and termites (Korb
and Lenz, 2004). Basidiomycetes are responsible for the initial breakdown of the
refractory components of wood in the high intertidal to supratidal areas within mangrove
forests (Anandar and Sridhar, 2004). Coleopteran larvae and termites break down wood
due to their mechanical processing and digestion within the upper to mid-intertidal zones
(Feller, 2002). However, in the seaward edges of mangrove forests the breakdown of
wood is due to the Teredinidae (Robertson and Daniel, 1989a; Robertson, 1990), and
limnoriid isopods, although limnoriids are not often found in Indonesian mangrove
forests and they only excavate superficial areas of the wood surface (Cragg and Hendy,
2010). The biodegradation processes of large woody debris (LWD) within mangrove
ecosystems are essential for nutrient sequestration within the sediments (Donato et al.,
2011). The retention of organic material within the sediments enhances mangrove
productivity (Sherman et al., 2003), and the recycling of wood in mangrove forests
provide nutrients for adjacent habitats such as seagrass beds and reefs (Granek et al.,
2009).

10
1.1.4. Role of fallen mangrove wood
Mangrove forests provide an arena where mobile terrestrial animals exploit the
forest floor at low tide, arboreal animals thrive within the canopy, benthic animals and
pelagic animals utilise the forest at high tide (Cragg and Hendy, 2010). These animals
Figure 1.5, Woody detrital input and wood degrading organisms. a, a large fallen log in
a mangrove forest – serving as the primary base of an elaborate food web b, the fruiting
body of the fungus Pycnoporus sanguineus, a basidiomycete initiating saprophytic decay of
a large log in the high intertidal c, a cerambid beetle larvae found inside a fallen Excoecaria
agallocha tree and d, termites inside a log also in the high intertidal area of the mangrove
forest.
11
range from a variety of invertebrates such as zooplankton, sponges, ascidians (Perry,
1988), crustaceans (Robertson, 1990), insects and molluscs (Coomans, 1969; Plaziat,
1984; Feller and Mathis, 1997), vertebrates including fish, amphibians, reptiles and birds
(Kathiresan and Bingham, 2001; Giesen et al., 2006). Similar to the zonation patterns of
the trees, distinct patterns of distribution can be observed with the mangrove fauna. Root
epifaunal distributions are influenced by various abiotic and biotic variables such as tidal
flow, salinity, food availability, temperature, competition and predation (Alongi, 2002).
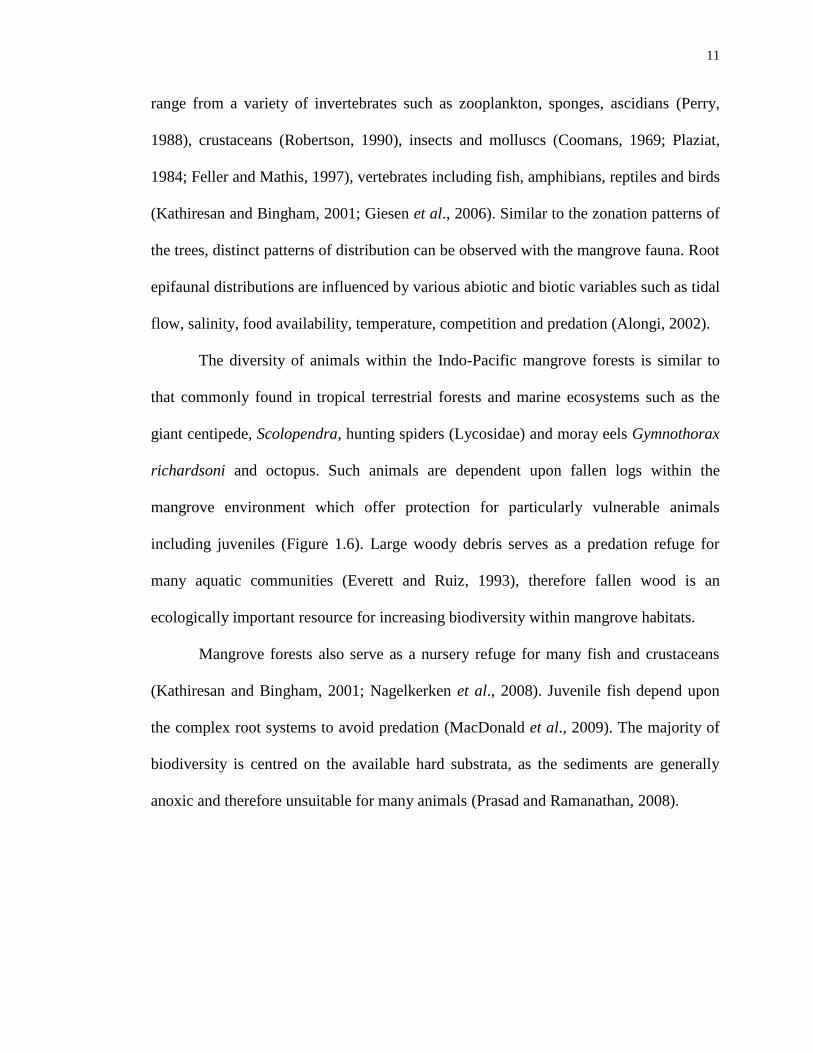
The diversity of animals within the Indo-Pacific mangrove forests is similar to
that commonly found in tropical terrestrial forests and marine ecosystems such as the
giant centipede, Scolopendra, hunting spiders (Lycosidae) and moray eels Gymnothorax
richardsoni and octopus. Such animals are dependent upon fallen logs within the
mangrove environment which offer protection for particularly vulnerable animals
including juveniles (Figure 1.6). Large woody debris serves as a predation refuge for
many aquatic communities (Everett and Ruiz, 1993), therefore fallen wood is an
ecologically important resource for increasing biodiversity within mangrove habitats.
Mangrove forests also serve as a nursery refuge for many fish and crustaceans
(Kathiresan and Bingham, 2001; Nagelkerken et al., 2008). Juvenile fish depend upon
the complex root systems to avoid predation (MacDonald et al., 2009). The majority of
biodiversity is centred on the available hard substrata, as the sediments are generally
anoxic and therefore unsuitable for many animals (Prasad and Ramanathan, 2008).
12
Mangrove ecosystems have a complex topography (Sasekumar and Chong,
1998), and the mangrove trees enhance the forest complexity that increases the level of
biodiversity (Gratwicke and Speight, 2005).
The nursery function of mangrove forests has been well documented, especially
in Caribbean forests. Many juvenile reef fishes use Caribbean forests as feeding grounds
(Mumby et al., 2003; Nagelkerken and Velde, 2004; Dahlgren et al., 2006). The larger
tidal range than the Caribbean within the Indo-Pacific mangrove forests may reduce the
activity of feeding reef fish (Nagelkerken and Velde, 2004). Research into the
Figure 1.6, Wood-dwelling cryptic fauna removed from fallen logs in Indo-Pacific
mangrove forests. a, a large lycosid spider waits in camouflage on a mangrove log b, an
octopus with eggs found inside a fallen log c, a giant Scolopendra also found inside a
mangrove log and d, one of many early juvenile octopus found inside a mangrove log.
13
mangrove-nursery function is focused upon juvenile fishes and invertebrates exploiting a
variety of connected marginal habitats such as seagrass beds and reefs (Sheaves, 2005;
Unsworth et al., 2008; Luo et al., 2009). Connectivity of adjacent ecosystems,
mangrove-seagrass-reef linkages within Indonesian marine habitats are not common
(Tomascik et al., 1997), unlike than in the Caribbean. The movement of different fish
species between habitats in the Caribbean are either facultative or obligate meaning that
some animals are not bound to any particular habitat and some are (Mumby et al., 2003).
However, some species are dependent exclusively upon the resources available within
that habitat. For example, the herbivorous fish, Scarus guacamaia is specifically bound
to life in the mangrove forests (Mumby et al., 2003). If it were not for the resources
available within the forests the abundance and distribution of Scarus will suffer local
extintions (Mumby et al., 2003). The same fate may also be true for mangrove-
dependent animals in the Indo-Pacific.
1.2. The Teredinidae (Mollusca: Bivalvia)
The wood-boring family Teredinidae (Bivalvia) consists of fifteen genera and
seventy-one species, and they are sedentary molluscs (Turner, 1966). Teredinids create
an extensive labyrinth of tunnels within fallen wood through their boring-action (Figure
1.7) (Manyak, 1982; Robertson and Daniel, 1989a). The tunnels they create remain as
their home for the duration of their adult life. Teredinids are widely distributed, from
tropical to temperate seas; where they are the dominant consumers of fallen wood along
coastlines (Distel, 2003). They may be dispersed either as adults in floating wooden
debris or as planktonic larvae drifting near the sea surface (Scheltema, 1971).
14
Teredinids have long been considered as economic pests (Laverty, 2002;
Borojevic et al., 2010). They damage man-made wooden structures in marine
environments such as boats, piers and pilings (Laverty, 2002; Godwin, 2003; Borojevic
et al., 2010). It has been estimated that the cost of damage to marine structures, ranging
from ships, docks, wharfs, piers and fishing equipment was one billion dollars U.S in
1986 (Distel, 2003). However, there has been no attempt to investigate the ecological
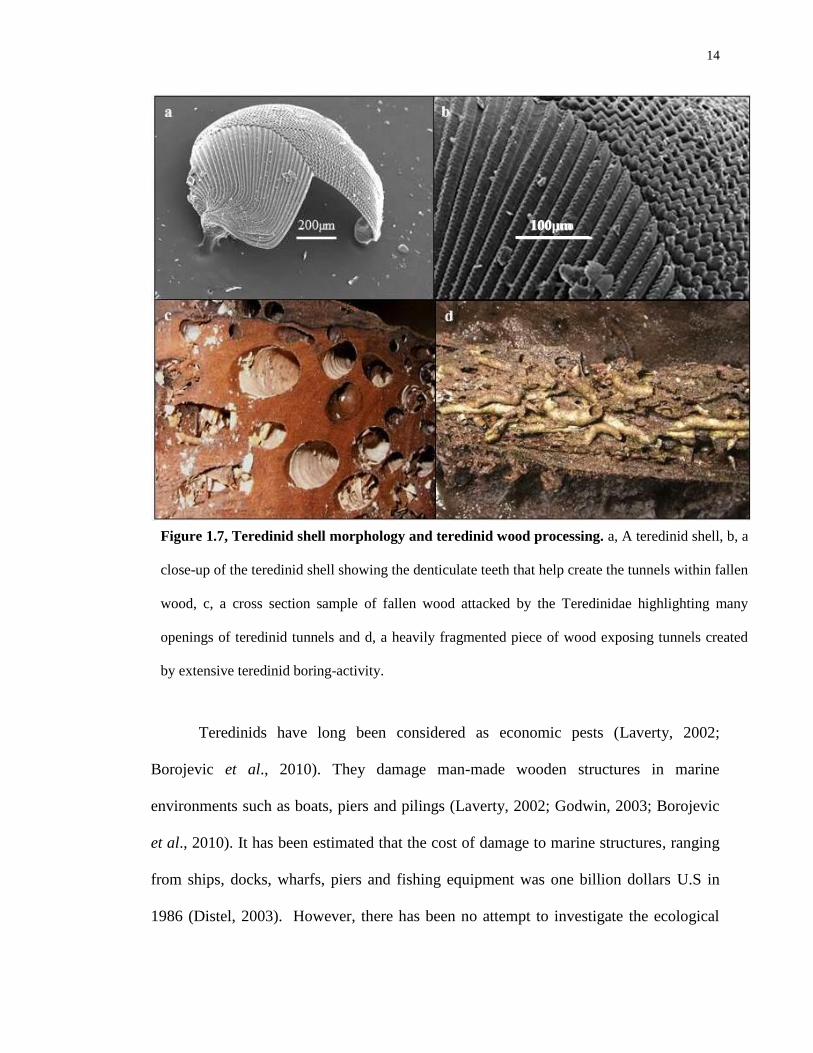
Figure 1.7, Teredinid shell morphology and teredinid wood processing. a, A teredinid shell, b, a
close-up of the teredinid shell showing the denticulate teeth that help create the tunnels within fallen
wood, c, a cross section sample of fallen wood attacked by the Teredinidae highlighting many
openings of teredinid tunnels and d, a heavily fragmented piece of wood exposing tunnels created
by extensive teredinid boring-activity.
100µm

15
benefit of teredinids within natural habitats such as mangrove forests. Teredinids process
large volumes of dead wood within mangrove habitats due to their tunnelling and wood
digestion (Distel, 2003), and by doing so they enhance nutrient recycling (Robertson and
Daniel, 1989a).
Investigations of mechanical wood degradation have mainly focused upon
coleopteran larvae in Caribbean mangrove forests (Feller and Mathis, 1997; Feller,
2002; Sousa et al., 2003). However, research investigating the decomposition of trees
from the activity of teredinids remains limited (Robertson, 1990; Filho et al., 2008). It
has been estimated that teredinids process up to 50% of dead mangrove wood
(Robertson and Daniel, 1989a). Without teredinid activity, there would be a major
increase of LWD build-up in Indonesian mangrove forests.
1.3. Study Site, The Wakatobi Marine Park
This investigation was conducted between 2006 and 2011 within the WMP,
which is the second largest marine park in Indonesia covering an area of 1.39 million
hectares (05° 12’ - 06° 10’ S, 123° 20’ - 124° 39’ E). The park is situated within the
middle of the Wallacea region – the centre of marine biodiversity (Kwakkel-Hol, 2006).
The marine park consists of four islands, the largest and most northern being Wangi-
Wangi. Southeast to Wangi-Wangi is Kaledupa, and then followed by Tomia and the
Binongko Islands (Figure 1.8). The first two letters of each island make up the name of
the marine park, Wakatobi (Kwakkel-Hol, 2006). There are about 10,000 people living
in the WMP (Clifton and Unsworth, 2010), and the majority of them are either farmers
or fishermen (Kwakkel-Hol, 2006). Over recent years declines in fish stocks due to
artisanal fishing practices (Cullen et al., 2007; Cullen, 2010) and increases of mangrove
16
forest harvesting have been reported (Cragg and Hendy, 2010) - to the detriment of the
WMP (Pilgrim et al., 2007).
Despite extensive research of the Indo-Pacific mangrove forests (Tomascik et al.,
1997), there has to date been only one study detailing the ecology of the Wakatobi
mangrove forests. The study found that of the 70 known mangrove tree species
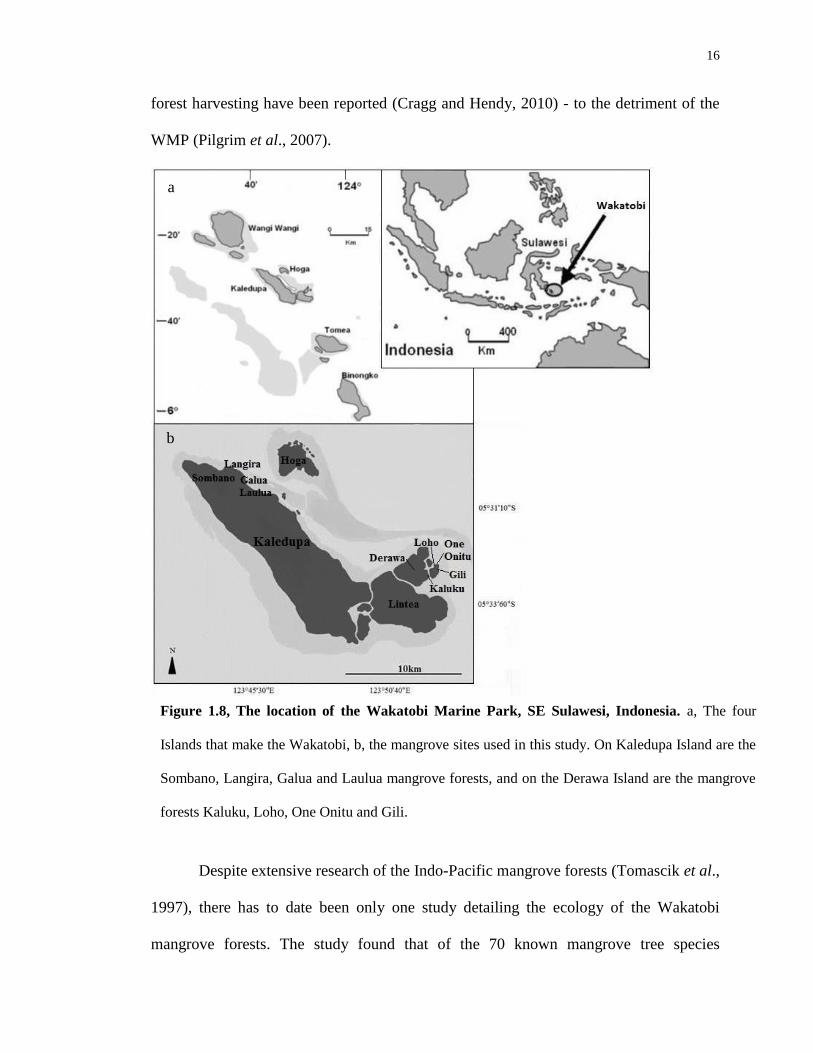
Figure 1.8, The location of the Wakatobi Marine Park, SE Sulawesi, Indonesia. a, The four
Islands that make the Wakatobi, b, the mangrove sites used in this study. On Kaledupa Island are the
Sombano, Langira, Galua and Laulua mangrove forests, and on the Derawa Island are the mangrove
forests Kaluku, Loho, One Onitu and Gili.
a
b
17
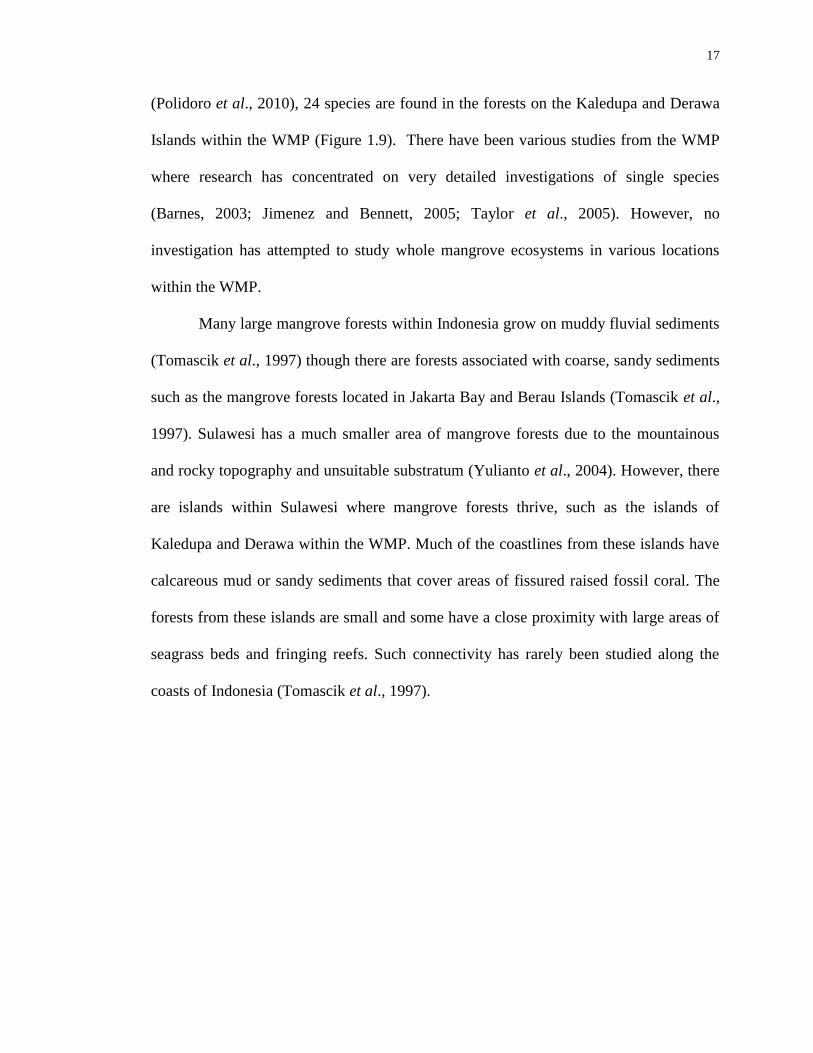
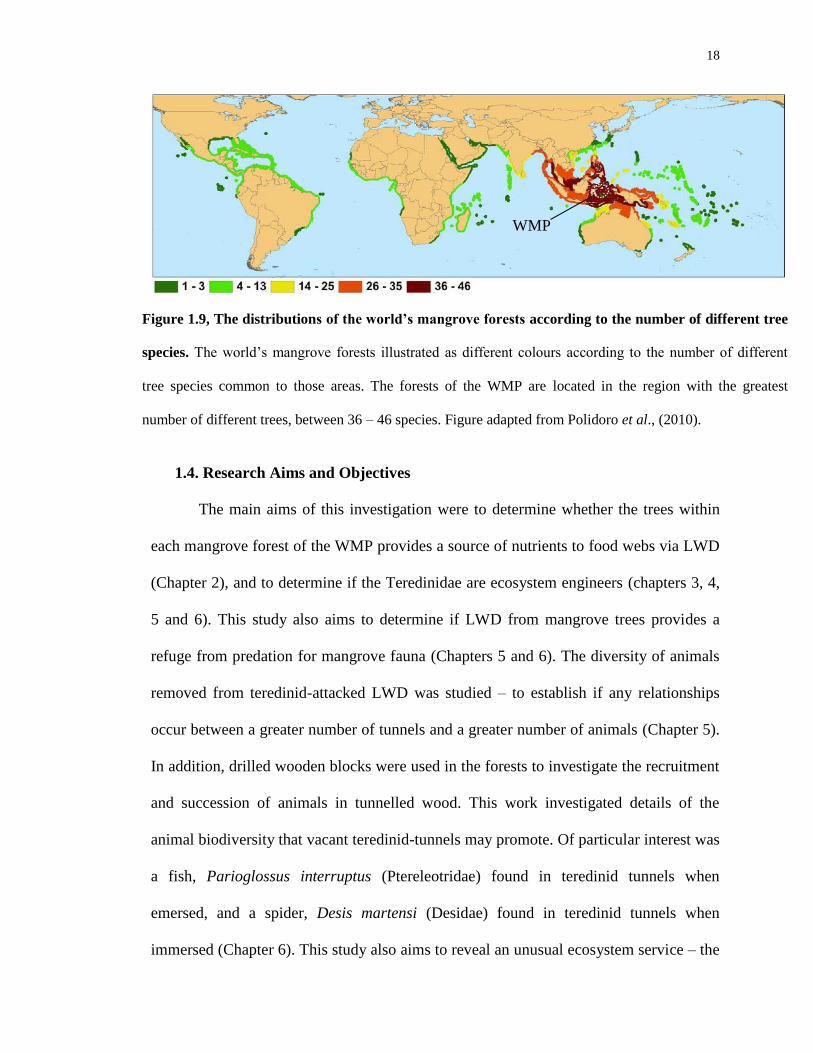
(Polidoro et al., 2010), 24 species are found in the forests on the Kaledupa and Derawa
Islands within the WMP (Figure 1.9). There have been various studies from the WMP
where research has concentrated on very detailed investigations of single species
(Barnes, 2003; Jimenez and Bennett, 2005; Taylor et al., 2005). However, no
investigation has attempted to study whole mangrove ecosystems in various locations
within the WMP.
Many large mangrove forests within Indonesia grow on muddy fluvial sediments
(Tomascik et al., 1997) though there are forests associated with coarse, sandy sediments
such as the mangrove forests located in Jakarta Bay and Berau Islands (Tomascik et al.,
1997). Sulawesi has a much smaller area of mangrove forests due to the mountainous
and rocky topography and unsuitable substratum (Yulianto et al., 2004). However, there
are islands within Sulawesi where mangrove forests thrive, such as the islands of
Kaledupa and Derawa within the WMP. Much of the coastlines from these islands have
calcareous mud or sandy sediments that cover areas of fissured raised fossil coral. The
forests from these islands are small and some have a close proximity with large areas of
seagrass beds and fringing reefs. Such connectivity has rarely been studied along the
coasts of Indonesia (Tomascik et al., 1997).
18
1.4.
1.5.
1.4. Research Aims and Objectives
The main aims of this investigation were to determine whether the trees within
each mangrove forest of the WMP provides a source of nutrients to food webs via LWD
(Chapter 2), and to determine if the Teredinidae are ecosystem engineers (chapters 3, 4,
5 and 6). This study also aims to determine if LWD from mangrove trees provides a
refuge from predation for mangrove fauna (Chapters 5 and 6). The diversity of animals
removed from teredinid-attacked LWD was studied – to establish if any relationships
occur between a greater number of tunnels and a greater number of animals (Chapter 5).
In addition, drilled wooden blocks were used in the forests to investigate the recruitment
and succession of animals in tunnelled wood. This work investigated details of the
animal biodiversity that vacant teredinid-tunnels may promote. Of particular interest was
a fish, Parioglossus interruptus (Ptereleotridae) found in teredinid tunnels when
emersed, and a spider, Desis martensi (Desidae) found in teredinid tunnels when
immersed (Chapter 6). This study also aims to reveal an unusual ecosystem service – the
WMP
Figure 1.9, The distributions of the world’s mangrove forests according to the number of different tree
species. The world’s mangrove forests illustrated as different colours according to the number of different
tree species common to those areas. The forests of the WMP are located in the region with the greatest
number of different trees, between 36 – 46 species. Figure adapted from Polidoro et al., (2010).
19
promotion of biodiversity created by teredinids by understanding how and why animals
exploit vacant teredinid tunnels. Finally, this study draws upon the results and then
reviews the data within a wider context by discussing implications of the effect of
increasing sea-levels and decreasing pH upon mangrove tree distributions, the
biodegradation processes and the Teredinidae (Chapter 7).
Using allometric equations, basal areas of mangrove trees were used to calculate
biomass. Regression methods were not used, as the felling of trees is required (Kairo et
al., 2009). The volume of fallen wood was measured within mangrove forests from the
strandline to the seaward edge to determine the amount of LWD available to organisms.
All organisms found within teredinid-attacked LWD were identified to their lowest
achievable taxonomic classification. Salinity, emersion time, and temperature were
measured to determine if the abundance and distribution of all biodegrading organisms
and mangrove fauna within vacant teredinid tunnels were influenced by those variables.
This study tested the hypotheses that mangrove forests in the WMP will have 1.
site-specific biodegrading organisms upon woody detritus, and 2. mangrove forests in
the WMP will have specific environmental factors that influence the distribution of the
biodegrading organisms upon LWD. Furthermore, the Teredinidae will, 3. significantly
breakdown LWD through their tunnelling, and 4. enhance ecosystem-level biodiversity
within the mid- to low- intertidal areas of the forests through their tunnelling. Finally,
this study predicts that through teredinid modification of the environment and habitat
creation for other animals, the Teredinidae should be considered as ecosystem engineers.
20
Chapter 2
MANGROVE FORESTS OF THE WAKATOBI MARINE PARK,
EAST SULAWESI, INDONESIA
2.1. Introduction
Mangrove trees are a source of leaf litter and carbon via large woody detritus
(LWD) (Donato et al., 2011), and fallen trees support food webs (Robertson and
Daniel, 1989a, Maria and Sridhar, 2003). However, the contribution of fallen wood is
much less understood than that of leaf litter with respect to nutrient recycling
(Kristensen et al., 2008), even though the majority of mangrove biomass is wood (Ong
et al., 1995). The standing stock of mangrove-derived carbon can rival and surpass that
of other marine systems such as coral reefs (Alongi, 2007; Alongi, 2009). One very
detailed investigation of Indo-pacific mangrove forests has estimated whole ecosystem
carbon storage, which demonstrated that these forests are effective carbon sinks, and
they are the most carbon-rich ecosystems in the Indo-Pacific (Donato et al., 2011).
Mangrove forest biomass can vary greatly with latitude and within sites (Komiyama et
al., 2008; Alongi, 2009; Donato et al., 2011).
Mangrove forest above-ground biomass varies from as low as 7.9 t ha-1
for a
Rhizophora mangle forest in Florida (Lugo and Snedaker, 1974) to as high as 436.4 t
ha-1
for a Bruguiera-dominated forest in eastern Indonesia and 460 t ha-1
in a
Rhizophora apiculata dominated forest in Malaysia (Komiyama et al., 2008).
Patchiness in above-ground biomass has also been reported within individual
mangrove forests. The differences of biomass can change with the tidal heights of

21
mangrove trees. In an Indonesian mangrove forest, Sonneratia sp. found at the
outermost seaward edge had the lowest total biomass, 169.1 t ha-1
, in the mid-intertidal
estimates for Rhizophora sp. totaled 356.8 t ha-1
and for the Bruguiera sp. recorded at
the strandline a total above-ground biomass of 436.4 t ha-1
was recorded (Komiyama et
al., 2008), with much of the carbon sequestered into mangrove sediments (Donato et
al., 2011).
Pristine, well-developed mangrove forests contain trees with a greater basal area,
tree height, density and species diversity (Roth, 1992) - such as the mangrove forests of
the large deltaic systems in Papua (Tomascik et al., 1997; Alongi, 2009).
There are many ways to define the structure and composition of a mangrove
forest. Forest structure and composition are determined by the tree species, density,
dominance and the distribution of trees (McElhinny et al., 2005). The diversity of tree
taxa within a forest can be used as a measure of mangrove forest complexity (Bosire et
al., 2006). Mangrove tree basal-area can be used as a measure of woody biomass -
studies have demonstrated that tree girths alone can be used to calculate biomass using
various allometric equations (Komiyama et al., 2008). However, tree girths and the
distributions of trees are determined by environmental variables such as the degree of
tidal immersion (Jimenez and Sauter, 1991; Pi et al., 2009), soil chemistry and salinity
(Joshi and Ghose, 2003; Krauss et al., 2008).
This study aims to determine whether the mangrove trees within each forest are a
source of LWD that may serve mangrove food webs. Also, do the mangrove trees have
particularly large basal areas compared with other forests? Tree species basal areas
within each forest were used to calculate mangrove tree biomass, using allometric
equations (Komiyama et al., 2005; Komiyama et al., 2008) as this method is less
22
intrusive and less destructive than regression methods – as the felling of trees is required
to determine their dry weights (Kairo et al., 2009). This study also aims to reveal the
environmental variables that determine tree-species dominance, abundance and their
distributions within different mangrove forests within the WMP.
2.2. Materials and methods
2.2.1 Belt transects, tree identification, and measurements of emersion time and
salinity
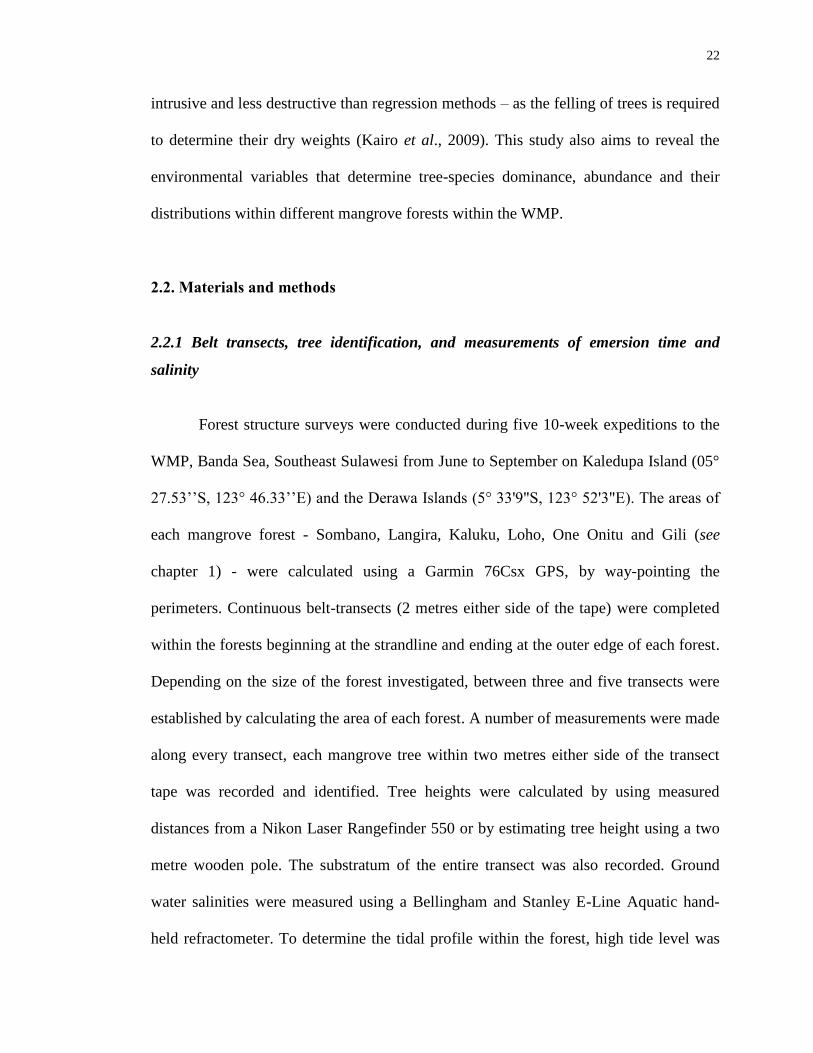
Forest structure surveys were conducted during five 10-week expeditions to the
WMP, Banda Sea, Southeast Sulawesi from June to September on Kaledupa Island (05°
27.53’’S, 123° 46.33’’E) and the Derawa Islands (5° 33'9"S, 123° 52'3"E). The areas of
each mangrove forest - Sombano, Langira, Kaluku, Loho, One Onitu and Gili (see
chapter 1) - were calculated using a Garmin 76Csx GPS, by way-pointing the
perimeters. Continuous belt-transects (2 metres either side of the tape) were completed
within the forests beginning at the strandline and ending at the outer edge of each forest.
Depending on the size of the forest investigated, between three and five transects were
established by calculating the area of each forest. A number of measurements were made
along every transect, each mangrove tree within two metres either side of the transect
tape was recorded and identified. Tree heights were calculated by using measured
distances from a Nikon Laser Rangefinder 550 or by estimating tree height using a two
metre wooden pole. The substratum of the entire transect was also recorded. Ground
water salinities were measured using a Bellingham and Stanley E-Line Aquatic hand-
held refractometer. To determine the tidal profile within the forest, high tide level was
23
marked on mangrove trees using high visibility string. At low tide, the distances from
the substratum to the mark on each tree were measured and then subtracted from the
mark of seawater at high tide to establish the height above sea level. Emersion times
were estimated by relating the tidal heights to chart datum in regional tide tables.
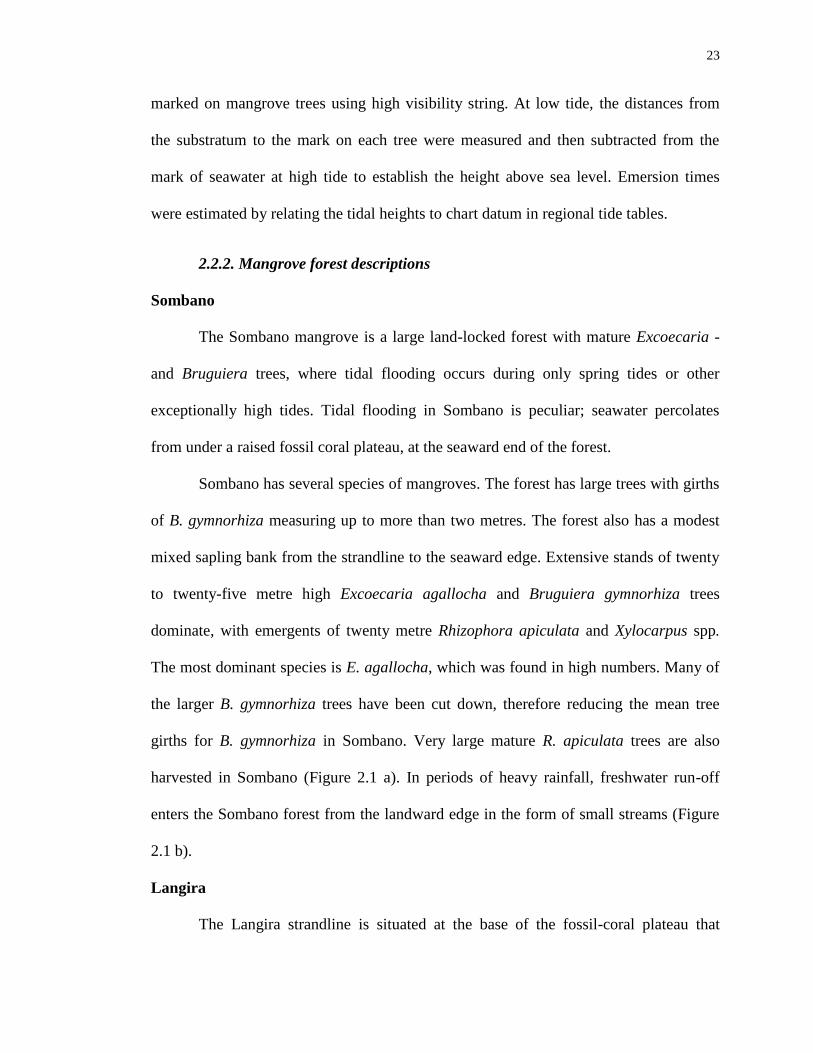
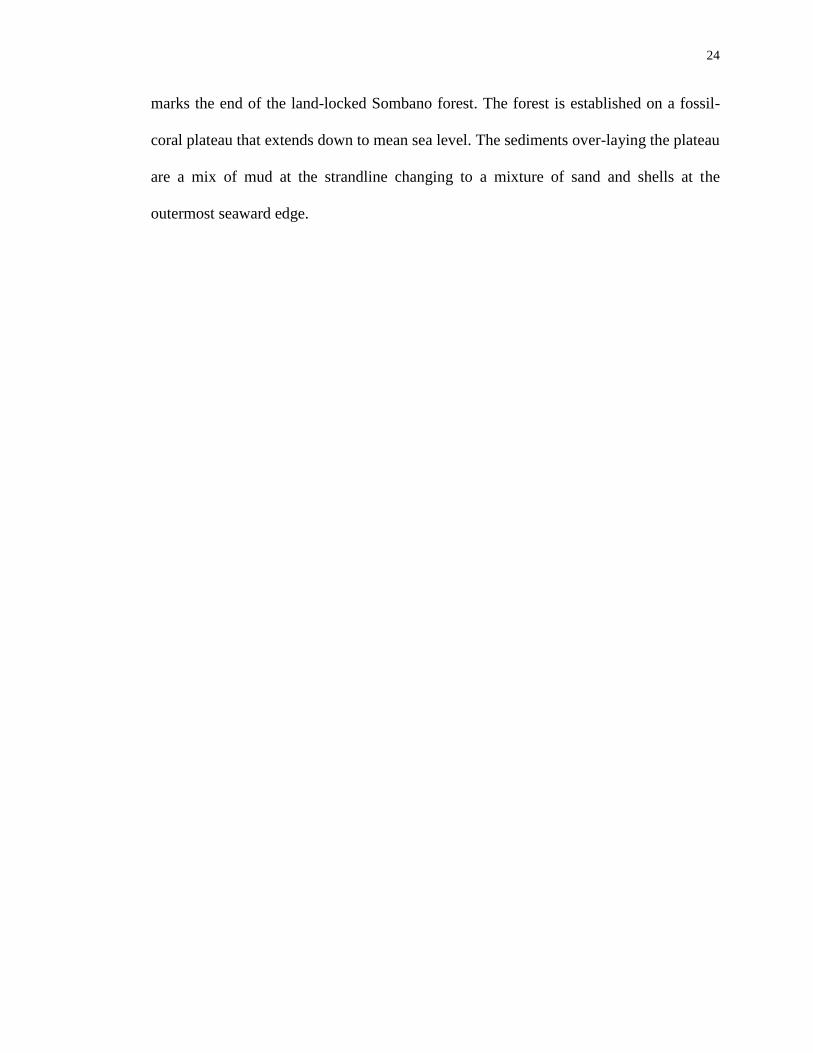
2.2.2. Mangrove forest descriptions
Sombano
The Sombano mangrove is a large land-locked forest with mature Excoecaria -
and Bruguiera trees, where tidal flooding occurs during only spring tides or other
exceptionally high tides. Tidal flooding in Sombano is peculiar; seawater percolates
from under a raised fossil coral plateau, at the seaward end of the forest.
Sombano has several species of mangroves. The forest has large trees with girths
of B. gymnorhiza measuring up to more than two metres. The forest also has a modest
mixed sapling bank from the strandline to the seaward edge. Extensive stands of twenty
to twenty-five metre high Excoecaria agallocha and Bruguiera gymnorhiza trees
dominate, with emergents of twenty metre Rhizophora apiculata and Xylocarpus spp.
The most dominant species is E. agallocha, which was found in high numbers. Many of
the larger B. gymnorhiza trees have been cut down, therefore reducing the mean tree
girths for B. gymnorhiza in Sombano. Very large mature R. apiculata trees are also
harvested in Sombano (Figure 2.1 a). In periods of heavy rainfall, freshwater run-off
enters the Sombano forest from the landward edge in the form of small streams (Figure
2.1 b).
Langira
The Langira strandline is situated at the base of the fossil-coral plateau that
24
marks the end of the land-locked Sombano forest. The forest is established on a fossil-
coral plateau that extends down to mean sea level. The sediments over-laying the plateau
are a mix of mud at the strandline changing to a mixture of sand and shells at the
outermost seaward edge.
25
a b
c d
e f
g
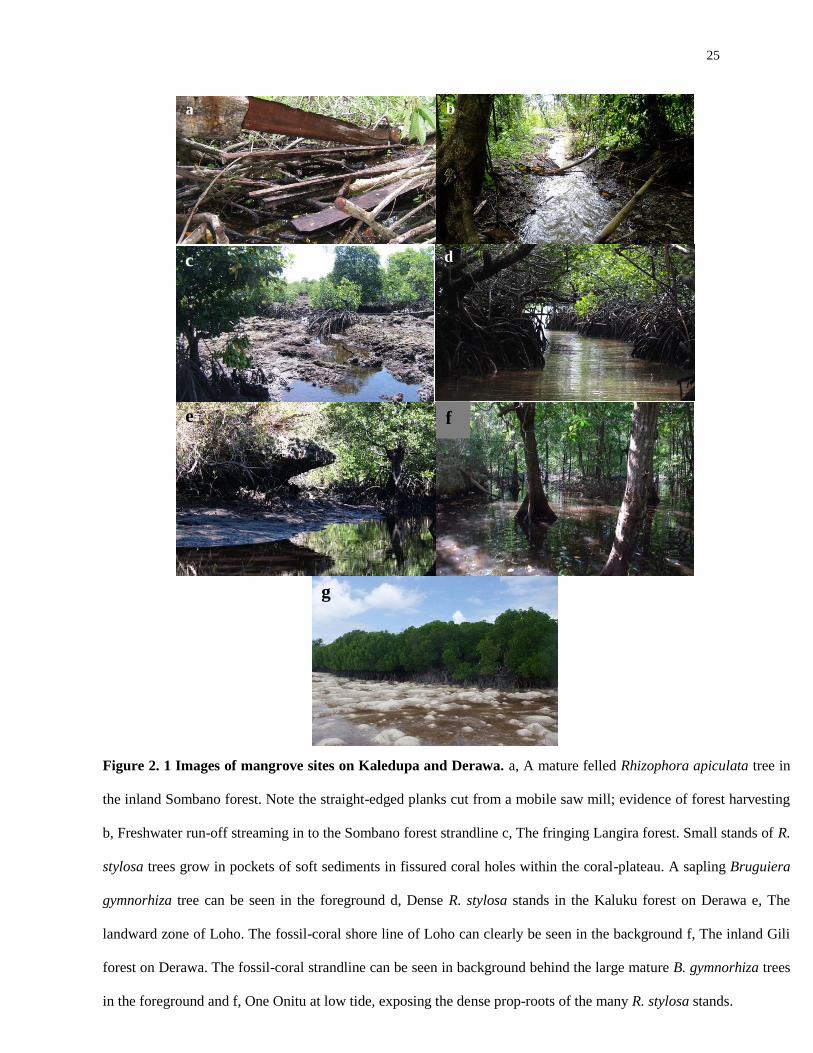
Figure 2. 1 Images of mangrove sites on Kaledupa and Derawa. a, A mature felled Rhizophora apiculata tree in
the inland Sombano forest. Note the straight-edged planks cut from a mobile saw mill; evidence of forest harvesting
b, Freshwater run-off streaming in to the Sombano forest strandline c, The fringing Langira forest. Small stands of R.
stylosa trees grow in pockets of soft sediments in fissured coral holes within the coral-plateau. A sapling Bruguiera
gymnorhiza tree can be seen in the foreground d, Dense R. stylosa stands in the Kaluku forest on Derawa e, The
landward zone of Loho. The fossil-coral shore line of Loho can clearly be seen in the background f, The inland Gili
forest on Derawa. The fossil-coral strandline can be seen in background behind the large mature B. gymnorhiza trees
in the foreground and f, One Onitu at low tide, exposing the dense prop-roots of the many R. stylosa stands.

26
The substratum is interspersed with many crowns of fissured coral-rocks
protruding through. In places, the fossil-coral becomes exposed, with numerous coral
holes consisting of calcareous mud. Langira had many large open channels also
consisting of calcareous mud with dense seagrass beds over laying these channelled
areas. Distinct zonation patterns of trees was observed, with Rhizophora apiculata found
at the strandline, and R. stylosa populations extending out into the eulittoral zones. The
Rhizophora trees in Langira were very shrubby, and were established in coral sink-holes
(Figure 2. 1 c). Tree canopies are very patchy, and maximum tree heights reach no more
than twelve metres, with trees averaging four meters.
The Rhizophora and Bruguiera trees attained the largest basal area within
Langira. Thus, those trees were important contributors to the total forest biomass. High
densities of R. stylosa were found in Langira. Bruguiera gymnorhiza had the greatest
tree-girths with some trees measuring almost two metres in girth as did a few
Xylocarpus granatum trees. Xylocarpus spp. were found only at the strandline.
Kaluku
The Kaluku forest (Figure 2. 1 d) is constrained at the landward edge by a fossil-
coral wall. The forest is inundated by all tides, and no salinity gradient was found.
Kaluku had almost mono-specific stands of R. stylosa, with very few S. alba trees.
Located at the landward edge of Kaluku outside of the chosen plots, Bruguiera
gymnorhiza, Xylocarpus granatum and Pemphis acidula were present. R. stylosa trees
were densely populated in Kaluku, the girth of these trees were comparatively small and
therefore the total basal area was also small compared to the very large biomass of the
few S. alba trees.

27
Loho
The Loho forest was the largest of the mangrove forests surveyed on Derawa.
The forest is established within a sheltered bay and contains a large abundance of R.
stylosa trees. Lining the Loho strandline was a large fissured, over-hanging fossil-coral
embankment (Figure 2. 1 e). Within the forest from the strandline and out to the seaward
edge, R. stylosa was the dominant species in relation to both abundance and basal area.
B. gymnorhiza stands were also present, this species was only located at the landward
zones within the plots with trees up to sixteen meters in height located within the belt
transect.
Gili
The Gili forest on Derawa was separated with the One Onitu forest by a fossil-
coral plateau, similar to that of the Sombano and Langira mangrove forests. The Gili
forest is an inland forest surrounded by a fossil-coral wall (Figure 2. 1 f).The forest is
the smallest of all the sites studied. Seawater enters the forest through a tunnel under the
fossil-coral plateau that separates Gili and One Onitu. The Gili forest is inundated by all
tides, except neap tides less than 1.4 metres above sea level. No difference of tidal
height was found from the strandline to the seaward edge. The middle region of the
forest had the lowest recorded emersion times when compared to the landward and the
outermost seaward edges suggesting that the middle region of the forest was ‘sunken’
compared to the outer edges of the forest - similar to the topography of the Sombano
forest. The composition of the substratum changed with distance from the land. Within
the landward regions, the substratum consisted of a thick organic-rich mud - in places
the mud was more than forty centimeters deep. The middle area of the forest had a
calcareous mud substratum, although the area where seawater enters into the forest the

28
substrata was predominantly sand. The changing substratum was a determining factor
for the tree distributions within Gili. S. alba were found only in sand-dominated
substrata, whereas R. apiculata dominated in areas of thick organic-rich mud. The most
abundant tree species within Gili was Bruguiera gymnorhiza and the forest also had a
young bank of Rhizophoraceae saplings. Large, mature Sonneratia alba trees were
present at the seaward zone, and Rhizophora apiculata were in the landward regions.
One Onitu
On the exposed seaward edge of the fossil-coral plateau in front of the inland
Gili forest is One Onitu (Figure 2. 1 g). Like the Langira forest, One Onitu also has
connectivity to seagrass and reefs. The entire One Onitu forest is established in the high
intertidal and no difference was found with emersion time across the forest. B.
gymnorhiza trees were found in areas with higher emersion times. Furthermore, the
substratum in the forest consisted of calcareous mud. R. stylosa trees were the most
common species in One Onitu with very few B. gymnorhiza and S. alba trees.
In the Derawa forests, anthropogenic impact was slight and removal of mangrove
material was minimal. However, the Kaledupan mangrove forests, Sombano and Langira
are exposed to a high level of wood harvesting. The constant sound of chain-saws
echoed in Sombano. Frequent evidence of felled mature R. apiculata and B. gymnorhiza
trees are observed with many clearings with fresh milled debris consisting of saw dust
and straight-edged cut planks being found within Sombano. Large bundles of newly
felled young B. gymnorhiza trees were also found and large amounts of B. gymnorhiza
trees were observed in storage beneath the houses of local residence living on Kaledupa.
Furthermore, the abundant R. stylosa trees in Langira were cut on a daily basis. Unlike
the case in Sombano, whole trees in Langira were not often cut down; however branches
29
were harvested for fish fences. The level of cutting in Langira is high, with almost every
tree within the forest experiencing some degree of harvesting.
2.2.3 Tree densities and species basal area
Along each of the transects within the Sombano and Langira mangrove forests,
replicate 20 x 20 m plots were selected at random from a total of between five and 25
plots depending upon the length of the transect. Sombano had a total of 22 plots and
Langira had a total of 19 plots. For the forests in Derawa two 10 x 10 m plots were
selected at random from a total of between three and 12 plots depending upon the length
of each transect. In the Kaluku forest a total of 12 plots in six transects were established.
In the Loho forest, 10 plots in five transects were established. In the One Onitu forest, 15
plots in five transects were established. In the Gili forest six plots in three transects were
established (Table 2.1). To determine the basal areas of each tree species within the plots
between the sites, diameter at breast height (DBH), or the circumference at breast height
(CBH) of each tree were recorded using the equation r2
(where = 3.142 x radius2).
The radius was calculated by dividing the circumference by x 2, or by dividing the
diameter by 2.

30
Plots
Site Transect 1 2 3 4 5 Sombano 1 100 140 240 260 340
2 100 140 240 260 340
3 100 140 240 260 340
4 100 140 240 260
5 100 140 240 Langira 1 0 160 320 440 460
2 0 160 320 440 460
3 0 160 320
4 0 160 320
5 0 160 320
Kaluku 1 20 30
2 0 10
3 0 20
4 0 20
5 10 20
6 0 50
Loho 1 10 40
2 0 20 40
3 10 50
4 80 150
5 20 One Onitu 1 0 20 30 60
2 10 40 50 70
3 0 40 60
4 40 70
5 30 70
Gili 1 30 70
2 0 10
3 10 30
Table 2.1 Plots labelled 1-5 used to measure mangrove tree basal areas and tree
species density within each site and transect. Numbers within each site are the
distance from the landward edge – the strandline (metres).

31
2.3 Data analysis
The univariate and non-parametric multivariate techniques, of multidimensional
scaling plots (MDS) distance-based linear modelling (DISTLM) and DIVERSE analyses
contained in the PRIMER 6 (Plymouth Routines in Multivariate Ecological Research)
package were used to explore forest characteristics. Similarities of botanical
communities between the sites were displayed using non-metric MDS plots. To
investigate spatial patterns of similarity, each mangrove forest was grouped by
overlaying data from a Bray-Curtis Cluster analysis. DISTLM was employed to verify
relationships between emersion time, distance from the land (DFL), salinity and
substratum type with the mangrove trees. DISTLM produces a sequential test, which
assesses the variation each predictor (environmental variable) has on its own, and a
conditional test, which explains the variation of all the variables (McArdle and
Anderson, 2001). The most parsimonious model was identified using the Akaike
information criterion (AIC). AIC ranks models from all possible combinations of the
environmental variables. Distance-based redundancy analyses (dbRDA) were used for
visualizing the results as an ordination, constrained to linear combinations of the
predictor variables. The DISTLM was based on abundance data with 4999 permutations.
To measure variation in botanical diversity between forests the following
measurements were used, total species = S, total individuals = N, Pielou’s evenness = J’
and Shannon-Weiner diversity index = H’. The Shannon-Weiner index is calculated by,
H’ = - pi ln pi, where pi is the proportion of individuals that taxon i contributes to the
total sampled population. Pielou’s evenness was expressed by; J¢ = H¢/H¢max, where
32
H¢max is the maximum value of diversity for the number of taxa present (see Magurran,
2004 for details).
2.4 Results
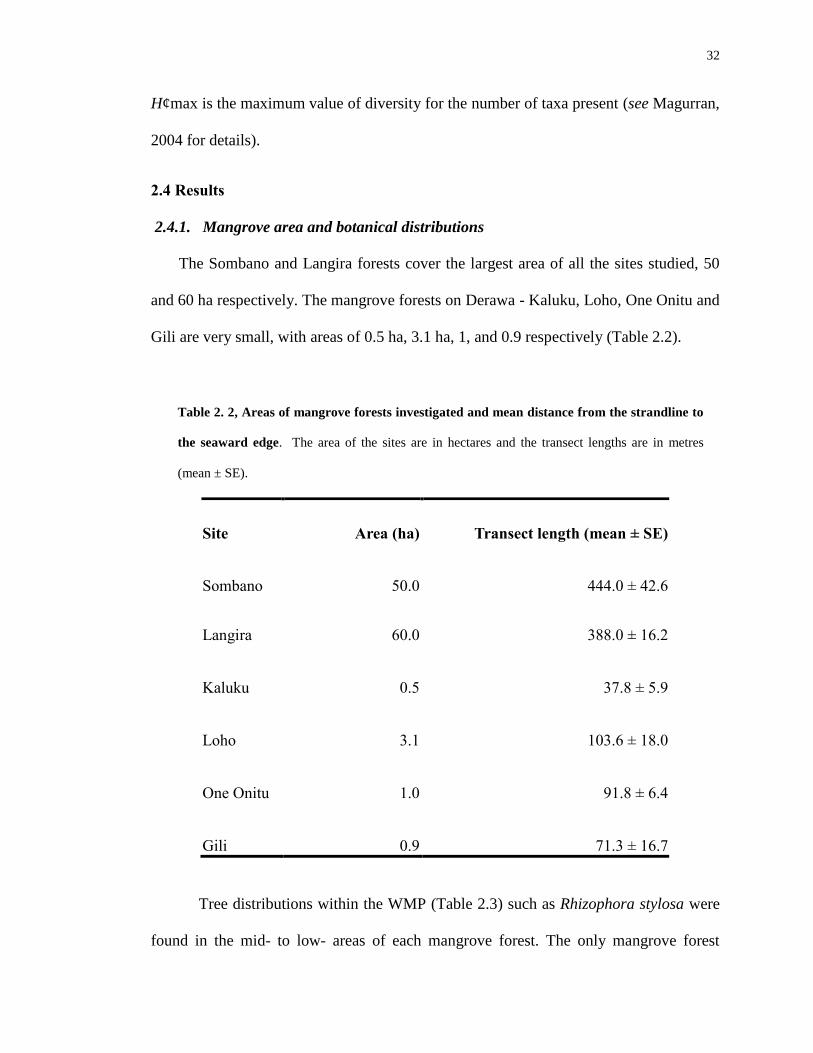
2.4.1. Mangrove area and botanical distributions
The Sombano and Langira forests cover the largest area of all the sites studied, 50
and 60 ha respectively. The mangrove forests on Derawa - Kaluku, Loho, One Onitu and
Gili are very small, with areas of 0.5 ha, 3.1 ha, 1, and 0.9 respectively (Table 2.2).
Site Area (ha) Transect length (mean ± SE)
Sombano 50.0 444.0 ± 42.6
Langira 60.0 388.0 ± 16.2
Kaluku 0.5 37.8 ± 5.9
Loho 3.1 103.6 ± 18.0
One Onitu 1.0 91.8 ± 6.4
Gili 0.9 71.3 ± 16.7
Tree distributions within the WMP (Table 2.3) such as Rhizophora stylosa were
found in the mid- to low- areas of each mangrove forest. The only mangrove forest
Table 2. 2, Areas of mangrove forests investigated and mean distance from the strandline to
the seaward edge. The area of the sites are in hectares and the transect lengths are in metres
(mean ± SE).

33
Table 2. 3, Mangrove plant species found in the WMP. Sites: S = Sombano, L = Langira, K =
Kaluku, Lo = Loho, O = One Onitu & G = Gili. Taxonomic authorities were obtained from the
International Plant Names Index.
investigated without R. stylosa is the land-locked Sombano forest. Rhizophora apiculata
was found in every forest accept Loho and One Onitu. Bruguiera gymnorhiza occurred
at each forest and Sonneratia alba was found in every site except Sombano.
Species Family Sites
Acanthus ebracteatus Vahl. Acanthaceae S
Acrostichum speciosum Willd. Pteridaceae S
Aegiceras floridum Roem. & Schult. Myrsinaceae L
Avicennia marina Vierh. Avicenniaceae L
Bruguiera cylindrica Blume. Rhizophoraceae S
Bruguiera gymnorhiza (L.) Sav. Rhizophoraceae S, L, K, Lo, O, G
Casuarina equisetifolia J.R. Forst. & G. Forst. Casuarinaceae L
Cordia subcordata Lam. Boraginaceae L
Crinum asiaticum L. Amaryllidaceae L
Derris trifoliata Lour. Leguminosae S
Drynaria quercifolia (L.) J. Sm. Polypodiaceae S
Dolichandrone spathacea K. Schum. Bignoniaceae S
Excoecaria agallocha L. Euphorbiaceae S
Ficus sp. Moraceae S
Heritiera littoralis (Dryand.) Sterculiaceae S
Hibiscus tiliaceus L. Malvaceae L
Nypa fruticans Wurmb. Arecaceae S
Osbornia octodonta F. Muell. Myrtaceae L
Pemphis acidula Forst. Lythraceae L, K
Rhizophora apiculata Blume. Rhizophoraceae S, L, K, G
Rhizophora stylosa Griff. Rhizophoraceae L, K, Lo, O, G
Sonneratia alba Griff. Sonneratiaceae L, K, Lo, O, G
Xylocarpus granatum Koen. Meliaceae S, L, K
Xylocarpus moluccensis M. Roem. Meliaceae S, L

34
2.4.2. Environmental factors
Salinity
The lowest salinity levels of this study were recorded from Sombano, which had
a brackish water environment (Table 2.4). In Sombano a gradient of salinity from the
strandline was recorded, beginning at zero PSU and increasing to twenty-eight PSU at
the seaward edge (refer to Figure 2.2). Conversely, no salinity gradients were observed
in Langira, Kaluku, Loho, One Onitu and Gili - as salinities were almost fully marine
ranging from 31.5 – 34.8 PSU.
Site Salinity
Sombano 15.3 ± 0.7
Langira 33.3 ± 0.1
Kaluku 34.4 ± 0.2
Loho 31.5 ± 0.2
One Onitu 32.2 ± 0.2
Gili 34.8 ± 0.2
Emersion
Emersion times (hours) within the high, middle and low intertidal zones differed
within and between the mangrove forests (Table 2.5). The Sombano and Gili forests had
Table 2.4, Mangrove forest variation of salinity levels. Salinity
measurements defined as PSU were recorded along each transect at
five metre intervals within every forest studied (mean ± SE).

35
the greatest emersion times in each intertidal zone when compared with the other sites.
Sombano and Gili are basin-type mangrove forests, which explain the long emersion
times recorded from the low-intertidal zones.Langira, Kaluku, Loho and One Onitu each
had similar emersion times when compared with each other within each intertidal zone.
Mangrove forest area
Site Strandline Centre Seaward
Sombano 18.5 ± 0.4 18.4 ± 0.3 20.8 ± 0.4
Langira 9.6 ± 1.1 6.5 ± 0.1 5.4 ± 0.1
Kaluku 8.8 ± 0.6 7.0 ± 0.2 5.3 ± 0.5
Loho 9.4 ± 1.1 6.4 ± 0.1 5.7 ± 0.2
One Onitu 8.6 ± 0.6 7.4 ± 0.7 7.3 ± 0.2
Gili 12.4 ± 0.1 11.9 ± 0.2 13.2 ± 0.4
Table 2.5, Variation in emersion time between different mangrove forests. The
intertidal zones of each forest include, the strandline designated as the high intertidal,
the centre of the mangrove is considered as the mid intertidal and the seaward fringing
areas have been classified as the low intertidal zones. Emersion is the time each
mangrove forest zone is not immersed in seawater over a 25 hour spring tidal cycle
(hours, mean ± SE).
*The Sombano and Gili forests both have a sump-like shore height profile. The centre
regions of both forests have the lowest recorded height above sea levels compared
with the strandline and seaward edges.
36
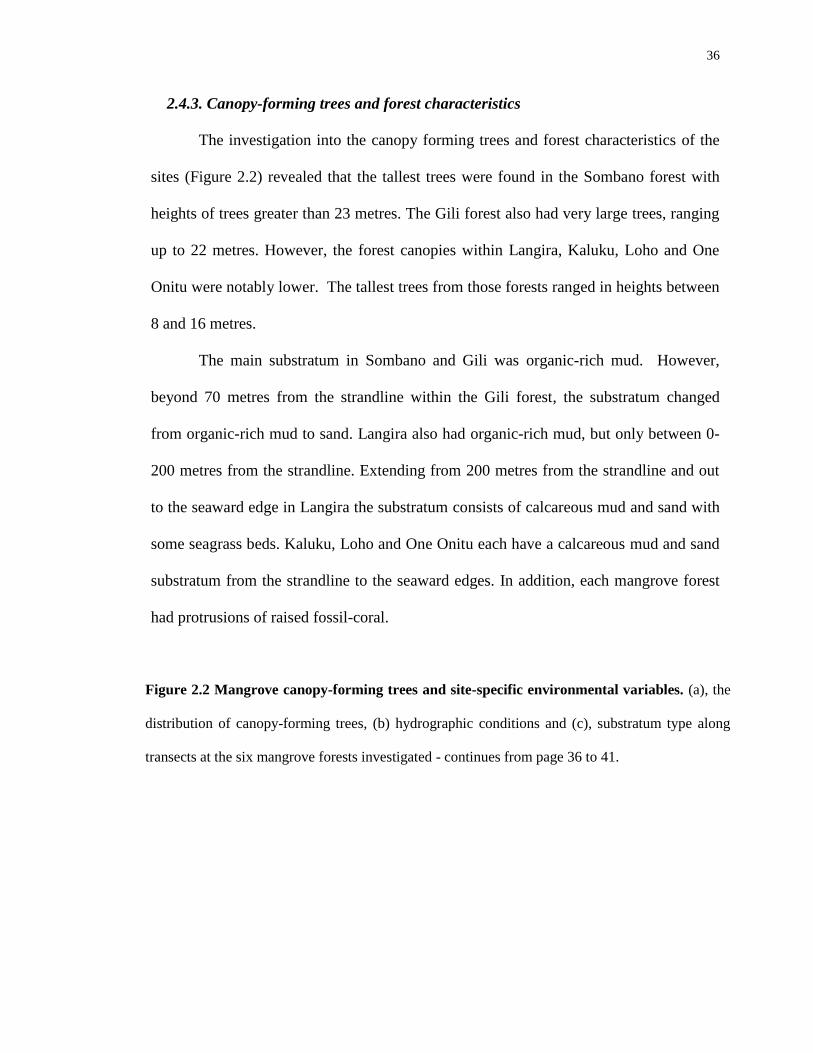
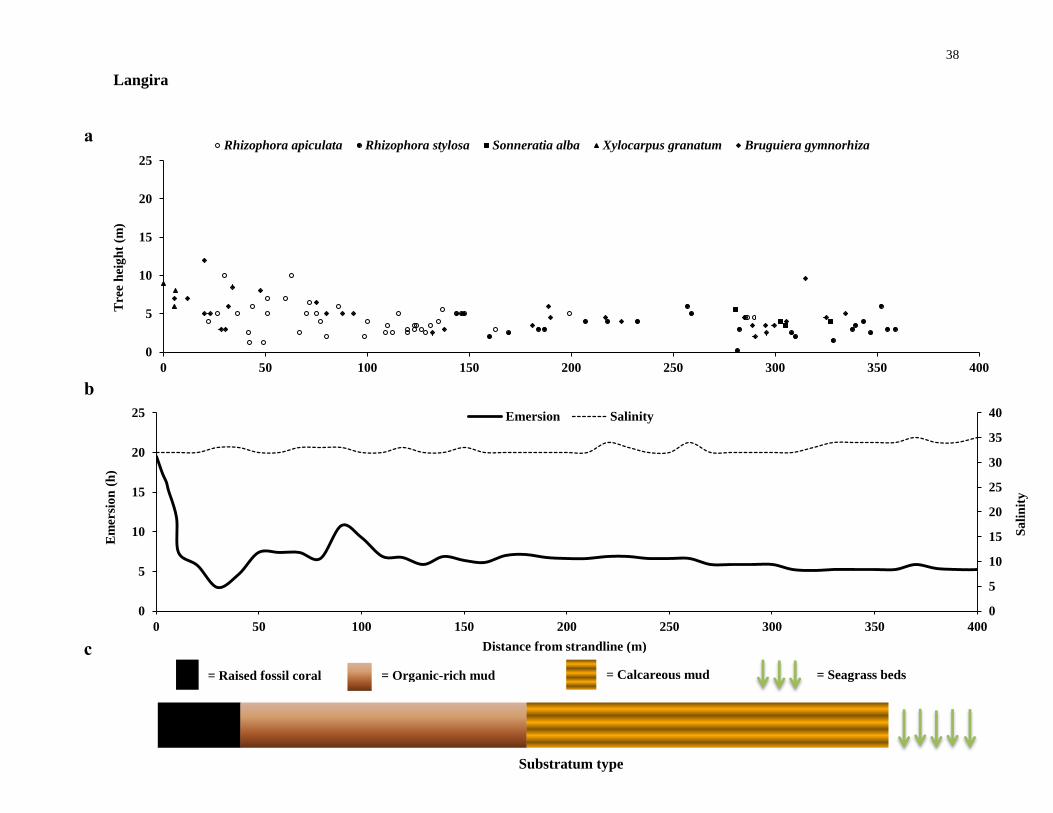
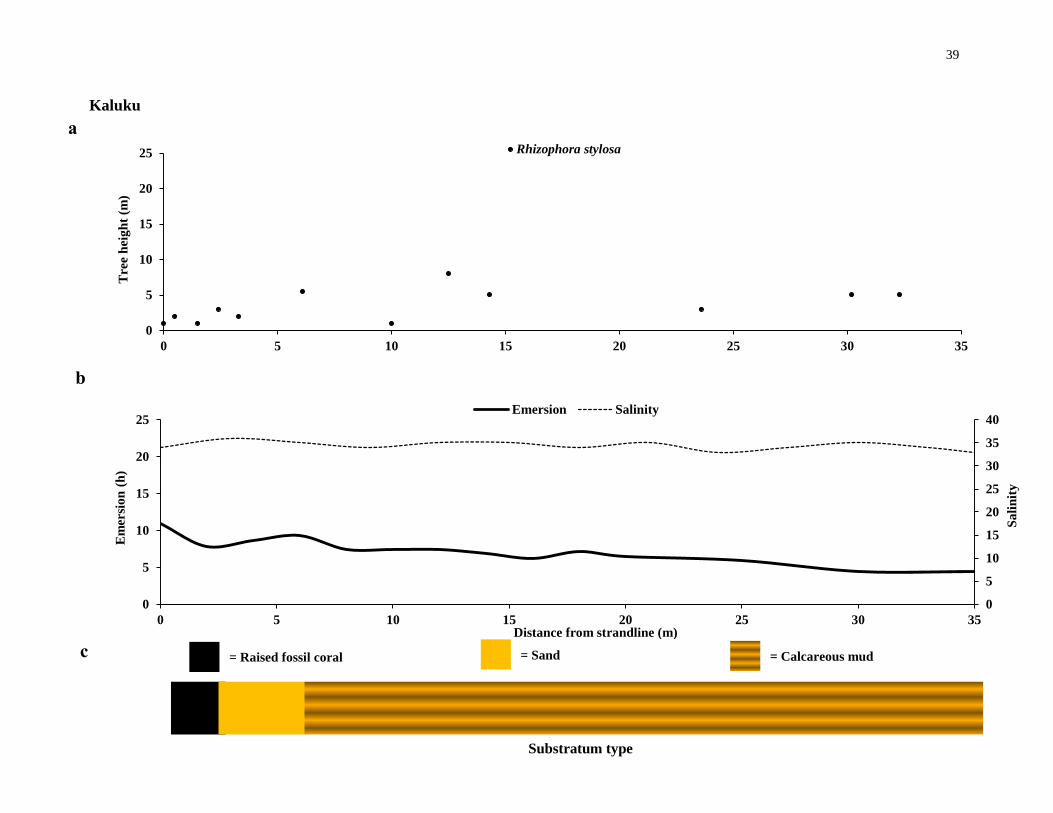
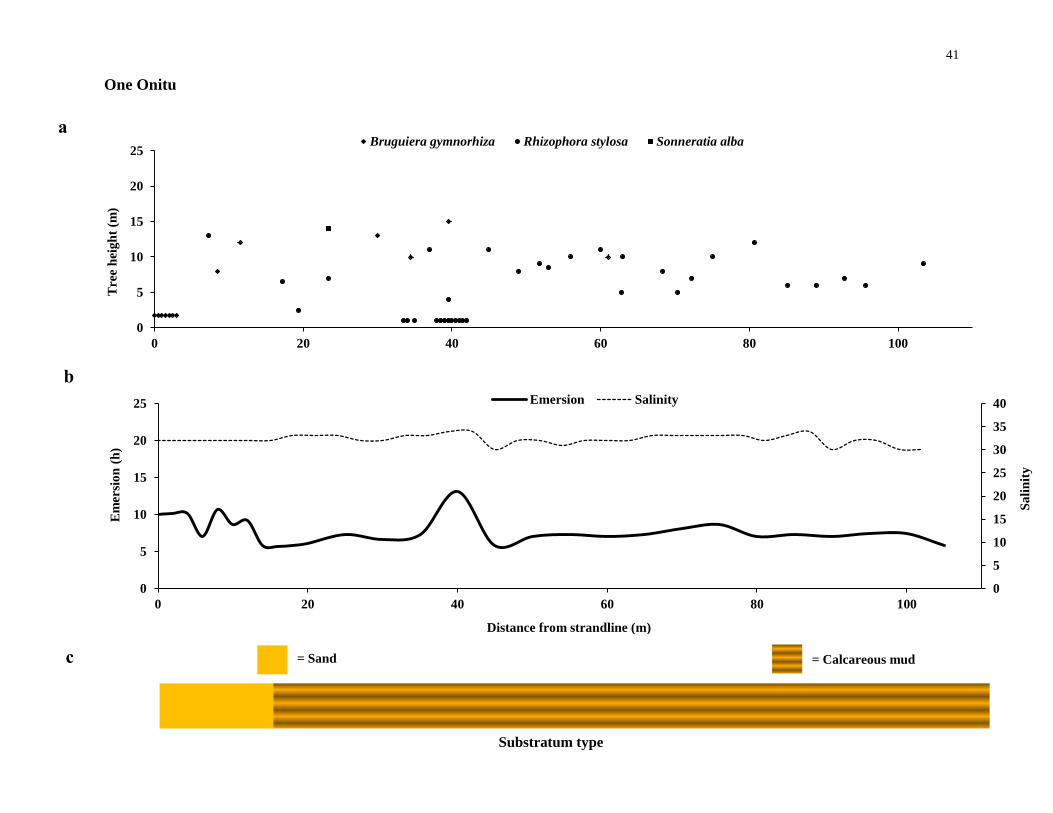
2.4.3. Canopy-forming trees and forest characteristics
The investigation into the canopy forming trees and forest characteristics of the
sites (Figure 2.2) revealed that the tallest trees were found in the Sombano forest with
heights of trees greater than 23 metres. The Gili forest also had very large trees, ranging
up to 22 metres. However, the forest canopies within Langira, Kaluku, Loho and One
Onitu were notably lower. The tallest trees from those forests ranged in heights between
8 and 16 metres.
The main substratum in Sombano and Gili was organic-rich mud. However,
beyond 70 metres from the strandline within the Gili forest, the substratum changed
from organic-rich mud to sand. Langira also had organic-rich mud, but only between 0-
200 metres from the strandline. Extending from 200 metres from the strandline and out
to the seaward edge in Langira the substratum consists of calcareous mud and sand with
some seagrass beds. Kaluku, Loho and One Onitu each have a calcareous mud and sand
substratum from the strandline to the seaward edges. In addition, each mangrove forest
had protrusions of raised fossil-coral.
Figure 2.2 Mangrove canopy-forming trees and site-specific environmental variables. (a), the
distribution of canopy-forming trees, (b) hydrographic conditions and (c), substratum type along
transects at the six mangrove forests investigated - continues from page 36 to 41.

37
0
5
10
15
20
25
0 50 100 150 200 250 300 350 400 450
Tre
e h
eig
ht
(m)
Bruguiera gymnorhiza Excoecaria agallocha Tree stumps Heritiera littoralis
Nypa fruticans Rhizophora apiculata Xylocarpus granatum Xylocarpus moluccensis
0
5
10
15
20
25
30
35
40
0
5
10
15
20
25
0 50 100 150 200 250 300 350 400 450
Sa
lin
ity
Em
ersi
on
(h
)
Emersion Salinity
Sombano
Substratum type
Distance from strandline (m)
= Raised fossil coral = Organic-rich mud
a
c
b
38
0
5
10
15
20
25
0 50 100 150 200 250 300 350 400
Tre
e h
eig
ht
(m)
Rhizophora apiculata Rhizophora stylosa Sonneratia alba Xylocarpus granatum Bruguiera gymnorhiza
0
5
10
15
20
25
30
35
40
0
5
10
15
20
25
0 50 100 150 200 250 300 350 400
Sa
lin
ity
Em
ersi
on
(h
)
Emersion Salinity
Langira
Substratum type
a
c
b
Distance from strandline (m)
= Raised fossil coral = Organic-rich mud = Calcareous mud = Seagrass beds
39
0
5
10
15
20
25
0 5 10 15 20 25 30 35
Tre
e h
eig
ht
(m)
Rhizophora stylosa
0
5
10
15
20
25
30
35
40
0
5
10
15
20
25
0 5 10 15 20 25 30 35
Sa
lin
ity
Em
ersi
on
(h
)
Emersion Salinity
Kaluku
Substratum type
a
c
b
= Raised fossil coral = Sand = Calcareous mud
Distance from strandline (m)

40
0
5
10
15
20
25
0 20 40 60 80 100 120
Tre
e h
eig
ht
(m)
Bruguiera gymnorhiza Rhizophora stylosa
0
5
10
15
20
25
30
35
40
0
5
10
15
20
25
0 20 40 60 80 100 120
Sa
lin
ity
Em
ersi
on
(h
)
Emersion Salinity
Loho
Substratum type
a
c
b
Distance from strandline (m) = Raised fossil coral = Calcareous mud
41
0
5
10
15
20
25
0 20 40 60 80 100
Tre
e h
eig
ht
(m)
Bruguiera gymnorhiza Rhizophora stylosa Sonneratia alba
0
5
10
15
20
25
30
35
40
0
5
10
15
20
25
0 20 40 60 80 100
Sa
lin
ity
Em
ersi
on
(h
)
Emersion Salinity
One Onitu
Substratum type
a
b
c
Distance from strandline (m)
= Sand = Calcareous mud
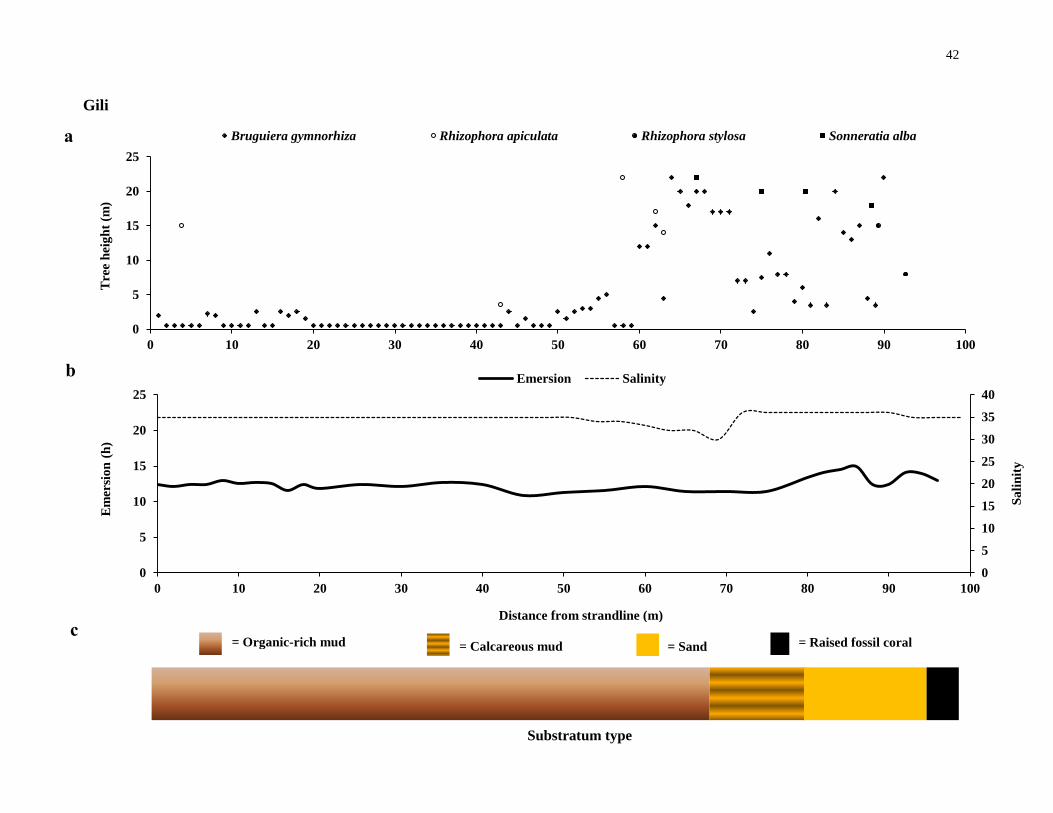
42
0
5
10
15
20
25
0 10 20 30 40 50 60 70 80 90 100
Tre
e h
eig
ht
(m)
Bruguiera gymnorhiza Rhizophora apiculata Rhizophora stylosa Sonneratia alba
0
5
10
15
20
25
30
35
40
0
5
10
15
20
25
0 10 20 30 40 50 60 70 80 90 100
Sa
lin
ity
Em
ersi
on
(h
)
Emersion Salinity
Gili
Substratum type
a
c
b
Distance from strandline (m)
= Organic-rich mud = Calcareous mud = Sand = Raised fossil coral

43
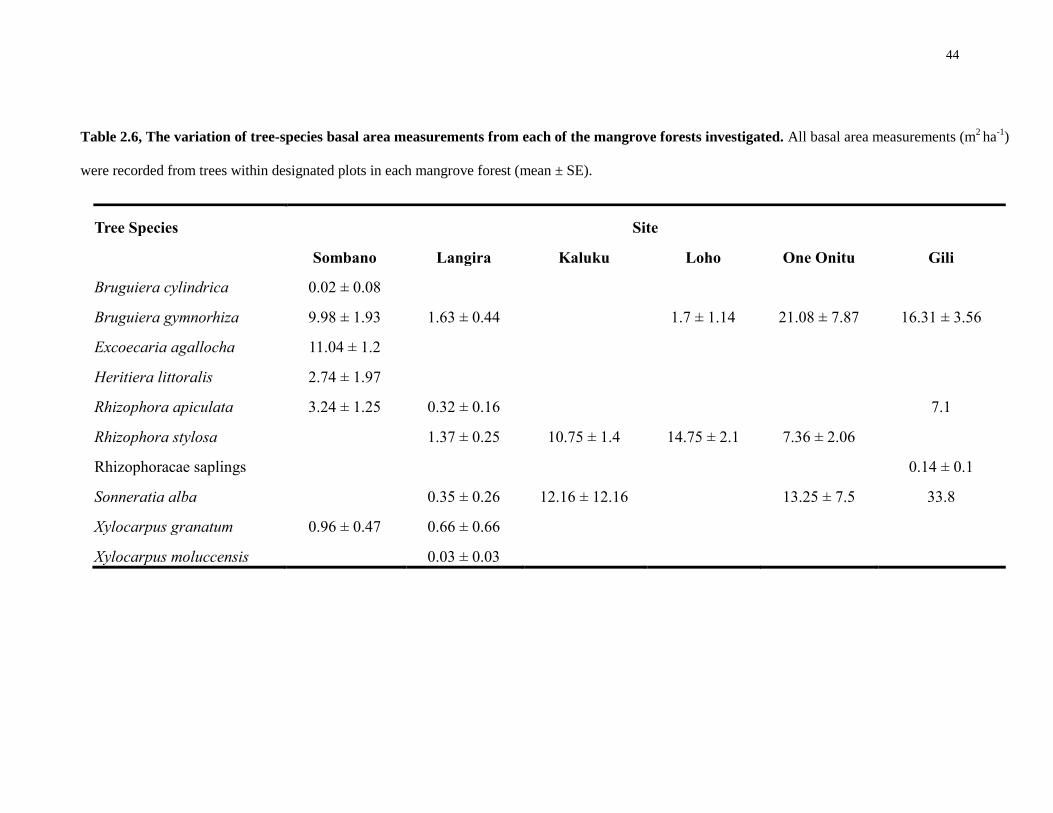
2.4.4. Tree species dominance - basal areas, biomass and tree densities
Basal areas of the species found varied considerably (Table. 2.6). Within
Sombano, E. agallocha and B. gymnorhiza were the most dominant species. The Langira
forest had lower basal areas in comparison to Sombano. However, the most dominant
species in Langira were B. gymnorhiza and R. stylosa. In Derawa, R. stylosa was
dominant within all forests except Gili. In Kaluku, the most dominant species was S.
alba, although only one species was recorded within the plots. Bruguiera gymnorhiza
was dominant in One Onitu and Gili, and S. alba had a large basal area within the Gili
forest – however, only one species was also recorded within the plots.
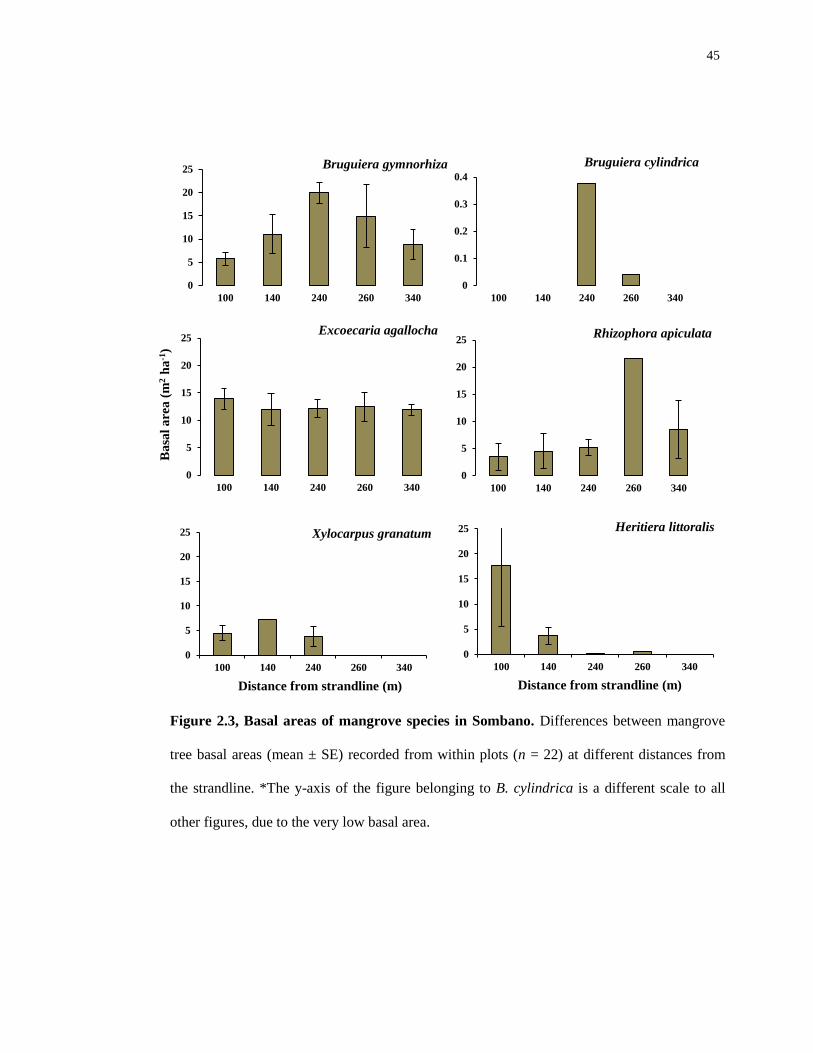
Basal area measurements of the E. agallocha trees in Sombano (Figure 2.3) were
dominant in each of the 22 plots investigated. Bruguiera gymnorhiza was also very
dominant, however in the landward regions this species was less dominant compared
with E. agallocha. Rhizophora apiculata was dominant in areas of the forest – but this
species was patchy. Heritiera littoralis was dominant at the strandline; however the
basal area measurements of this species decreased with increasing distance from the
strandline.
44
Tree Species Site
Sombano Langira Kaluku Loho One Onitu Gili
Bruguiera cylindrica 0.02 ± 0.08 Bruguiera gymnorhiza 9.98 ± 1.93 1.63 ± 0.44
1.7 ± 1.14 21.08 ± 7.87 16.31 ± 3.56
Excoecaria agallocha 11.04 ± 1.2 Heritiera littoralis 2.74 ± 1.97 Rhizophora apiculata 3.24 ± 1.25 0.32 ± 0.16
7.1
Rhizophora stylosa
1.37 ± 0.25 10.75 ± 1.4 14.75 ± 2.1 7.36 ± 2.06 Rhizophoracae saplings
0.14 ± 0.1
Sonneratia alba
0.35 ± 0.26 12.16 ± 12.16
13.25 ± 7.5 33.8
Xylocarpus granatum 0.96 ± 0.47 0.66 ± 0.66 Xylocarpus moluccensis
0.03 ± 0.03
Table 2.6, The variation of tree-species basal area measurements from each of the mangrove forests investigated. All basal area measurements (m2 ha
-1)
were recorded from trees within designated plots in each mangrove forest (mean ± SE).
45
0
5
10
15
20
25
100 140 240 260 340
Bruguiera gymnorhiza
0
0.1
0.2
0.3
0.4
100 140 240 260 340
Bruguiera cylindrica
0
5
10
15
20
25
100 140 240 260 340
Ba
sal
are
a (
m2 h
a-1
)
Excoecaria agallocha
0
5
10
15
20
25
100 140 240 260 340
Rhizophora apiculata
0
5
10
15
20
25
100 140 240 260 340
Distance from strandline (m)
Xylocarpus granatum
0
5
10
15
20
25
100 140 240 260 340
Distance from strandline (m)
Heritiera littoralis
Figure 2.3, Basal areas of mangrove species in Sombano. Differences between mangrove
tree basal areas (mean ± SE) recorded from within plots (n = 22) at different distances from
the strandline. *The y-axis of the figure belonging to B. cylindrica is a different scale to all
other figures, due to the very low basal area.

46
Within the Langira forest, Rhizophora stylosa was dominant in each of the 19
plots, the basal area measurements increased with increasing distance from the
strandline (Figure 2.4). Bruguiera gymnorhiza was also dominant within the plots
from Langira. R. apiculata was found only in regions at the high-intertidal.
Sonneratia alba had a low abundance and was very patchy, but the basal area was
large as these species have a large circumference. Xylocarpus granatum also had a
very low abundance in Langira and this species was found only at the strandline,
with some very large individuals.
In the plots from Kaluku only two tree species were recorded (Figure 2.5).
Rhizophora stylosa was very dominant and found in 11 of the 12 plots. Although
Sonneratia alba had a very large basal area measurement, this species was found
only in 1 plot located at the strandline.
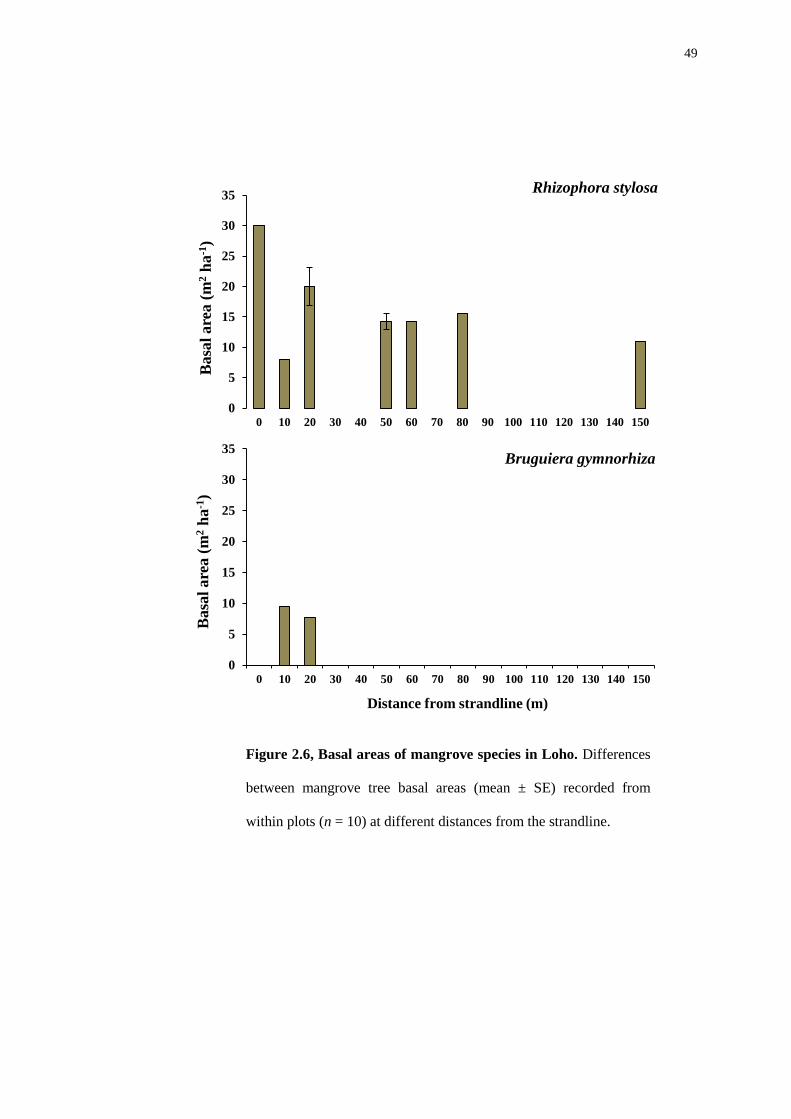
Within the Loho forest (Figure 2.6), Rhizophora stylosa was very dominant.
This species was found in 9 of the 10 plots. However, Bruguiera gymnorhiza had a
comparatively low basal area and was found close to the strandline.
Bruguiera gymnorhiza was dominant within the One Onitu forest from the
mid-intertidal and below (Figure 2.7). Rhizophora stylosa had a similar distribution
to B. gymnorhiza however this species was less dominant. Sonneratia alba was very
patchy, and found only from the strandline and down to the mid-intertidal - S. alba
was very dominant with very large basal area measurements.
The most dominant tree species in the Gili forest was Bruguiera gymnorhiza
(Figure 2.8). However, there were emergent Rhizophora apiculata trees found within
the mid-intertidal areas and Sonneratia alba trees found only at the seaward edges.
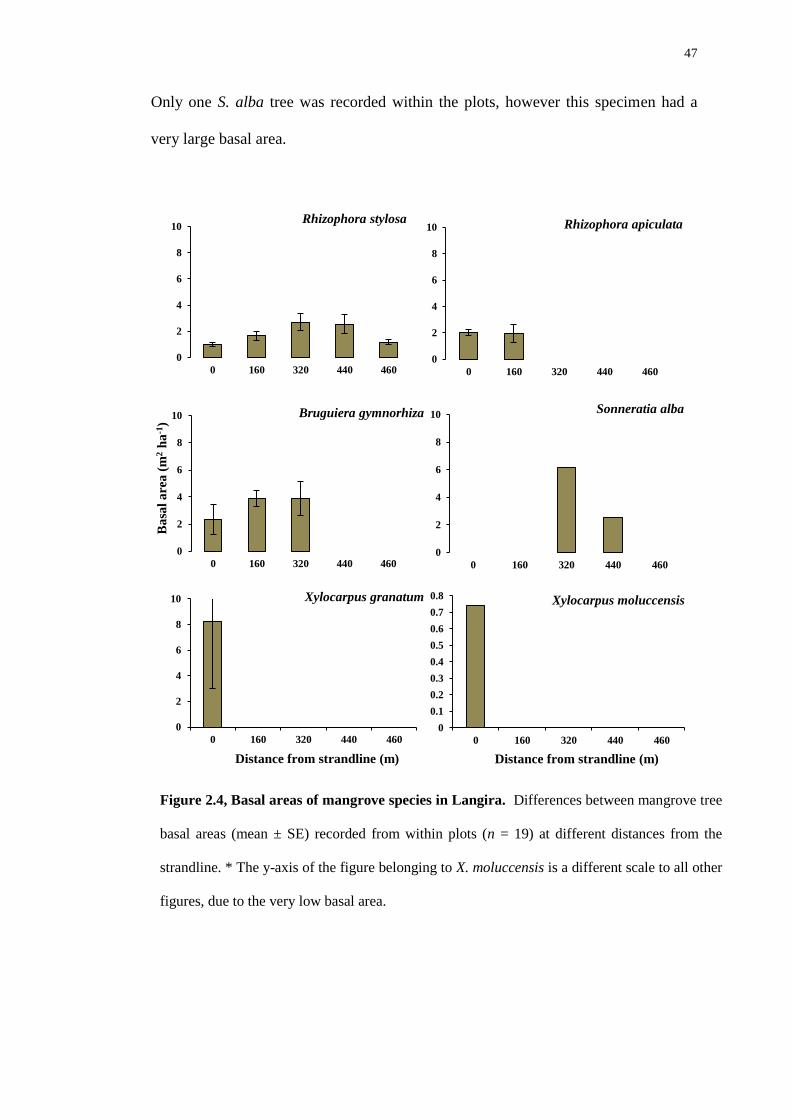
47
Only one S. alba tree was recorded within the plots, however this specimen had a
very large basal area.
0
2
4
6
8
10
0 160 320 440 460
Rhizophora stylosa
0
2
4
6
8
10
0 160 320 440 460
Rhizophora apiculata
0
2
4
6
8
10
0 160 320 440 460
Ba
sal
are
a (
m2 h
a-1
)
Bruguiera gymnorhiza
0
2
4
6
8
10
0 160 320 440 460
Sonneratia alba
0
2
4
6
8
10
0 160 320 440 460
Distance from strandline (m)
Xylocarpus granatum
0
0.1
0.2
0.3
0.4
0.5
0.6
0.7
0.8
0 160 320 440 460
Distance from strandline (m)
Xylocarpus moluccensis
Figure 2.4, Basal areas of mangrove species in Langira. Differences between mangrove tree
basal areas (mean ± SE) recorded from within plots (n = 19) at different distances from the
strandline. * The y-axis of the figure belonging to X. moluccensis is a different scale to all other
figures, due to the very low basal area.
48
0
20
40
60
80
100
120
140
0 10 20 30 40 50
Ba
sal
are
a (m
2 h
a-1
)
Rhizophora stylosa
0
20
40
60
80
100
120
140
0 10 20 30 40 50
Basa
l are
a (
m2 h
a-1
)
Distance from strandline (m)
Sonneratia alba
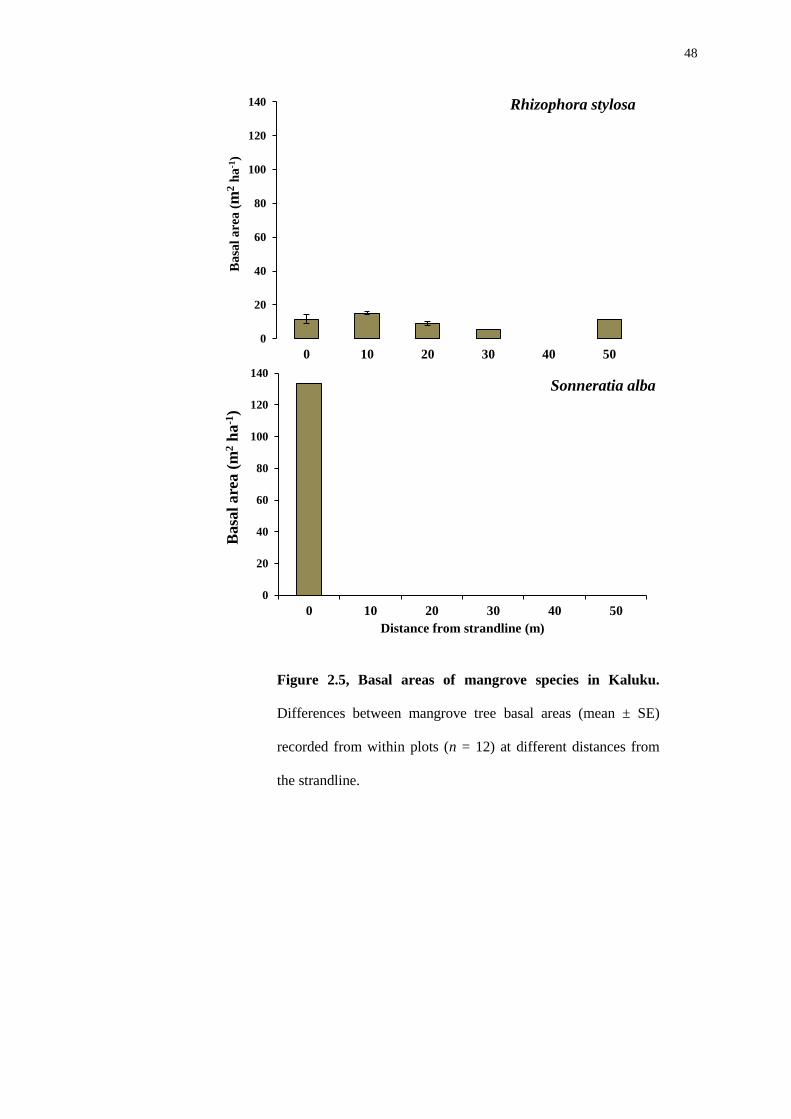
Figure 2.5, Basal areas of mangrove species in Kaluku.
Differences between mangrove tree basal areas (mean ± SE)
recorded from within plots (n = 12) at different distances from
the strandline.
49
0
5
10
15
20
25
30
35
0 10 20 30 40 50 60 70 80 90 100 110 120 130 140 150
Basa
l are
a (
m2 h
a-1
) Rhizophora stylosa
0
5
10
15
20
25
30
35
0 10 20 30 40 50 60 70 80 90 100 110 120 130 140 150
Basa
l are
a (
m2 h
a-1
)
Distance from strandline (m)
Bruguiera gymnorhiza
Figure 2.6, Basal areas of mangrove species in Loho. Differences
between mangrove tree basal areas (mean ± SE) recorded from
within plots (n = 10) at different distances from the strandline.

50
0
10
20
30
40
50
60
70
80
90
0 10 20 30 40 50 60 70
Brugueira gymnorhiza
0
10
20
30
40
50
60
70
80
90
0 10 20 30 40 50 60 70
Basa
l are
a (
m2 h
a-1
)
Rhizophora stylosa
0
10
20
30
40
50
60
70
80
90
0 10 20 30 40 50 60 70
Distance from strandline (m)
Sonneratia alba
Figure 2.7, Basal areas of mangrove species in One Onitu. Differences between
mangrove tree basal areas (mean ± SE) recorded within plots (n = 15) at different
distances from the strandline.

51
Biomass estimates from the basal area measurements were calculated using
allometric equations (Komiyama et al., 2005; Komiyama et al., 2008) (Table 2.7).
Sombano had the greatest estimates of biomass, followed by Langira. The mangrove
forests in Derawa, Kaluku, Loho, One Onitu and Gili had comparatively low
estimates of biomass.
0
5
10
15
20
25
30
35
0 10 20 30 40 50 60 70
Ba
sal
are
a (
m2 h
a-1
)
Bruguiera gymnorhiza
0
0.1
0.2
0.3
0.4
0.5
0.6
0.7
0 10 20 30 40 50 60 70
Rhizophoracea saplings
0
5
10
15
20
25
30
35
0 10 20 30 40 50 60 70
Ba
sal
are
a (
m2 h
a-1
)
Distance from strandline (m)
Rhizophora apiculata
0
5
10
15
20
25
30
35
0 10 20 30 40 50 60 70
Distance from strandline (m)
Sonneratia alba
Figure 2.8, Total basal areas of mangrove species in Gili. Differences of the total
basal areas (mean ± SE) recorded for each individual mangrove tree within plots (n = 6)
at different areas from the strandline. * The y-axis of the figure belonging to
Rhizophoracea saplings is a different scale to all other figures, due to their low basal
areas.

52
Species Site (t ha)
Sombano Langira Kaluku Loho One Onitu Gili
Bruguiera cylindrica 0.4 ± 0.1
Bruguiera gymnorhiza 328.6 ± 0.1 50.3 ± 0.3 1.3 ± 0.1 32.3 ± 0.6 7.8 ± 0.1
Excoecaria agallocha 605.8 ± 0.1
Heritiera littoralis 223.6 ± 1.4
Rhizophora apiculata 236.8 ± 1.0 13.3 ± 0.1 1
Rhizophora stylosa 83.0 ± 0.03 18.5 ± 0.03 28.3 ± 0.04 21.6 ± 0.05
Rhizophoracea saplings 0.1 ± 0.003
Sonneratia alba 12.2 ± 1.5 3.4 21.4 ± 1.4 3.4
Xylocarpus sp. 66.4 ± 0.3 111.2 ± 26.7
Table 2.7, Biomass estimates of mangrove species from each of the sites studied. Differences of biomass estimates (mean ± SE) of mangrove
basal areas recorded from plots within each forest. Allometric equations were used to calculate biomass. Wood density constants for B.
gymnorhiza, B. cylindrica, B. saplings, S. alba = 0.186*DBH+2.31, R. saplings, R. stylosa = 0.128*DBH+2.6, X. spp. = 0.0823*DBH+2.59, E.
agallocha, H. littoralis = 0.168*DBH+2.47 and R. apiculata = 0.235*DBH+2.42.
*The breakdown of the allometric biomass equations for e.g. Rhizophora apiculata 0.235*DBH+2.42; where 0.235 = wood density + 2.42 (constant) x log10 of
the DBH (diameter at breast height). To obtain the biomass in kgs, the log10 mass is exponentialy raised to the power of 10 and then divided by 1000 to calculate
the biomass weight in tons.
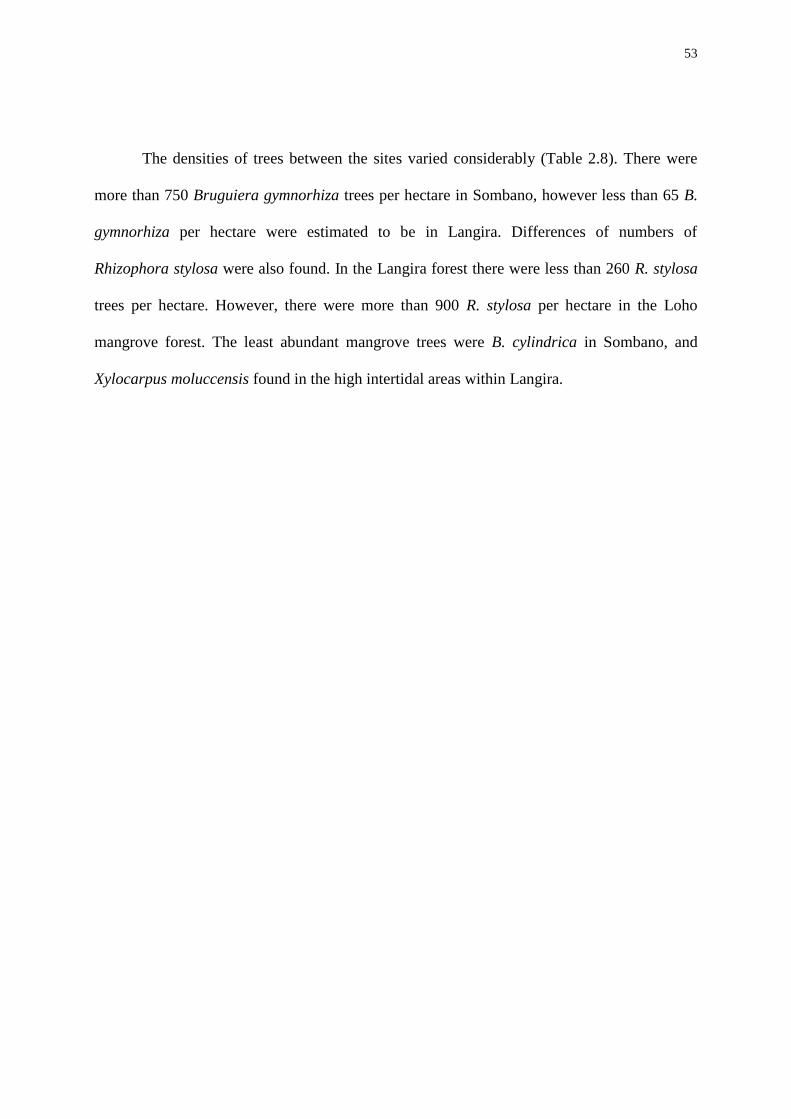
53
The densities of trees between the sites varied considerably (Table 2.8). There were
more than 750 Bruguiera gymnorhiza trees per hectare in Sombano, however less than 65 B.
gymnorhiza per hectare were estimated to be in Langira. Differences of numbers of
Rhizophora stylosa were also found. In the Langira forest there were less than 260 R. stylosa
trees per hectare. However, there were more than 900 R. stylosa per hectare in the Loho
mangrove forest. The least abundant mangrove trees were B. cylindrica in Sombano, and
Xylocarpus moluccensis found in the high intertidal areas within Langira.
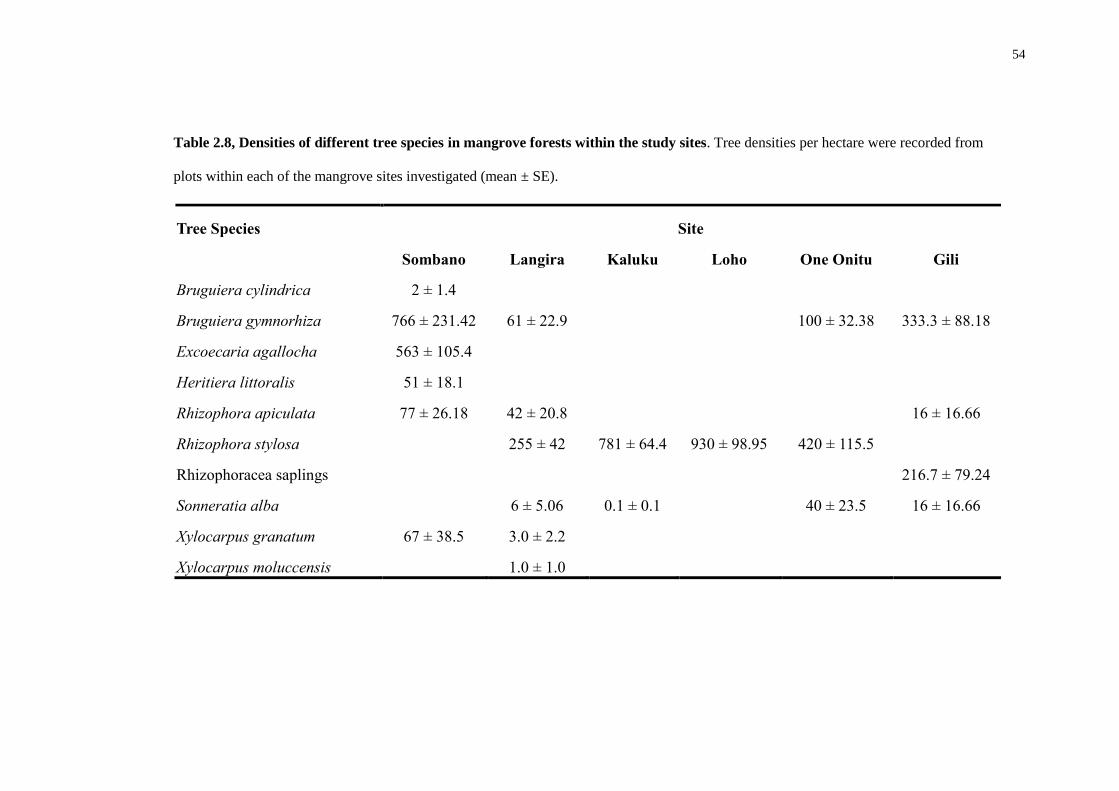
54
Tree Species Site
Sombano Langira Kaluku Loho One Onitu Gili
Bruguiera cylindrica 2 ± 1.4
Bruguiera gymnorhiza 766 ± 231.42 61 ± 22.9
100 ± 32.38 333.3 ± 88.18
Excoecaria agallocha 563 ± 105.4
Heritiera littoralis 51 ± 18.1
Rhizophora apiculata 77 ± 26.18 42 ± 20.8
16 ± 16.66
Rhizophora stylosa
255 ± 42 781 ± 64.4 930 ± 98.95 420 ± 115.5
Rhizophoracea saplings
216.7 ± 79.24
Sonneratia alba
6 ± 5.06 0.1 ± 0.1
40 ± 23.5 16 ± 16.66
Xylocarpus granatum 67 ± 38.5 3.0 ± 2.2
Xylocarpus moluccensis
1.0 ± 1.0
Table 2.8, Densities of different tree species in mangrove forests within the study sites. Tree densities per hectare were recorded from
plots within each of the mangrove sites investigated (mean ± SE).
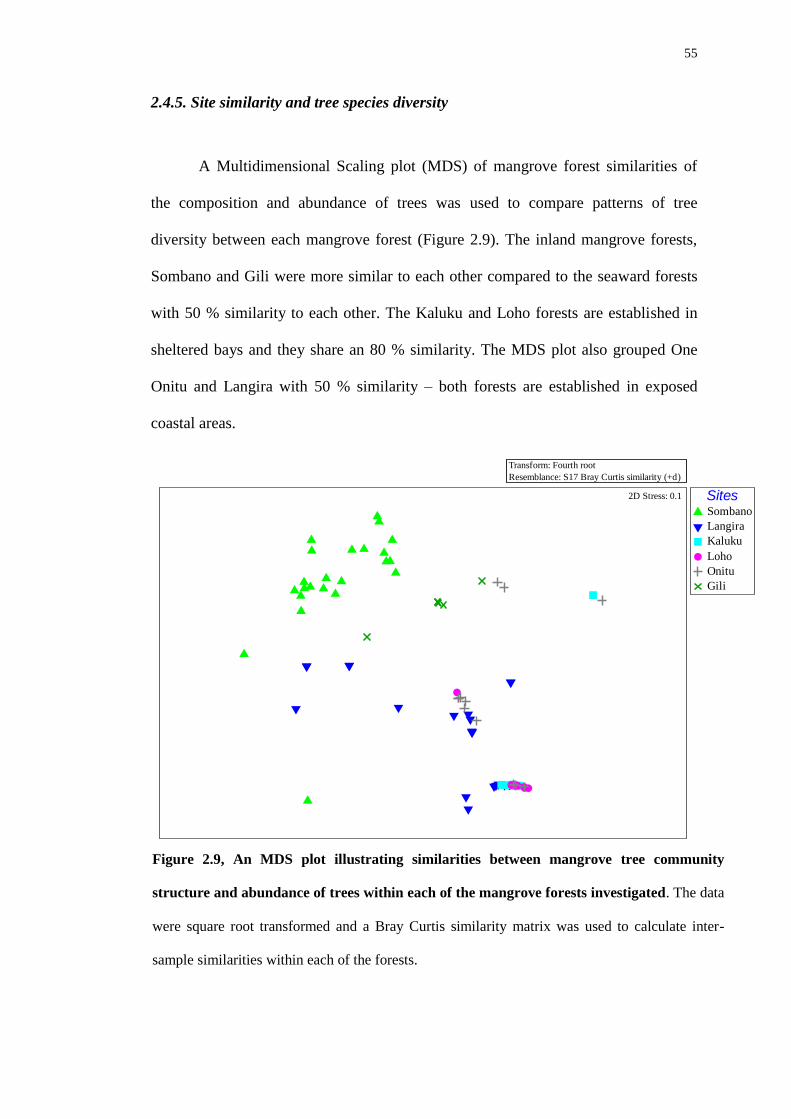
55
2.4.5. Site similarity and tree species diversity
A Multidimensional Scaling plot (MDS) of mangrove forest similarities of
the composition and abundance of trees was used to compare patterns of tree
diversity between each mangrove forest (Figure 2.9). The inland mangrove forests,
Sombano and Gili were more similar to each other compared to the seaward forests
with 50 % similarity to each other. The Kaluku and Loho forests are established in
sheltered bays and they share an 80 % similarity. The MDS plot also grouped One
Onitu and Langira with 50 % similarity – both forests are established in exposed
coastal areas.
Transform: Fourth root
Resemblance: S17 Bray Curtis similarity (+d)
SitesSombano
Langira
Kaluku
Loho
Onitu
Gili
2D Stress: 0.1
Figure 2.9, An MDS plot illustrating similarities between mangrove tree community
structure and abundance of trees within each of the mangrove forests investigated. The data
were square root transformed and a Bray Curtis similarity matrix was used to calculate inter-
sample similarities within each of the forests.

56
Analyses of the diversity of mangrove trees (Table 2.9) determined that
Sombano has the highest tree diversity, and abundance of species. The Langira forest
had a relatively high diversity and evenness. The analysis for both Loho and Kaluku
revealed they had the lowest tree diversity. This was also mirrored with low evenness
values from the forests – also due to the dominance of R. stylosa. Although One
Onitu had a low density and abundance of species, the Pielou’s evenness value was
higher than any of the other mangrove forests.
Site S N J’ H’
Sombano 6 1526 0.627 1.124
Langira 6 368 0.515 0.922
Loho 2 980 0.291 0.202
Onitu 3 560 0.648 0.712
Kaluku 2 782 0.002 0.001
Gili 4 583 0.643 0.891
Distance-based redundancy analysis (dbRDA) was used for visualizing the
correlations of the trees with emersion time, substrate and salinity (environmental
variables) measured from each forest and plot as an ordination, constrained to linear
combinations of the predictor variables. The environmental variables influencing the
dbRDA ordination axis 1 (Figure 2.10 a) showed that 94.7 % of the environmental
data explains 45.2 % of the total variation and for axis 2, 5 % of the environmental
Table 2.9, Comparison between the various indices of tree species between
the mangrove forests investigated. S = number of species, N = total individuals,
J’ = Pielou’s evenness, H’ = Shannon-Weiner diversity index.

57
data explains 2.4 % of the total variation. The distributions of trees within each
mangrove forest except Sombano were strongly affected by emersion time and the
substratum type (Figure 2.10 b) and the trees within Sombano were strongly affected
by salinity (Figure 2.10 b). However, a few trees from Langira were also grouped
within Sombano. The trees, R. stylosa, R. apiculata and B. gymnorhiza were affected
by emersion time and substratum type (Figure 2.10 c). However, E. agallocha, X.
granatum and H. littoralis were strongly correlated with lower salinity (Figure 2.10
c). Two distinct groups were found, as the Sombano forest was different from the
other forests.
Figure 2.10, dbRDA ordinations. a, the distribution of trees identified from plots within each mangrove
forest. Different coloured symbols signify different mangrove forests, b, the environmental vectors that
influence the trees within each mangrove site and, c, the tree distribution within the mangrove forests
explained as vectors. Ea = Excoecaria agallocha, Hl = Heritiera littoralis, Xg = Xylocarpus granatum, Ra
= Rhizophora apiculata, Bg = Bruguiera gymnorhiza and Rs = Rhizophora stylosa. PSU = practical salinity
units.
a
b c
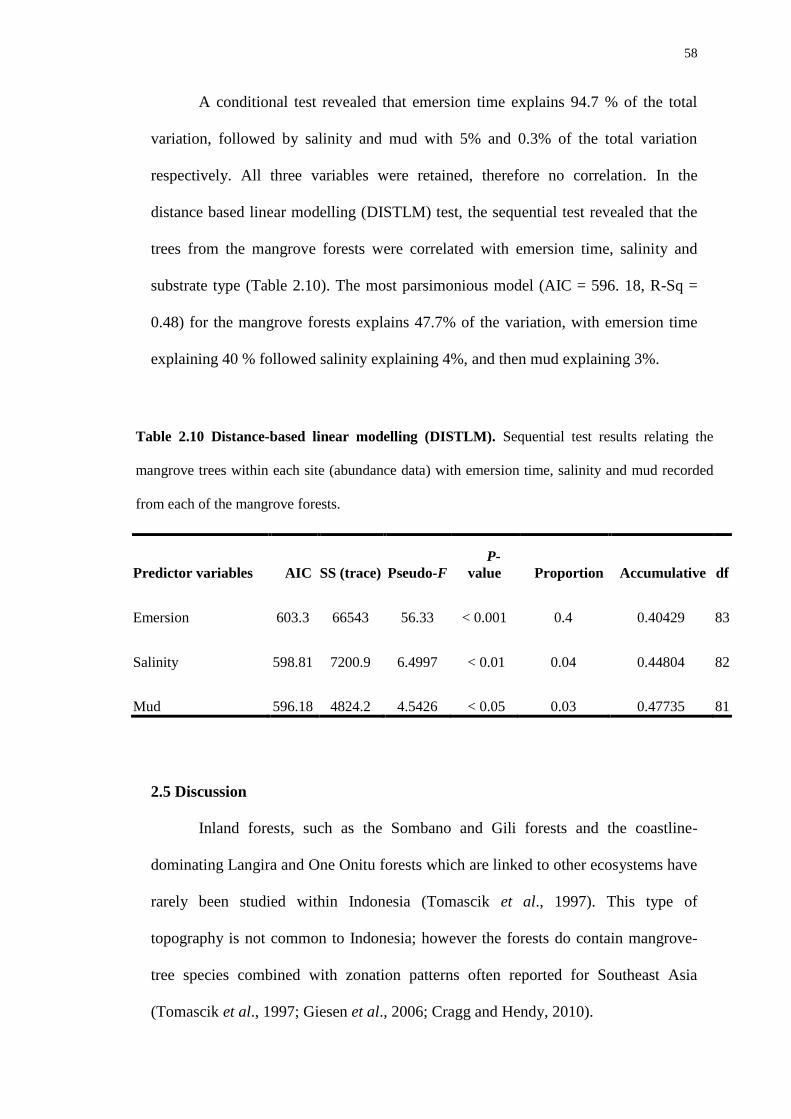
58
A conditional test revealed that emersion time explains 94.7 % of the total
variation, followed by salinity and mud with 5% and 0.3% of the total variation
respectively. All three variables were retained, therefore no correlation. In the
distance based linear modelling (DISTLM) test, the sequential test revealed that the
trees from the mangrove forests were correlated with emersion time, salinity and
substrate type (Table 2.10). The most parsimonious model (AIC = 596. 18, R-Sq =
0.48) for the mangrove forests explains 47.7% of the variation, with emersion time
explaining 40 % followed salinity explaining 4%, and then mud explaining 3%.
Predictor variables AIC SS (trace) Pseudo-F P-
value Proportion Accumulative df
Emersion 603.3 66543 56.33 < 0.001 0.4 0.40429 83
Salinity 598.81 7200.9 6.4997 < 0.01 0.04 0.44804 82
Mud 596.18 4824.2 4.5426 < 0.05 0.03 0.47735 81
2.5 Discussion
Inland forests, such as the Sombano and Gili forests and the coastline-
dominating Langira and One Onitu forests which are linked to other ecosystems have
rarely been studied within Indonesia (Tomascik et al., 1997). This type of
topography is not common to Indonesia; however the forests do contain mangrove-
tree species combined with zonation patterns often reported for Southeast Asia
(Tomascik et al., 1997; Giesen et al., 2006; Cragg and Hendy, 2010).
Table 2.10 Distance-based linear modelling (DISTLM). Sequential test results relating the
mangrove trees within each site (abundance data) with emersion time, salinity and mud recorded
from each of the mangrove forests.
59
Zonation patterns of trees were found in Sombano, with Heritiera littoralis
found only at the strandline and more salt-tolerant species, Bruguiera and
Excoecaria found further towards the sea. The mix of Bruguiera gymnorhiza and
Excoecaria agallocha trees may be due to the intolerances of environmental
variables. Both species are commonly found in the same areas within mangrove
forests (Duke, 1992). Very subtle changes of tidal emersion were found in Sombano
(Figure 2.2), therefore waterlogging of mangrove root-tissues did not create distinct
zonation patterns between the Excoecaria and Bruguiera trees. As differences of
immersion time; the waterlogging of mangrove roots may contribute to species-
specific zonation patterns. Bruguiera gymnorhiza is more tolerant to immersion than
Excoecaria agallocha, which is more tolerant than the Heritiera littoralis trees. The
differences in tolerance to waterlogging between different mangrove trees are related
to their anatomical features of cortex root-tissues, epidermis and hypodermis (Pi et
al., 2009). The Sombano substratum consisted of organic-rich mud and the forest
was established in the high intertidal zone. Those factors did not affect the zonation
patterns of plants within Sombano. The distribution of trees within Sombano is
controlled by salinity, which increased in concentration with distance from the
landward edge.
The bank of mixed saplings within Sombano is an indication of young stands.
Older trees have greater girth measurements and are less densely distributed (Alongi,
2002). The sparser, but large Xylocarpus spp. in Sombano may contribute to
increases of the total above-ground biomass with increasing age. A similar pattern
was found in mangrove forests in Vietnam - where stands also become less dense,
due to increases in tree girths (Alongi, 2002).
The low salinities and long emersion times recorded at the strandline within

60
Sombano explains the limited distribution of Nypa fruticans and Heritiera littoralis.
The presence of N. fruticans is an indicator of freshwater environments, and is often
found adjacent to H. littoralis stands (Tomascik et al., 1997) and these palms do not
tolerate salinities above fifteen PSU (Blasco et al., 1996; Alongi, 2007).
Furthermore, N. fruticans does not tolerate more than three hours of inundation per
day (Blasco et al., 1996), which the same thing is seen from this study as N. fruticans
were found in areas from Sombano with less than three hours of immersion and
salinities less than fifteen PSU.
Adjacent and seaward to the Sombano forest is the Langira mangrove forest.
Emersion time was found to influence the zonation patterns within that forest.
Rhizophora apiculata was established in areas of the forest with increased emersion
times. However, R. stylosa and S. alba were more common in areas less frequently
inundated. The Langira forest is established on a large coral-rock plateau. Hard
coralline substrata are often dominated by R. stylosa (Tomascik et al., 1997).
However, hard substrata may prevent Rhizophora propagules from embedding and
therefore establishing. Rhizophora propagules need to be anchored in to the
sediment; this is an important factor for their survival (Kathiresan and Bingham,
2001). Thus, the fossil-coral substratum in Langira may impede and reduce the
successful establishment of propagules, which may explain the patchy canopy within
Langira. Sonneratia alba were found only at the outermost seaward-edges of the
forest, which had the highest salinity levels. S. alba commonly grows on the
outermost seaward margins, especially in sandy and rocky areas that are fully marine
(Tomascik et al., 1997; Giesen et al., 2006).
Within Langira, Xylocarpus spp. were found only in areas with the longest
emersion time and lowest recorded salinities. These environmental factors determine
61
the distributions of Xylocarpus spp. Within other southeast Asian mangrove forests,
Xylocarpus spp. were also reported in areas only inundated by high-tides, in the
landward regions and in areas of lower salinities (Tomascik et al., 1997; Giesen et
al., 2006). Although individual Xylocarpus spp. within the Langira forest are very
large, those trees were not dominant due to their very low abundance within the
forest.
Higher mangrove tree densities have reduced basal areas (Alongi, 2002). The
same thing was seen with this study; the Sombano forest had the largest density of B.
gymnorhiza trees, but those trees had small girths. Langira and Loho had the lowest
densities of B. gymnorhiza, but those trees were larger in comparison with Sombano
- which highlights the importance of these larger mature trees. Less distributed,
larger trees are not only an indication of age, but they also significantly contribute to
an increase of biomass for the forest (Along, 2002). The mean recorded
circumference for B. gymnorhiza in Langira and Loho was greater than those
reported from Sombano. However, many of the larger mature B. gymnorhiza trees
from Sombano had been felled. Thus, much of the Sombano tree biomass had been
removed.
Langira had the lowest recorded densities of R. stylosa, but a lower basal area
for this species. The lower measurements of mean girth of the R. stylosa stands
recorded from Langira may be due to the result of the heavy harvesting pressures
imposed upon the forest (Walters, 2005a; Walters et al., 2008). The reduced
structural complexity of the R. stylosa stands, low densities and low canopy height
within Langira, may also be attributed to forest age (Alongi, 2002), as tree densities
decline, with age. However, some trees within Langira were not harvested – such as
the large Xylocarpus spp.

62
Within each of the mangrove forests the basal areas of the trees differed. The
differences of tree girths may be attributed to species densities, changes of
environmental conditions and harvesting pressures (Alongi, 2002; Giesen et al.,
2006; Walters et al., 2008). The differences of tree-girths recorded between the
forests suggest that the total dominance and living biomass of the tree species within
each forest also differs.
Using basal-area measurements as an indication of tree-species dominance
and of the quantity of living biomass within the forests of the WMP, comparisons of
woody biomass can be made with other forests, using allometric equations
(Komiyama et al., 2008). The numerous large trees from Sombano provided
estimates of forest biomass that were similar to the extensive mangrove forests
reported from other areas in Indonesia, Malaysia and Papua New Guinea, which had
biomass values ranging from 430 to 600 tonnes per hectare (Komiyama et al., 2008;
Alongi, 2009). Values reported from Langira were lower than Sombano, but higher
than estimates from the mangrove forests on Derawa. The biomass of trees within
Langira is similar to those reported from other Indonesian mangrove forests that
range up to 170 tonnes per hectare for Rhizophora-dominated forests (Komiyama et
al., 2008). The largest contributors of living biomass within Langira are the
Xylocarpus spp. demonstrating that even a very few trees can significantly contribute
to the total above-ground forest biomass (Ong et al., 1995; Alongi, 2002). The lowest
estimates of forests biomass were recorded from the mangrove forests on Derawa.
The Kaluku, Loho, One Onitu and the Gili forests are similar to the ranges of
mangrove forest biomass reported from Florida and Kenya, where biomass estimates
range between 8 – 20 tonnes per hectare (Lugo and Snedaker, 1974; Kairo et al.,
2009).
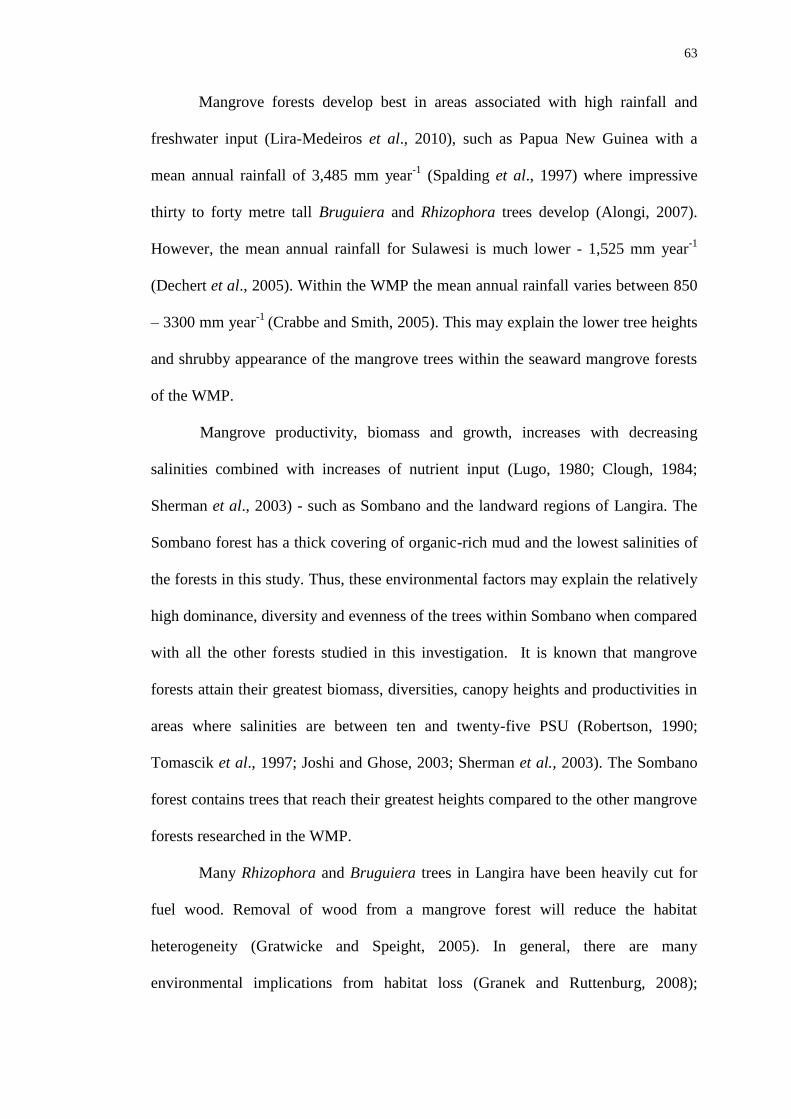
63
Mangrove forests develop best in areas associated with high rainfall and
freshwater input (Lira-Medeiros et al., 2010), such as Papua New Guinea with a
mean annual rainfall of 3,485 mm year-1
(Spalding et al., 1997) where impressive
thirty to forty metre tall Bruguiera and Rhizophora trees develop (Alongi, 2007).
However, the mean annual rainfall for Sulawesi is much lower - 1,525 mm year-1
(Dechert et al., 2005). Within the WMP the mean annual rainfall varies between 850
– 3300 mm year-1
(Crabbe and Smith, 2005). This may explain the lower tree heights
and shrubby appearance of the mangrove trees within the seaward mangrove forests
of the WMP.
Mangrove productivity, biomass and growth, increases with decreasing
salinities combined with increases of nutrient input (Lugo, 1980; Clough, 1984;
Sherman et al., 2003) - such as Sombano and the landward regions of Langira. The
Sombano forest has a thick covering of organic-rich mud and the lowest salinities of
the forests in this study. Thus, these environmental factors may explain the relatively
high dominance, diversity and evenness of the trees within Sombano when compared
with all the other forests studied in this investigation. It is known that mangrove
forests attain their greatest biomass, diversities, canopy heights and productivities in
areas where salinities are between ten and twenty-five PSU (Robertson, 1990;
Tomascik et al., 1997; Joshi and Ghose, 2003; Sherman et al., 2003). The Sombano
forest contains trees that reach their greatest heights compared to the other mangrove
forests researched in the WMP.
Many Rhizophora and Bruguiera trees in Langira have been heavily cut for
fuel wood. Removal of wood from a mangrove forest will reduce the habitat
heterogeneity (Gratwicke and Speight, 2005). In general, there are many
environmental implications from habitat loss (Granek and Ruttenburg, 2008);
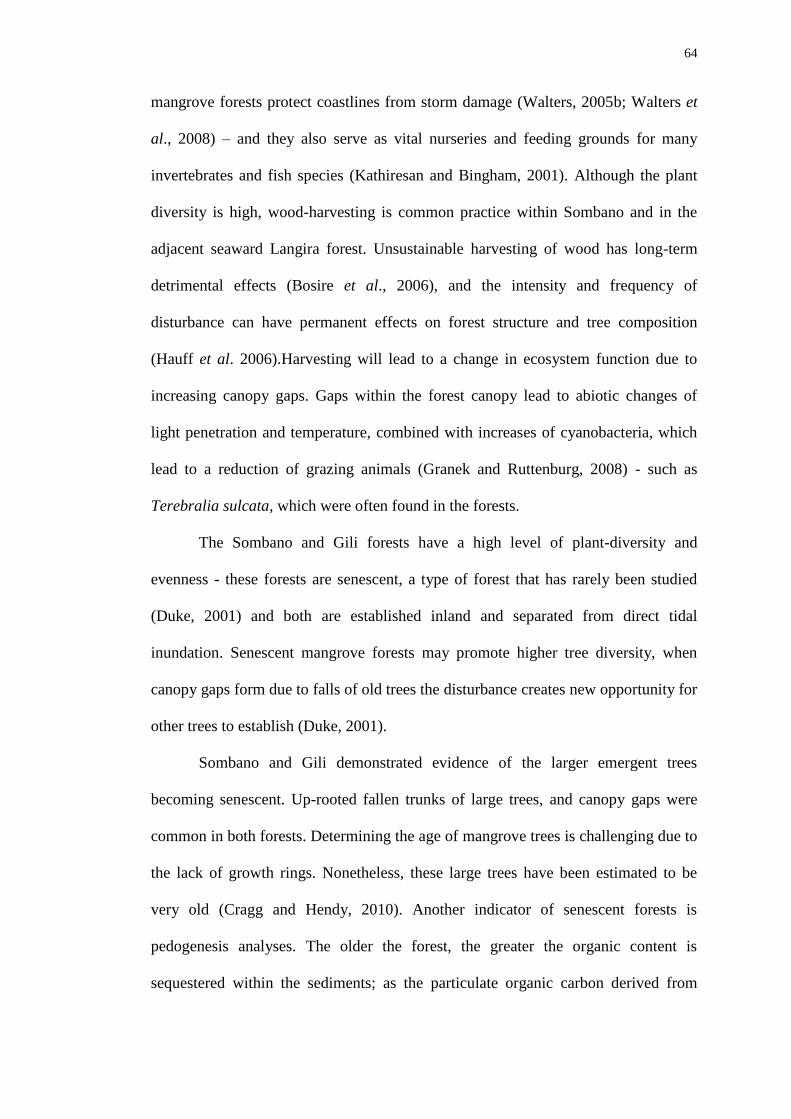
64
mangrove forests protect coastlines from storm damage (Walters, 2005b; Walters et
al., 2008) – and they also serve as vital nurseries and feeding grounds for many
invertebrates and fish species (Kathiresan and Bingham, 2001). Although the plant
diversity is high, wood-harvesting is common practice within Sombano and in the
adjacent seaward Langira forest. Unsustainable harvesting of wood has long-term
detrimental effects (Bosire et al., 2006), and the intensity and frequency of
disturbance can have permanent effects on forest structure and tree composition
(Hauff et al. 2006).Harvesting will lead to a change in ecosystem function due to
increasing canopy gaps. Gaps within the forest canopy lead to abiotic changes of
light penetration and temperature, combined with increases of cyanobacteria, which
lead to a reduction of grazing animals (Granek and Ruttenburg, 2008) - such as
Terebralia sulcata, which were often found in the forests.
The Sombano and Gili forests have a high level of plant-diversity and
evenness - these forests are senescent, a type of forest that has rarely been studied
(Duke, 2001) and both are established inland and separated from direct tidal
inundation. Senescent mangrove forests may promote higher tree diversity, when
canopy gaps form due to falls of old trees the disturbance creates new opportunity for
other trees to establish (Duke, 2001).
Sombano and Gili demonstrated evidence of the larger emergent trees
becoming senescent. Up-rooted fallen trunks of large trees, and canopy gaps were
common in both forests. Determining the age of mangrove trees is challenging due to
the lack of growth rings. Nonetheless, these large trees have been estimated to be
very old (Cragg and Hendy, 2010). Another indicator of senescent forests is
pedogenesis analyses. The older the forest, the greater the organic content is
sequestered within the sediments; as the particulate organic carbon derived from
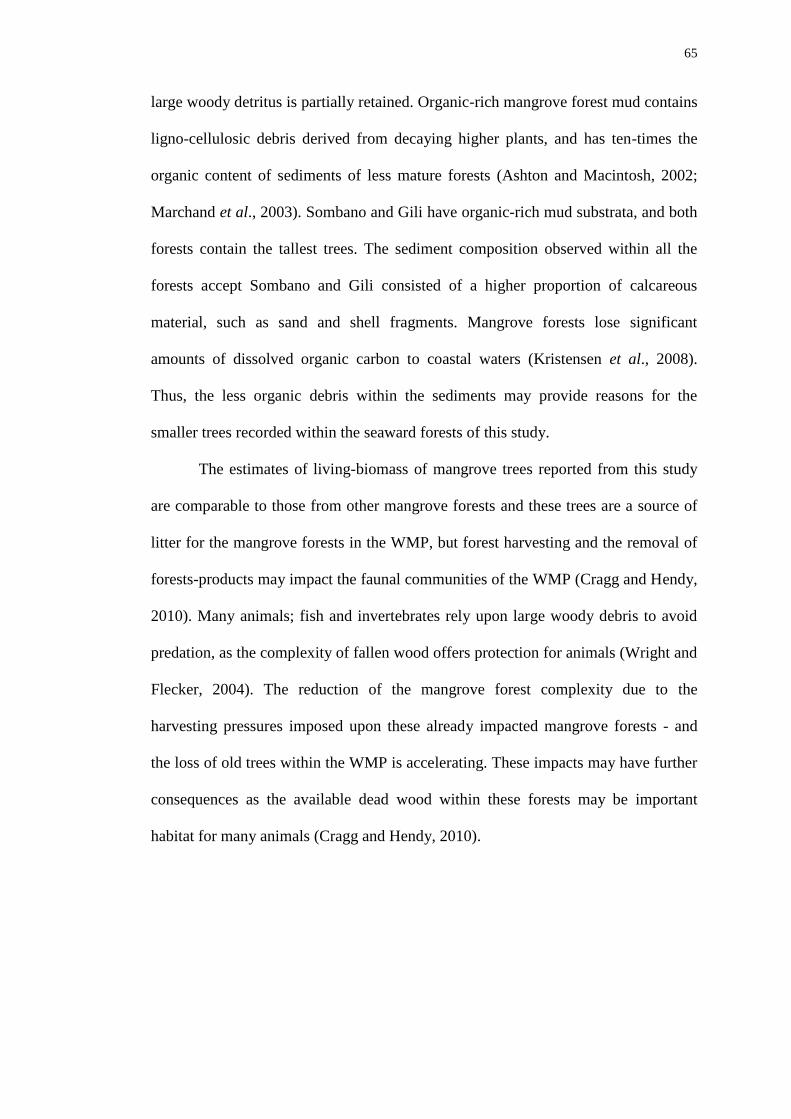
65
large woody detritus is partially retained. Organic-rich mangrove forest mud contains
ligno-cellulosic debris derived from decaying higher plants, and has ten-times the
organic content of sediments of less mature forests (Ashton and Macintosh, 2002;
Marchand et al., 2003). Sombano and Gili have organic-rich mud substrata, and both
forests contain the tallest trees. The sediment composition observed within all the
forests accept Sombano and Gili consisted of a higher proportion of calcareous
material, such as sand and shell fragments. Mangrove forests lose significant
amounts of dissolved organic carbon to coastal waters (Kristensen et al., 2008).
Thus, the less organic debris within the sediments may provide reasons for the
smaller trees recorded within the seaward forests of this study.
The estimates of living-biomass of mangrove trees reported from this study
are comparable to those from other mangrove forests and these trees are a source of
litter for the mangrove forests in the WMP, but forest harvesting and the removal of
forests-products may impact the faunal communities of the WMP (Cragg and Hendy,
2010). Many animals; fish and invertebrates rely upon large woody debris to avoid
predation, as the complexity of fallen wood offers protection for animals (Wright and
Flecker, 2004). The reduction of the mangrove forest complexity due to the
harvesting pressures imposed upon these already impacted mangrove forests - and
the loss of old trees within the WMP is accelerating. These impacts may have further
consequences as the available dead wood within these forests may be important
habitat for many animals (Cragg and Hendy, 2010).

66
Chapter 3
INVESTIGATION OF WOOD BIODEGRADATION IN
MANGROVE ECOSYSTEMS OF THE WMP
3.1 Introduction
Detrital breakdown and nutrient recycling is a fundamental ecological process
for every natural ecosystem. This process occurs in terrestrial and aquatic
environments – whether coral reefs (Hata et al., 2002), freshwater streams (Karlsson
et al., 2005; Greenwood et al., 2007), or tropical rain forests (Cerri et al., 2007).
Over fifty percent of the World’s organic carbon is sequestered in to terrestrial
ecosystems (Malhi et al., 2002), with the remaining carbon taken up by marine
systems (Muller-Karger et al., 2005). Within marine intertidal areas, mangrove
forests sequester much of the carbon and are considered to be carbon-sinks (Donato
et al., 2011). However, nutrient recycling in mangrove forests is complex as they are
sites where terrestrial and marine ecosystems directly interact.
In mangrove ecosystems, carbon is fixed via photosynthesis to form various
plant tissues such as large woody trunks, roots and leaves (Ong et al., 1995). The
mangrove organic material is then processed in the direct transfer of energy to higher
trophic levels. The biodegradation of organic material is processed in different ways
via saprophytic decay (Sarma and Vittal, 2001; Ananda and Sridhar, 2004) and
mechanical breakdown of plant material (Robertson and Daniel, 1989a; Filho et al.,
2008). Thus, litter within mangrove forest environments, broken down in different
ways serves as the base for intricate food webs (Benner and Hodson, 1985). The
principal component of woody plants and dead plant material is lignocellulose,
which is the most abundant biomass on earth (Eggert et al., 1996; Kalmis et al.,
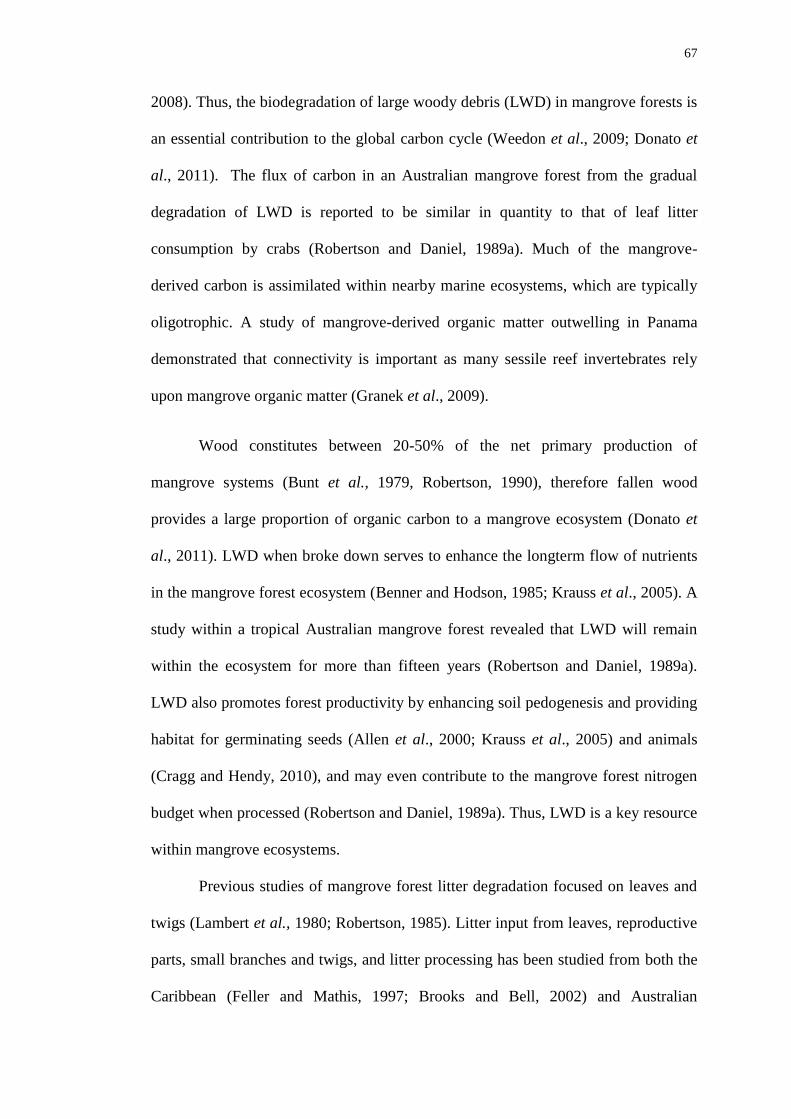
67
2008). Thus, the biodegradation of large woody debris (LWD) in mangrove forests is
an essential contribution to the global carbon cycle (Weedon et al., 2009; Donato et
al., 2011). The flux of carbon in an Australian mangrove forest from the gradual
degradation of LWD is reported to be similar in quantity to that of leaf litter
consumption by crabs (Robertson and Daniel, 1989a). Much of the mangrove-
derived carbon is assimilated within nearby marine ecosystems, which are typically
oligotrophic. A study of mangrove-derived organic matter outwelling in Panama
demonstrated that connectivity is important as many sessile reef invertebrates rely
upon mangrove organic matter (Granek et al., 2009).
Wood constitutes between 20-50% of the net primary production of
mangrove systems (Bunt et al., 1979, Robertson, 1990), therefore fallen wood
provides a large proportion of organic carbon to a mangrove ecosystem (Donato et
al., 2011). LWD when broke down serves to enhance the longterm flow of nutrients
in the mangrove forest ecosystem (Benner and Hodson, 1985; Krauss et al., 2005). A
study within a tropical Australian mangrove forest revealed that LWD will remain
within the ecosystem for more than fifteen years (Robertson and Daniel, 1989a).
LWD also promotes forest productivity by enhancing soil pedogenesis and providing
habitat for germinating seeds (Allen et al., 2000; Krauss et al., 2005) and animals
(Cragg and Hendy, 2010), and may even contribute to the mangrove forest nitrogen
budget when processed (Robertson and Daniel, 1989a). Thus, LWD is a key resource
within mangrove ecosystems.
Previous studies of mangrove forest litter degradation focused on leaves and
twigs (Lambert et al., 1980; Robertson, 1985). Litter input from leaves, reproductive
parts, small branches and twigs, and litter processing has been studied from both the
Caribbean (Feller and Mathis, 1997; Brooks and Bell, 2002) and Australian
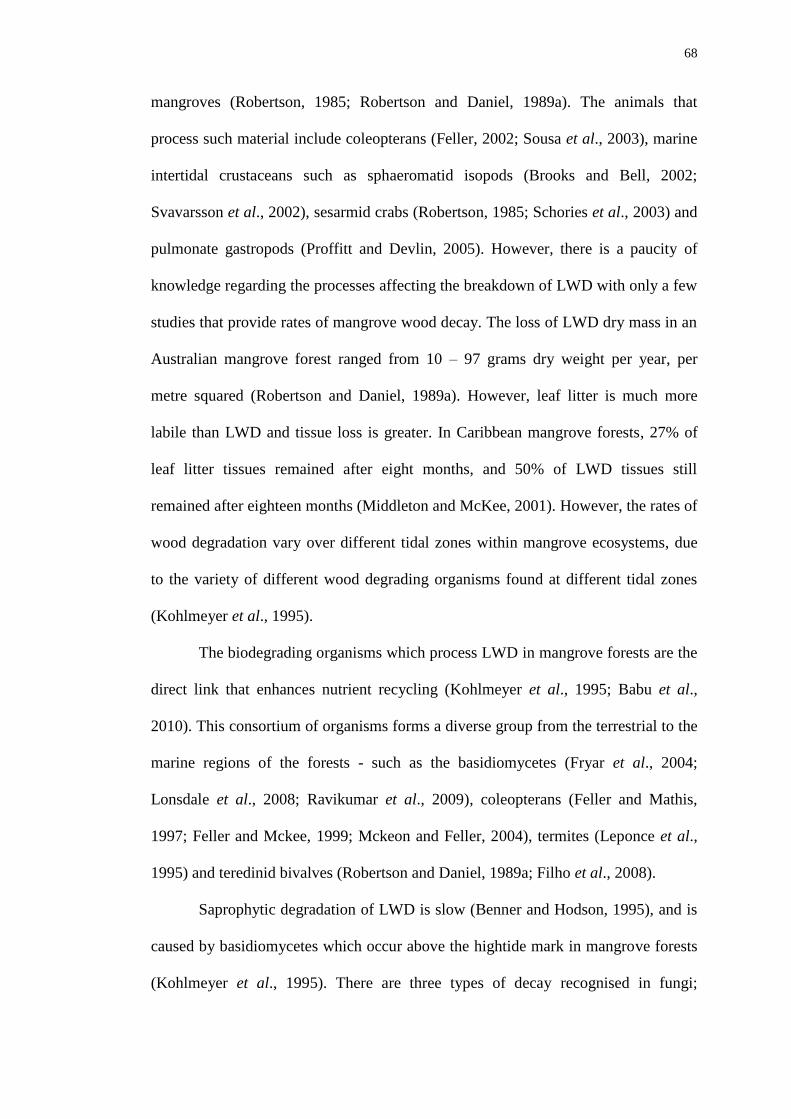
68
mangroves (Robertson, 1985; Robertson and Daniel, 1989a). The animals that
process such material include coleopterans (Feller, 2002; Sousa et al., 2003), marine
intertidal crustaceans such as sphaeromatid isopods (Brooks and Bell, 2002;
Svavarsson et al., 2002), sesarmid crabs (Robertson, 1985; Schories et al., 2003) and
pulmonate gastropods (Proffitt and Devlin, 2005). However, there is a paucity of
knowledge regarding the processes affecting the breakdown of LWD with only a few
studies that provide rates of mangrove wood decay. The loss of LWD dry mass in an
Australian mangrove forest ranged from 10 – 97 grams dry weight per year, per
metre squared (Robertson and Daniel, 1989a). However, leaf litter is much more
labile than LWD and tissue loss is greater. In Caribbean mangrove forests, 27% of
leaf litter tissues remained after eight months, and 50% of LWD tissues still
remained after eighteen months (Middleton and McKee, 2001). However, the rates of
wood degradation vary over different tidal zones within mangrove ecosystems, due
to the variety of different wood degrading organisms found at different tidal zones
(Kohlmeyer et al., 1995).
The biodegrading organisms which process LWD in mangrove forests are the
direct link that enhances nutrient recycling (Kohlmeyer et al., 1995; Babu et al.,
2010). This consortium of organisms forms a diverse group from the terrestrial to the
marine regions of the forests - such as the basidiomycetes (Fryar et al., 2004;
Lonsdale et al., 2008; Ravikumar et al., 2009), coleopterans (Feller and Mathis,
1997; Feller and Mckee, 1999; Mckeon and Feller, 2004), termites (Leponce et al.,
1995) and teredinid bivalves (Robertson and Daniel, 1989a; Filho et al., 2008).
Saprophytic degradation of LWD is slow (Benner and Hodson, 1995), and is
caused by basidiomycetes which occur above the hightide mark in mangrove forests
(Kohlmeyer et al., 1995). There are three types of decay recognised in fungi;

69
ascomycete fungi create soft rot and decay the cellulose and hemicellulose (Bucher
et al., 2004). Soft rot is usually restricted to the surface of wood and results in
minimal lignin degradation (Bucher et al., 2004). The second form of decay is white
rot, which facilitate a rapid decay of all the components of wood. This type of decay
is usually caused by basidiomycetes, which affect even the most recalcitrant
component of wood, lignin. Thus, the basidiomycetes are essential for the decay of
LWD in the supratidal areas in the mangrove forests. The third type of decay is
brown rot, which causes the rapid decay of cellulose and hemicellulose. This type of
decay is not found in wet or waterlogged wood. Thus, brown rot is not found in
aquatic environments (Bucher et al., 2004).
However, in the mid- to low- intertidal regions of mangrove forests,
biodegradation is accelerated when LWD is exposed to wood-borers, in particular
animals belonging to the family Teredinidae (Robertson and Daniel, 1989a;
Middleton and Mckee, 2001; Filho et al., 2008). Thus, LWD will break down at
different rates, by a variety of different pathways. This variation will depend on the
plant species composition within the mangrove forests and the distribution of wood-
decaying and wood-boring animals (Robertson, 1990; Middleton and Mckee, 2001).
The Teredinid boring activity is particularly important in forests where there
is a high level of woody biomass consisting of fallen trunks (Robertson, 1990;
Kohlmeyer et al., 1995).Teredinids process fallen logs into fine fragments of faecal
material that contribute to nutrient recycling and reducing the build-up of LWD in
mangrove ecosystems (Filho et al., 2008). Teredinids cannot tolerate regular
prolonged emersion; therefore the distributions of LWD along a tidal gradient in
mangrove forests will influence the activity of the Teredinidae (Robertson, 1990). In
the mid- to low- intertidal zones of a Rhizophora-dominated Australian mangrove
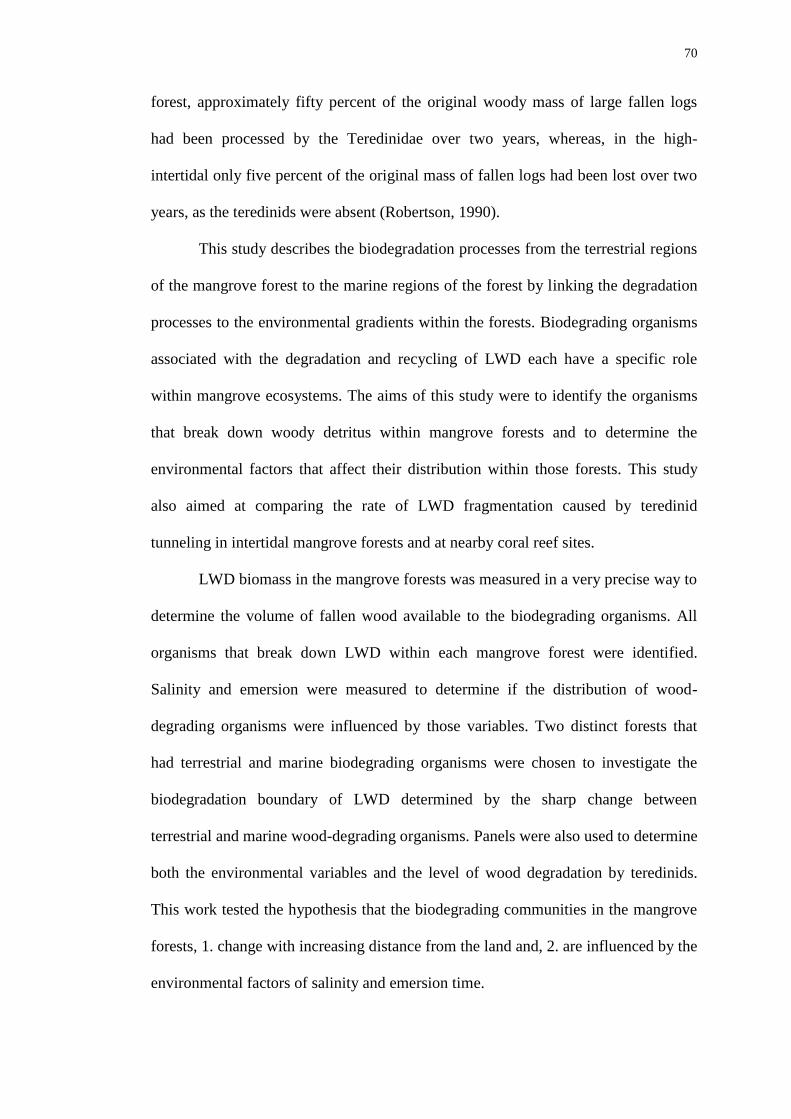
70
forest, approximately fifty percent of the original woody mass of large fallen logs
had been processed by the Teredinidae over two years, whereas, in the high-
intertidal only five percent of the original mass of fallen logs had been lost over two
years, as the teredinids were absent (Robertson, 1990).
This study describes the biodegradation processes from the terrestrial regions
of the mangrove forest to the marine regions of the forest by linking the degradation
processes to the environmental gradients within the forests. Biodegrading organisms
associated with the degradation and recycling of LWD each have a specific role
within mangrove ecosystems. The aims of this study were to identify the organisms
that break down woody detritus within mangrove forests and to determine the
environmental factors that affect their distribution within those forests. This study
also aimed at comparing the rate of LWD fragmentation caused by teredinid
tunneling in intertidal mangrove forests and at nearby coral reef sites.
LWD biomass in the mangrove forests was measured in a very precise way to
determine the volume of fallen wood available to the biodegrading organisms. All
organisms that break down LWD within each mangrove forest were identified.
Salinity and emersion were measured to determine if the distribution of wood-
degrading organisms were influenced by those variables. Two distinct forests that
had terrestrial and marine biodegrading organisms were chosen to investigate the
biodegradation boundary of LWD determined by the sharp change between
terrestrial and marine wood-degrading organisms. Panels were also used to determine
both the environmental variables and the level of wood degradation by teredinids.
This work tested the hypothesis that the biodegrading communities in the mangrove
forests, 1. change with increasing distance from the land and, 2. are influenced by the
environmental factors of salinity and emersion time.

71
3.2 Materials and methods
3.2.1 Measurement of wood-loss in panels
A total of sixty-five wooden panels, cut from Bruguiera gymnorhiza planks
were placed within the Sombano and Langira forests and Kal 1 reef site to determine
the dry-weight losses of wood from teredinid activity (Figure 3.1 c). Panels had a
volume of 275 cm3
and measured. All panels were exposed for twelve months. The
dry-weight loss of wood was determined by oven drying the panels for 48 hours at
60°C. The percentage of the sectional area of the panel containing teredinid tunnels
was calculated using the digital analysis package ImageTool Version 3.00 (The
University of Texas Health Science Centre at San Antonio).
Panels (n = 5) were placed 0, 20, 100, 240, 380 and 500 metres from the
landward edge within the Sombano forest. The panels within the Langira forest were
placed at 720, 820, 940, 980 and 1070 metres from the Sombano landward edge.
Panels on the Kal 1 reef site were placed at 10 metres depth, 1500 metres from the
Sombano landward edge (Figure 3.1 c).
To determine wood-loss from teredinids, 25 panels within Langira, 60 panels
within Galua and 20 panels each in Kaluku, Loho and One Onitu (Figure 3. 1 a) were
placed. Twenty panels were positioned at a depth of 10 metres from three sub-tidal
reef sites; in the Kal 1, Pak Kasim’s and the Ridge 1 reefs (Figure 3.1 c) in July 2010
and removed in July 2011. The percentage of wood fragmentation attributed by the
activity of the Teredinidae was estimated from the panels from the mangrove forests
and each reef site. All panels were cut longitudinally to determine the level of wood
fragmentation attributed by teredinid activity. The percentage of the sectional area of
each panel represented by tunnels and the area of panel remaining was estimated.
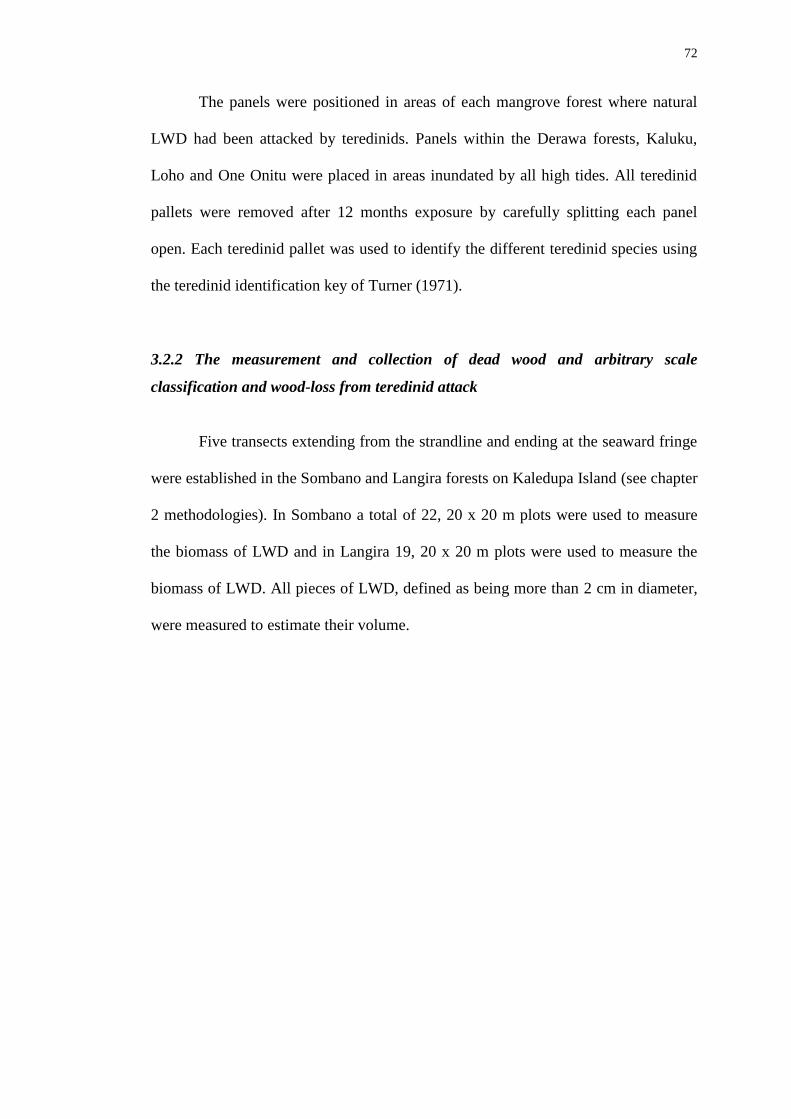
72
The panels were positioned in areas of each mangrove forest where natural
LWD had been attacked by teredinids. Panels within the Derawa forests, Kaluku,
Loho and One Onitu were placed in areas inundated by all high tides. All teredinid
pallets were removed after 12 months exposure by carefully splitting each panel
open. Each teredinid pallet was used to identify the different teredinid species using
the teredinid identification key of Turner (1971).
3.2.2 The measurement and collection of dead wood and arbitrary scale
classification and wood-loss from teredinid attack
Five transects extending from the strandline and ending at the seaward fringe
were established in the Sombano and Langira forests on Kaledupa Island (see chapter
2 methodologies). In Sombano a total of 22, 20 x 20 m plots were used to measure
the biomass of LWD and in Langira 19, 20 x 20 m plots were used to measure the
biomass of LWD. All pieces of LWD, defined as being more than 2 cm in diameter,
were measured to estimate their volume.

73
The height above sea level of each individual piece of LWD was measured.
The high tide marks were recorded on mangrove trees using high visibility string. At
low tide, the distance from the substratum to the mark on the trees were measured
and then subtracted from the marks on the trees to establish height above sea level.
Figure 3.1 Sites within Kaledupa and Derawa Island used for sampling the variety of
biodegrading organisms and to reveal the environmental factors that determine the
biodegradation of LWD. a, map of Kaledupa demonstrating the geographical distribution of
each site; b, mangrove forests have been colour-coded by their site-specific biodegradation
process (terrestrial = brown, marine = blue) and height above sea level (mean ± SE). The
boundary between the terrestrial and marine biodegradation is indicated by the red line within
the Galua and Laulua forests; and c, the three reef sites used in this study. The red dotted line
is the transect used to determine wood-loss.
a b
c
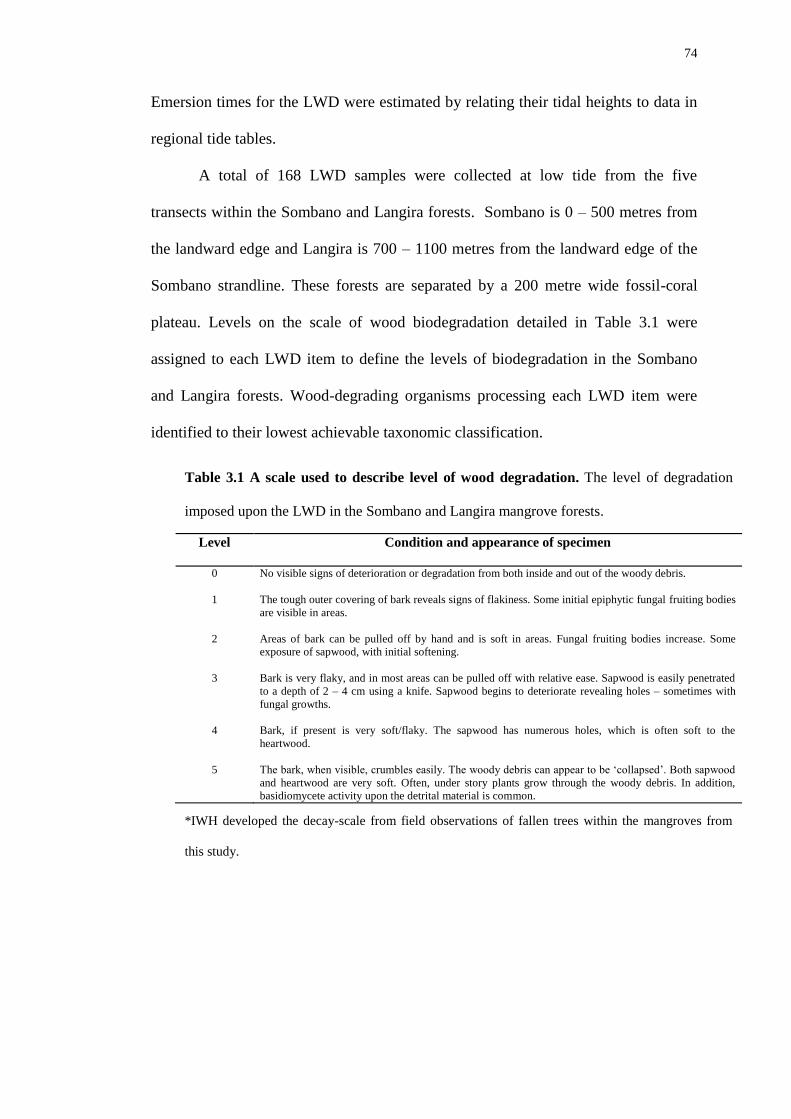
74
Emersion times for the LWD were estimated by relating their tidal heights to data in
regional tide tables.
A total of 168 LWD samples were collected at low tide from the five
transects within the Sombano and Langira forests. Sombano is 0 – 500 metres from
the landward edge and Langira is 700 – 1100 metres from the landward edge of the
Sombano strandline. These forests are separated by a 200 metre wide fossil-coral
plateau. Levels on the scale of wood biodegradation detailed in Table 3.1 were
assigned to each LWD item to define the levels of biodegradation in the Sombano
and Langira forests. Wood-degrading organisms processing each LWD item were
identified to their lowest achievable taxonomic classification.
Level Condition and appearance of specimen
0 No visible signs of deterioration or degradation from both inside and out of the woody debris.
1 The tough outer covering of bark reveals signs of flakiness. Some initial epiphytic fungal fruiting bodies
are visible in areas.
2 Areas of bark can be pulled off by hand and is soft in areas. Fungal fruiting bodies increase. Some
exposure of sapwood, with initial softening.
3 Bark is very flaky, and in most areas can be pulled off with relative ease. Sapwood is easily penetrated
to a depth of 2 – 4 cm using a knife. Sapwood begins to deteriorate revealing holes – sometimes with
fungal growths.
4 Bark, if present is very soft/flaky. The sapwood has numerous holes, which is often soft to the
heartwood.
5 The bark, when visible, crumbles easily. The woody debris can appear to be ‘collapsed’. Both sapwood
and heartwood are very soft. Often, under story plants grow through the woody debris. In addition,
basidiomycete activity upon the detrital material is common.
1
Table 3.1 A scale used to describe level of wood degradation. The level of degradation
imposed upon the LWD in the Sombano and Langira mangrove forests.
*IWH developed the decay-scale from field observations of fallen trees within the mangroves from
this study.
75
3.2.3 Wood degrading organisms and environmental factors in the Galua and
Laulua mangrove forests
Two mangrove forests, Galua and Laulua with no disruption of
environmental gradients by a fossil-coral plateau were chosen to investigate the
environmental factors that create the boundary change between terrestrial and marine
wood-degrading organisms (Figure 3.1 b). Eight, 10 m wide belt transects were used
to study the degradation boundary in the Galua forest and three, 30 m wide belt
transects were used to study the degradation boundary for the Laulua forest to
determine the biodegradation processes. In both mangrove forests the transects began
in areas dominated by terrestrial wood-degrading organisms, well above the high
intertidal zones and ended in areas where marine wood-degrading organisms
dominated at the seaward edges. A total of 583 and 332 pieces of LWD were
examined in the Galua and Laulua forests respectively. The volume of LWD items
were calculated for every piece investigated, and all wood-degrading organisms from
the LWD samples were identified. Salinities were measured using a Bellingham and
Stanley E-Line Aquatic hand-held Refractometer. Emersion times for the LWD items
in each transect was calculated using the results obtained from the shore heights
above sea level of from each transect and the local tide tables for Kaledupa.
Identification of marine and terrestrial woody detrital decomposers
Coleopteran larvae, worker and soldier termites, and pallets (the diagnostic
calcareous hard parts of teredinids) were stored in absolute ethanol and identified in
the laboratory. Digital images of all basidiomycete fruiting bodies and termites,
focussing on morphology and colour characteristics were used for identification

76
within the Galua, Laulua and Sombano forests using an Olympus E-510 SLR with a
50mm Macro-lens.
3.3 Data analysis
Mean values of the volumes of LWD between the sites, and at different tidal
heights were tested for statistical significance using an ANOVA, with sites and tidal
height as factors. A 1-way ANOVA was used to test for differences between the dry
weights of panels and distance from the strandline. A regression analysis was used
to determine differences between the percentage of the sectional area represented by
teredinid tunnels and the level of fragmentation imposed to each panel in the forests
and reefs. The non-parametric Kruskal-Wallis test was used to test for differences of
wood-decay. All percent data were normalized using Arcsin transformations. A
Tukey’s pairwise comparison test separated values into statistically distinct subsets
in all ANOVAs using MINITAB (MINITAB Inc, version 13.20).
Distance-based linear modeling (DISTLM) was employed to verify
relationships between different wood-degrading organisms and emersion time,
distance from the land (DFL) and salinity. DISTLM produces a sequential test,
which assess the variation each predictor (environmental variable) has on its own,
and a conditional test, which explains the variation of all the variables (McArdle and
Anderson, 2001). The most parsimonious model for predicting the distribution of
biodegrading organisms affected by emersion time, distance from the land, and
salinity was identified using the Akaike information criterion (AIC). AIC ranks
models from all possible combinations of the environmental variables. Distance-
based redundancy analyses (dbRDA) were used for visualizing the results as an
ordination, constrained to linear combinations of the predictor variables. The
DISTLM was based on presence/absence data with 4999 permutations and a
77
Sorensons transformation. DISTLM was performed using PRIMER+PERMANOVA
version 6.1.11.
3.4 Results
3.4.1 Wood degradation within the landward, Sombano and seaward, Langira
forests
The levels of decay estimated from 168 LWD samples within the Sombano
forest (Figure 3. 2 a) had the greatest percentage of the highest categories of
degradation - levels 4 and 5, and the lowest percentage of non-degraded LWD - level
zero. A decline in degradation at 400-500 metres was determined by the reduced
percentage frequency of the level 5 categories and increases of non-decayed level
zero LWD. Furthermore, in the Langira forest beyond the fossil-coral plateau at 700
metres from the landward edge, the decay levels of the LWD were very low,
evidenced by the high percentage of the level zero ratings combined with no level 5
ratings. The level of degradation is significantly lower with further distances from
the land (Kruskal-Wallis test, degradation rating vs. distance from land, P = < 0.001).
3.4.2 Sombano, Langira & Kal 1 panel analysis – wood loss
The percentage dry-weight loss of wood from the panels within the Sombano
and Langira forests and the Kal 1 reef site showed significant differences with
increasing distance from land (Figure 3.2 b). More wood was lost with increasing
distances from the land. No weight losses were detected from panels exposed within
Sombano. With increasing distance from the strandline and decreasing emersion
time, panels lost > 50 % of their weight.

78
3.4.3 The biodegrading organisms found on LWD
The basidiomycetes
Basidiomycetes were found only in the Sombano and Galua forests (Table
3.2). Both forests had distinct basidiomycete mycoflora, with the exception only of
Ganoderma sp. and Pycnoporus sanguineus, which were found in both forests
(Figure 3.3). The basidiomycetes mycoflora consisted of eight families and 13
species. Auricularia cornea, Favolus spp., Oudimansiella canari, Panaelus spp. and
Schizophyllum commune were found only in Galua even though their host substrata,
fallen Xylocarpus granatum trees, were common to both forests. Similarly, Lenzites
acuta were found only in Sombano even though its host, Bruguiera gymnorhiza is
found in both forests.

79
0
10
20
30
40
50
60
70
80
90
100
Fre
qu
ency
of
LW
D d
eca
y c
ate
go
ry (
%)
Level 5
Level 4
Level 3
Level 2
Level 1
Level 0FOSSIL
CORAL
PLATEAU
a a a a a
a bcd
b cd
d
cd d
0
5
10
15
20
25
0
20
40
60
80
100
120
0 20 100 240 380 500 720 820 940 980 1070 1500E
mer
sio
n t
ime
(ho
urs
)
% D
ry w
eig
ht
(gra
ms)
Distance from strandline (m)
Sombano Langira Emersion time (hours)
FOSSIL
CORAL
PLATEAU
Figure 3.2 Wood decay levels and wood loss in areas of the mangrove forests with
different emersion times with increasing distance from the land a, The frequency (%)
of decay levels assigned to the LWD (n = 168) within Sombano and Langira (refer to
Table 3.1); b, The percentage dry-weight loss of wooden panels (mean ± SE, 1-way
ANOVA, distance from land vs. percentage dry weight; F11, 48 = 178.75, p = < 0.001)
exposed for 12 months deployed in different areas of the Sombano and Langira forests
exposed to different emersion times (dashed line).
a
b
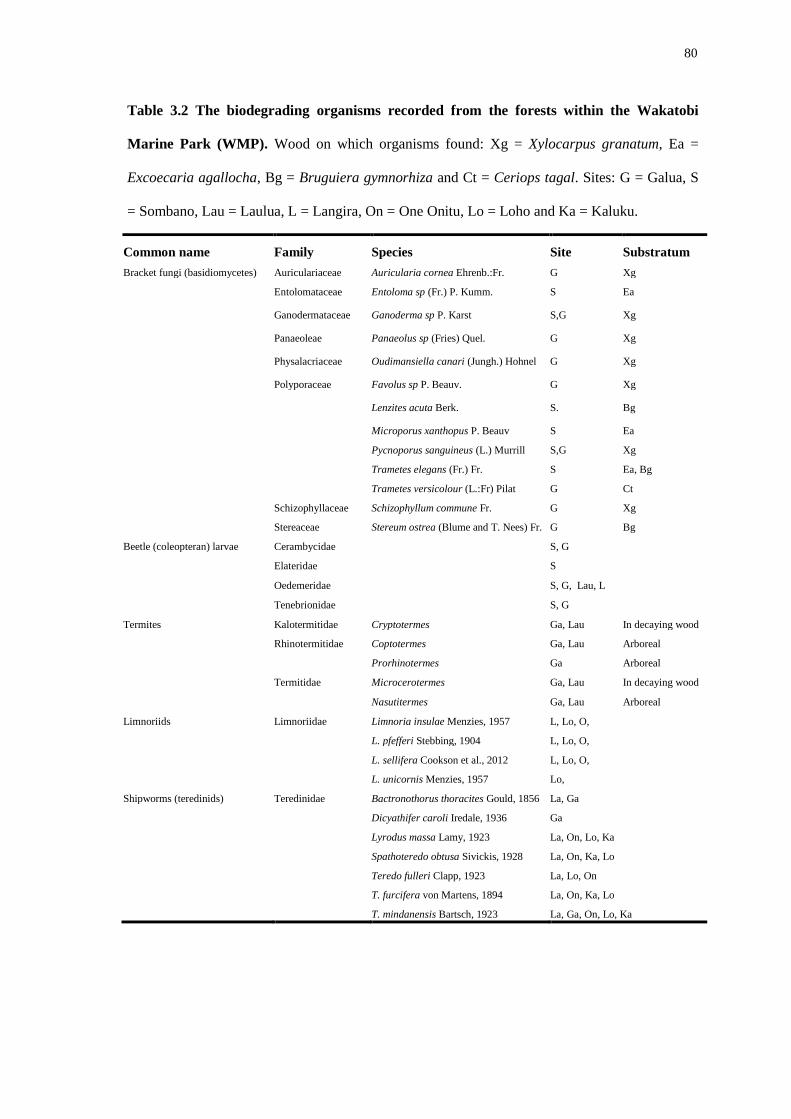
80
Common name Family Species Site Substratum
Bracket fungi (basidiomycetes) Auriculariaceae Auricularia cornea Ehrenb.:Fr. G Xg
Entolomataceae Entoloma sp (Fr.) P. Kumm. S Ea
Ganodermataceae Ganoderma sp P. Karst S,G Xg
Panaeoleae Panaeolus sp (Fries) Quel. G Xg
Physalacriaceae Oudimansiella canari (Jungh.) Hohnel G Xg
Polyporaceae Favolus sp P. Beauv. G Xg
Lenzites acuta Berk. S. Bg
Microporus xanthopus P. Beauv S Ea
Pycnoporus sanguineus (L.) Murrill S,G Xg
Trametes elegans (Fr.) Fr. S Ea, Bg
Trametes versicolour (L.:Fr) Pilat G Ct
Schizophyllaceae Schizophyllum commune Fr. G Xg
Stereaceae Stereum ostrea (Blume and T. Nees) Fr. G Bg
Beetle (coleopteran) larvae Cerambycidae
S, G
Elateridae
S
Oedemeridae
S, G, Lau, L
Tenebrionidae
S, G
Termites Kalotermitidae Cryptotermes Ga, Lau In decaying wood
Rhinotermitidae Coptotermes Ga, Lau Arboreal
Prorhinotermes Ga Arboreal
Termitidae Microcerotermes Ga, Lau In decaying wood
Nasutitermes Ga, Lau Arboreal
Limnoriids Limnoriidae Limnoria insulae Menzies, 1957 L, Lo, O,
L. pfefferi Stebbing, 1904 L, Lo, O,
L. sellifera Cookson et al., 2012 L, Lo, O,
L. unicornis Menzies, 1957 Lo,
Shipworms (teredinids) Teredinidae Bactronothorus thoracites Gould, 1856 La, Ga
Dicyathifer caroli Iredale, 1936 Ga
Lyrodus massa Lamy, 1923 La, On, Lo, Ka
Spathoteredo obtusa Sivickis, 1928 La, On, Ka, Lo
Teredo fulleri Clapp, 1923 La, Lo, On
T. furcifera von Martens, 1894 La, On, Ka, Lo
T. mindanensis Bartsch, 1923 La, Ga, On, Lo, Ka
Table 3.2 The biodegrading organisms recorded from the forests within the Wakatobi
Marine Park (WMP). Wood on which organisms found: Xg = Xylocarpus granatum, Ea =
Excoecaria agallocha, Bg = Bruguiera gymnorhiza and Ct = Ceriops tagal. Sites: G = Galua, S
= Sombano, Lau = Laulua, L = Langira, On = One Onitu, Lo = Loho and Ka = Kaluku.

81
Ganoderma sp. and Pycnoporus sanguineus were recorded from both forests, with
both basidiomycetes degrading fallen Xylocarpus granatum trees. All recorded
basidiomycetes within Sombano and Galua had host-specific substrata.
Schizophyllum commune was ubiquitous in the landward regions in the Galua forest,
on dead Xylocarpus granatum trees only. However, one exception was observed with
Trametes elegans which was found only in the Sombano forest, on Excoecaria
agallocha and Bruguiera gymnorhiza trees.
b a
c d
Figure 3.3 Basidiomycetes fruiting bodies decaying LWD. a, Pycnoporus sanguineus on a
fallen Xylocarpus sp. tree in the Galua forest; b, the fruiting bodies of Microporus xanthopus
on an Excoecaria agallocha snag in Sombano; c, Lenzites acuta decaying a fallen Bruguiera
gymnorhiza tree in Sombano; and d, Trametes elegans on a chopped E. agallocha tree in
Sombano.
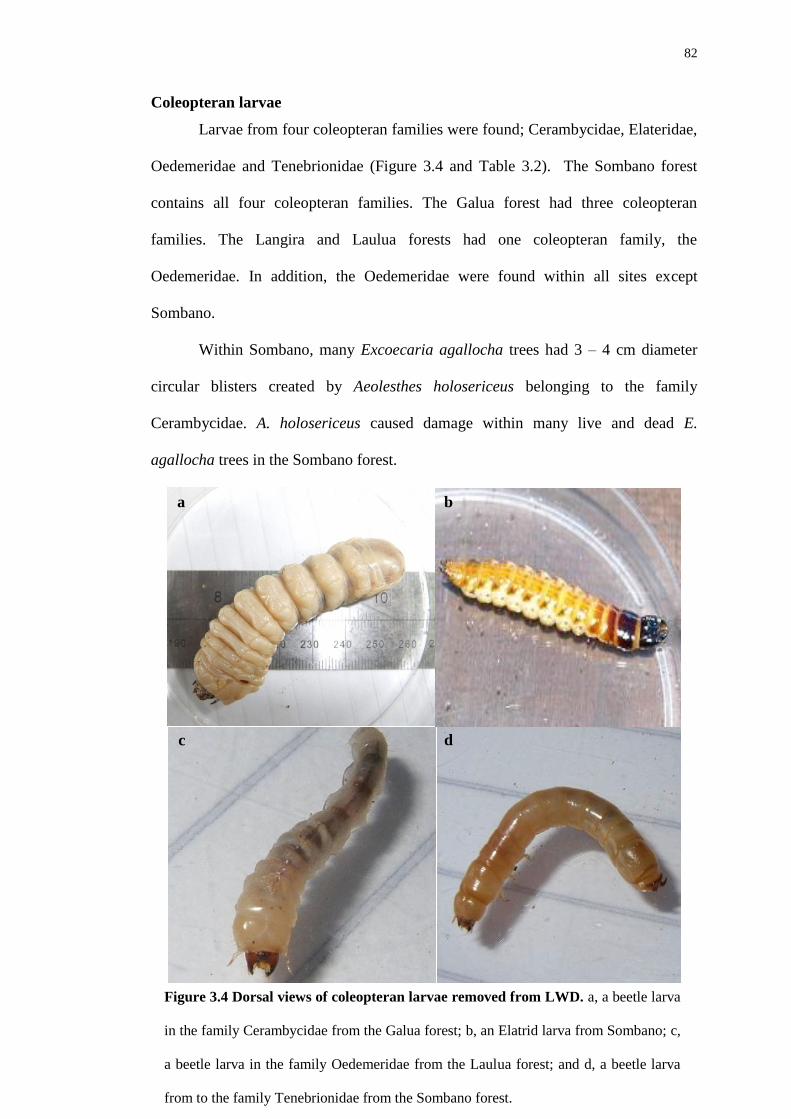
82
Coleopteran larvae
Larvae from four coleopteran families were found; Cerambycidae, Elateridae,
Oedemeridae and Tenebrionidae (Figure 3.4 and Table 3.2). The Sombano forest
contains all four coleopteran families. The Galua forest had three coleopteran
families. The Langira and Laulua forests had one coleopteran family, the
Oedemeridae. In addition, the Oedemeridae were found within all sites except
Sombano.
Within Sombano, many Excoecaria agallocha trees had 3 – 4 cm diameter
circular blisters created by Aeolesthes holosericeus belonging to the family
Cerambycidae. A. holosericeus caused damage within many live and dead E.
agallocha trees in the Sombano forest.
Figure 3.4 Dorsal views of coleopteran larvae removed from LWD. a, a beetle larva
in the family Cerambycidae from the Galua forest; b, an Elatrid larva from Sombano; c,
a beetle larva in the family Oedemeridae from the Laulua forest; and d, a beetle larva
from to the family Tenebrionidae from the Sombano forest.
a
d c
b
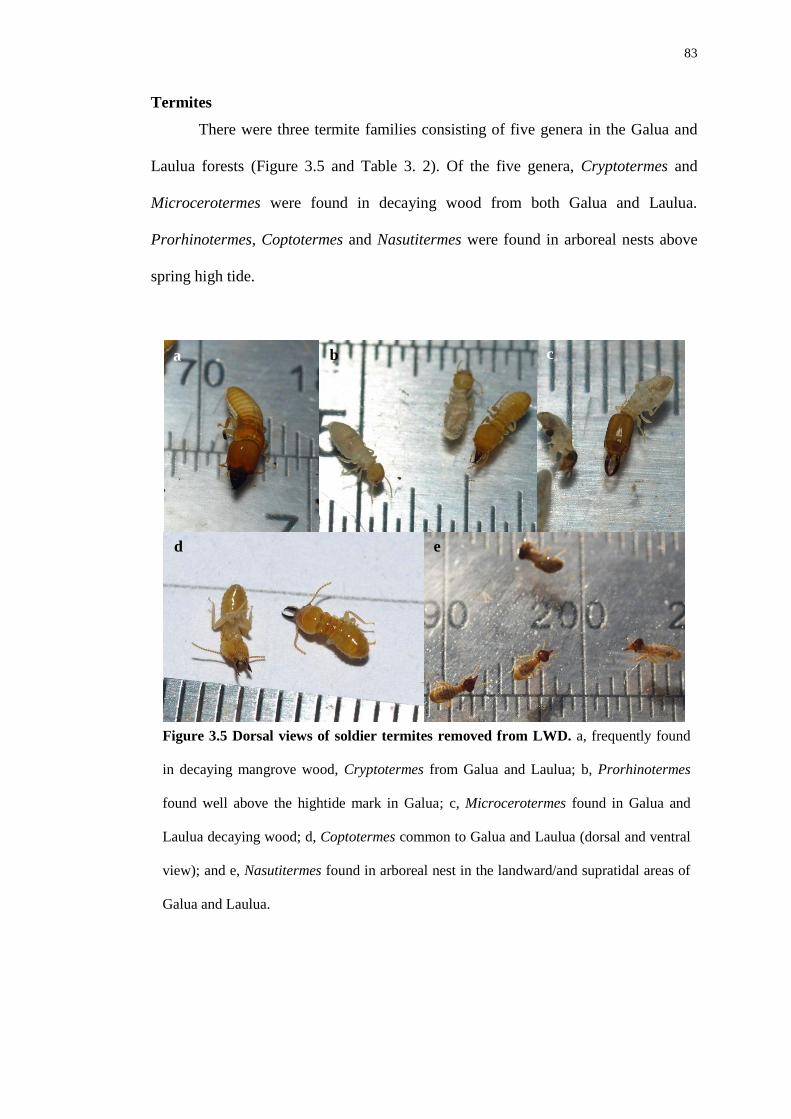
83
Termites
There were three termite families consisting of five genera in the Galua and
Laulua forests (Figure 3.5 and Table 3. 2). Of the five genera, Cryptotermes and
Microcerotermes were found in decaying wood from both Galua and Laulua.
Prorhinotermes, Coptotermes and Nasutitermes were found in arboreal nests above
spring high tide.
Figure 3.5 Dorsal views of soldier termites removed from LWD. a, frequently found
in decaying mangrove wood, Cryptotermes from Galua and Laulua; b, Prorhinotermes
found well above the hightide mark in Galua; c, Microcerotermes found in Galua and
Laulua decaying wood; d, Coptotermes common to Galua and Laulua (dorsal and ventral
view); and e, Nasutitermes found in arboreal nest in the landward/and supratidal areas of
Galua and Laulua.
a
e d
c b
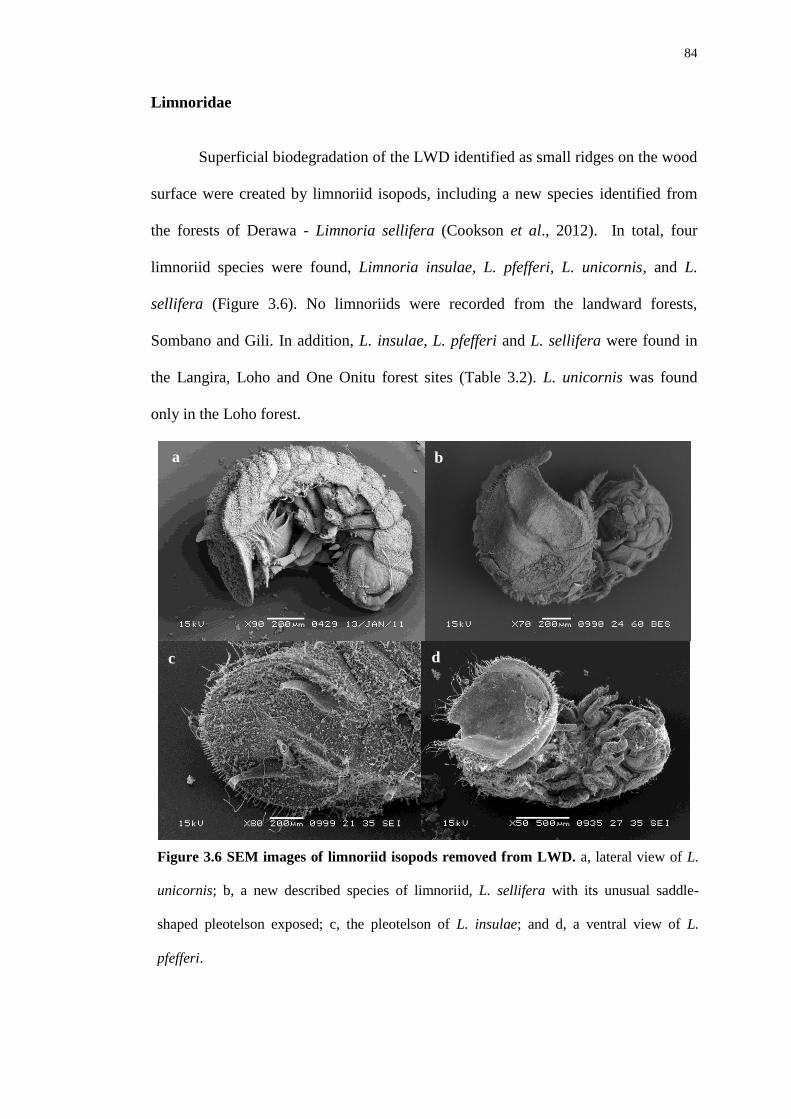
84
Limnoridae
Superficial biodegradation of the LWD identified as small ridges on the wood
surface were created by limnoriid isopods, including a new species identified from
the forests of Derawa - Limnoria sellifera (Cookson et al., 2012). In total, four
limnoriid species were found, Limnoria insulae, L. pfefferi, L. unicornis, and L.
sellifera (Figure 3.6). No limnoriids were recorded from the landward forests,
Sombano and Gili. In addition, L. insulae, L. pfefferi and L. sellifera were found in
the Langira, Loho and One Onitu forest sites (Table 3.2). L. unicornis was found
only in the Loho forest.
Teredinidae
Figure 3.6 SEM images of limnoriid isopods removed from LWD. a, lateral view of L.
unicornis; b, a new described species of limnoriid, L. sellifera with its unusual saddle-
shaped pleotelson exposed; c, the pleotelson of L. insulae; and d, a ventral view of L.
pfefferi.
a
d c
b
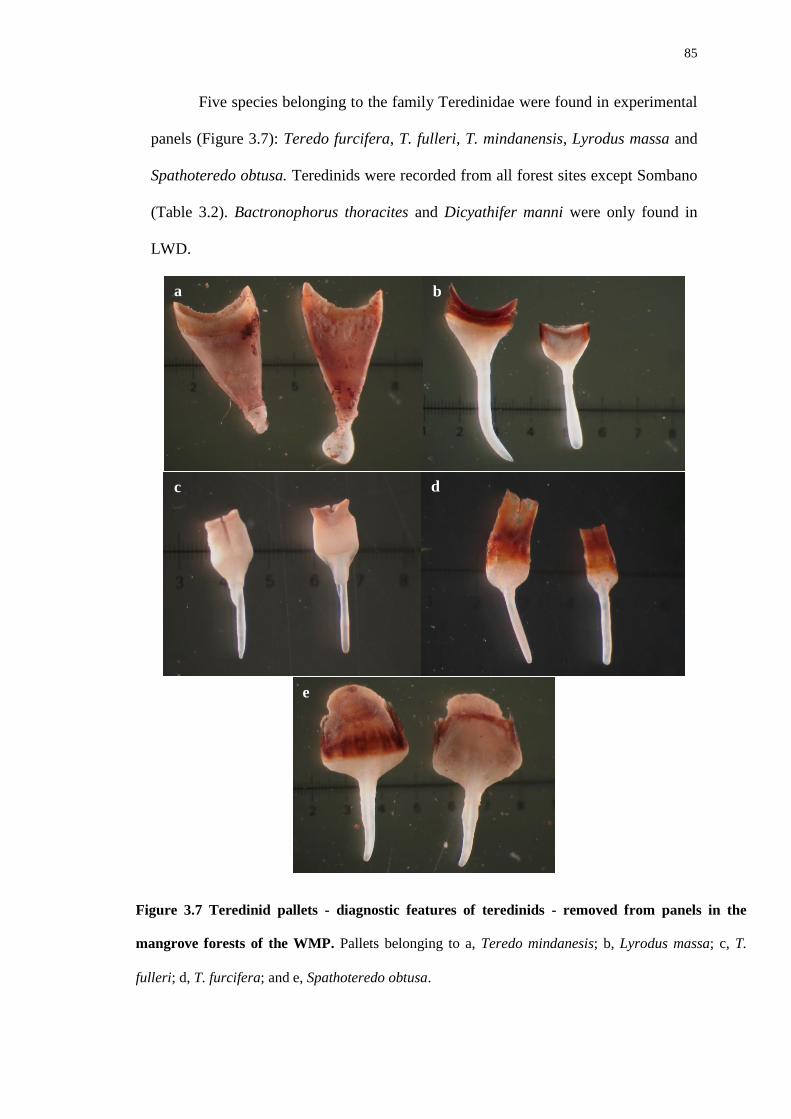
85
Five species belonging to the family Teredinidae were found in experimental
panels (Figure 3.7): Teredo furcifera, T. fulleri, T. mindanensis, Lyrodus massa and
Spathoteredo obtusa. Teredinids were recorded from all forest sites except Sombano
(Table 3.2). Bactronophorus thoracites and Dicyathifer manni were only found in
LWD.
Figure 3.7 Teredinid pallets - diagnostic features of teredinids - removed from panels in the
mangrove forests of the WMP. Pallets belonging to a, Teredo mindanesis; b, Lyrodus massa; c, T.
fulleri; d, T. furcifera; and e, Spathoteredo obtusa.
a b
e
d c
86
Polypore fungi, lignocellulose-degrading basidiomycetes are ubiquitous in
Sombano. All basidiomycetes were found on decaying fallen logs above the high tide
water mark. Other organisms including termites, Cryptotermes and Nasutitermes are
also common within Sombano, with extensive termite galleries frequently found
inside the LWD. Coleopteran larvae are also very common within decaying wood in
Sombano.
Beyond the fossil-coral plateau that separates Sombano from Langira, in the
seaward region of the forest distinct changes of the biodegradation of LWD were
found. These changes were evident by the rapid reduction of saprophytic decay with
increasing distance from the landward edge. The terrestrial biodegrading organisms;
basidiomycetes, termites and coleopteran larvae are not the main decomposers of
wood in the mid- to low- areas of the forests.
The Galua and Laulua forests contained the same wood-degrading organisms
found in LWD from Sombano and Langira. The coleopteran and termite
communities in the Laulua forest had similar distributions of those recorded from
Galua. Neither coleopteran larvae nor termites were found beyond 170 metres from
the land in the Galua forest. Combinations of termites and coleopteran larvae,
termites and basidiomycetes, and coleopteran larvae and basidiomycetes were found
together processing twenty-two items of fallen wood in the high intertidal of Galua.
One item of LWD in the Laulua forest contained termites and coleopteran larvae in
the high intertidal. Furthermore, only two items of LWD from the Galua and Laulua
forests contained teredinids and coleopteran larvae together in the low intertidal. All
other wood-biodegrading organisms identified from the LWD in Galua and Laulua
forests were found exclusively on their own.

87
3.4.4 The volume of LWD in mangrove forests
The total volumes of LWD varied between the sites (ANOVA, F3, 66 = 18.31,
p = < 0.001). Sombano had the greatest volume of LWD, when compared to the
Langira, Galua and Laulua forests (Figure 3.8). The volume of LWD also varied at
different tidal heights between the sites (ANOVA, F3, 66 = 9.58, p = < 0.001). The
volume of LWD pieces from Sombano was 0.16 ± 0.025 m3
and the largest log
recorded was 9.6 m3. The volume of LWD pieces from Langira was 0.03 ± 0.004 m
3
and the largest log was 0.4 m3. The height above sea level recorded for Sombano was
2 ± 0.11 metres above sea level and the mean height above sea level recorded for
Langira was 1 ± 0.35 metres above sea level. In the Galua forest, the total volume of
dead wood was significantly greater at the strandline, more than 2m above sea level,
when compared to areas further out to the seaward edge, which are between 1.99 -
1.90 and less than 1.90m above sea level. The largest log located in Galua at more
than 2.0 metres above sea level was 1.83 m3. The largest logs at 1.99 – 1.90 and less
than 1.90 metres above sea level were 0.48 m3
and 0.32 m3
respectively. The volume
of dead wood for the Laulua forest was lower than that in the Galua forest. The
largest log located at Laulua was also found at more than 2.0 metres above sea level
was 0.5 m3, and 0.08 m
3 and 0.05 m
3 at 1.99 – 1.90 and less than 1.90 metres above
sea level respectively.
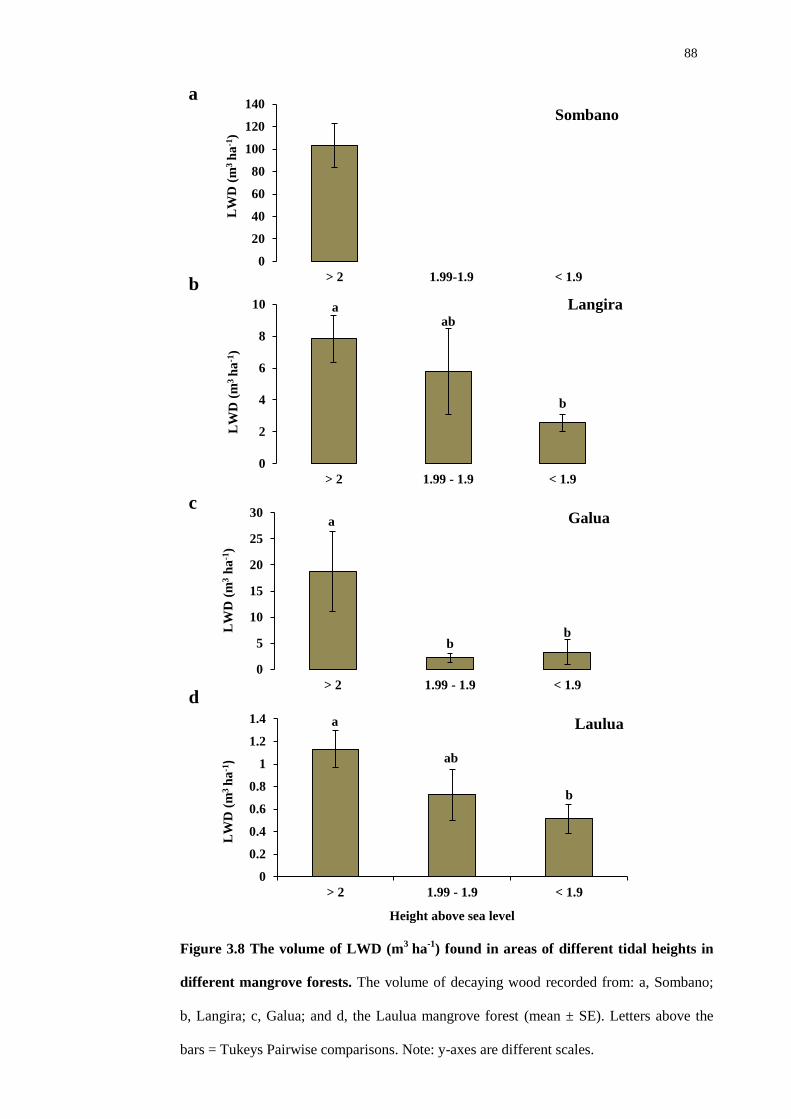
88
0
20
40
60
80
100
120
140
> 2 1.99-1.9 < 1.9
LW
D (
m3 h
a-1
)
Sombano
a ab
b
0
2
4
6
8
10
> 2 1.99 - 1.9 < 1.9
LW
D (
m3 h
a-1
)
Langira
a
b b
0
5
10
15
20
25
30
> 2 1.99 - 1.9 < 1.9
LW
D (
m3 h
a-1
)
Galua
a
ab
b
0
0.2
0.4
0.6
0.8
1
1.2
1.4
> 2 1.99 - 1.9 < 1.9
LW
D (
m3
ha
-1)
Height above sea level
Laulua
Figure 3.8 The volume of LWD (m3
ha-1
) found in areas of different tidal heights in
different mangrove forests. The volume of decaying wood recorded from: a, Sombano;
b, Langira; c, Galua; and d, the Laulua mangrove forest (mean ± SE). Letters above the
bars = Tukeys Pairwise comparisons. Note: y-axes are different scales.
a
b
c
d

89
3.4.5 Wood-degrading organism distribution and environmental variables –
emersion, distance from the land and salinity
In Galua, basidiomycetes had the greatest emersion time (Figure 3.9 a, 1-way
ANOVA, emersion time vs. Galua biodegradation processes; F3, 442 = 318.52, p = <
0.001). The termites and coleopteran larvae had no difference of emersion time,
although both animals had a lower recorded emersion time than basidiomycetes. The
Teredinidae had the lowest emersion time compared with the emersion times of all
the terrestrial wood-degrading organisms recorded in this study.
Similar observations were found from Laulua (Figure 3.9 b 1-way ANOVA,
emersion time vs. Laulua biodegradation processes; F2, 103 = 211.77, p = < 0.001).
The differences of the emersion times calculated for each of the biodegradation
processes, clearly demonstrate that the Teredinidae had the least emersion time
compared with the terrestrial wood-degrading organisms.
Differences of salinity levels from the strandline out to the seaward edge
were found in Laulua. The soil salinity levels recorded in areas where the
coleopteran larvae, termites and the Teredinidae dominated were 42.4 ± 1.0, 44.2 ±
1.1 and 33.4 ± 0.2 respectively (1-way ANOVA: F2, 103 = 103.15, p = < 0.001). The
mean distances from land for the coleopteran larvae, termites and the Teredinidae
were 59.14 ± 9.07, 59.48 ± 10.43 and 201.37 ± 2.12 metres respectively (1-way
ANOVA: F2, 103 = 207.91, p < 0.001).

90
In all areas of each forest where terrestrial wood-degradation occurred the
heights above mean sea level were higher than in areas of the forest exposed to
marine biodegradation only - refer to map (Figure 3.1 b, 1-way ANOVA, height
above sea level vs. intertidal zone, F5,644 = 236.84, p = < 0.001).
As emersion time decreases, the biodegrading organisms processing LWD
change from terrestrial to marine organisms (Figure 3. 10 a and b).
a
b b
c
0
5
10
15
20
25
Basidiomycetes Coleopteran
larvae
Termites Teredinids
Mea
n e
mer
sio
n (
h)
Galua
a a
b
0
5
10
15
20
25
Basidiomycetes Coleopteran
larvae
Termites Teredinids
Mea
n e
mer
sio
n (
h)
Wood-degrading organism
Laulua
Absent
in forest
a
b
Figure 3.9 Emersion times (hours) of wood-degrading organisms removed from
LWD. a, wood-degrading organisms from Galua; and b, Laulua (mean ± SE).
a
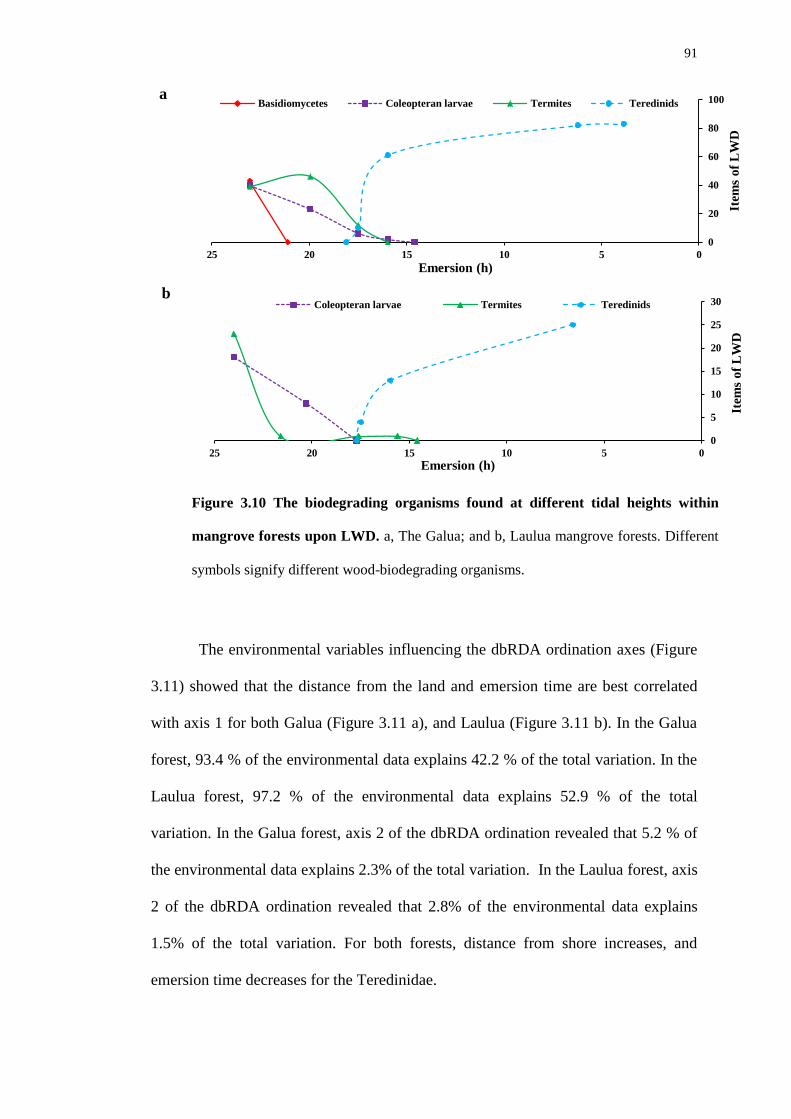
91
The environmental variables influencing the dbRDA ordination axes (Figure
3.11) showed that the distance from the land and emersion time are best correlated
with axis 1 for both Galua (Figure 3.11 a), and Laulua (Figure 3.11 b). In the Galua
forest, 93.4 % of the environmental data explains 42.2 % of the total variation. In the
Laulua forest, 97.2 % of the environmental data explains 52.9 % of the total
variation. In the Galua forest, axis 2 of the dbRDA ordination revealed that 5.2 % of
the environmental data explains 2.3% of the total variation. In the Laulua forest, axis
2 of the dbRDA ordination revealed that 2.8% of the environmental data explains
1.5% of the total variation. For both forests, distance from shore increases, and
emersion time decreases for the Teredinidae.
0
20
40
60
80
100
0510152025
Item
s o
f L
WD
Emersion (h)
Basidiomycetes Coleopteran larvae Termites Teredinids
0
5
10
15
20
25
30
0510152025
Item
s o
f L
WD
Emersion (h)
Coleopteran larvae Termites Teredinids
Figure 3.10 The biodegrading organisms found at different tidal heights within
mangrove forests upon LWD. a, The Galua; and b, Laulua mangrove forests. Different
symbols signify different wood-biodegrading organisms.
a
b

92
Figure 3.11 dbRDA ordinations. a, in the Galua forest the vectors of presence/absence of wood-degrading
organisms in LWD with bubble-plots showing environmental variables that have the strongest influence on the wood-
degrading organisms. The dbRDA axes explain the percentage variation of the most parsimonious fit; and b, in the
Laulua forest. Inset boxes - show each environmental variable: DFL = distance from land (m), and emersion time (h).
a
b
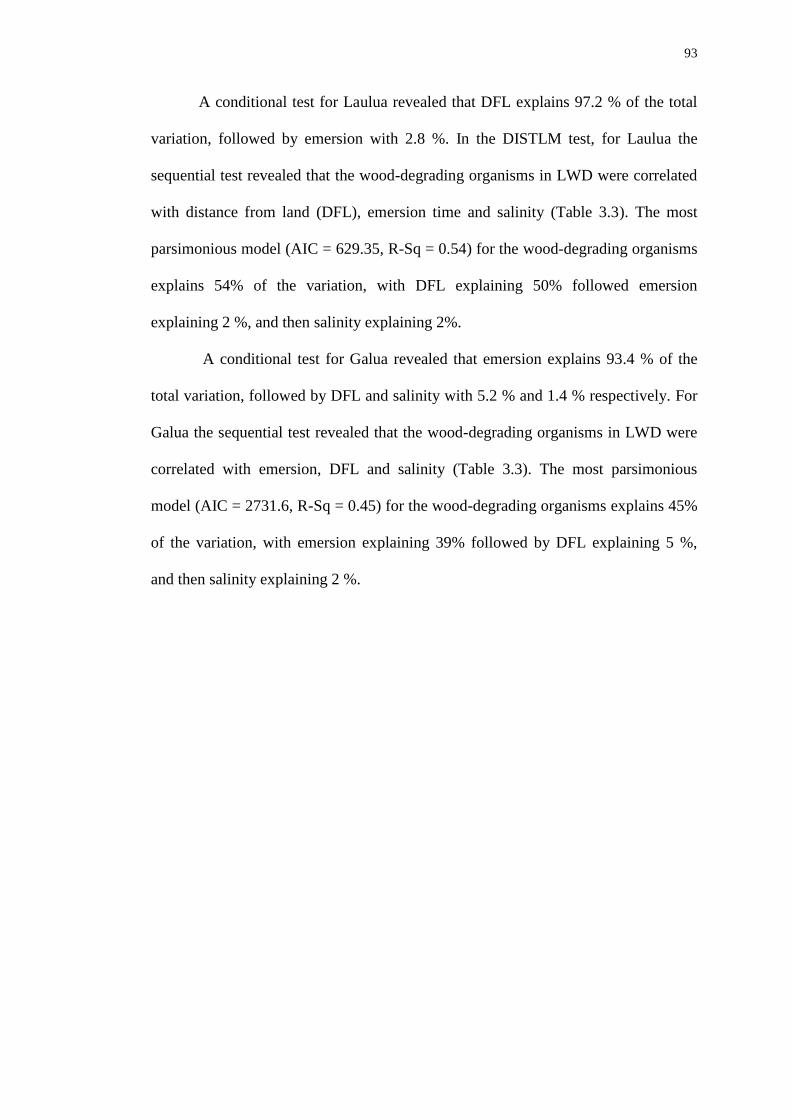
93
A conditional test for Laulua revealed that DFL explains 97.2 % of the total
variation, followed by emersion with 2.8 %. In the DISTLM test, for Laulua the
sequential test revealed that the wood-degrading organisms in LWD were correlated
with distance from land (DFL), emersion time and salinity (Table 3.3). The most
parsimonious model (AIC = 629.35, R-Sq = 0.54) for the wood-degrading organisms
explains 54% of the variation, with DFL explaining 50% followed emersion
explaining 2 %, and then salinity explaining 2%.
A conditional test for Galua revealed that emersion explains 93.4 % of the
total variation, followed by DFL and salinity with 5.2 % and 1.4 % respectively. For
Galua the sequential test revealed that the wood-degrading organisms in LWD were
correlated with emersion, DFL and salinity (Table 3.3). The most parsimonious
model (AIC = 2731.6, R-Sq = 0.45) for the wood-degrading organisms explains 45%
of the variation, with emersion explaining 39% followed by DFL explaining 5 %,
and then salinity explaining 2 %.
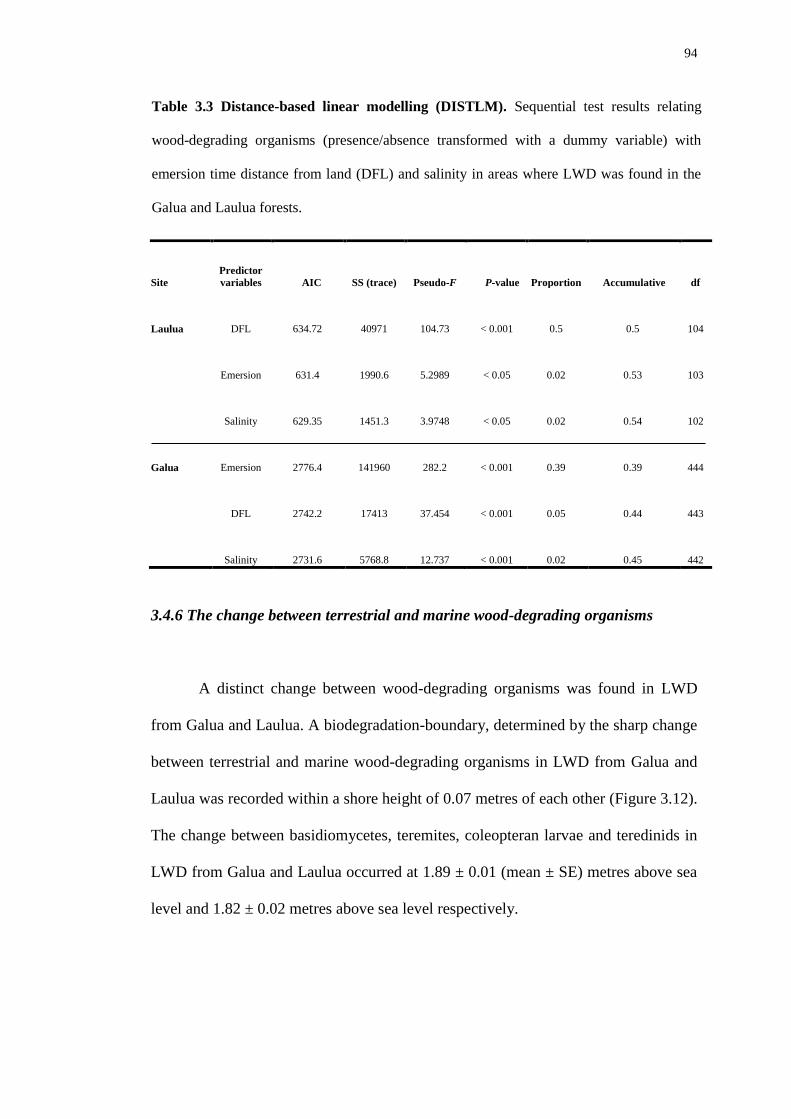
94
Site Predictor
variables AIC SS (trace) Pseudo-F P-value
Proportion Accumulative df
Laulua DFL 634.72 40971 104.73 < 0.001 0.5 0.5 104
Emersion 631.4 1990.6 5.2989 < 0.05 0.02 0.53 103
Salinity 629.35 1451.3 3.9748 < 0.05 0.02 0.54 102
Galua Emersion 2776.4 141960 282.2 < 0.001 0.39 0.39 444
DFL 2742.2 17413 37.454 < 0.001 0.05 0.44 443
Salinity 2731.6 5768.8 12.737 < 0.001 0.02 0.45 442
3.4.6 The change between terrestrial and marine wood-degrading organisms
A distinct change between wood-degrading organisms was found in LWD
from Galua and Laulua. A biodegradation-boundary, determined by the sharp change
between terrestrial and marine wood-degrading organisms in LWD from Galua and
Laulua was recorded within a shore height of 0.07 metres of each other (Figure 3.12).
The change between basidiomycetes, teremites, coleopteran larvae and teredinids in
LWD from Galua and Laulua occurred at 1.89 ± 0.01 (mean ± SE) metres above sea
level and 1.82 ± 0.02 metres above sea level respectively.
Table 3.3 Distance-based linear modelling (DISTLM). Sequential test results relating
wood-degrading organisms (presence/absence transformed with a dummy variable) with
emersion time distance from land (DFL) and salinity in areas where LWD was found in the
Galua and Laulua forests.

95
0
100
200
300
400
500
600
700
800
900
1000
0 50 100 150 200 250 300
Dis
tan
ce f
rom
sh
ore
lin
e (m
)
Distance along strandline (m)
Basidiomycetes Coleopteran larvae Teredinidae
Termites Boundary
0
50
100
150
200
250
0 20 40 60 80 100 120 140 160 180 200
Dis
tan
ce f
rom
sh
ore
lin
e (m
)
Distance along strandline (m)
a
b
Galua
Laulua
Figure 3.12 The distribution of wood-degrading organisms in LWD. a, wood-degrading
organisms identified as different symbols in the Galua; and b, Laulua forests. Dotted line =
boundary between terrestrial and marine wood-degraders. All LWD items with no visible
degradation were not plotted, and the area between 220 – 600 metres in Galua was not sampled.

96
3.4.7 Teredinid panel-fragmentation
Analysis of panel fragmentation demonstrated that with increasing teredinid
attack intensity an increasing percentage of the panel broke-up (Figure 3. 13,
Regression analysis, R-Sq (adj) = 0.41, p = < 0.001). Within mangrove forests and in
reef sites, the percentage of the sectional area represented by tunnels vs. the
fragmentation of panels remaining found that teredinid activity and panel
fragmentation increased in the reef sites compared with panels exposed in the forests.
Across the longitudinal section of each panel from the mangrove sites, the percentage
of the sectional area represented by teredinid tunnels was 35.1 ± 4.3 % (mean ± SE, n
= 30) and the percentage surface area of mangrove panel-loss (fragmentation) was
1.8 ± 0.6 %. Within the reef sites across the longitudinal section of each panel, the
percentage of the sectional area represented by teredinid tunnels was 92.4 ± 1.4 %
(mean ± SE, n = 30), and the percentage surface area of the reef panel-loss was 29.1
± 4.3 %.
0
10
20
30
40
50
60
70
80
0 20 40 60 80 100
% o
f to
tal
pan
el l
oss
% of total area represented by teredinid tunnels
Intertidal Subtidal
Figure 3.13 Wood loss through teredinid activity within panels in mangrove forests and coral
reefs. The percentage of total panel loss estimated from panels exposed to different levels of teredinid
attack within intertidal (grey dots) and subtidal (black dots) environments (regression analysis,
teredinid attack intensity vs. panel fragmentation; F1,58 = 41.32, p = < 0.001).

97
The mangrove forests in the Tukang Besi Archipelago have a wide range of
LWD volume, comparable with other mangrove forests from different countries
(Table 3.4). The Sombano forest had an LWD volume similar to the upper ranges of
LWD volume reported from Micronesia (Allen et al., 2000) and Florida mangrove
forests hit by hurricanes (Krauss et al., 2005).
Country Mangrove LWD volume (m3 ha
-1) Reference
Micronesia
Yap 35.1 Allen et al., 2000
Pohnpei 43.1
Kosrae 104.2
USA
Taylor River 12.6 Krauss et al., 2005
Johnson Mound
Creek
56
Everglades 147.9
Malaysia
160 Chan, 1982
Indonesia
Laulua 0.8 This study
Langira 4.6
Galua 8.1
Sombano 102.9
3.5 Discussion
The volume of LWD estimated from the Galua and Langira forests are
similar to the small forests found in Florida. However, in the Laulua forest the
volume of LWD was very low. This is not surprising as this mangrove forest had
been heavily harvested. In addition, the volume of living biomass reported in chapter
two reflect the volume of LWD produced from those same forests. The carbon
Table 3.4 Volume estimates of LWD (metre cubed per hectare) from different
mangrove forests. LWD volume data reported from mangrove forests outside of
Indonesia were obtained from other studies.
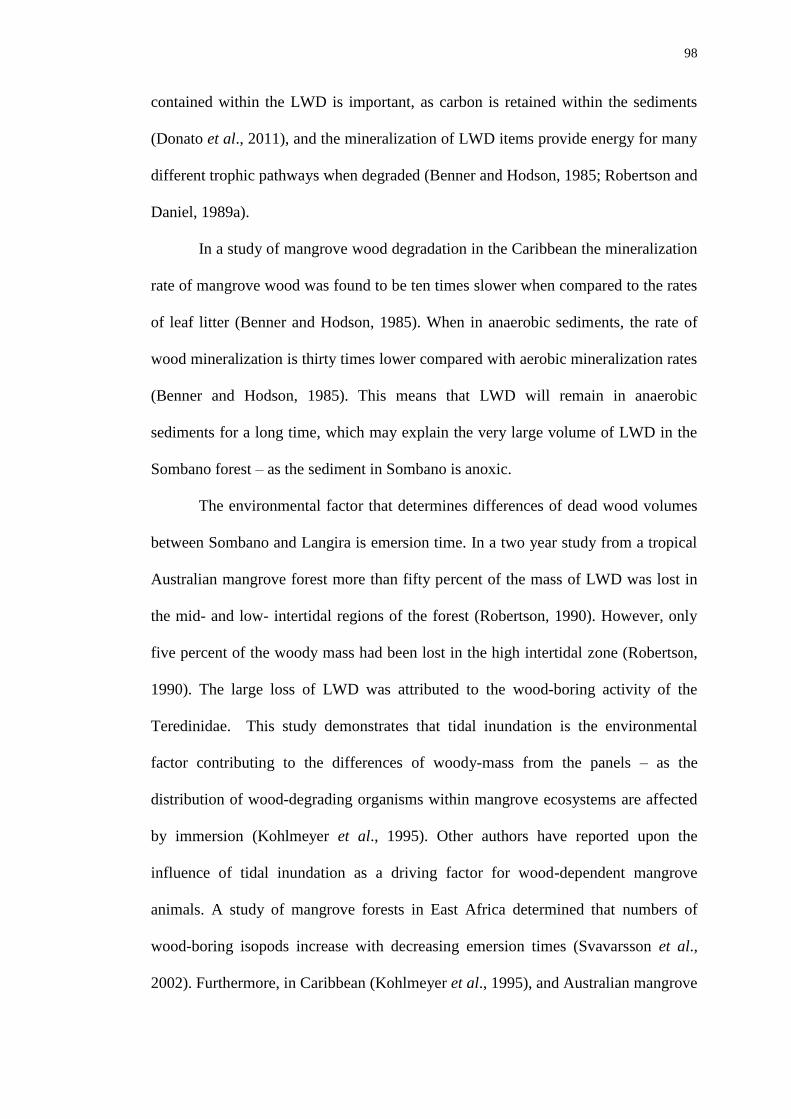
98
contained within the LWD is important, as carbon is retained within the sediments
(Donato et al., 2011), and the mineralization of LWD items provide energy for many
different trophic pathways when degraded (Benner and Hodson, 1985; Robertson and
Daniel, 1989a).
In a study of mangrove wood degradation in the Caribbean the mineralization
rate of mangrove wood was found to be ten times slower when compared to the rates
of leaf litter (Benner and Hodson, 1985). When in anaerobic sediments, the rate of
wood mineralization is thirty times lower compared with aerobic mineralization rates
(Benner and Hodson, 1985). This means that LWD will remain in anaerobic
sediments for a long time, which may explain the very large volume of LWD in the
Sombano forest – as the sediment in Sombano is anoxic.
The environmental factor that determines differences of dead wood volumes
between Sombano and Langira is emersion time. In a two year study from a tropical
Australian mangrove forest more than fifty percent of the mass of LWD was lost in
the mid- and low- intertidal regions of the forest (Robertson, 1990). However, only
five percent of the woody mass had been lost in the high intertidal zone (Robertson,
1990). The large loss of LWD was attributed to the wood-boring activity of the
Teredinidae. This study demonstrates that tidal inundation is the environmental
factor contributing to the differences of woody-mass from the panels – as the
distribution of wood-degrading organisms within mangrove ecosystems are affected
by immersion (Kohlmeyer et al., 1995). Other authors have reported upon the
influence of tidal inundation as a driving factor for wood-dependent mangrove
animals. A study of mangrove forests in East Africa determined that numbers of
wood-boring isopods increase with decreasing emersion times (Svavarsson et al.,
2002). Furthermore, in Caribbean (Kohlmeyer et al., 1995), and Australian mangrove

99
forests (Robertson and Daniel, 1989a; Robertson, 1990) teredinids also increase with
decreasing emersion times.
In Sombano, the decay of mangrove wood was very slow – no loss of wood
was found from the panels even after one year exposure. The slow degradation of
LWD may be due to the anoxic substrata and the kinds wood-degrading organisms
found within LWD in that forest. It is known that wood decay in anaerobic
environments is very slow (Benner and Hodson, 1985). However, woody debris in
Langira may be exported by tidal water flow, meaning that the usual wood
degradation processes may not have time to initiate the lignocellulose breakdown
before the physical processes such as tidal flow exports wood from the forest. Tidal
inundation is particularly important in the mid- to low-intertidal areas of mangrove
forests, as tidal flow will frequently export much of the woody debris (Boto and
Bunt, 1982; Robertson and Daniel, 1989a). Differences of degradation processes
magnify the importance of nutrient recycling in mangrove ecosystems (Lang and
Knight, 1979), as wood degrades at different rates from the high to low intertidal
regions of mangrove forests (Sherman et al., 2003) - due to differences of wood-
degrading organisms from the high to low intertidal regions (Kohlmeyer et al.,
1995).
Wood decay is accelerated further inland when compared to wood decay in
the seaward zones (Sherman et al., 2003). Wood-degradation is dependent on habitat
characteristics such as decomposer communities, tidal energies, site fertility and
ambient temperatures (Davis et al., 2003). In the Sombano forest, the biodegradation
processes that break down LWD are conducted by organisms that are also frequently
found in terrestrial forests such as beetles (Novotny et al., 2006), termites (Jones and
Eggleton, 2000) and basidiomycete fungi (Tedersoo et al., 2003).

100
However, in the Langira forest the wood-degrading organisms were different.
Unlike the Sombano, in the high-intertidal, the Langira forest extends down to mean
sea-level. Waterlogged LWD will be inhibited from saprophytic decay by obstructing
fungal growth due to the limited availability of oxygen, therefore decreasing
respiration rates - further explaining the lack of basidiomycetes in areas of the forest
with reduced emersion times (Progar et al., 2000).
In the landward regions of the Galua forest, as in Sombano basidiomycetes
were found upon many items of LWD, and this wood was very soft due to the high
level of decay. Wood-decaying fungi are essential for the functioning of forest
ecosystems (Lonsdale et al., 2008; Ananda and Sridhar, 2004), as they control the
primary breakdown of wood. This means that basidiomycetes are particularly
important in the high-intertidal regions of Galua and in the Sombano forest as there
was a large volume of LWD. Of the known 900 marine fungi, 358 have been
recorded from mangrove ecosystems (Maria and Sridhar, 2002; Maria and Sridhar,
2003). However, both terrestrial and marine fungi are involved in the decomposition
of litter in mangrove ecosystems (Ananda and Sridhar, 2004). Marine fungi are able
to tolerate salinity, anoxic sediments and tidal inundation (Kohlmeyer et al., 1995;
Gilbert and Sousa, 2002). Salt-tolerant fungi are found on a variety of substrata such
as LWD, macroalgae, seagrasses and even deep sea sediments (Ravikumar et al.,
2009). Terrestrial fungi within mangrove ecosystems are often ignored as transient
mycoflora (Maria and Sridhar, 2003; Ananda and Sridhar, 2004), even though they
contribute to substantial woody degradation due to their lignin-modifying enzymes
(Nilsson, 1973).
Differences of the mangrove mycoflora were found between the mangrove
forests. A variety of fungi develop within an assortment of different ecological
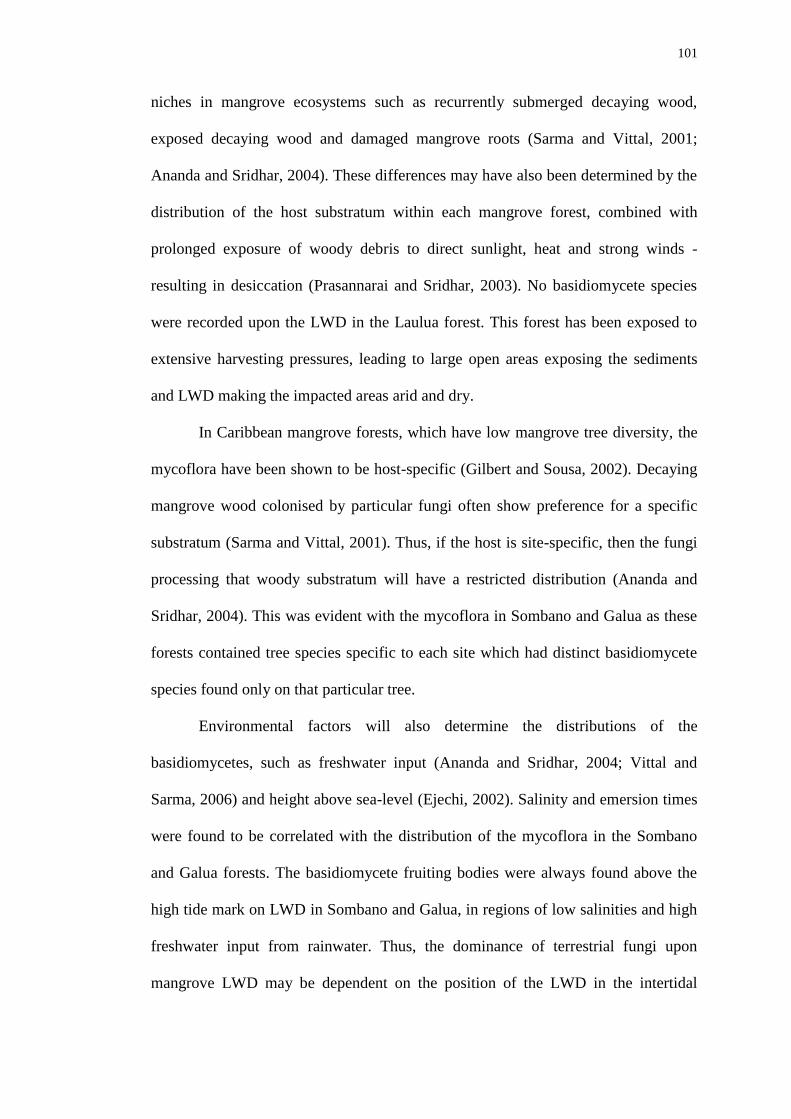
101
niches in mangrove ecosystems such as recurrently submerged decaying wood,
exposed decaying wood and damaged mangrove roots (Sarma and Vittal, 2001;
Ananda and Sridhar, 2004). These differences may have also been determined by the
distribution of the host substratum within each mangrove forest, combined with
prolonged exposure of woody debris to direct sunlight, heat and strong winds -
resulting in desiccation (Prasannarai and Sridhar, 2003). No basidiomycete species
were recorded upon the LWD in the Laulua forest. This forest has been exposed to
extensive harvesting pressures, leading to large open areas exposing the sediments
and LWD making the impacted areas arid and dry.
In Caribbean mangrove forests, which have low mangrove tree diversity, the
mycoflora have been shown to be host-specific (Gilbert and Sousa, 2002). Decaying
mangrove wood colonised by particular fungi often show preference for a specific
substratum (Sarma and Vittal, 2001). Thus, if the host is site-specific, then the fungi
processing that woody substratum will have a restricted distribution (Ananda and
Sridhar, 2004). This was evident with the mycoflora in Sombano and Galua as these
forests contained tree species specific to each site which had distinct basidiomycete
species found only on that particular tree.
Environmental factors will also determine the distributions of the
basidiomycetes, such as freshwater input (Ananda and Sridhar, 2004; Vittal and
Sarma, 2006) and height above sea-level (Ejechi, 2002). Salinity and emersion times
were found to be correlated with the distribution of the mycoflora in the Sombano
and Galua forests. The basidiomycete fruiting bodies were always found above the
high tide mark on LWD in Sombano and Galua, in regions of low salinities and high
freshwater input from rainwater. Thus, the dominance of terrestrial fungi upon
mangrove LWD may be dependent on the position of the LWD in the intertidal
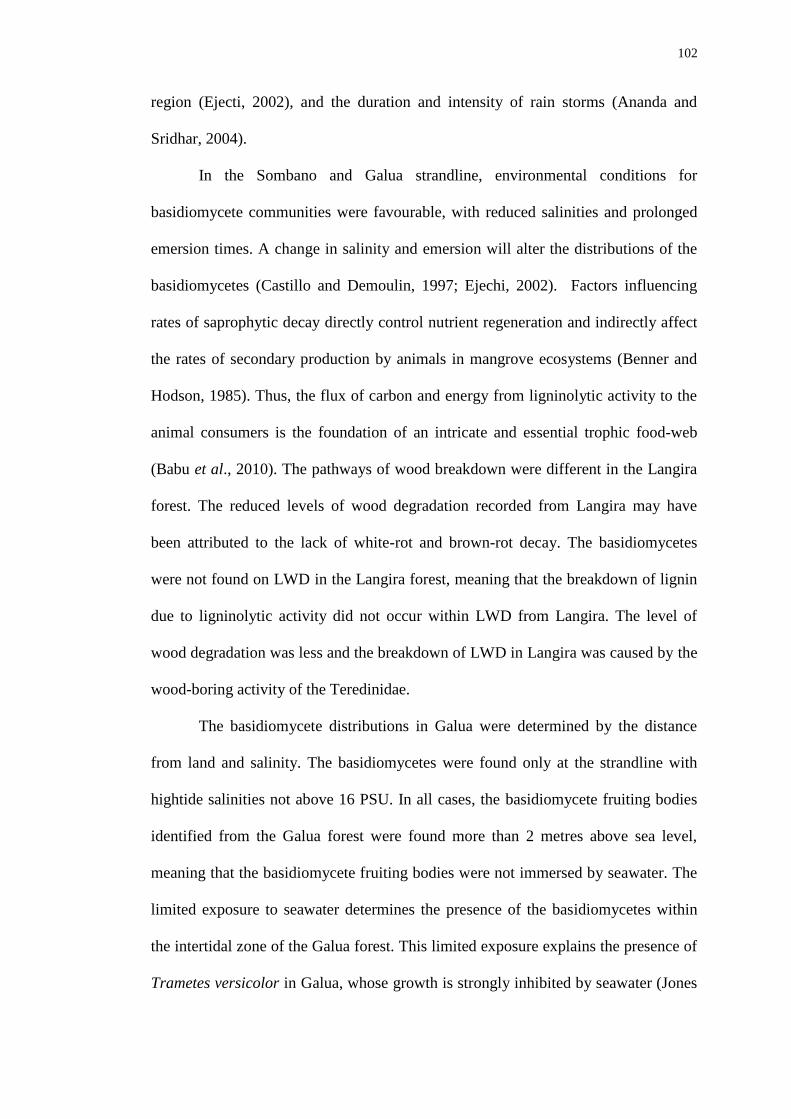
102
region (Ejecti, 2002), and the duration and intensity of rain storms (Ananda and
Sridhar, 2004).
In the Sombano and Galua strandline, environmental conditions for
basidiomycete communities were favourable, with reduced salinities and prolonged
emersion times. A change in salinity and emersion will alter the distributions of the
basidiomycetes (Castillo and Demoulin, 1997; Ejechi, 2002). Factors influencing
rates of saprophytic decay directly control nutrient regeneration and indirectly affect
the rates of secondary production by animals in mangrove ecosystems (Benner and
Hodson, 1985). Thus, the flux of carbon and energy from ligninolytic activity to the
animal consumers is the foundation of an intricate and essential trophic food-web
(Babu et al., 2010). The pathways of wood breakdown were different in the Langira
forest. The reduced levels of wood degradation recorded from Langira may have
been attributed to the lack of white-rot and brown-rot decay. The basidiomycetes
were not found on LWD in the Langira forest, meaning that the breakdown of lignin
due to ligninolytic activity did not occur within LWD from Langira. The level of
wood degradation was less and the breakdown of LWD in Langira was caused by the
wood-boring activity of the Teredinidae.
The basidiomycete distributions in Galua were determined by the distance
from land and salinity. The basidiomycetes were found only at the strandline with
hightide salinities not above 16 PSU. In all cases, the basidiomycete fruiting bodies
identified from the Galua forest were found more than 2 metres above sea level,
meaning that the basidiomycete fruiting bodies were not immersed by seawater. The
limited exposure to seawater determines the presence of the basidiomycetes within
the intertidal zone of the Galua forest. This limited exposure explains the presence of
Trametes versicolor in Galua, whose growth is strongly inhibited by seawater (Jones

103
and Byrne, 1976 cited in Castillo and Demoulin, 1997). The distributions of
Microporus xanthopus and Pycnoporus sanguineus in coastal forests from Papua
New Guinea were limited by their restricted abilities to cope with high salinity
concentrations (Castillo and Demoulin, 1997), which corroborates this study.
Nonetheless, P. sanguineus had similar distributions to the salt-tolerant
Schizophylum commune, a euryhaline species (Castillo and Demoulin, 1997).
Pycnoporus sanguineus were able to survive in areas of increased salinities due to
the large growth forms of the fruiting body, allowing it to maximize exposure to
periods of high rainfall that may likely limit salt accumulation (Castillo and
Demoulin, 1997).
Mechanical degradation also occurred within the Galua forest. Coleopteran
larvae and the termite communities found within LWD from Galua had very similar
distributions to each other. It is likely that both coleopteran larvae and termites were
not able to tolerate sustained periods of immersion. Coleopteran larvae are
responsible for canopy-gap formations, increased litter-falls and nutrient enrichment
due to their boring within trees (Feller, 2002). Evidence of the mangrove longhorn
beetle, Aeolesthes holosericeus was found in many standing and fallen Excoecaria
agallocha trees in the Sombano forest. The larvae of this beetle create large
characteristic circular blisters – these blisters have also been reported on E.
agallocha trees from mangrove forests in Singapore (Ng and Sivasothi, 1999). False
blister beetle larvae from the family Oedemeridae were very common in LWD from
Langira, Galua and Laulua in the high- to mid- intertidal regions of the forests. These
larvae are commonly found world-wide in marine drift wood and pilings (Arnett,
1951). Furthermore, oedermerids are able to resist tidal immersion (Arnett, 1951),
which explains their wide distribution in the intertidal regions of the forests.

104
Termites were also found in LWD and in arboreal nests in the Sombano,
Galua and Laulua forests. Arboreal termites live in well-defined nests that are
separated from their foraging grounds (Korb, 2008). Tree-dwelling termites are
considered to be long distance foragers (Roisin et al., 2006), as they are able to travel
in relative safety because their runways are covered (Merritt and Starr, 2010).
Furthermore, when on the forest floor foraging for food during low tide, the arboreal
termite genera in the Galua and Laulua forests, Prorhinotermes, Coptotermes and
Nasutitermes are able to escape the incoming tide by retreating back up the trees to
their nests. However, wood-dwelling termites live within the galleries they create in
LWD from their feeding activities (Adams et al., 2007). Wood-dwelling termites,
Cryptotermes were found frequently within decaying wood in the landward zones of
the Galua and Laulua forests. Cryptotermes colonies remain within a single item of
decaying wood, which serves as both food and shelter (Korb and Lenz, 2004).
Termites within decaying wood, such as the drywood genus Cryptotermes, have
worker termites that are totipotent (Korb, 2008). Remaining within LWD will have
benefits if members of the termite colony are able explore all caste options (Korb,
2008) such as; predator and risk avoidance due to no external foraging. Cryptotermes
are also able to detect substrate-borne vibrations and these termites are able to
determine the size of their detrital food item (Adams et al., 2007; Evans et al., 2007).
Thus, vibration detection may help these termites to avoid potential immersion by
escaping areas within their galleries that may be submerged before the incoming tide
reaches them as the termite galleries in many LWD items extended from below to
above the high tide mark. The well-developed nests also provide environmental
buffering from outside unsuitable temperatures (Korb, 2008).
Other wood-degrading organisms were found in LWD in the low- to mid-

105
intertidal areas of the mangrove forests, and those organisms - such as limnoriid
isopods and teredinids, are predominantly aquatic. However, these crustaceans are
not usually found in forests with freshwater input such as those forests in this study,
and are more common within Caribbean mangrove forests (Cragg, 2007). Analysis of
LWD from the Loho forest revealed a new limnoriid species, Limnoria sellifera
(Cookson et al., 2012). Further research of wood-dependent animals in the mangrove
forests of the Tukang Besi may produce other new species.
Life history strategies between teredinid species vary between those with
non-brooded and brooded larvae. Species belonging to the genera Lyrodus and
Teredo retain their larvae to the late veliger stage. After spawning, larvae from
larviparous species can be widely distributed, even though they have a short free-
swimming period (Turner, 1966). Short and long term brooded species have a
successful recruitment rate and are more likely to become world-wide in distribution
within their limits of temperature and salinity (Brearley et al., 2003). Other studies
also demonstrated that Lyrodus and Teredo have a greater abundance in LWD than
non-brooded species (MacIntosh et al., 2012). The Lyrodus and Teredo larvae are
protected during their early critical stages within the parent. Studies from Aqaba
demonstrated that T. bartschi retain their larvae in the gills. Larval release at the non-
feeding pediveliger limits larval dispersal (Cragg et al., 2009). The advanced
development of T. bartschi larvae means that they are able to settle and colonise
wood more rapidly compared to less developed larvae. Thus, brooded young have
advanced development when released, and are therefore less sensitive to
environmental variables (Turner, 1966). In contrast, Spathoteredo obtusa produce
non-brooded planktotrophic larvae. When compared to settlement rates with brooded
species, S. obtusa were less successful, as very few S. obtusa pallets were found.
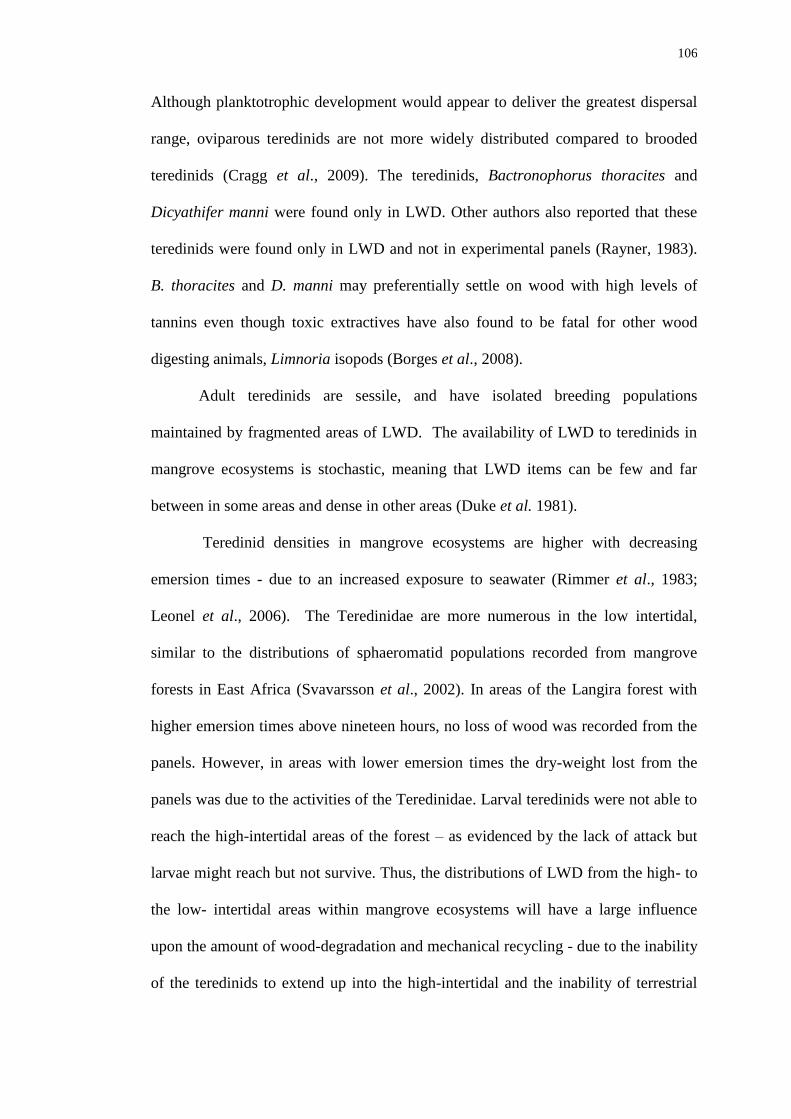
106
Although planktotrophic development would appear to deliver the greatest dispersal
range, oviparous teredinids are not more widely distributed compared to brooded
teredinids (Cragg et al., 2009). The teredinids, Bactronophorus thoracites and
Dicyathifer manni were found only in LWD. Other authors also reported that these
teredinids were found only in LWD and not in experimental panels (Rayner, 1983).
B. thoracites and D. manni may preferentially settle on wood with high levels of
tannins even though toxic extractives have also found to be fatal for other wood
digesting animals, Limnoria isopods (Borges et al., 2008).
Adult teredinids are sessile, and have isolated breeding populations
maintained by fragmented areas of LWD. The availability of LWD to teredinids in
mangrove ecosystems is stochastic, meaning that LWD items can be few and far
between in some areas and dense in other areas (Duke et al. 1981).
Teredinid densities in mangrove ecosystems are higher with decreasing
emersion times - due to an increased exposure to seawater (Rimmer et al., 1983;
Leonel et al., 2006). The Teredinidae are more numerous in the low intertidal,
similar to the distributions of sphaeromatid populations recorded from mangrove
forests in East Africa (Svavarsson et al., 2002). In areas of the Langira forest with
higher emersion times above nineteen hours, no loss of wood was recorded from the
panels. However, in areas with lower emersion times the dry-weight lost from the
panels was due to the activities of the Teredinidae. Larval teredinids were not able to
reach the high-intertidal areas of the forest – as evidenced by the lack of attack but
larvae might reach but not survive. Thus, the distributions of LWD from the high- to
the low- intertidal areas within mangrove ecosystems will have a large influence
upon the amount of wood-degradation and mechanical recycling - due to the inability
of the teredinids to extend up into the high-intertidal and the inability of terrestrial
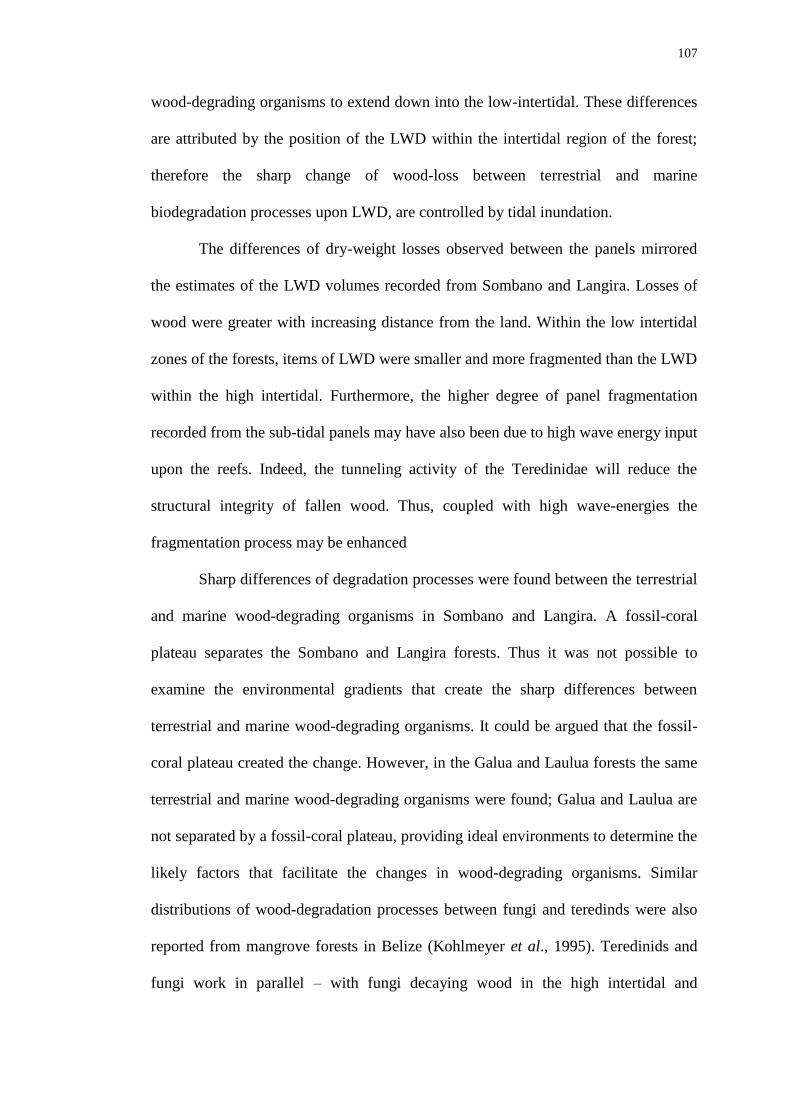
107
wood-degrading organisms to extend down into the low-intertidal. These differences
are attributed by the position of the LWD within the intertidal region of the forest;
therefore the sharp change of wood-loss between terrestrial and marine
biodegradation processes upon LWD, are controlled by tidal inundation.
The differences of dry-weight losses observed between the panels mirrored
the estimates of the LWD volumes recorded from Sombano and Langira. Losses of
wood were greater with increasing distance from the land. Within the low intertidal
zones of the forests, items of LWD were smaller and more fragmented than the LWD
within the high intertidal. Furthermore, the higher degree of panel fragmentation
recorded from the sub-tidal panels may have also been due to high wave energy input
upon the reefs. Indeed, the tunneling activity of the Teredinidae will reduce the
structural integrity of fallen wood. Thus, coupled with high wave-energies the
fragmentation process may be enhanced
Sharp differences of degradation processes were found between the terrestrial
and marine wood-degrading organisms in Sombano and Langira. A fossil-coral
plateau separates the Sombano and Langira forests. Thus it was not possible to
examine the environmental gradients that create the sharp differences between
terrestrial and marine wood-degrading organisms. It could be argued that the fossil-
coral plateau created the change. However, in the Galua and Laulua forests the same
terrestrial and marine wood-degrading organisms were found; Galua and Laulua are
not separated by a fossil-coral plateau, providing ideal environments to determine the
likely factors that facilitate the changes in wood-degrading organisms. Similar
distributions of wood-degradation processes between fungi and teredinds were also
reported from mangrove forests in Belize (Kohlmeyer et al., 1995). Teredinids and
fungi work in parallel – with fungi decaying wood in the high intertidal and
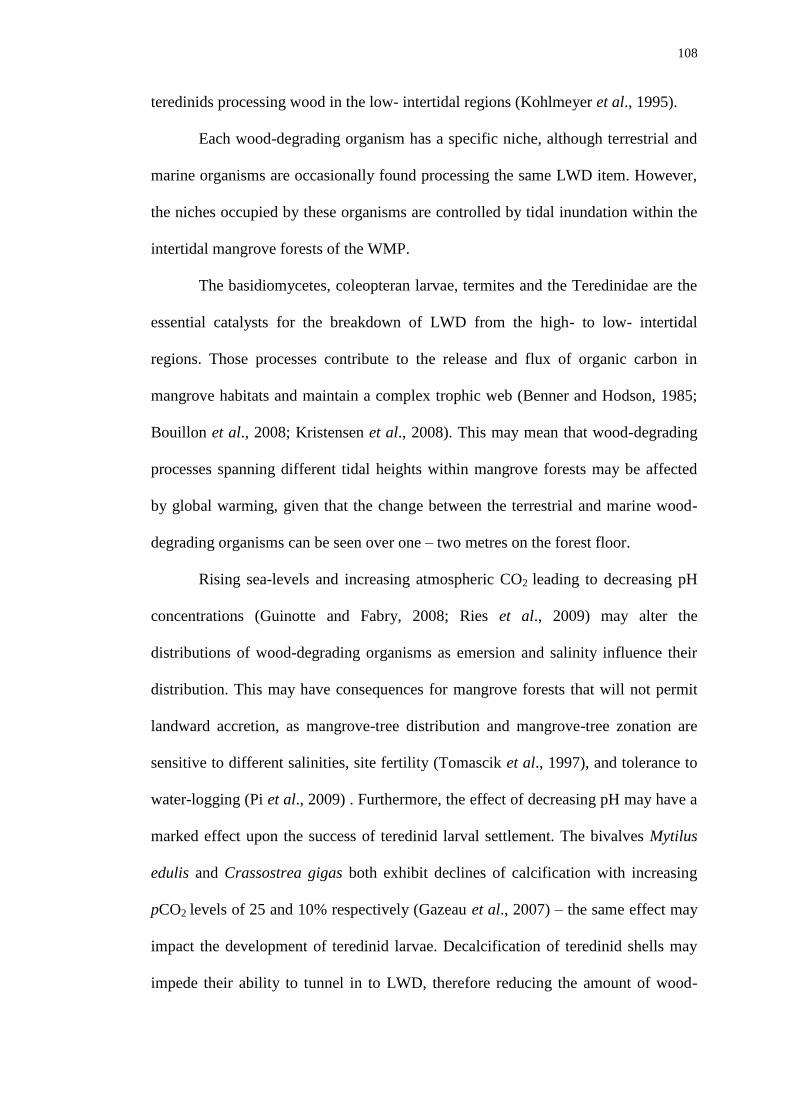
108
teredinids processing wood in the low- intertidal regions (Kohlmeyer et al., 1995).
Each wood-degrading organism has a specific niche, although terrestrial and
marine organisms are occasionally found processing the same LWD item. However,
the niches occupied by these organisms are controlled by tidal inundation within the
intertidal mangrove forests of the WMP.
The basidiomycetes, coleopteran larvae, termites and the Teredinidae are the
essential catalysts for the breakdown of LWD from the high- to low- intertidal
regions. Those processes contribute to the release and flux of organic carbon in
mangrove habitats and maintain a complex trophic web (Benner and Hodson, 1985;
Bouillon et al., 2008; Kristensen et al., 2008). This may mean that wood-degrading
processes spanning different tidal heights within mangrove forests may be affected
by global warming, given that the change between the terrestrial and marine wood-
degrading organisms can be seen over one – two metres on the forest floor.
Rising sea-levels and increasing atmospheric CO2 leading to decreasing pH
concentrations (Guinotte and Fabry, 2008; Ries et al., 2009) may alter the
distributions of wood-degrading organisms as emersion and salinity influence their
distribution. This may have consequences for mangrove forests that will not permit
landward accretion, as mangrove-tree distribution and mangrove-tree zonation are
sensitive to different salinities, site fertility (Tomascik et al., 1997), and tolerance to
water-logging (Pi et al., 2009) . Furthermore, the effect of decreasing pH may have a
marked effect upon the success of teredinid larval settlement. The bivalves Mytilus
edulis and Crassostrea gigas both exhibit declines of calcification with increasing
pCO2 levels of 25 and 10% respectively (Gazeau et al., 2007) – the same effect may
impact the development of teredinid larvae. Decalcification of teredinid shells may
impede their ability to tunnel in to LWD, therefore reducing the amount of wood-
109
degradation in the mid- to low- intertidal regions of mangrove forests.
The terrestrial processes – basidiomycetes, termites, and coleopteran larvae
are the major catalysts to the very slow turnover of LWD in the high intertidal zone.
The biodegradation of LWD attributed by these organisms is much slower when
compared with the marine wood-degraders, teredinids.
Teredinids have a remarkable ability to breakdown woody detritus, therefore
influencing the flux of carbon within intertidal mangrove forests. If teredinids were
not found in the mid- to low- intertidal areas of mangrove forests there would be a
massive build-up of detritus, leading to a reduced flow of nutrients to adjacent
coastal ecosystems. The predominant breakdown of LWD attributed by the
Teredinidae has revealed their crucial ecological niche.
110
Chapter 4
THE EFFECT OF TEREDINID TUNNELLING ON MANGROVE
PROP-ROOTS
4.1 Introduction
Herbivorous animals from terrestrial to aquatic environments consume a
range of photosynthetic organisms from algae to trees. In terrestrial tropical forests,
insects such as caterpillars and beetles consume much of the foliage and trunks of the
trees (Novotny et al., 2007). Some trees are protected from herbivorous attack as
they have an active anti-herbivore defence provided by ants that predate the attacking
herbivores (Gaume and McKey, 1997), and other trees have chemical and structural
anti-herbivore defence mechanisms (Turner, 1976; Brooks and Bell, 2002). Within
forested intertidal habitats, mangrove trees are attacked by both terrestrial and marine
animals (Feller, 2002; Ellison and Farnsworth, 1996). The mangrove herbivores
range from insects such as beetles (Perry, 1988; Feller and Mathis, 1997) to wood-
boring aquatic molluscs, teredinids (Robertson and Daniel, 1989a). Mangroves also
have non-herbivorous aquatic wood-boring isopods such as sphaeromatids (Si et al.,
2002).
Damage to prop-roots may either be caused by herbivorous and non-
herbivorous attack or physical actions such as abrasion (Gill and Tomlinson, 1977),
or by falling branches from the canopy. Increased tidal inundation may also enhance
the breakdown of damaged mangrove root tissues – as densities of wood borers
become more numerous with increasing immersion times (Svavarsson et al., 2002).
111
Isopods process less wood, when compared with teredinids. Sphaeromatids
bore large conspicuous holes in live prop-roots (Simberloff et al., 1978). Teredinids
on the other hand, predominantly process dead wood and create many tunnels within
the logs through their boring activity (Filho et al., 2008).
Studies of wood-boring animals upon mangrove root tissues are primarily
focussed upon sphaeromatid isopods (Perry, 1988). The destructive effect of the
sphaeromatid, S. peruvianum on live mangrove root-tissues in Costa Rica can reduce
the growth rates of Rhizophora aerial prop-roots by fifty percent (Perry, 1988). The
decrease in root growth rate is caused by sphaeromatids damaging root tips – where
somatic growth of the root occurs (Gill and Tomlinson, 1971). It is thought that
sphaeromatids are unable to burrow in to older developed roots that reach the
substratum due to the development of woody tissue in older roots (Rehm, 1976;
Perry, 1988).
Roots burrowed by the isopods at their tips may branch, (Rehm, 1976; Ribi,
1982) though it is not clear whether this harms the trees. On the one hand, the effect
of the attack of sphaeromatids upon mangrove root tissues may benefit or harm the
trees (Simberloff et al., 1978). The death of roots may lead to tree collapse (Rehm,
1976; Svavarsson et al., 2002). Rehm and Humm (1973) go further and say that the
mangrove forests are shrinking because of the destruction of the prop roots by S.
terebrans in south-western Florida. However, other authors found that sphaeromatids
may benefit mangrove forests (Simberloff et al., 1978). Isopods may enhance tree
survival by triggering an increase branching of lateral aerial roots, therefore securing
the tree from falling due to an increase of root structures (Simberloff et al., 1978;
Ribi, 1982).
112
To combat increasing attack from herbivores plants release tannins (Bloch,
1952). Plants are successfully able to survive in environments where herbivores are
common due to their ability to resist or recover from repeated herbivory (Brooks and
Bell, 2002; Hanley et al., 2007). Direct defence mechanisms may reduce herbivory
or prevent herbivory on root tissue from further exacerbating root damage caused by
feeding upon the plant tissues. Post-attack, mangroves may produce chemical
defences such as secondary metabolites such as tannins (Alongi, 1987; Feller, 2002).
It is beneficial for the plant to produce these chemical compounds only when they
are required as herbivore attack is random and variable (Hol et al., 2004). As, the
energy required to produce these chemical defence exudates can be costly (Agrawal
et al., 1999; Karban et al., 1997). Indeed, particular mangrove trees may express
resistance only when it is needed to reduce energetic cost into producing the tannins.
Energy expenditure may eventually lead to a decrease in fitness - in this case,
root death. The loss of fitness may be due to increased energy investments and use
of resources (Agrawal, 1999). Conversely, herbivory may be beneficial (Paige and
Whitham, 1987; Paige, 1992). Herbivory on plants elicits a physiological response
which can create an overcompensation of tissue regrowth (Lennartsson et al., 1998).
Increased plant growth may ultimately achieve greater fitness (Paige and Whitham,
1987).
Though damage by wood-boring isopods upon mangrove roots is widely
reported, there are few reports of teredinids damaging Rhizophora prop-roots
(Roonwal, 1954, see Figure 4.1). Larval teredinds are unable to infest living trees, as
the bark contains high tannin content (Rimmer et al., 1983; Kohlmeyer et al., 1995).
However, the teredinid Bactronophorus thoracites (Gould) is able to penetrate living
woody tissues (Roonwal, 1954), as this species may settle preferentially on wood
113
with a lot of tannins. Other teredinid species are not so successful, larval Lyrodus
pedicellatus died when trying to settle upon Dalbergia retusa, Panamanian rosewood
(Turner, 1976). The dominant heartwood extractive of Dalbergia is obtusaquinone, a
quinone. Quinones are produced by many tropical trees, and they prevent the
production of well-formed shells and pallets of teredinids and therefore hinder
settlement of Lyrodus larvae (Turner, 1976). Toxic extractives have also been found
to be fatal for the wood boring isopod Limnoria (Borges et al., 2008), and chemicals
such as terpenoids, triterpenes and flavonoids - present in the root bark of Bruguiera
gymnorhiza trees (Han et al., 2004) are toxic to other invertebrates (Spurr and
McGregor, 2003).
Tannins are defence mechanisms. Terrestrial plants also express resistance to
herbivory via strategies labelled as tolerance mechanisms (Paige, 1999; Brooks and
Bell, 2002). Tolerance mechanisms are defined as tissue repair and regrowth.
Mangrove plants may likely use the tolerance strategy against damage (Brooks and
Bell, 2002). Tolerance to herbivory or the ability to recover and regrow tissues after
damage is an additional plant strategy, which may have evolved in response to
herbivore attack (Strauss and Agrawal, 1999).
Teredinids contribute to the breakdown of large woody detritus in the mid- to
low-intertidal regions of the mangrove forests (Robertson, 1990). Much of the dead
wood consumed by teredinids is replaced by the many tunnels they create through
their boring of the wood (Robertson, 1990; Distel, 2003; Filho et al., 2008).The
Teredinidae are particularly important in mangrove forests where there are high
levels of detrital woody biomass consisting of fallen trunks, branches and prop-roots
as they mechanically break down the woody biomass (Robertson, 1990; Kohlmeyer
et al., 1995). Although, teredinid attack may occur only after the bark has

114
deteriorated (Kohlmeyer et al., 1995) and the toxic extractives have leached away
(Borges et al., 2008). The colonised decaying wood may take anywhere from two to
fifteen years to completely break down (Robertson and Daniel, 1989a; Kohlmeyer et
al., 1995). Eventually, the broken-down woody fragments, teredinid faeces and
teredinid biomass may be consumed by marine organisms in adjacent ecosystems
(Robertson and Daniel, 1989a; Granek et al., 2009). This means that wood-borers
may benefit mangrove ecosystems by breaking down dead plant material, even
though they do cause damage to living tissues (Barkati and Tirmizi, 1991).
Figure. 4.1, Rhizophora stylosa prop-roots. a, undamaged healthy prop-roots – a typical
view of roots demonstrating no obvious evidence of damage to their epiblema (outer layer),
and b, a compromised root showing extensive damage resulting in root death, not
commonly found. The arrow indicates the opening of an old teredinid tunnel.
115
As long as their epiblema remains intact, mangrove roots are very effective at
keeping wood-borers such as teredinids at bay (Kohlmeyer et al., 1995). However,
soon after the outer layer is damaged and the inner root-tissues are exposed, larval
teredinids can settle on the wood, and begin to process the tissues (Kohlmeyer et al.,
1995).
This study aims to determine the colonisation of teredinids and the
regenerative capabilities of mangrove prop-root tissues under different levels of
damage. This work tested the prediction that Rhizophora roots with a low level of
damage will not be attacked by teredinids after one year and will make a full
recovery, roots with a moderate level of damage will elicit an over-compensatory
level of tissue re-growth, and roots with a severe level of damage will die due to
teredinid attack after one year.
Rhizophora prop roots were experimentally damaged in the forests to
determine which prop-root surfaces are colonisable by teredinids. The protective
layers of the roots were removed to measure the ability of prop-roots to recover and
the extent of infestation by teredinids exposed to different levels of damage. This
investigation reveals how prop-root tissues respond to different levels of damage and
the affect of teredinids upon those damaged areas.
4.2 Materials and methods
4.2.1 Root scar experiment
The long-term effects of experimental damage to mangrove roots were
examined. The experiments took place in three inter-tidal Rhizophora stylosa-
dominated mangrove forests in the Tukang Besi archipelago, Kaluku, Loho and One
116
Onitu (see chapter 2 for site details). Three ten by ten metre plots within each forest
were designated for the experimental damage. The plots were chosen in these areas
because teredinids were found and no evidence of disturbance was recorded. The
damage consisted of one of three surgical treatments of increasing severity at the
base upon individual roots. Within each plot, each treatment was conducted on three
roots, totalling nine roots per plot, and twenty-seven roots per site. Within all the
sites, a total of eighty-one roots were used.
The first surgical treatment (superficial) consisted of removal of the
outermost layer of the bark, the epiblema (Figure 4.2 a). The second treatment
(moderate) consisted of additionally removing the starch-rich parenchyma cells
(Figure 4.2 b). The third treatment, (severe) consisted of additionally removing the
inner radial and tangential walls of the endodermis containing lignin and suberin-rich
tissues (Figure 4.2 c). All surgical treatments were cut into live Rhizophora roots
using a diver’s knife. Each root-scar measured 4 cm in diameter by 10 cm in length.
Digital images were taken of each treated root over twelve months. All root
circumferences and scar depths were measured before and during the twelve month
period using a tailors tape and callipers.
4.2.2 Root biscuit analysis
Root scars on twenty-four of the experimentally damaged roots were cut
transversely into biscuit sections after twelve months after the damage. For each of
the levels of damage, eight roots were used. For the superficially damaged roots, a
total of forty biscuits were cut, and for the moderately damaged roots, thirty-six
biscuits and for the severely damaged roots a total of thirty-five biscuits were cut.
Each biscuit from the damaged roots was inspected for evidence of necrotic cellular

117
damage and then measured to calculate the area of cellular rehabilitation or loss. If
present, all teredinid tunnels in each biscuit were counted, and percentage surface
area of tunnels within each biscuit were estimated using ImageTool Version 3.00
(The University of Texas Health Science Centre at San Antonio).
Figure. 4.2 Three treatments of root scars characterised by different levels of damage. a, the
removal of the outer epiblema layer, superficial damage, b, removal of the carbohydrate-rich cortex
tissue, moderate damage, exposing the epidermis layer, c, removal of the lignin-rich endodermis layer,
severe damage. Ep = epiblema, Co = cortex, En = endodermis, Ls = longitudinal section and Ts =
transverse section.
superficial moderate severe
Ep Co En
118
4.3 Data analysis
Biscuit analysis
Values of percentage surface area of tissue regrowth/loss and the number of
teredinid tunnels within root-biscuits were tested for differences of teredinid tunnels
in roots exposed to different surgeries using Box Plots.
Live roots
Upon the live roots, differences of the percentages of root tissue re-
growth/loss over one year were tested using a 2-way ANOVA with treatment and
time as factors. All percentage data were normalized using the arcsin transformation.
All statistical analyses were performed using MINITAB (MINITAB Inc, version
13.20).
4.4 Results
4.4.1 Root scar analysis upon live roots
Twelve months after the initial surgeries more than 95 % of roots exposed to
the superficial damage had a complete recovery of tissues and total regrowth of the
epiblema. No roots died when exposed to this level of damage. Almost 80% of roots
exposed to a moderate level of damage had a full recovery with 30% of those roots
exceeding the initial size of the root before surgery (Table 4.1). However, 14.8% of
the roots exposed to the moderate level of damage died. More than 60% of the roots
exposed to a severe level of damage made a full recovery with 25% of those roots
exceeding the initial size of the root before surgery. However, 7.4% of the roots
exposed to the severe level of damage died. The greatest percentage regrowth of
root-tissue was recorded from roots exposed to a moderate and severe level of
damage (mean ± SE).
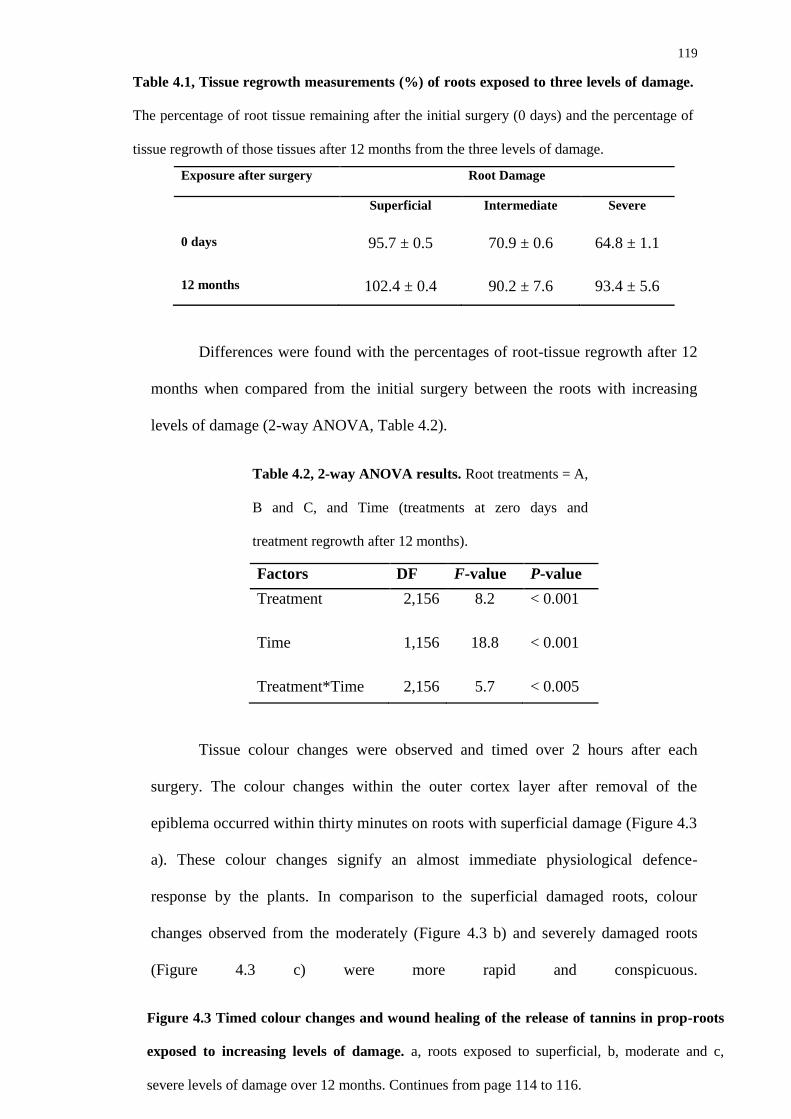
119
Exposure after surgery Root Damage
Superficial Intermediate Severe
0 days 95.7 ± 0.5 70.9 ± 0.6 64.8 ± 1.1
12 months 102.4 ± 0.4 90.2 ± 7.6 93.4 ± 5.6
Differences were found with the percentages of root-tissue regrowth after 12
months when compared from the initial surgery between the roots with increasing
levels of damage (2-way ANOVA, Table 4.2).
Factors DF F-value P-value
Treatment 2,156 8.2 < 0.001
Time 1,156 18.8 < 0.001
Treatment*Time 2,156 5.7 < 0.005
Tissue colour changes were observed and timed over 2 hours after each
surgery. The colour changes within the outer cortex layer after removal of the
epiblema occurred within thirty minutes on roots with superficial damage (Figure 4.3
a). These colour changes signify an almost immediate physiological defence-
response by the plants. In comparison to the superficial damaged roots, colour
changes observed from the moderately (Figure 4.3 b) and severely damaged roots
(Figure 4.3 c) were more rapid and conspicuous.
Table 4.1, Tissue regrowth measurements (%) of roots exposed to three levels of damage.
The percentage of root tissue remaining after the initial surgery (0 days) and the percentage of
tissue regrowth of those tissues after 12 months from the three levels of damage.
Figure 4.3 Timed colour changes and wound healing of the release of tannins in prop-roots
exposed to increasing levels of damage. a, roots exposed to superficial, b, moderate and c,
severe levels of damage over 12 months. Continues from page 114 to 116.
Table 4.2, 2-way ANOVA results. Root treatments = A,
B and C, and Time (treatments at zero days and
treatment regrowth after 12 months).

120
0 days 15 min 45 min 5 days
10 days 20 days 35 days 12 months
a
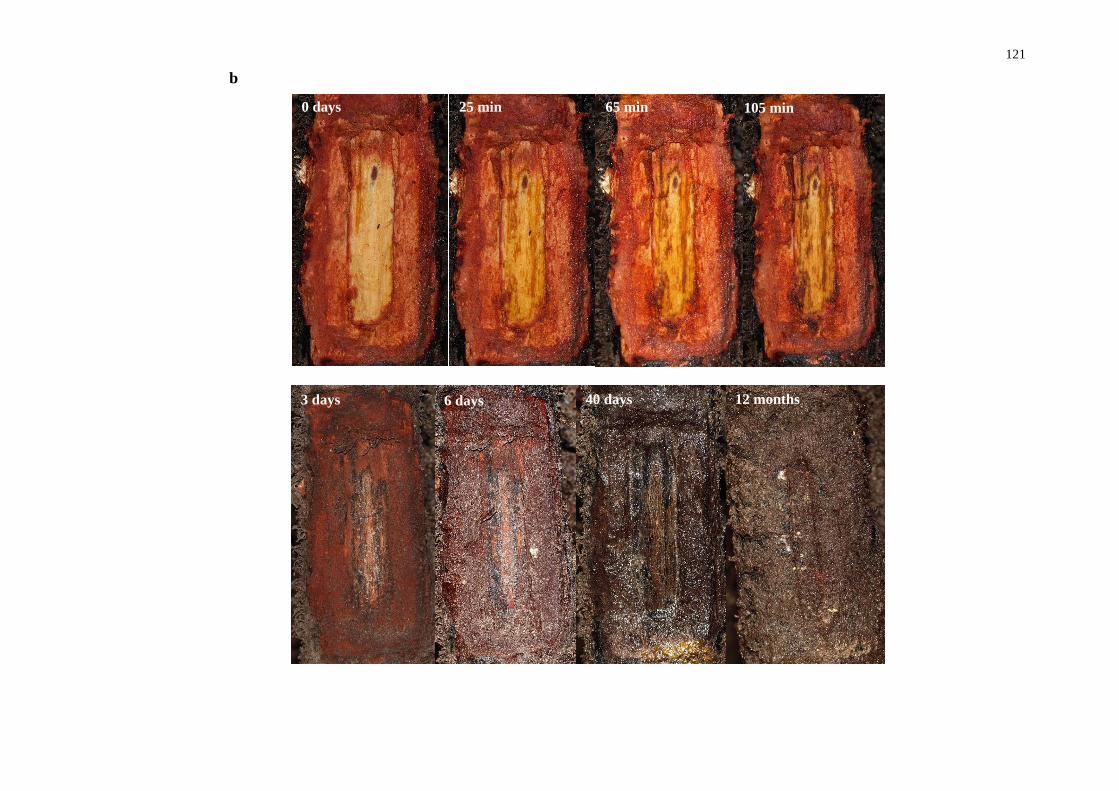
121
0 days 65 min 25 min
3 days 6 days 40 days 12 months
105 min
b
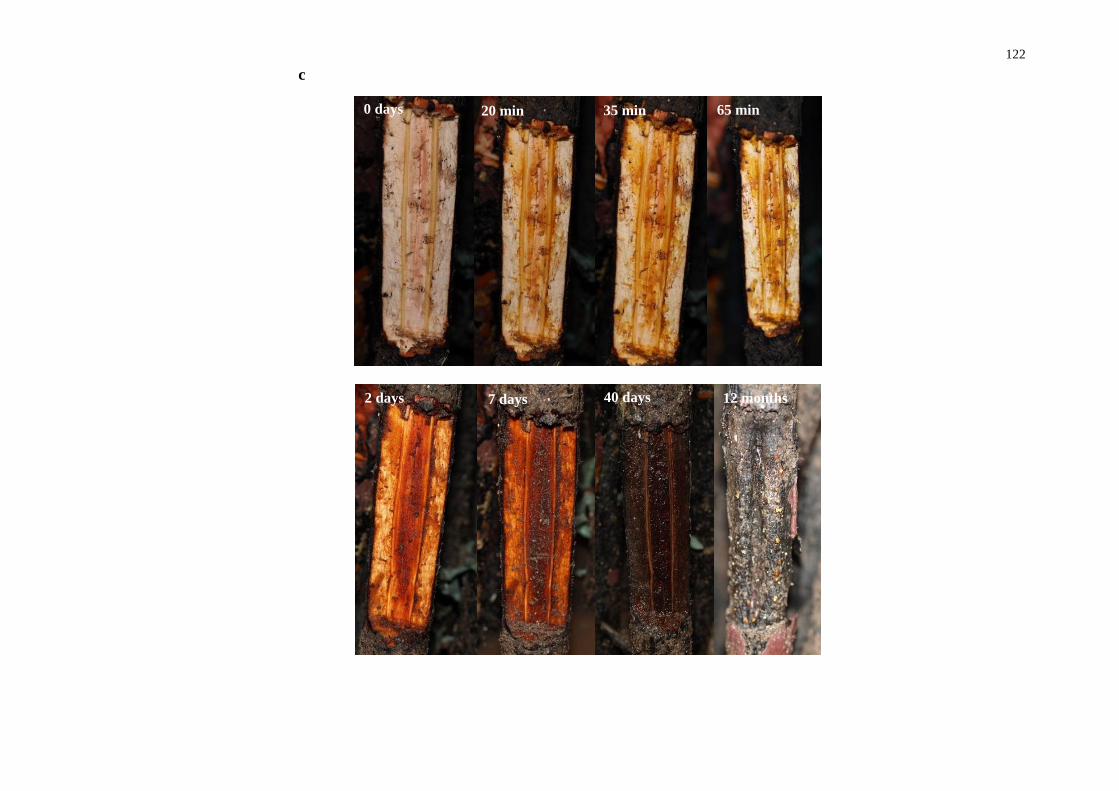
122
0 days 20 min 35 min 65 min
2 days 7 days 40 days 12 months
c
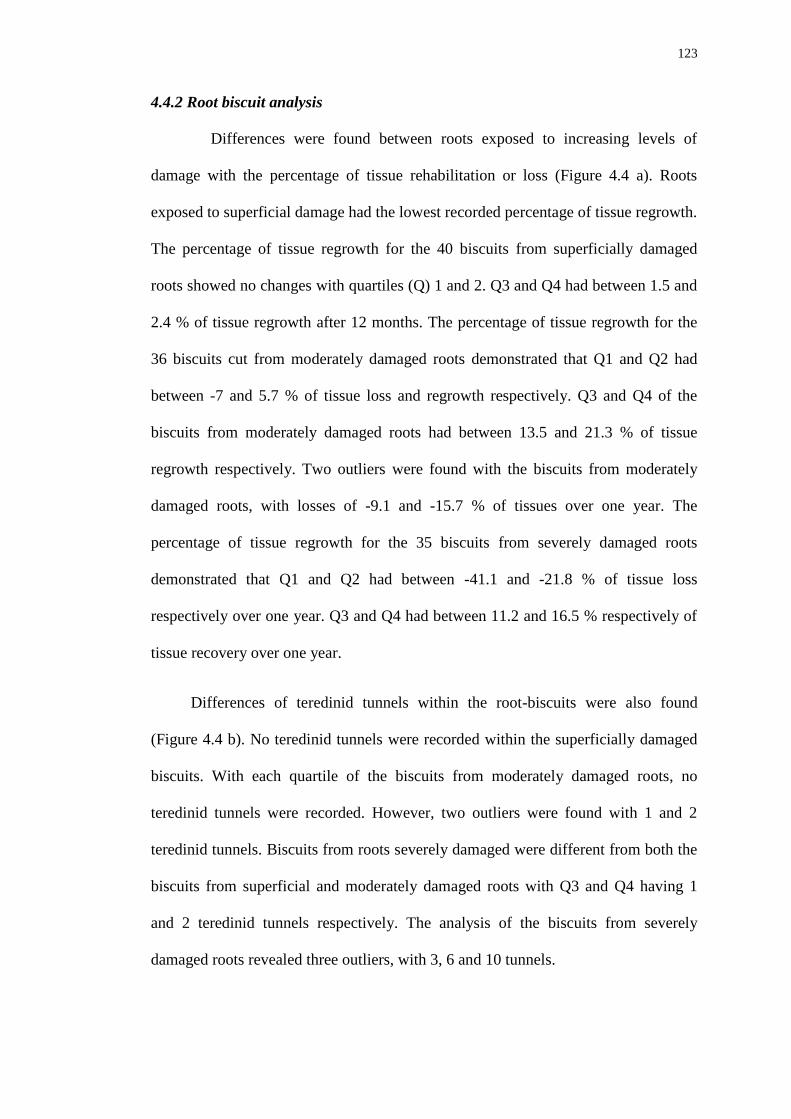
123
4.4.2 Root biscuit analysis
Differences were found between roots exposed to increasing levels of
damage with the percentage of tissue rehabilitation or loss (Figure 4.4 a). Roots
exposed to superficial damage had the lowest recorded percentage of tissue regrowth.
The percentage of tissue regrowth for the 40 biscuits from superficially damaged
roots showed no changes with quartiles (Q) 1 and 2. Q3 and Q4 had between 1.5 and
2.4 % of tissue regrowth after 12 months. The percentage of tissue regrowth for the
36 biscuits cut from moderately damaged roots demonstrated that Q1 and Q2 had
between -7 and 5.7 % of tissue loss and regrowth respectively. Q3 and Q4 of the
biscuits from moderately damaged roots had between 13.5 and 21.3 % of tissue
regrowth respectively. Two outliers were found with the biscuits from moderately
damaged roots, with losses of -9.1 and -15.7 % of tissues over one year. The
percentage of tissue regrowth for the 35 biscuits from severely damaged roots
demonstrated that Q1 and Q2 had between -41.1 and -21.8 % of tissue loss
respectively over one year. Q3 and Q4 had between 11.2 and 16.5 % respectively of
tissue recovery over one year.
Differences of teredinid tunnels within the root-biscuits were also found
(Figure 4.4 b). No teredinid tunnels were recorded within the superficially damaged
biscuits. With each quartile of the biscuits from moderately damaged roots, no
teredinid tunnels were recorded. However, two outliers were found with 1 and 2
teredinid tunnels. Biscuits from roots severely damaged were different from both the
biscuits from superficial and moderately damaged roots with Q3 and Q4 having 1
and 2 teredinid tunnels respectively. The analysis of the biscuits from severely
damaged roots revealed three outliers, with 3, 6 and 10 tunnels.
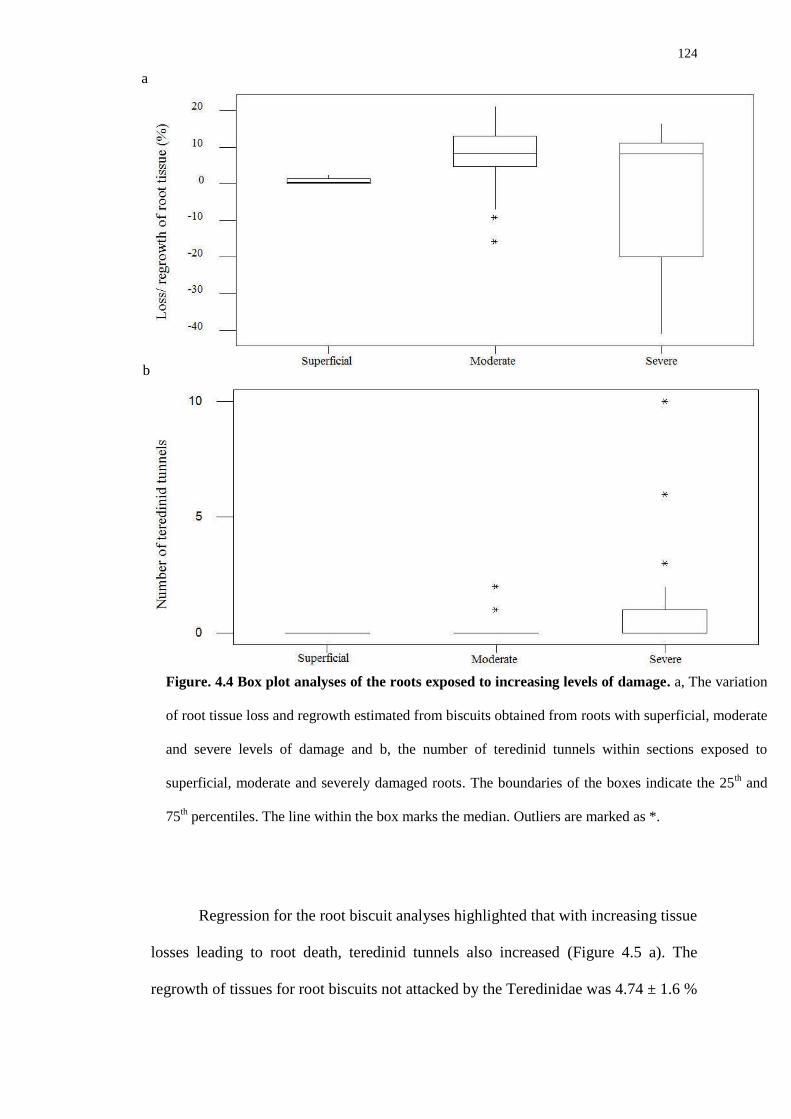
124
Regression for the root biscuit analyses highlighted that with increasing tissue
losses leading to root death, teredinid tunnels also increased (Figure 4.5 a). The
regrowth of tissues for root biscuits not attacked by the Teredinidae was 4.74 ± 1.6 %
Figure. 4.4 Box plot analyses of the roots exposed to increasing levels of damage. a, The variation
of root tissue loss and regrowth estimated from biscuits obtained from roots with superficial, moderate
and severe levels of damage and b, the number of teredinid tunnels within sections exposed to
superficial, moderate and severely damaged roots. The boundaries of the boxes indicate the 25th and
75th percentiles. The line within the box marks the median. Outliers are marked as *.
b
a

125
(mean ± SE) of new tissue after twelve months. The loss of tissues for root biscuits
attacked by the Teredinidae was 10.23 ± 8.6 % (mean ± SE) of root tissue loss over
twelve months. The greatest numbers of teredinid tunnels observed in individual root
biscuits were six and ten tunnels, associated with – 41.15 % and – 27.11 % losses of
tissue over twelve months respectively.
Regression analyses for root-tissue regrowth after 12 months vs. number of
teredinid tunnels for each scar treatment demonstrated that there were no correlations
with the root-biscuit analyses of the superficial and moderately damaged roots.
However, a strong negative correlation was found with decreasing root-tissues and
increasing teredinid tunnels with severely damaged roots (Figure 4.5 b).
4.4.3 Atypical growth of lignified tissues
A lateral out-growth of lignin-like tissue growing from the cylindrical
endodermal layer was found after analysis of the moderate and severely damaged
root-biscuits (Figure 4.6). Three-quarters and one quarter of all moderately and
severely damaged biscuits respectively, had the atypical growth of the cylindrical
lignin-rich endodermal layer.
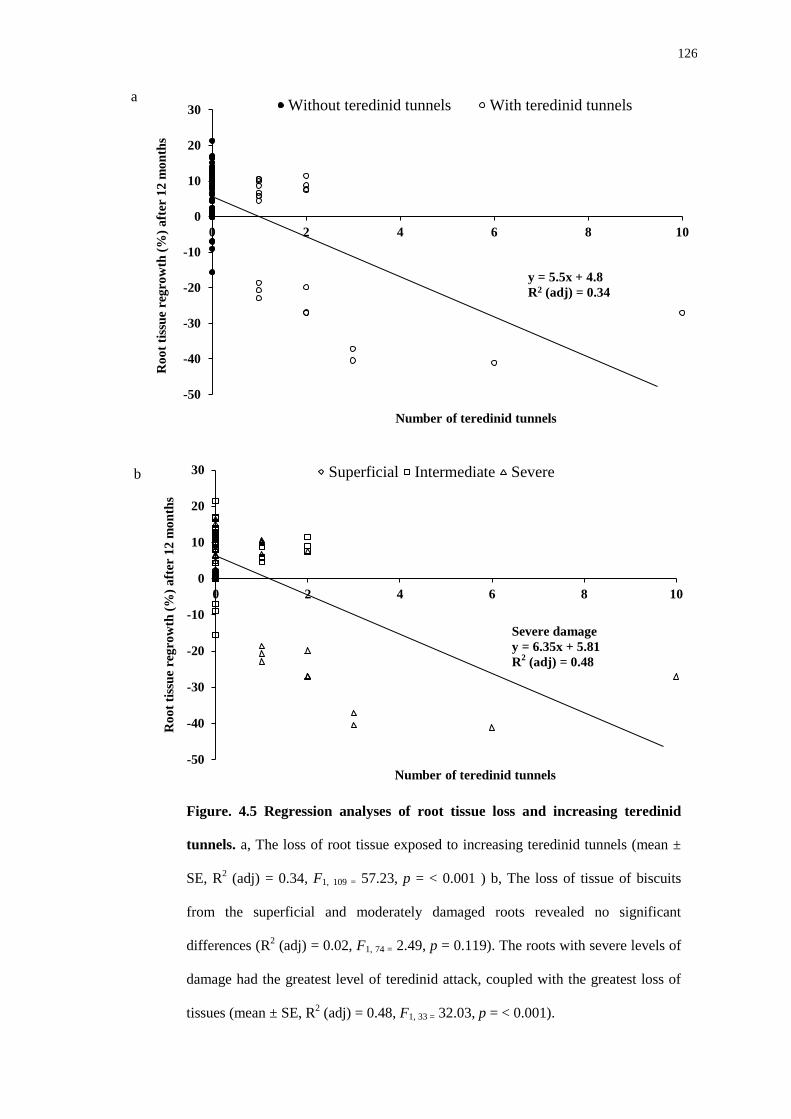
126
-50
-40
-30
-20
-10
0
10
20
30
0 2 4 6 8 10
Ro
ot
tiss
ue
reg
row
th (
%)
aft
er 1
2 m
on
ths
Number of teredinid tunnels
Without teredinid tunnels With teredinid tunnels
y = 5.5x + 4.8
R2 (adj) = 0.34
-50
-40
-30
-20
-10
0
10
20
30
0 2 4 6 8 10
Ro
ot
tiss
ue
reg
row
th (
%)
aft
er 1
2 m
on
ths
Number of teredinid tunnels
Superficial Intermediate Severe
Figure. 4.5 Regression analyses of root tissue loss and increasing teredinid
tunnels. a, The loss of root tissue exposed to increasing teredinid tunnels (mean ±
SE, R2 (adj) = 0.34, F1, 109 = 57.23, p = < 0.001 ) b, The loss of tissue of biscuits
from the superficial and moderately damaged roots revealed no significant
differences (R2 (adj) = 0.02, F1, 74 = 2.49, p = 0.119). The roots with severe levels of
damage had the greatest level of teredinid attack, coupled with the greatest loss of
tissues (mean ± SE, R2 (adj) = 0.48, F1, 33 = 32.03, p = < 0.001).
a
b
Severe damage
y = 6.35x + 5.81 R
2 (adj) = 0.48

127
4.5 Discussion
The roots with a moderate level of damage, removal of the parenchyma
tissues demonstrated an example of the tolerance mechanism – an over compensation
of tissue regrowth (Brooks and Bell, 2002). Parenchyma cells have the ability to
change; suggesting that post tissue damage will alter the cell physiology and regulate
cell growth (Bloch, 1952). Parenchyma cell differentiation has the ability to change
from parenchyma to cork and sclerenchyma cells (Wier et al., 1996). This study
revealed similar results to those reported by Brooks and Bell (2002), demonstrating
that the tolerance mechanism of the increases of tissue regrowth seen from the
removal of the parenchyma tissues was remarkable recovery. Indeed, this increase of
parenchyma tissue regrowth may be considered as an over-compensatory reaction of
the damaged areas (Paige, 1992; Brooks and Bell, 2002).
a b
Figure. 4.6 Atypical growth of new lignin-rich tissues. a, A biscuit section cut
from a prop-root exposed to a moderate level of damage. The white arrows
highlight the lateral lignin-like out-growths observed from the lignin-rich
cylindrical endodermal layer and b, A biscuit section cut from a prop-root
exposed to superficial damage (for comparison).

128
Less energy investment is required by the plant needed for repair when
exposed to superficial damage, when compared to the energy required by the plant to
compensate for a moderate or severe level of damage, which may be exacerbated by
teredinid tunnelling. Not all roots were tolerant to exposure of tissue removal.
Between fifteen and thirty percent of roots exposed to moderate and severe damage
respectively demonstrated tissue degeneration and death after twelve months. This
may be due to the variation and frequency of teredinid attack coupled with the
severity of damage imposed upon each root.
Almost forty percent of all biscuits from roots with severe damage had a loss
of nearly thirty percent of tissues. The variations of tissue regrowth between
increasing severities of root damage may be due to the degree of tolerance the
damaged mangrove roots were exposed to. The degree of tolerance can be expressed
as compensation to the plants ability to tolerate herbivore attack (Strauss and
Agrawal, 1999). There are many extrinsic and intrinsic factors the plant needs to
compensate for, such as frequency of attack from herbivores, chemical defence
investment, nutrient availability and competition (Brooks and Bell, 2002). Thus,
energy investment for wound healing, leading to a full recovery may vary spatially
between the sites and within site, which may explain the variability of tissue
regrowth between the damaged roots as the frequency of herbivorous attack from
teredinids was found only in the moderate and severly damaged roots – but the
greatest frequency of teredinid attack was found in the severly damaged roots.
Roots exposed to a moderate and severe level of damage demonstrated a
dedifferentiation of cellular regrowth, attributed by a new lignified outgrowth from
the endodermis layer. When tissue patterns arise which differ conspicuously from the
norm, or when a lack of pattern is encountered the cellular regrowth can be classified
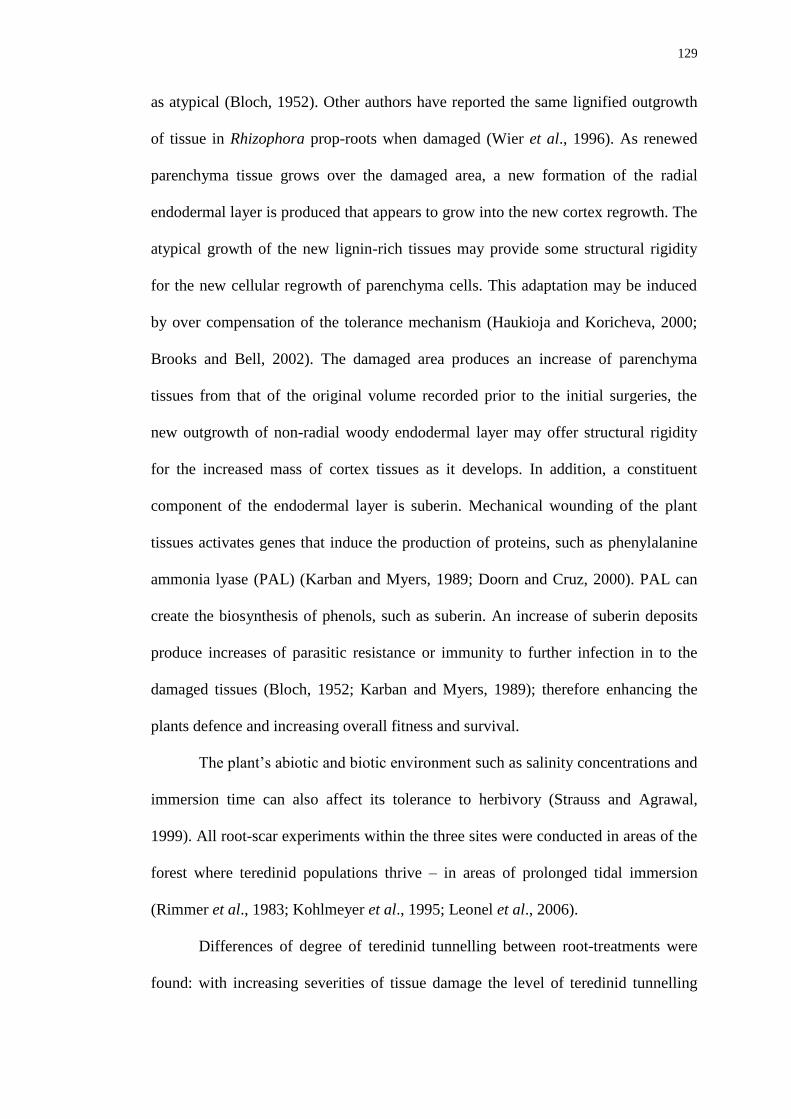
129
as atypical (Bloch, 1952). Other authors have reported the same lignified outgrowth
of tissue in Rhizophora prop-roots when damaged (Wier et al., 1996). As renewed
parenchyma tissue grows over the damaged area, a new formation of the radial
endodermal layer is produced that appears to grow into the new cortex regrowth. The
atypical growth of the new lignin-rich tissues may provide some structural rigidity
for the new cellular regrowth of parenchyma cells. This adaptation may be induced
by over compensation of the tolerance mechanism (Haukioja and Koricheva, 2000;
Brooks and Bell, 2002). The damaged area produces an increase of parenchyma
tissues from that of the original volume recorded prior to the initial surgeries, the
new outgrowth of non-radial woody endodermal layer may offer structural rigidity
for the increased mass of cortex tissues as it develops. In addition, a constituent
component of the endodermal layer is suberin. Mechanical wounding of the plant
tissues activates genes that induce the production of proteins, such as phenylalanine
ammonia lyase (PAL) (Karban and Myers, 1989; Doorn and Cruz, 2000). PAL can
create the biosynthesis of phenols, such as suberin. An increase of suberin deposits
produce increases of parasitic resistance or immunity to further infection in to the
damaged tissues (Bloch, 1952; Karban and Myers, 1989); therefore enhancing the
plants defence and increasing overall fitness and survival.
The plant’s abiotic and biotic environment such as salinity concentrations and
immersion time can also affect its tolerance to herbivory (Strauss and Agrawal,
1999). All root-scar experiments within the three sites were conducted in areas of the
forest where teredinid populations thrive – in areas of prolonged tidal immersion
(Rimmer et al., 1983; Kohlmeyer et al., 1995; Leonel et al., 2006).
Differences of degree of teredinid tunnelling between root-treatments were
found: with increasing severities of tissue damage the level of teredinid tunnelling

130
increases. No teredinid tunnels were found in roots with superficial damage after
twelve months. A few teredinid tunnels were found in the moderately damaged roots.
But, severely damaged roots had the greatest frequency of teredinid tunnels. The
rapid recruitment of the teredinids found in severely damaged roots may have been
facilitated by the removal of the lignin-rich endodermal layer that protects the inner
vascular cylinder. Cells contained within the vascular cylinder are tannin-free (Gill
and Tomlinson, 1971); making teredinid settlement possible (Turner, 1976), and thus
compromising root fitness.
The morphological and physiological resilience of these unusual trees
enhance their survival in mangrove habitats. This study demonstrates the
regenerative capabilities of Rhizophora prop-roots, highlighting their resilience to
damaged tissues. The regenerative abilities of Rhizophora prop-roots and the plant’s
fitness are dependent upon the level of damage imposed to those tissues, coupled
with extrinsic factors such as intensity of herbivory.
Sphaeromatid and teredinid activity is different within mangrove tissues.
Sphaeromatids may benefit the plant by inducing increases of lateral out-branching
of new aerial-roots (Ribi, 1982). But, sphaeromatids are unable to bore in to woody
prop-roots (Perry, 1988). Teredinids are able to attack prop-roots, and their affect
within the root will frequently result in the death of that root, but only when the level
of damage upon the root is severe. Thus, root death may generate woody detritus
within the mangrove forests. The activity of the teredinids within woody debris
creates many tunnels, which when vacant may provide niches for many fauna (Cragg
and Hendy, 2010).
This study demonstrates the remarkable ability of mangrove trees to combat
herbivorous activity by either deposition of anti-herbivore chemicals and/or an over-
131
compensatory of tissue regrowth. However, the tunnelling of teredinids in live
damaged prop-roots in the low-intertidal regions of mangrove forests can be
detrimental. These data demonstrate that Rhizophora prop-roots are able to defend
against teredinid larval settlement when exposed to superficial damage, however
when the loss of tissues exposes the tannin-free cells normally protected by the
endodermal layers, teredinid larvae are able to settle and tunnel in to the prop-root.
132
Chapter 5
HABITAT CREATION FOR ANIMALS BY TEREDINIDS
5.1 Introduction
Mangrove ecosystems have long been considered as not particularly
biodiverse (Duke et al., 1998; Alongi, 2002), especially when compared with other
tropical marine ecosystems such as coral reefs (Connell, 1978). However, mangrove
forests provide a variety of niches to creatures that depend upon the mangrove
ecosystem (Nagelkerken et al., 2008). Animals commonly found in mangrove forests
include sesarmid crabs, which break down and recycle much of the leaf litter
(Robertson, 1990), beetles that processes large woody debris (LWD) in the high- to
mid-intertidal areas of the forests (Feller, 2002). Thus, mangrove forests have
organisms commonly found in terrestrial and aquatic habitats (Nagelkerken et al.,
2008). The structural complexity of mangrove forests provides a wide number of
niches that maintain the high level of biodiversity, driven by substrata such as
mangrove roots (Gratwicke and Speight, 2005).
The complexity of root structures provides cover and protection for small
and juvenile fish communities (Ronnback et al., 1999; Correa and Uieda, 2008;
Wang et al., 2009), to decrease their risk of becoming predated upon (Verweij et al.,
2006; Tse et al., 2008; MacDonald et al., 2009). The structural heterogeneity
provided by the roots may either impede the movement of hunting predatory fish or
the prey-fish are able to reduce their visibility by using the roots to hide behind
(Laegdsgaard and Johnson, 2001; Kruitwagen et al., 2010) – therefore the diversity
of animals and the abundance of individuals are largely considered to be attributed
133
by deterministic factors such as habitat complexity combined with animal
recruitment rates (Syms and Jones, 2000).
Although the mangrove roots have been studied for their role as a nursery
habitat, little is known about the mangrove faunal communities relying upon fallen
wood as a habitat; in particular wood that has been attacked by teredinid bivalves.
Teredinids create many tunnels in LWD (Filho et al., 2008). However, when the
teredinids die, the tunnels may support biodiversity when vacant for animals to
exploit (Cragg and Hendy, 2010). This means that LWD may provide an ecosystem
service as a micro-habitat within intertidal areas (Storry et al., 2006). When trees fall
in to freshwater ecosystems they attract a high level of biodiversity. The riparian
zone in freshwater ecosystems is important as this zone is habitat for many aquatic
animals. Thus, LWD serves as an important link between terrestrial and aquatic
ecosystems (Roth et al., 2007).
Initially, the study reported in this chapter aimed to compare the most
biologically diverse substratum within the mangrove forests of the Tukang Besi
Archipelago by using biodiversity indices as an indicator of habitat importance. This
study also aims to investigate the ecological role of the Teredinidae in creating
niches for faunal communities within LWD. The complexity of the mangrove forest
determines the habitat for many fauna (Gratwicke and Speight, 2005; Nagelkerken et
al., 2010). Thus, the internal structural complexities within woody detritus created by
teredinid tunnels was quantified and measured, and correlated with the level of
animal diversity recorded from within each LWD sample.
To investigate the diversity of fauna within teredinid-attacked LWD samples
of LWD were collected and the area occupied by teredinid tunnels within LWD was
estimated as a measure of complexity. The fauna within the tunnels were removed to

134
determine if there are relationships of increasing amounts of teredinid tunnels within
LWD combined with increasing levels of faunal diversity within those vacant
tunnels. Drilled wooden blocks mimicking teredinid tunnels were deployed in the
mangrove forests to determine the recruitment and succession of fauna in to the
tunnels.
This study tested the hypotheses that fallen wood will be the most bio-diverse
substrata, when compared to the sediments and root structures within the forests. A
subsidiary hypothesis tested that with increasing teredinid tunnels there will be an
increasing level of animal diversity within fallen wood, and that the first animals to
colonise the teredinid tunnels will have a greater mobility than animals that colonise
later and the size of the tunnel will affect the species present.
5.2 Materials and methods
5.2.1 Assessing the sediment macro-infauna, root epifauna and LWD
cryptic fauna
Four mangrove forests, Kaluku, Loho, One Onitu and Gili were used to
compare the biodiversity of sediment infauna, root epifauna and cryptofauna from
LWD (see chapter 2 for site descriptions). In each forest, three transects extending
from the strandline and ending at the seaward edge, samples of LWD (n = 101) were
collected and all cryptic macrofauna were removed. All items of LWD 2 metres each
side of the transect tape were sampled. Adjacent to each LWD item in the forests, a
sample of sediment (n = 101) was removed using a trowel for macro-infauna and five
prop roots (n = 510) were inspected for epifauna.
135
For each sediment sample, a volume of 4000 cm3
was collected at a depth of
10 cm and placed on to a plastic sheet and all macro-infauna were carefully removed
from the sediment. For each root, the length and circumference were measured to
determine the surface area and all attached epifauna were identified. For each LWD
sample, the volume of the wood piece was calculated. All animals were identified to
the lowest achievable taxonomic level with resources available locally.
5.2.2 Assessing the effect of teredinid tunnelling on LWD in mangrove
forests
Five mangrove forests were used to investigate animal communities within
LWD attacked by teredinids. These were, Langira, Kaluku, Loho, One Onitu and Gili
(see chapter 2 for site descriptions). Within each forest, LWD samples were collected
from five transects extending from the strandline and extending out to the seaward
edge (see chapter 2 for details). At ten metre intervals within the Langira forest, a
total of 70 items of LWD were collected. Within Kaluku, Loho, One Onitu and the
Gili mangrove forests a total of 20, 44, 32 and 30 items of LWD respectively were
collected at five metre intervals. A scale of teredinid attack intensity (Table 5.1) was
used within the samples of LWD to categorise the level of teredinid tunnelling. The
percentage of the surface occupied by teredinid tunnels was estimated across the
longitudinal section of each woody detrital sample using the digital analysis package,
Image Tool Version 3.00 (The University of Texas Health Science Centre at San
Antonio). All animals were removed from each LWD sample and identified.
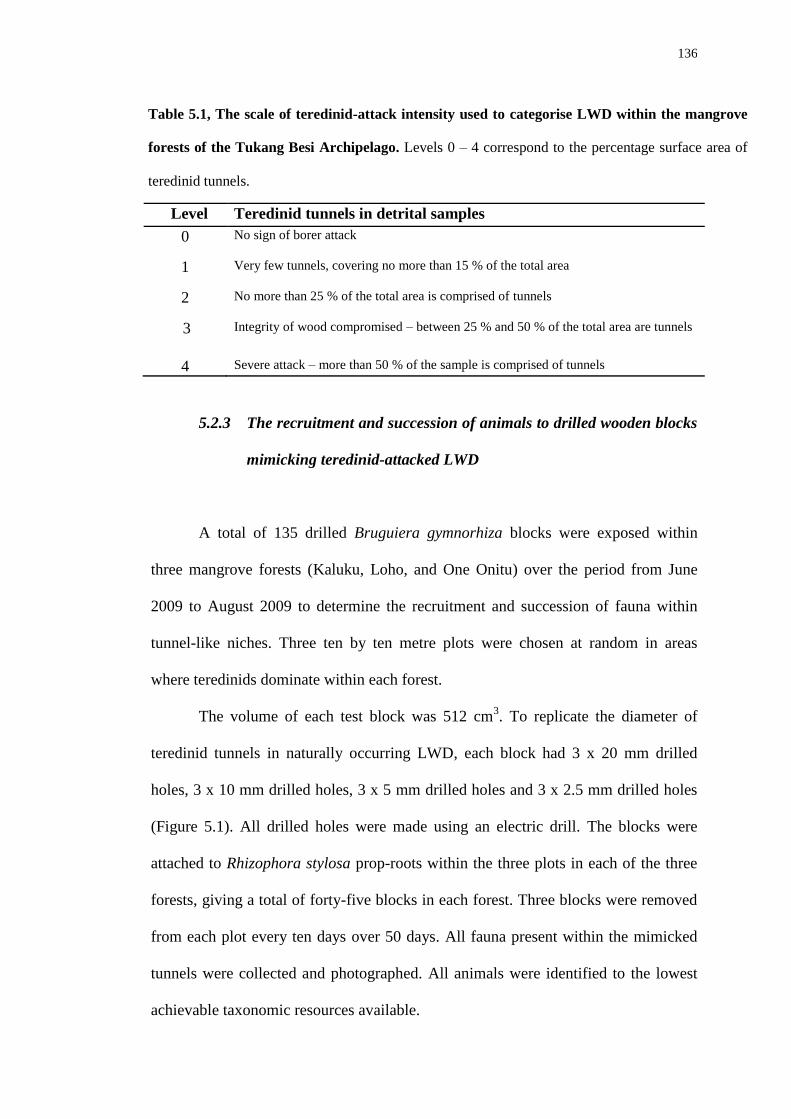
136
Level Teredinid tunnels in detrital samples
0 No sign of borer attack
1 Very few tunnels, covering no more than 15 % of the total area
2 No more than 25 % of the total area is comprised of tunnels
3 Integrity of wood compromised – between 25 % and 50 % of the total area are tunnels
4 Severe attack – more than 50 % of the sample is comprised of tunnels
5.2.3 The recruitment and succession of animals to drilled wooden blocks
mimicking teredinid-attacked LWD
A total of 135 drilled Bruguiera gymnorhiza blocks were exposed within
three mangrove forests (Kaluku, Loho, and One Onitu) over the period from June
2009 to August 2009 to determine the recruitment and succession of fauna within
tunnel-like niches. Three ten by ten metre plots were chosen at random in areas
where teredinids dominate within each forest.
The volume of each test block was 512 cm3. To replicate the diameter of
teredinid tunnels in naturally occurring LWD, each block had 3 x 20 mm drilled
holes, 3 x 10 mm drilled holes, 3 x 5 mm drilled holes and 3 x 2.5 mm drilled holes
(Figure 5.1). All drilled holes were made using an electric drill. The blocks were
attached to Rhizophora stylosa prop-roots within the three plots in each of the three
forests, giving a total of forty-five blocks in each forest. Three blocks were removed
from each plot every ten days over 50 days. All fauna present within the mimicked
tunnels were collected and photographed. All animals were identified to the lowest
achievable taxonomic resources available.
Table 5.1, The scale of teredinid-attack intensity used to categorise LWD within the mangrove
forests of the Tukang Besi Archipelago. Levels 0 – 4 correspond to the percentage surface area of
teredinid tunnels.

137
5.3 Data analysis
To test for differences of abundances of animals between the sites, a One-way
analysis of variance (ANOVA) was used. A 1-way ANOVA was used to determine
differences between values of Shannon-Weiner biodiversity indices calculated from
root epifauna, sediment macro-infauna and LWD cryptic fauna. A 2-way ANOVA
was used to test for differences of the abundance and numbers of species in drilled
wooden blocks between three mangrove sites and over fifty days, with site and time
as factors. Regression analyses were used to reveal relationships of faunal diversity
within vacant teredinid tunnels and environmental factors, distance from the land,
volume of LWD and surface area of teredinid tunnels. Tukey’s pairwise comparison
test separated values into statistically distinct subsets for ANOVA. All data were
Figure 5.1, A drilled wooden block with various diameter tunnels to
replicate a teredinid-attacked piece of woody detritus. The wooden block
is tethered to a Rhizophora stylosa prop-root using a nylon cable-tie.

138
checked for normality, residuals were inspected to ensure that assumptions for
ANOVA were not compromised. Count data were square root transformed and all
percentage data were arcsin transformed. Statistical analyses were performed using
MINITAB (MINITAB Inc, version 13.20).
Univariate and non-parametric multivariate techniques, biodiversity indices
tests and a 1-way, 3-level PERMANOVA, based on a Bray-Curtis similarity matrix
was used to determine differences between the sediments, roots and LWD in the
PRIMER 6 (Plymouth Routines in Multivariate Ecological Research). Post-hoc pair-
wise tests were applied after the PERMANOVA to highlight the similarities between
the different substrata. Diversity indices were used for the fauna collected from
different substrates, teredinid-attacked LWD, the fauna collected from within
different diameter tunnels, and the recruitment of fauna to the tunnels (see chapters 2
and 3 for indices description).
5.4 Results
5.4.1 Comparisons of animal diversity in different substrata
Differences of the faunal communities between substrata were significant
(Table. 5.2 a, one-way PERMANOVA pair-wise test, pseudo-F 2,732 = 47.03, p =
< 0.01). The LWD and root fauna had the lowest similarity between the different
habitats with 38.5 % when compared with each of the substrata (Table. 5.2 b).
The sediments and roots were most similar with 70.5%.
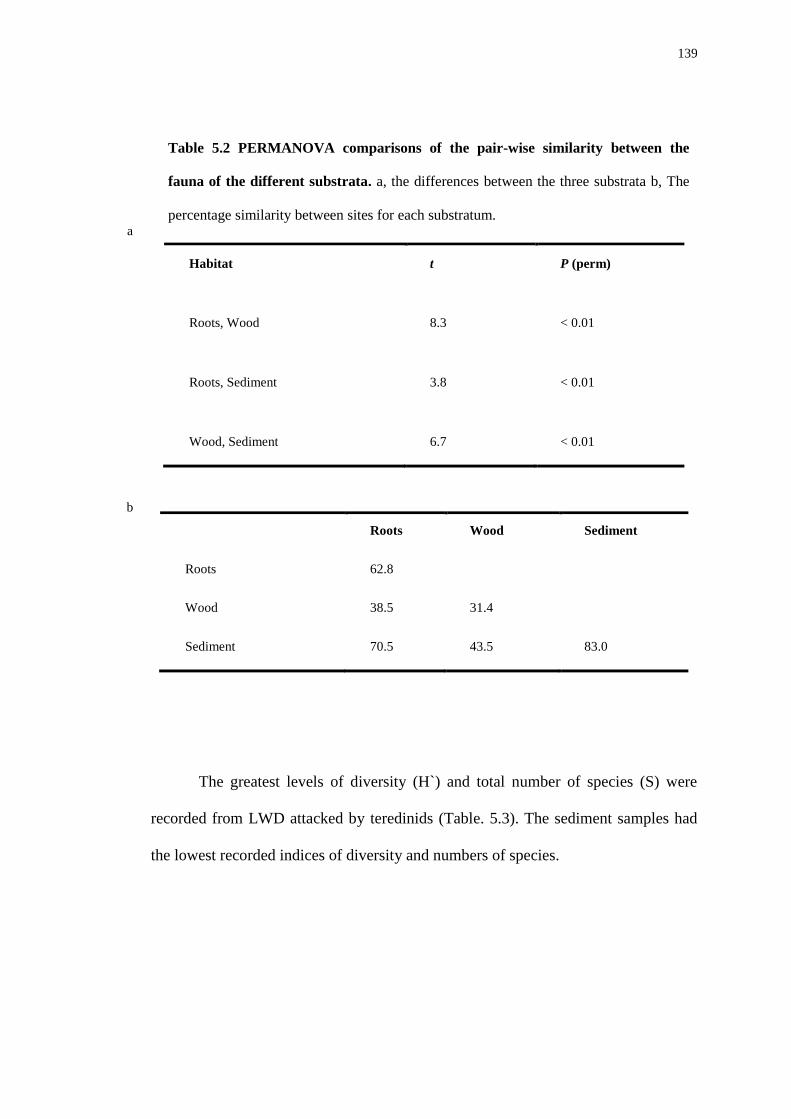
139
Habitat t P (perm)
Roots, Wood 8.3 < 0.01
Roots, Sediment 3.8 < 0.01
Wood, Sediment 6.7 < 0.01
Roots Wood Sediment
Roots 62.8
Wood 38.5 31.4
Sediment 70.5 43.5 83.0
The greatest levels of diversity (H`) and total number of species (S) were
recorded from LWD attacked by teredinids (Table. 5.3). The sediment samples had
the lowest recorded indices of diversity and numbers of species.
Table 5.2 PERMANOVA comparisons of the pair-wise similarity between the
fauna of the different substrata. a, the differences between the three substrata b, The
percentage similarity between sites for each substratum. a
b

140
Habitat Site S J' H'
Sediment Gili 5 0.84 1.36
Kaluku 3 0.95 1.04
Loho 7 0.96 1.87
One Onitu 4 0.68 0.94
Roots Gili 8 0.84 1.75
Kaluku 12 0.86 2.13
Loho 16 0.79 2.19
One Onitu 16 0.79 2.19
Wood Gili 13 0.85 2.18
Kaluku 26 0.83 2.72
Loho 28 0.84 2.81
One Onitu 21 0.86 2.62
Significant differences between the three substrata were found (Figure 5.2).
Sediments had the lowest recorded diversity and the mangrove roots had a slightly
greater level of diversity, but not significantly different. However, woody detritus
had the greatest recorded mean level of diversity within the mangrove forests. Fallen
wood attacked by teredinids within the forests were on average 5.7 times more
Table. 5.3, Biodiversity indices of animals recorded from roots, sediments and
LWD. S = number of species, J’ = Pielou’s evenness, H’ = Shannon-Weiner diversity
index.

141
biodiverse than the root structures and 9.3 times more diverse than the infauna within
mangrove sediments.
The identified fauna from the roots, sediments and LWD were categorised by
their trophic levels. The epifauna upon the roots consisted mainly of filter feeders.
The macro-infauna within the mangrove sediment was dominated by detritivores.
The fauna within the teredinid attacked LWD had a broad spectrum of trophic levels
with carnivores, detritivores, filter feeders, herbivores and omnivores (Figure 5. 3).
a a
b
0
0.1
0.2
0.3
0.4
0.5
0.6
0.7
0.8
0.9
Sediment Roots Wood
Div
ersi
ty (
H`)
Substrata
n = 101
Figure 5.2 The Shannon-Weiner diversity of fauna recorded from four
mangrove sites within the Tukang Besi Archipelago. Tukey’s test reveals no
difference of biodiversity recorded between the sediments and root substrata
(letters above the bar). However, a clear significant difference was found with
biodiversity of cryptic fauna compared with other substrata from the
mangroves (mean ± SE, F2, 732 = 114.56, p = < 0.001).
n = 510
n = 101

142
5.4.2 Biodiversity in teredinid tunnelled wood
Greater biodiversity was observed in more wood tunnelled by teredinids
(Figure 5.4 a and b, 1-way ANOVA, p = < 0.001). The Gili forest (Table 5.4 a) had a
total of 30 LWD samples, and the greatest abundance of animals were found in LWD
samples with a teredinid attack category of 3, with 63 animals. No level 4 teredinid
attack categories were recorded in LWD from the Gili forest.
The greatest numbers of different species in Kaluku (Table 5.4 b) were found
in LWD samples with a level 4 category of teredinid attack, with 25 species. No
animals were recorded in the analyses of LWD within the level 0 category of
0
10
20
30
40
50
60
70
80
90
100
Roots Sediments LWD
Tro
ph
ic l
evel
(%
)
Substrata
Suspension feeders
Scavengers
Omnivores
Herbivores
Filter feeders
Detritivores
Carnivores
Figure 5.3 The trophic levels of fauna identified from mangrove roots, sediments and
LWD from the mangrove forests of the WMP. All epifauna, macro-infauna and cryptic
fauna identified from the roots, sediments and LWD respectively were categorised by their
feeding mode (%).
143
teredinid attack intensities. The greatest abundances of animals were also found in
the level 4 categories, with a total of 315 animals.
The greatest numbers of different species in Langira (Table 5.4 c) were found
in LWD samples with a level 4 category of teredinid attack, with 30 species. The
greatest abundance of animals was also found within LWD samples with a level 4
category of teredinid attack, with a total of 478 animals. The lowest number of
species was recorded with the level 0 category of teredinid attack, with 6 species.
The greatest numbers of different species in Loho (Table 5.4 d) were found in
woody detrital samples with a level 4 category of teredinid attack, with 26 species.
The greatest abundance of animals was also recorded within LWD samples with a
teredinid attack level of 4, with a total of 271 animals. No animals were found in
LWD samples with a teredind attack intensity level of 0.
The greatest numbers of different species in One Onitu (Table 5.4 e) were
found in detrital samples with a teredinid attack intensity of level 4, with 18 species.
The greatest abundance of animals was also found in LWD samples with a teredinid
attack level of 4, with a total of 73 animals. Whereas, the lowest recorded number of
species and abundance was recorded within LWD with a level 0 category of teredind
attack, with 5 species and a total of 6 animals respectively.
There is a strong relationship of increasing numbers of different species
found within detrital samples of increasing percentage surface areas of teredinid
tunnels (Figure 5.5 a). A similar relationship was found with the abundance of
individuals with an increasing amount of teredinid tunnels. A regression analysis
demonstrated that with increasing surface areas of teredinid tunnels within LWD, the
abundance of animals will also increase (Figure 5.5 b).

144
a a
bc c
ab ab
bc
d
a b ab
abc c
a
b bc
d
a a
ab ab
b
0
10
20
30
40
50
60
70
0 1 2 3 4
Ab
un
da
nce
of
ind
ivid
ua
ls
Gili Kaluku Langira Loho One Onitu
*
a
ab
c c
ab
ab
c
d
ab
a
bc
bc
c
ab
c
c
d
a
b
bc bc
c
0
2
4
6
8
10
0 1 2 3 4
Nu
mb
er o
f sp
ecie
s
Teredinid attack level
Figure 5.4, The abundance of animals (a) and numbers of species (b)
removed from teredinid-attacked LWD in mangrove forests from the
WMP. LWD from each site was categorised by the amount of teredinid
tunnels (refer to Table 5.1) and all fauna removed (mean ± SE). * = No LWD
collected with this level of teredinid attack intensity. Letters above the bars =
Tukeys Pairwise test.
a
b
*
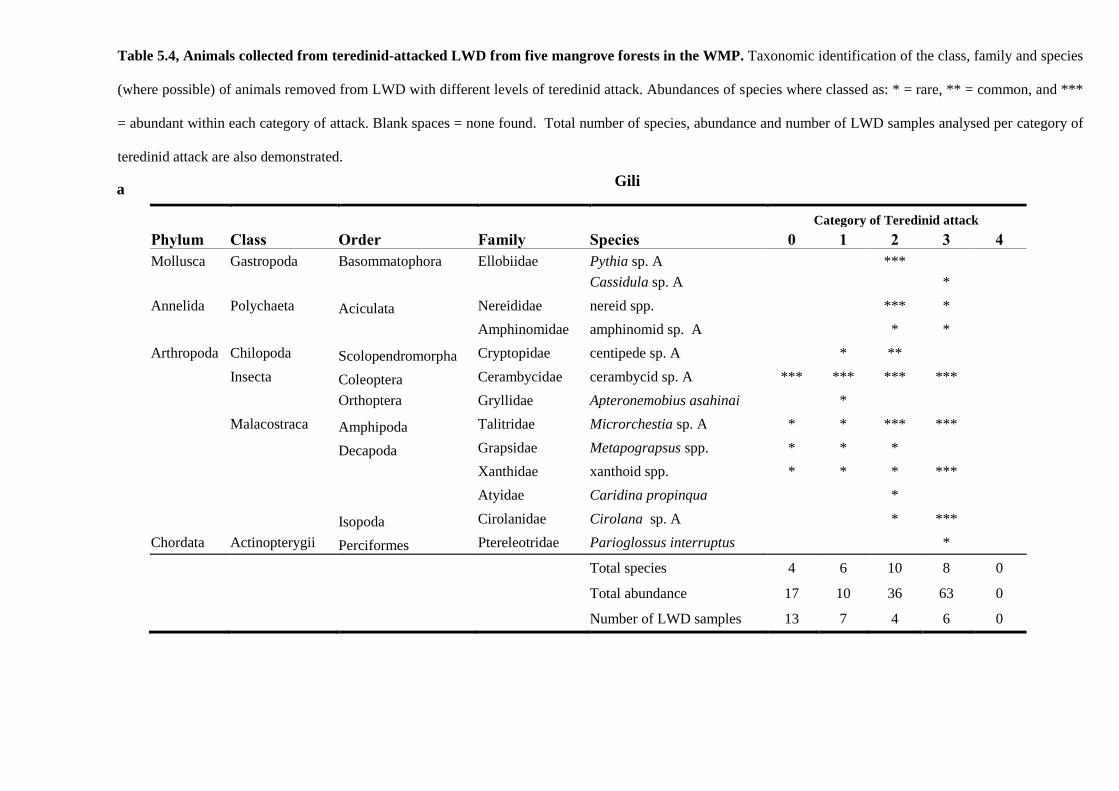
145
Category of Teredinid attack
Phylum Class Order Family Species 0 1 2 3 4 Mollusca Gastropoda Basommatophora Ellobiidae Pythia sp. A ***
Cassidula sp. A *
Annelida Polychaeta Aciculata Nereididae nereid spp. *** *
Amphinomidae amphinomid sp. A * *
Arthropoda Chilopoda Scolopendromorpha Cryptopidae centipede sp. A * **
Insecta Coleoptera Cerambycidae cerambycid sp. A *** *** *** ***
Orthoptera Gryllidae Apteronemobius asahinai *
Malacostraca Amphipoda Talitridae Microrchestia sp. A * * *** ***
Decapoda Grapsidae Metapograpsus spp. * * *
Xanthidae xanthoid spp. * * * ***
Atyidae Caridina propinqua *
Isopoda Cirolanidae Cirolana sp. A * ***
Chordata Actinopterygii Perciformes Ptereleotridae Parioglossus interruptus *
Total species 4 6 10 8 0
Total abundance 17 10 36 63 0
Number of LWD samples 13 7 4 6 0
Gili
Table 5.4, Animals collected from teredinid-attacked LWD from five mangrove forests in the WMP. Taxonomic identification of the class, family and species
(where possible) of animals removed from LWD with different levels of teredinid attack. Abundances of species where classed as: * = rare, ** = common, and ***
= abundant within each category of attack. Blank spaces = none found. Total number of species, abundance and number of LWD samples analysed per category of
teredinid attack are also demonstrated.
a
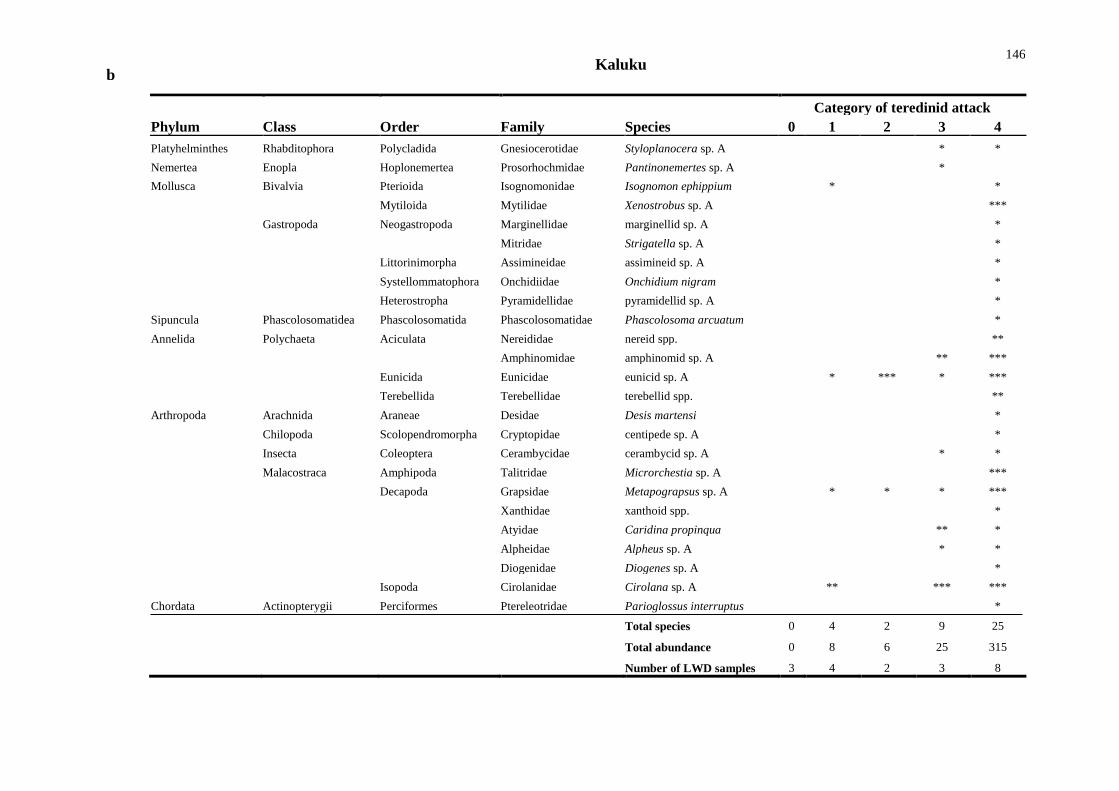
146
Category of teredinid attack
Phylum Class Order Family Species 0 1 2 3 4 Platyhelminthes Rhabditophora Polycladida Gnesiocerotidae Styloplanocera sp. A * *
Nemertea Enopla Hoplonemertea Prosorhochmidae Pantinonemertes sp. A *
Mollusca Bivalvia Pterioida Isognomonidae Isognomon ephippium * *
Mytiloida Mytilidae Xenostrobus sp. A ***
Gastropoda Neogastropoda Marginellidae marginellid sp. A *
Mitridae Strigatella sp. A *
Littorinimorpha Assimineidae assimineid sp. A *
Systellommatophora Onchidiidae Onchidium nigram *
Heterostropha Pyramidellidae pyramidellid sp. A *
Sipuncula Phascolosomatidea Phascolosomatida Phascolosomatidae Phascolosoma arcuatum *
Annelida Polychaeta Aciculata Nereididae nereid spp. **
Amphinomidae amphinomid sp. A ** ***
Eunicida Eunicidae eunicid sp. A * *** * ***
Terebellida Terebellidae terebellid spp. **
Arthropoda Arachnida Araneae Desidae Desis martensi *
Chilopoda Scolopendromorpha Cryptopidae centipede sp. A *
Insecta Coleoptera Cerambycidae cerambycid sp. A * *
Malacostraca Amphipoda Talitridae Microrchestia sp. A ***
Decapoda Grapsidae Metapograpsus sp. A * * * ***
Xanthidae xanthoid spp. *
Atyidae Caridina propinqua ** *
Alpheidae Alpheus sp. A * *
Diogenidae Diogenes sp. A *
Isopoda Cirolanidae Cirolana sp. A ** *** ***
Chordata Actinopterygii Perciformes Ptereleotridae Parioglossus interruptus *
Total species 0 4 2 9 25
Total abundance 0 8 6 25 315
Number of LWD samples 3 4 2 3 8
b Kaluku

147
Category of Teredinid attack intensity
Phylum Class Order Family Species 0 1 2 3 4
Platyhelminthes Rhabditophora Polycladida Gnesiocerotidae Styloplanocera sp. A *
Nemertea Enopla Hoplonemertea Prosorhochmidae Pantinonemertes sp. A
*
Mollusca Bivalvia Mytiloida Mytilidae Xenostrobus sp. A
*
*
Pterioida Isognomonidae Isognomon ephippium
*
Gastropod Littorinimorpha Assimineidae assimineid sp. A
* *
Neotaenioglossa Cypraeidae Cypraea interrupta
*
Systellommatophora Onchidiidae Onchidium nigram
* *
Neogastropoda Mitridae Strigatella sp. A
*
Muricidae Thais gradata
*
Nassariidae Nassarius sp. A
*
Columbellidae Pseudanachis basedowi
*
Caenogastropoda Cerithiidae Clypeomorus sp. A
*
Cephalopoda Octopoda
octopod sp. A
*
Sipuncula Sipunculidea Phascolosomatida Phascolosomatidae Phascolosoma arcuatum
*
*
Annelida Polychaeta Aciculata Nereididae nereid spp. * * *** ** ***
Amphinomidae amphinomid sp. A
** *
***
Eunicida Eunicidae eunicid sp. A * ** *
**
Terebellida Terebellidae terebellid spp.
*
**
Arthropoda Arachnida Araneae Desidae Desis martensi
*
**
Insecta Coleoptera Cerambycidae cerambycid sp. A *** ** * ** *
Malacostraca Amphipoda Talitridae Microrchestia sp. A
*
Decapoda Grapsidae Metapograpsus sp. A * * *** ** **
Xanthidae xanthoid spp.
** * * **
Atyidae Caridina propinqua * *
*
Alpheidae Alpheus sp. A
* *
*
Diogenidae Diogenes sp. A
*
*
Pilumnidae Pilumnus vespertilio
*
*
Isopoda Cirolanidae Cirolana sp. A * * ** * *
Chordata Actinopterygii Perciformes Ptereleotridae Parioglossus interruptus
*
* *
Anguilliformes Muraenidae Gymnothorax richardsoni
*
c Langira
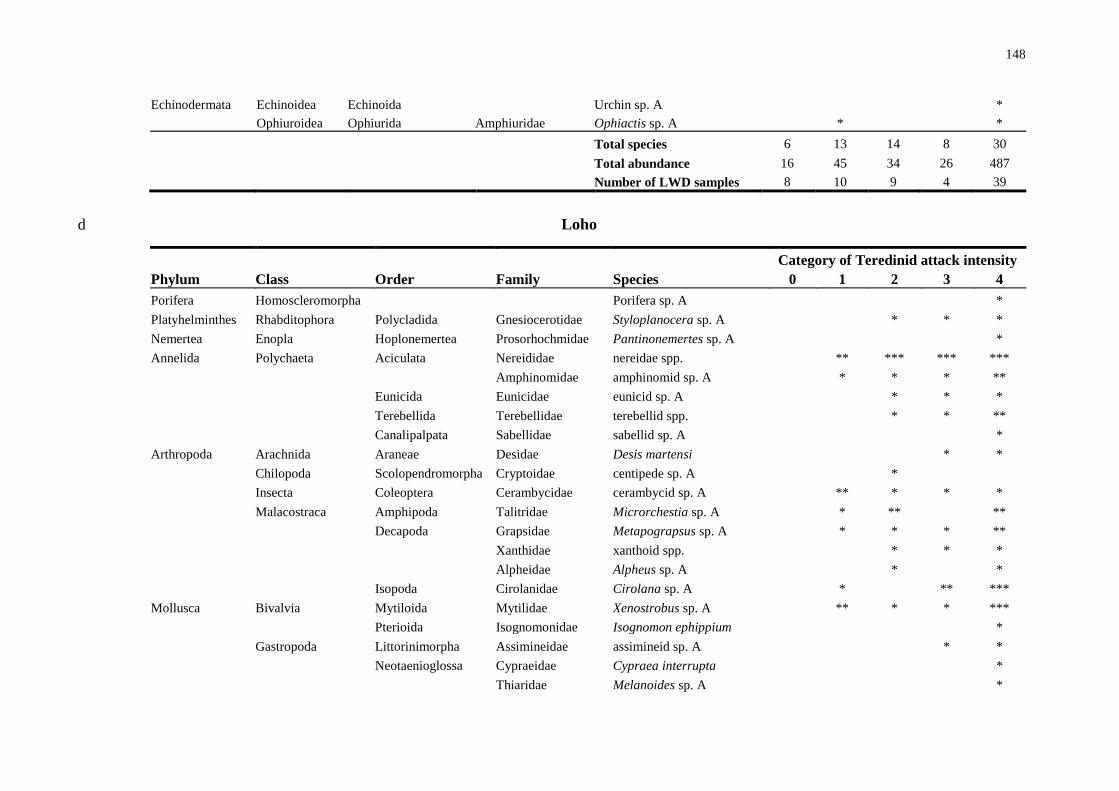
148
Echinodermata Echinoidea Echinoida
Urchin sp. A
*
Ophiuroidea Ophiurida Amphiuridae Ophiactis sp. A
*
*
Total species 6 13 14 8 30
Total abundance 16 45 34 26 487
Number of LWD samples 8 10 9 4 39
Category of Teredinid attack intensity
Phylum Class Order Family Species 0 1 2 3 4 Porifera Homoscleromorpha Porifera sp. A *
Platyhelminthes Rhabditophora Polycladida Gnesiocerotidae Styloplanocera sp. A
* * *
Nemertea Enopla Hoplonemertea Prosorhochmidae Pantinonemertes sp. A
*
Annelida Polychaeta Aciculata Nereididae nereidae spp.
** *** *** ***
Amphinomidae amphinomid sp. A
* * * **
Eunicida Eunicidae eunicid sp. A
* * *
Terebellida Terebellidae terebellid spp.
* * **
Canalipalpata Sabellidae sabellid sp. A
*
Arthropoda Arachnida Araneae Desidae Desis martensi
* *
Chilopoda Scolopendromorpha Cryptoidae centipede sp. A
*
Insecta Coleoptera Cerambycidae cerambycid sp. A
** * * *
Malacostraca Amphipoda Talitridae Microrchestia sp. A
* **
**
Decapoda Grapsidae Metapograpsus sp. A
* * * **
Xanthidae xanthoid spp.
* * *
Alpheidae Alpheus sp. A
*
*
Isopoda Cirolanidae Cirolana sp. A
*
** ***
Mollusca Bivalvia Mytiloida Mytilidae Xenostrobus sp. A
** * * ***
Pterioida Isognomonidae Isognomon ephippium
*
Gastropoda Littorinimorpha Assimineidae assimineid sp. A
* *
Neotaenioglossa Cypraeidae Cypraea interrupta
*
Thiaridae Melanoides sp. A
*
Loho d
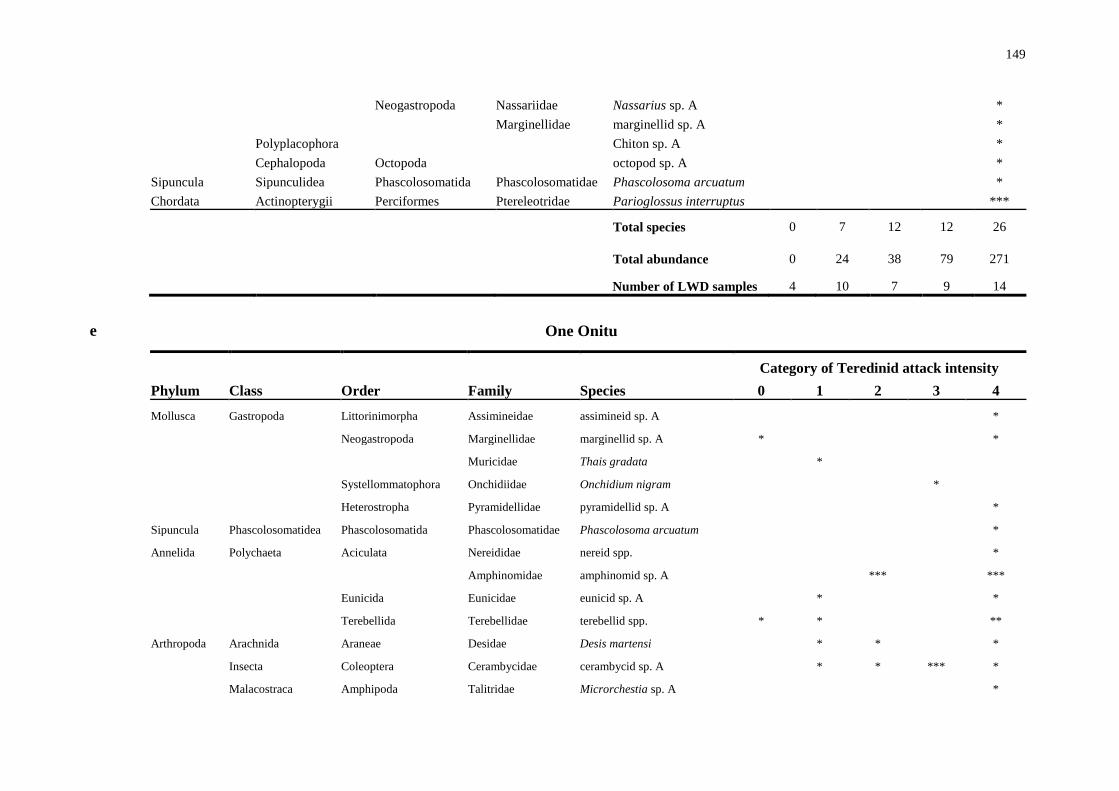
149
Neogastropoda Nassariidae Nassarius sp. A
*
Marginellidae marginellid sp. A
*
Polyplacophora
Chiton sp. A
*
Cephalopoda Octopoda
octopod sp. A
*
Sipuncula Sipunculidea Phascolosomatida Phascolosomatidae Phascolosoma arcuatum
*
Chordata Actinopterygii Perciformes Ptereleotridae Parioglossus interruptus
***
Total species 0 7 12 12 26
Total abundance 0 24 38 79 271
Number of LWD samples 4 10 7 9 14
Category of Teredinid attack intensity
Phylum Class Order Family Species 0 1 2 3 4 Mollusca Gastropoda Littorinimorpha Assimineidae assimineid sp. A *
Neogastropoda Marginellidae marginellid sp. A *
*
Muricidae Thais gradata
*
Systellommatophora Onchidiidae Onchidium nigram
*
Heterostropha Pyramidellidae pyramidellid sp. A
*
Sipuncula Phascolosomatidea Phascolosomatida Phascolosomatidae Phascolosoma arcuatum
*
Annelida Polychaeta Aciculata Nereididae nereid spp.
*
Amphinomidae amphinomid sp. A
***
***
Eunicida Eunicidae eunicid sp. A
*
*
Terebellida Terebellidae terebellid spp. * *
**
Arthropoda Arachnida Araneae Desidae Desis martensi
* *
*
Insecta Coleoptera Cerambycidae cerambycid sp. A
* * *** *
Malacostraca Amphipoda Talitridae Microrchestia sp. A
*
e One Onitu

150
Decapoda Grapsidae Metapograpsus sp. A *
* *
Xanthidae xanthoid spp. *
* *
Alpheidae Alpheus sp. A
*
Atyidae Caridina propinqua
*
Isopoda Cirolanidae Cirolana sp. A * ***
* **
Chordata Actinopterygii Perciformes Ptereleotridae Parioglossus interruptus
**
*
Blenniidae blennie sp. A
*
Ascidiacea Phlebobranchia
Tunicate sp. A
*
Total species 5 7 4 5 18
Total abundance 6 12 17 10 73
Number of LWD samples 11 6 4 3 8
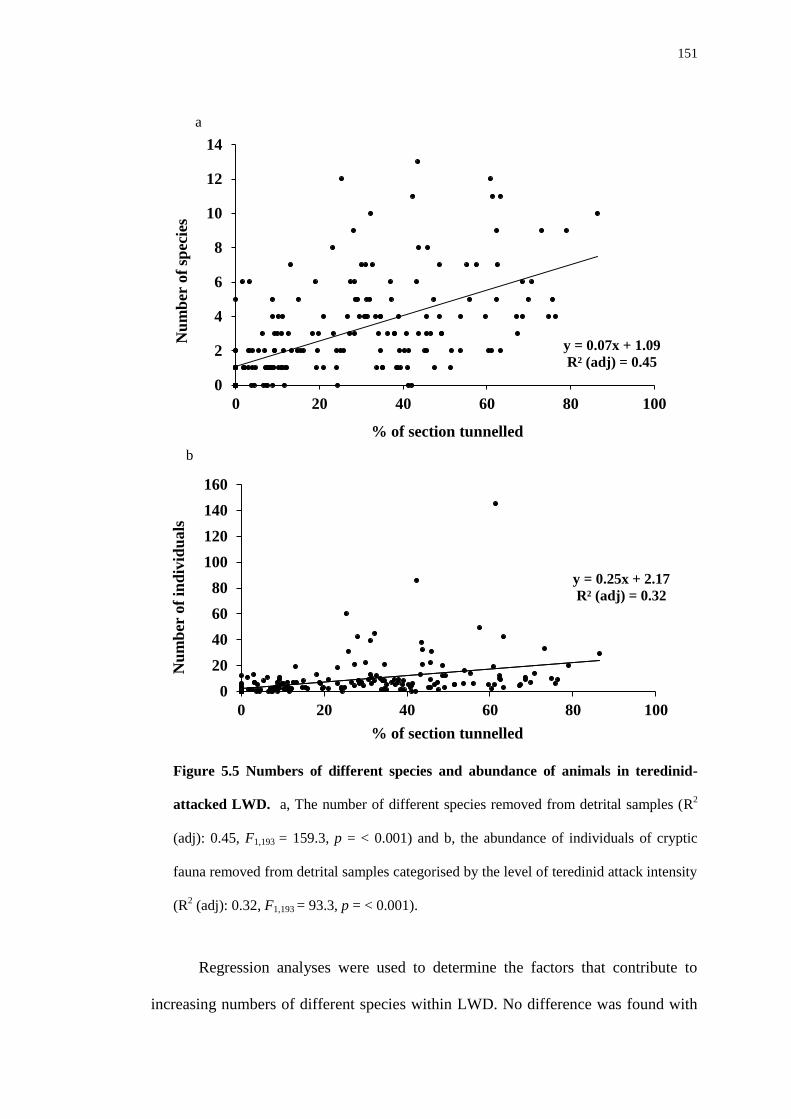
151
Regression analyses were used to determine the factors that contribute to
increasing numbers of different species within LWD. No difference was found with
y = 0.07x + 1.09
R² (adj) = 0.45
0
2
4
6
8
10
12
14
0 20 40 60 80 100
Nu
mb
er o
f sp
ecie
s
% of section tunnelled
y = 0.25x + 2.17
R² (adj) = 0.32
0
20
40
60
80
100
120
140
160
0 20 40 60 80 100
Nu
mb
er o
f in
div
idu
als
% of section tunnelled
Figure 5.5 Numbers of different species and abundance of animals in teredinid-
attacked LWD. a, The number of different species removed from detrital samples (R2
(adj): 0.45, F1,193 = 159.3, p = < 0.001) and b, the abundance of individuals of cryptic
fauna removed from detrital samples categorised by the level of teredinid attack intensity
(R2 (adj): 0.32, F1,193 = 93.3, p = < 0.001).
a
b
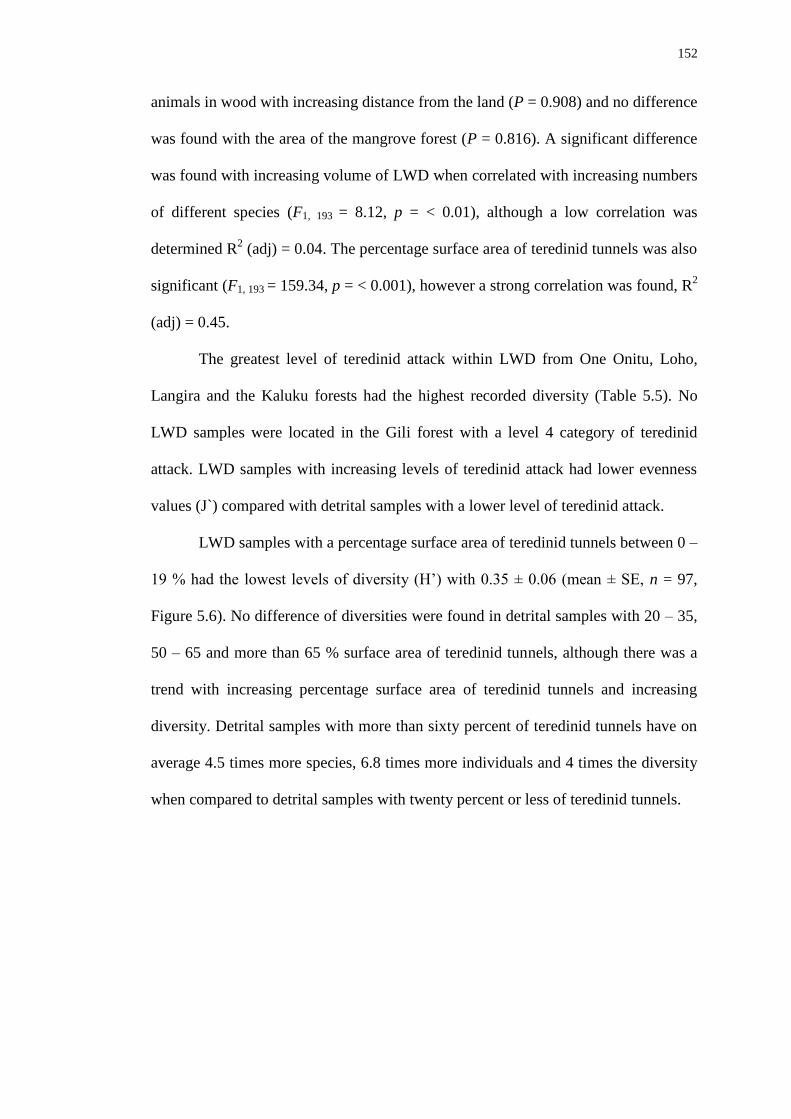
152
animals in wood with increasing distance from the land (P = 0.908) and no difference
was found with the area of the mangrove forest (P = 0.816). A significant difference
was found with increasing volume of LWD when correlated with increasing numbers
of different species (F1, 193 = 8.12, p = < 0.01), although a low correlation was
determined R2 (adj) = 0.04. The percentage surface area of teredinid tunnels was also
significant (F1, 193 = 159.34, p = < 0.001), however a strong correlation was found, R2
(adj) = 0.45.
The greatest level of teredinid attack within LWD from One Onitu, Loho,
Langira and the Kaluku forests had the highest recorded diversity (Table 5.5). No
LWD samples were located in the Gili forest with a level 4 category of teredinid
attack. LWD samples with increasing levels of teredinid attack had lower evenness
values (J`) compared with detrital samples with a lower level of teredinid attack.
LWD samples with a percentage surface area of teredinid tunnels between 0 –
19 % had the lowest levels of diversity (H’) with 0.35 ± 0.06 (mean ± SE, n = 97,
Figure 5.6). No difference of diversities were found in detrital samples with 20 – 35,
50 – 65 and more than 65 % surface area of teredinid tunnels, although there was a
trend with increasing percentage surface area of teredinid tunnels and increasing
diversity. Detrital samples with more than sixty percent of teredinid tunnels have on
average 4.5 times more species, 6.8 times more individuals and 4 times the diversity
when compared to detrital samples with twenty percent or less of teredinid tunnels.
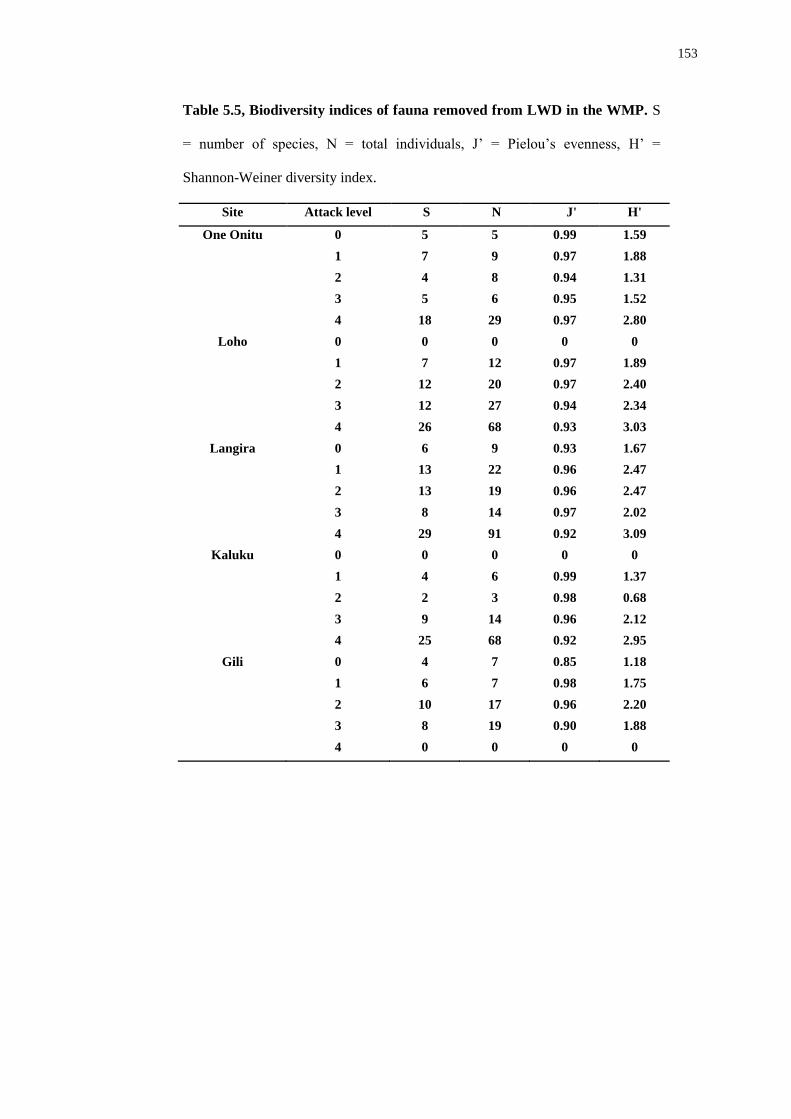
153
Site Attack level S N J' H'
One Onitu 0 5 5 0.99 1.59
1 7 9 0.97 1.88
2 4 8 0.94 1.31
3 5 6 0.95 1.52
4 18 29 0.97 2.80
Loho 0 0 0 0 0
1 7 12 0.97 1.89
2 12 20 0.97 2.40
3 12 27 0.94 2.34
4 26 68 0.93 3.03
Langira 0 6 9 0.93 1.67
1 13 22 0.96 2.47
2 13 19 0.96 2.47
3 8 14 0.97 2.02
4 29 91 0.92 3.09
Kaluku 0 0 0 0 0
1 4 6 0.99 1.37
2 2 3 0.98 0.68
3 9 14 0.96 2.12
4 25 68 0.92 2.95
Gili 0 4 7 0.85 1.18
1 6 7 0.98 1.75
2 10 17 0.96 2.20
3 8 19 0.90 1.88
4 0 0 0 0
Table 5.5, Biodiversity indices of fauna removed from LWD in the WMP. S
= number of species, N = total individuals, J’ = Pielou’s evenness, H’ =
Shannon-Weiner diversity index.
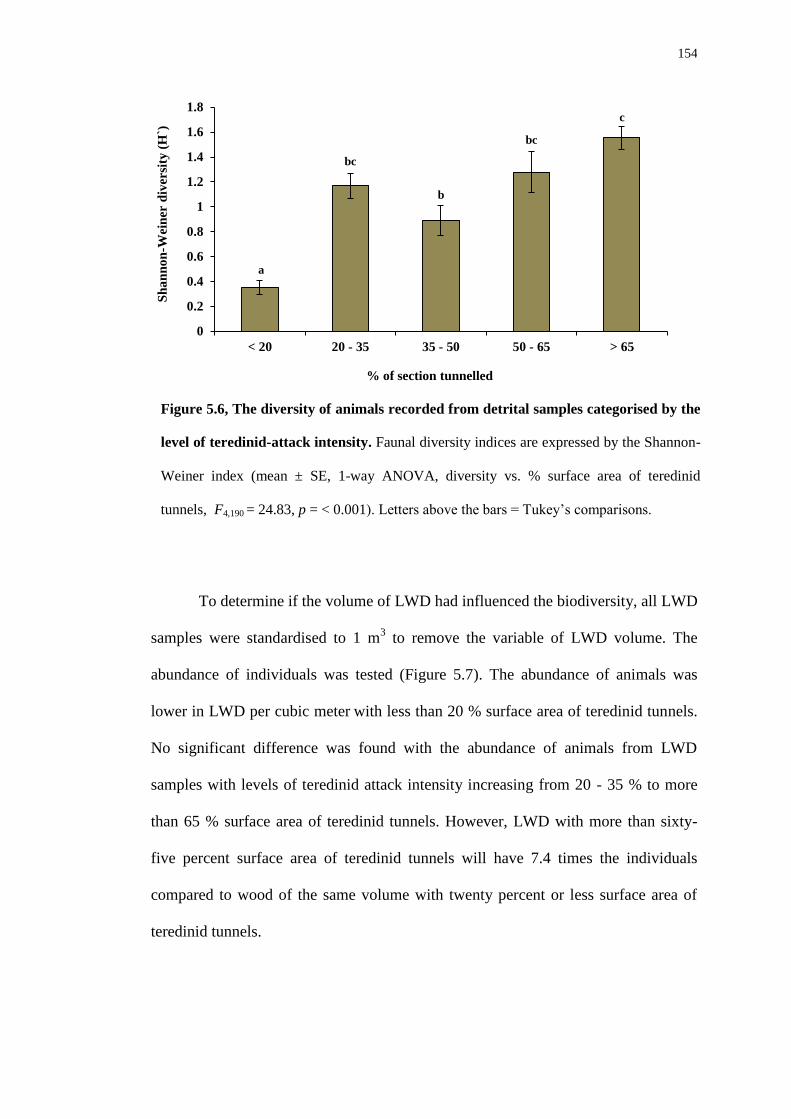
154
To determine if the volume of LWD had influenced the biodiversity, all LWD
samples were standardised to 1 m3 to remove the variable of LWD volume. The
abundance of individuals was tested (Figure 5.7). The abundance of animals was
lower in LWD per cubic meter with less than 20 % surface area of teredinid tunnels.
No significant difference was found with the abundance of animals from LWD
samples with levels of teredinid attack intensity increasing from 20 - 35 % to more
than 65 % surface area of teredinid tunnels. However, LWD with more than sixty-
five percent surface area of teredinid tunnels will have 7.4 times the individuals
compared to wood of the same volume with twenty percent or less surface area of
teredinid tunnels.
a
bc
b
bc
c
0
0.2
0.4
0.6
0.8
1
1.2
1.4
1.6
1.8
< 20 20 - 35 35 - 50 50 - 65 > 65
Sh
an
no
n-W
ein
er d
iver
sity
(H
`)
% of section tunnelled
Figure 5.6, The diversity of animals recorded from detrital samples categorised by the
level of teredinid-attack intensity. Faunal diversity indices are expressed by the Shannon-
Weiner index (mean ± SE, 1-way ANOVA, diversity vs. % surface area of teredinid
tunnels, F4,190 = 24.83, p = < 0.001). Letters above the bars = Tukey’s comparisons.
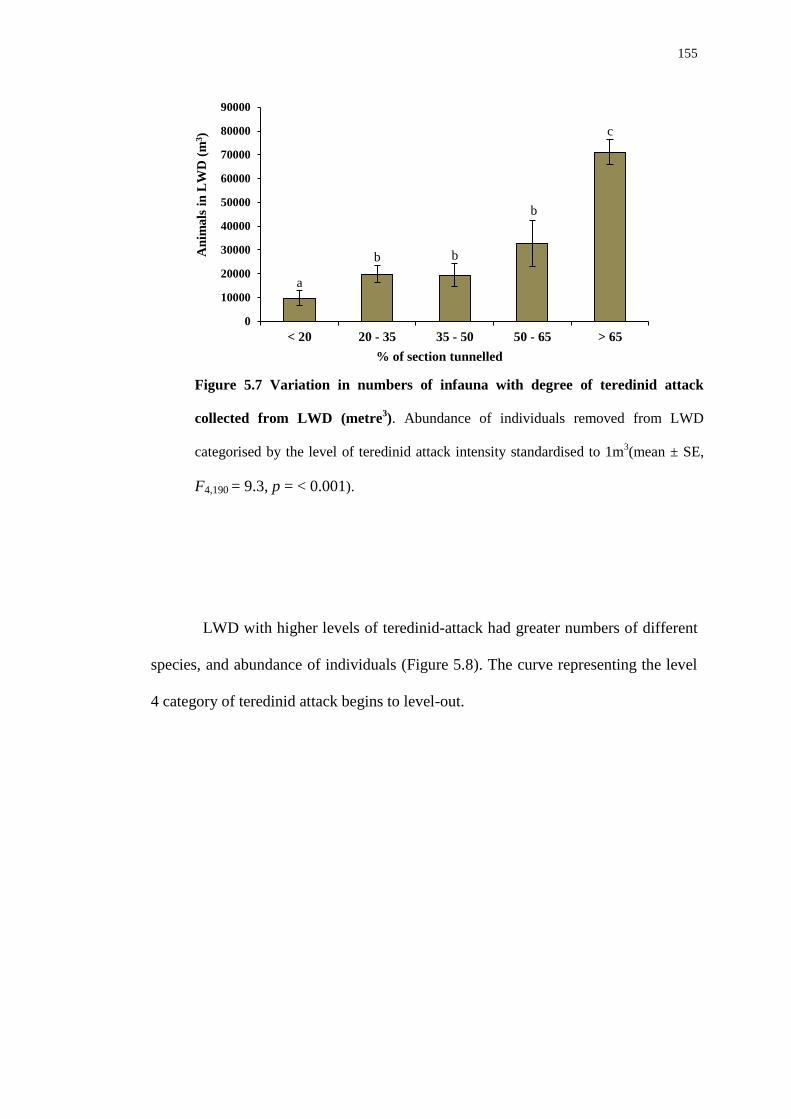
155
LWD with higher levels of teredinid-attack had greater numbers of different
species, and abundance of individuals (Figure 5.8). The curve representing the level
4 category of teredinid attack begins to level-out.
a
b b
b
c
0
10000
20000
30000
40000
50000
60000
70000
80000
90000
< 20 20 - 35 35 - 50 50 - 65 > 65
An
ima
ls i
n L
WD
(m
3)
% of section tunnelled
Figure 5.7 Variation in numbers of infauna with degree of teredinid attack
collected from LWD (metre3). Abundance of individuals removed from LWD
categorised by the level of teredinid attack intensity standardised to 1m3(mean ± SE,
F4,190 = 9.3, p = < 0.001).

156
The Gili and One Onitu forests had the least abundance and number of
species removed from teredinid-attacked LWD of the five mangrove forests.
However, Langira, Loho and Kaluku have the greatest abundance and number of
species within teredinid-attacked LWD (Figure 5.9).
0
5
10
15
20
25
30
35
40
0 200 400 600 800 1000 1200
Nu
mb
er o
f sp
ecie
s
Total number of individuals
Level 0
Level 1
Level 2
Level 3
Level 4
Figure 5.8, Species accumulation curves of infauna removed from LWD categorised by
the level of teredinid attack. Infauna removed from all levels of teredinid-attacked LWD
within five mangrove forests. Each level of teredinid attack is categorised by different coloured
symbols.
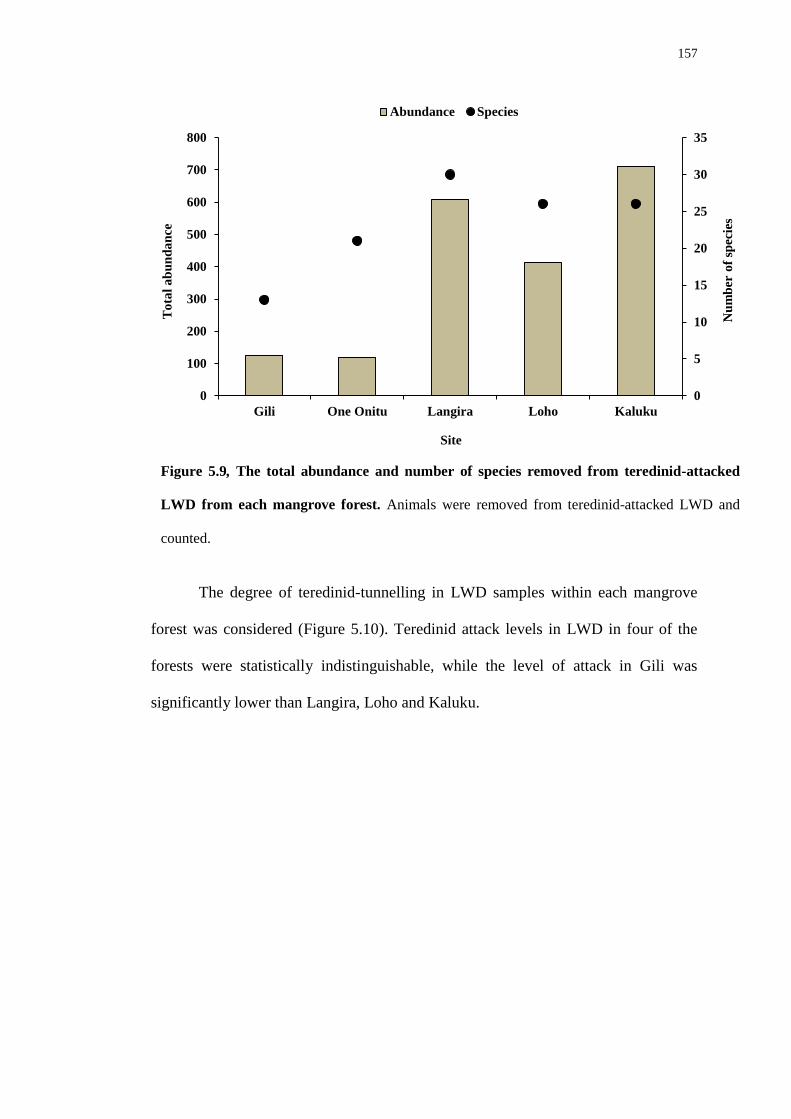
157
The degree of teredinid-tunnelling in LWD samples within each mangrove
forest was considered (Figure 5.10). Teredinid attack levels in LWD in four of the
forests were statistically indistinguishable, while the level of attack in Gili was
significantly lower than Langira, Loho and Kaluku.
0
5
10
15
20
25
30
35
0
100
200
300
400
500
600
700
800
Gili One Onitu Langira Loho Kaluku
Nu
mb
er o
f sp
ecie
s
To
tal
ab
un
da
nce
Site
Abundance Species
Figure 5.9, The total abundance and number of species removed from teredinid-attacked
LWD from each mangrove forest. Animals were removed from teredinid-attacked LWD and
counted.

158
5.4.3 Recruitment and succession of animals within drilled wooden blocks
mimicking teredinid tunnels
The removal of animals within Kaluku, Loho and the One Onitu forests from
drilled wooden blocks (Table 5.6) demonstrated that as time increases, the numbers
of species recorded from the drilled wooden blocks also increase. After 10, 20, 30,
40 and 50 days, 3, 6, 11, 8 and 11 species were recorded, respectively. The earliest
recruiting animals were the grapsoid crabs, attributed by their high abundance after
ten days. Suspension feeders (the bivalve Xenostrobus sp. and tunicates) only
appeared after fifty days.
No significant differences of the numbers of species and individuals were
found between the three sites (2-way ANOVA, F2, 128 = 1.89 and 2.53, p = 0.155 and
a
ab
b b
b
0
5
10
15
20
25
30
35
40
45
50
Gili One Onitu Langira Loho Kaluku
% S
A o
f te
red
inid
tu
nn
els
Site
Figure 5.10, The variation between five mangrove forests in degree of
teredinid tunnelling. The percentage surface area of teredinid tunnels within each
piece of LWD from each forest (mean ± SE1-way ANOVA, teredinid attack
intensity vs. site highlighted significant differences, F4,191 = 6.52, p = < 0.001).
Letters above the bars indicate a Tukey’s comparison test.

159
p = 0.084 respectively). However, significant differences were found with the
numbers of species and abundance of individuals recruiting to the drilled wooden
blocks mimicking teredinid tunnels over the fifty days (F4, 128 = 5.29, and 6.59, p = <
0.01 and p = < 0.001 respectively).
Day ten had the lowest recorded number of different species (Figure 5.11 a,
mean ± SE, n = 27). The greatest numbers of different species were recorded from
day forty. The abundance of animals recorded from the three forests also increased
with time (Figure 5.11 b), with the greatest abundance also found at day forty.
a a
ab
b
ab
0
0.2
0.4
0.6
0.8
1
1.2
1.4
1.6
1.8
Day 0 10 Day 20 Day 30 Day 40 Day 50
Nu
mb
er o
f sp
ecie
s
Time (d)
a a
b b
ab
0
0.5
1
1.5
2
2.5
3
Day 0 Day 10 Day 20 Day 30 Day 40 Day 50
Ab
un
da
nce
of
an
ima
ls
Time (d)
Figure 5.11, Numbers of species and individuals removed from drilled wood blocks
over an exposure of 50 days. a, The number of species (1-way ANOVA, number of
species vs. time: F4, 130 = 5.21, p = < 0.01), and b, abundance of individual animals
removed from drilled wooden blocks over ten day intervals in the Kaluku, Loho and One
Onitu forests (mean ± SE, n = 27, 1-way ANOVA, abundance vs. time; F4, 130 = 6.44, p =
< 0.001). Letters above the bars are the results from a Tukey’s test.
a
b
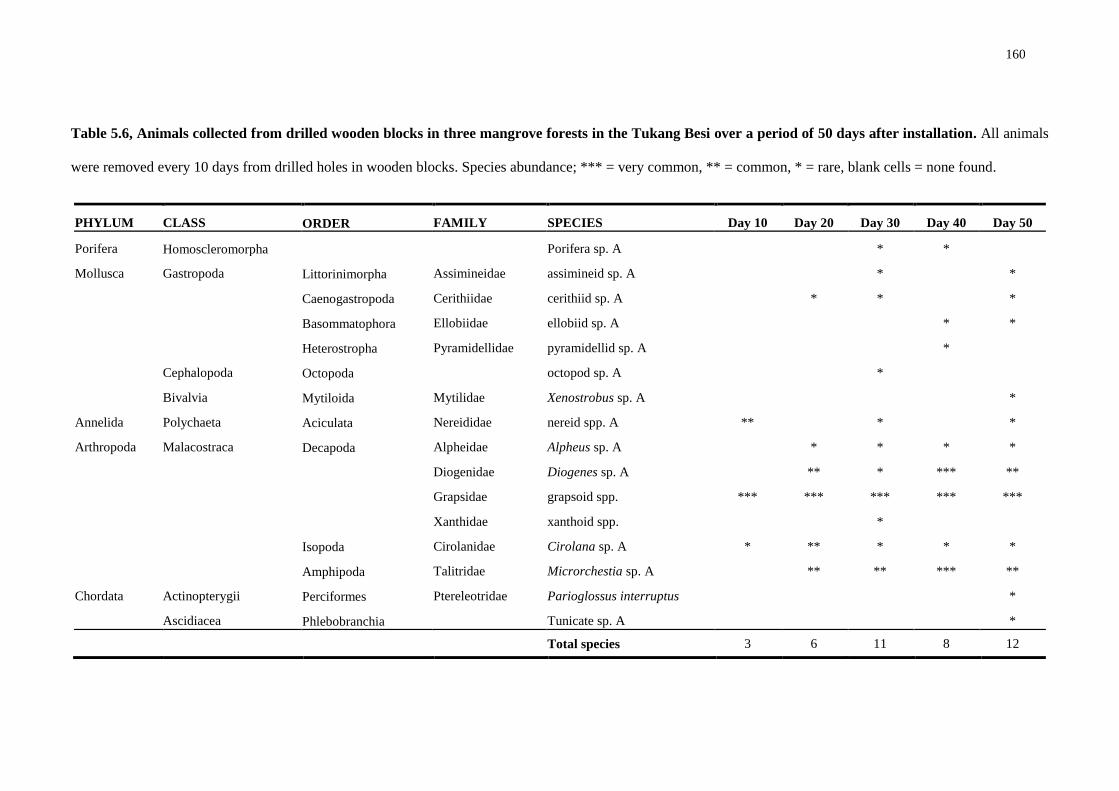
160
PHYLUM CLASS ORDER FAMILY SPECIES Day 10 Day 20 Day 30 Day 40 Day 50 Porifera Homoscleromorpha
Porifera sp. A
* *
Mollusca Gastropoda Littorinimorpha Assimineidae assimineid sp. A
*
*
Caenogastropoda Cerithiidae cerithiid sp. A
* *
*
Basommatophora Ellobiidae ellobiid sp. A
* *
Heterostropha Pyramidellidae pyramidellid sp. A
*
Cephalopoda Octopoda
octopod sp. A
*
Bivalvia Mytiloida Mytilidae Xenostrobus sp. A
* Annelida Polychaeta Aciculata Nereididae nereid spp. A **
*
*
Arthropoda Malacostraca Decapoda Alpheidae Alpheus sp. A
* * * *
Diogenidae Diogenes sp. A
** * *** **
Grapsidae grapsoid spp. *** *** *** *** ***
Xanthidae xanthoid spp.
*
Isopoda Cirolanidae Cirolana sp. A * ** * * *
Amphipoda Talitridae Microrchestia sp. A
** ** *** **
Chordata Actinopterygii Perciformes Ptereleotridae Parioglossus interruptus
* Ascidiacea Phlebobranchia Tunicate sp. A *
Total species 3 6 11 8 12
Table 5.6, Animals collected from drilled wooden blocks in three mangrove forests in the Tukang Besi over a period of 50 days after installation. All animals
were removed every 10 days from drilled holes in wooden blocks. Species abundance; *** = very common, ** = common, * = rare, blank cells = none found.

161
The biodiversity indices of the fauna removed from the drilled wooden blocks
demonstrates that the evenness increases rapidly and then drops at day 30, meaning
that the dominance of a particular species has increased (Figure 5.12). The
biodiversity increases, as time increases.
In the fifty day experiment, within each site the most dominant species
recruiting to the wooden blocks were grapsoid crabs, demonstrated by their early
recruitment in each site (Figure 5.13). The high dominance of the Grapsidae within
the sample units is further illustrated by their initial high peaks of the rank abundance
curves that rapidly taper off.
The least dominant species to occur from the sample units differed between
each of the three sites. The bivalve, Xenostrobus sp. were the least abundant and least
dominant species collected from the sample units in the Kaluku forest, found only at
day 50 of the experiment. The least abundant and least dominant species recorded
0
0.5
1
1.5
2
2.5
0.86
0.88
0.9
0.92
0.94
0.96
0.98
Day 10 Day 20 Day 30 Day 40 Day 50
Sh
an
no
n-W
ein
er d
iver
sity
Ev
enn
ess
Number of days
Evenness Shannon Weiner
Figure 5.12, Community indices of fauna removed from drilled holes in wooden
blocks over time. Evenness is a measure of the faunal community structure and the
Shannon-Weiner diversity index measures the level of biodiversity.
162
from the Loho forest were tunicates, also observed at day 50. The least dominant
species recorded from the One Onitu forest within the sample units were the
detritivore isopods, Microrchestia sp., also found at day 50.
The first and most dominant animals to recruit in to the drilled wooden blocks
were; Grapsidae>Taltridae>Diogenidae>Cirolanidae> Alpheidae (Malacostraca)
>Nereididae (Polychaeta) >Cerithiidae>Ellobiidae = Assimineidae (Gastropoda)
>Porifera >Tunicate (Ascidiacea) = Mytilidae (Bivalvia). The order by which the
animals are arranged are categorised by decreasing dominance. The most dominant
species recorded from the sample blocks belonged to the Malacostraca, a highly
motile class of animals such as grapsoid crabs, Microrchestia sp., mud hoppers and
cirolaniid isopods, fish lice. The least dominant species recorded were Xenostrobus
sp., sessile filter feeding bivalves. Of the motile fauna recorded, the least dominant
class of animals were the Gastropoda, such as the slow-moving ellobiids and
assimineids.
The number of different species and diversity of animals increased with
increasing diameter of tunnels (Table 5.7). Drilled tunnels 2.5 mm in diameter had
the lowest number of species and diversity of fauna. However, the greatest numbers
of species and diversity were recorded from tunnels measuring 10 mm diameter, with
12 species. Species commonly found in 2.5 mm and 5 mm diameters drilled holes
were cirolanids and Microrchestia sp. The most common species found in 10 mm
and 20 mm diameter drilled holes were grapsoids.
Figure 5.13, The frequency and rank abundance of species within drilled wooden
blocks within the mangrove forests. Numbers of animals are the total abundance
recorded from the drilled wooden blocks within each forest. Pages 159 – 161.

163
Kaluku
S
pec
ies
S
pec
ies
S
pec
ies
S
pec
ies
S
pec
ies
Ab
un
dan
ce
Ab
un
dan
ce
Ab
un
dan
ce
Ab
un
dan
ce
Ab
un
dan
ce
Number of individuals Species rank
10 days
50 days
40 days
30 days
20 days
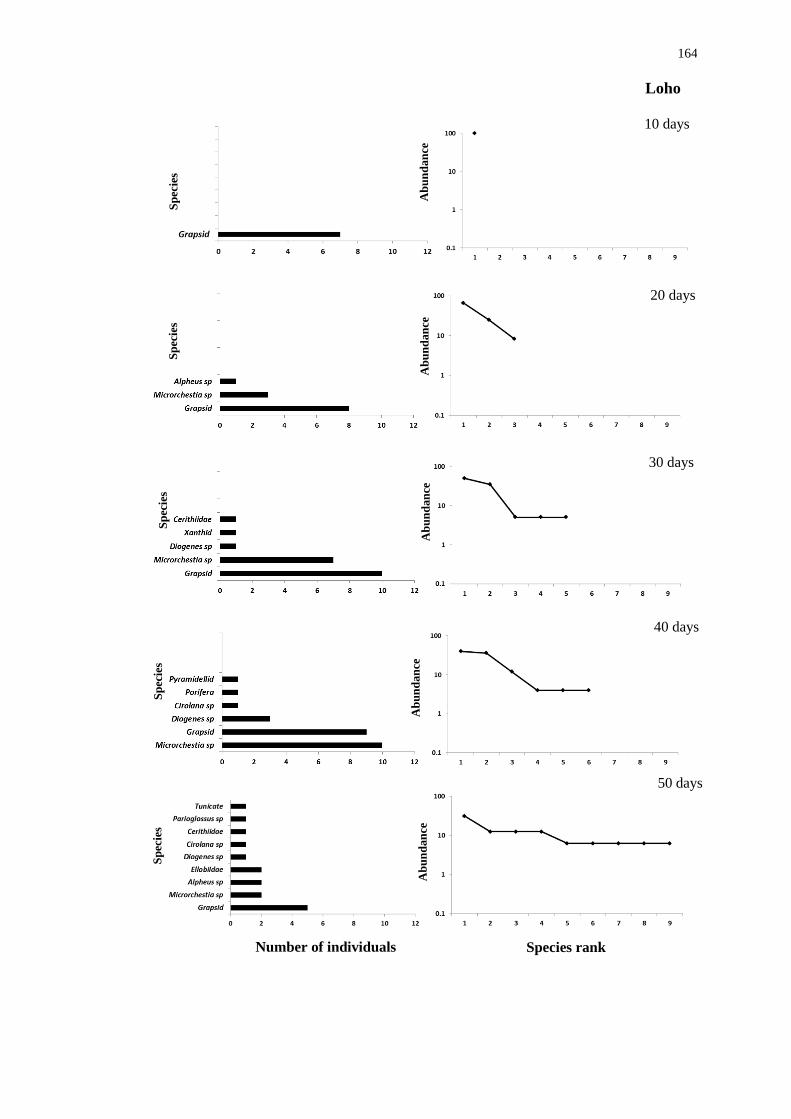
164
Loho
S
pec
ies
S
pec
ies
S
pec
ies
S
pec
ies
S
pec
ies
Ab
un
dan
ce
Ab
un
dan
ce
Ab
un
dan
ce
Ab
un
dan
ce
Ab
un
dan
ce
Number of individuals Species rank
10 days
50 days
40 days
30 days
20 days
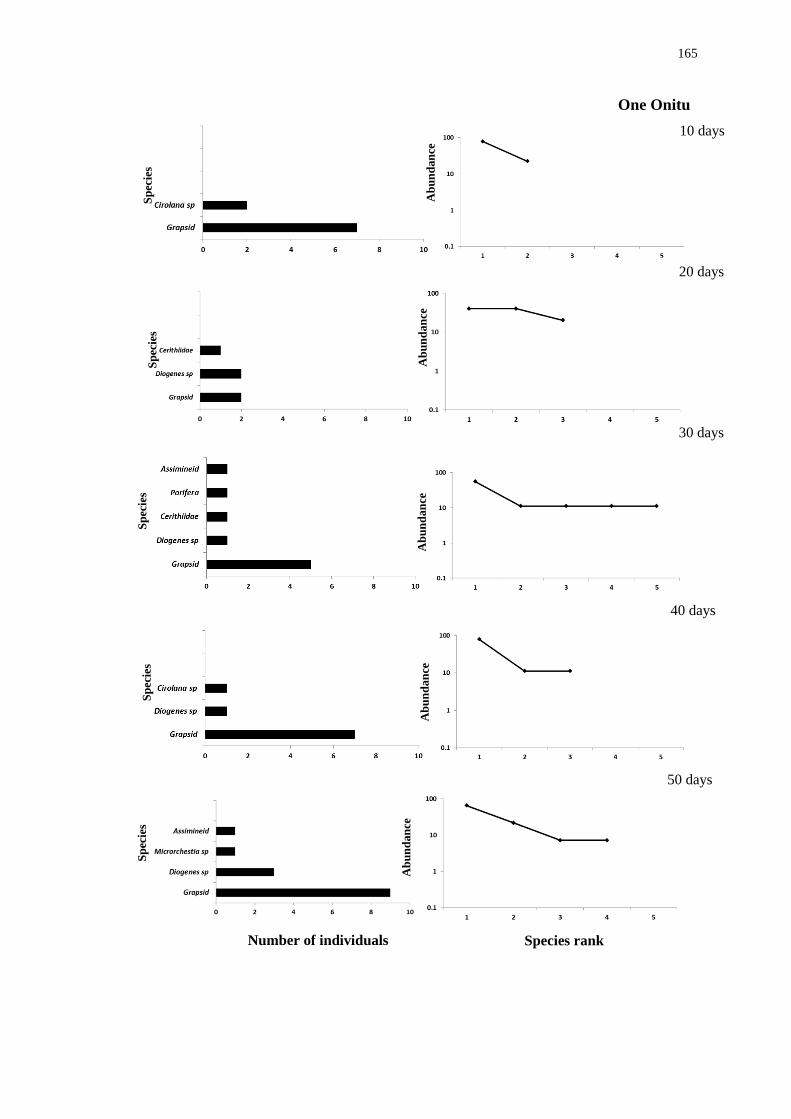
165
One Onitu
S
pec
ies
S
pec
ies
S
pec
ies
S
pec
ies
S
pec
ies
Ab
un
dan
ce
Ab
un
dan
ce
Ab
un
dan
ce
Ab
un
dan
ce
Ab
un
dan
ce
Number of individuals Species rank
10 days
50 days
40 days
30 days
20 days

166
Tunnel Diameter Number of Secies J' H'
2.5 1 0 0
5 5 0.9 1.5
10 12 0.9 2.2
20 10 0.9 2.0
5.5 Discussion
Within the mangrove forests of the Tukang Besi Archipelago very few
animals were found in the sediments, mainly consisting of Uca spp. Although
mangrove sediments are generally anoxic, fiddler crabs bioturbate the sediments
(Bouma et al., 2009) and even enhance the growth of the mangroves (Smith et al.,
2009). Burrowing by fiddler crabs increases the growth of Caribbean trees and
decreases pore-water salinity (Smith et al., 2009). Upon the mangrove roots, a large
proportion of the epifauna were sessile filter-feeders, sponges, mussels and oysters.
Mangrove roots with epifauna have been found to enhance fish abundance
(MacDonald et al., 2008). Furthermore, sponges not only take-up much of the
available hard surfaces of the roots, they also provide an important ecosystem service
by protecting the roots from herbivorous attack by isopods (Ellison and Farnsworth,
1990; Ellison and Farnsworth, 1992). The root epifauna within the Gili mangrove
forest was distinct from the root epifauna recorded from all other sites. Gili is
established further inland compared to the other mangrove forests and no sessile
filter-feeding animals were found as tidal conditions were unsuitable for sessile
filter-feeding invertebrates to colonise. Mangrove roots within Gili had a greater
number of motile fauna ranging from grapsoid crabs to potamid gastropods. The
Table 5.7, Biodiversity indices of fauna removed from different diameter drilled tunnels
after 50 days. S= number of species, J’ Pielou’s evenness, H’ = Shannon-Weiner diversity index.
167
LWD fauna-taxon and density was the richest compared with the other substrata.
LWD is more structurally complex compared to the sediments and roots. A greater
faunal richness is found with increasing habitat complexity (Taniguchi and Tokeshi,
2004).
The fauna collected from the teredinid-attacked LWD in the mangrove forests
were recruited during sporadic episodes of colonisation, but maintained by a habitat-
specific structure – teredinid tunnels inside the LWD. Non-deterministic
environmental interactions may also have an effect upon site-specific animal
communities (Poff and Allan, 1995). For example, hydrological processes shape
waterways, by creating random processes that characterise and structure the animal
assemblages (Poff and Allan, 1995; Grossman et al., 1998). Thus, the animals
recorded from each site from this study may have varied due to the intricate small
tidal channels and streams within the forests.
Species diversity is positively correlated with increasing habitat complexity
(Petren and Case, 1998; Saha et al., 2009), such as is created by teredinids. LWD
within aquatic ecosystems are important constituents in the structure and complexity
of water ways and LWD will probably become colonised by a wide variety of
animals (Hilderbrand et al., 1997; Storry et al., 2006). Thus, LWD represents a vital
resource providing a spatial subsidy within the ecosystem (Polis et al., 1997). Wood
enhances habitat complexity (Shirvell, 1990; Brooks et al., 2004), the deposition of
sediments and the retention of organic matter (Bilby and Likens, 1980; Smock et al.,
1989). Thus, removal of wood increases sediment discharge and leads to a reduction
of habitat structural complexities (Larson et al., 2001; Brooks et al., 2004). LWD is
therefore an important component within aquatic ecosystems (Shields et al., 2006).
Thus, a major threat to the mangrove ecosystem is wood harvesting (Valiela et al.,
168
2001; Sanchirico and Mumby, 2009), which could reduce ecosystem-level mangrove
faunal diversity due to the reduction of wood (Benke et al., 1985; Wright and
Flecker, 2004).
Indeed, the results from this study corroborate previous research that woody
detritus does increase animal diversity (Everett and Ruiz, 1993; Wright and Flecker,
2004). However, this study links the role of the Teredinidae with increasing
ecosystem-level biodiversity. Teredinids create niches as they consume LWD, by
creating tunnels for a wide range of animals when those tunnels become vacant. As
the number of teredinid tunnels increase within LWD, the abundance and diversity of
animals also increase. The increasing species diversity with increasing numbers of
teredinid tunnels may likely be due to a higher proportion of refuges from predation
(Willis et al., 2005). The refuge provided by woody detritus exploited by grass
shrimp significantly reduces their risk of predation (Everett and Ruiz, 1993).
Vulnerable animals have more options for avoiding and escaping potential predation
in habitats containing a greater number of niches. Structurally complex habitats may
reduce visual contact, encounter rates and aggressive behaviour between competitors
(Jones et al., 2001; Willis et al., 2005).
The results from this study magnify the contribution of woody detritus in
mangrove ecosystems to biodiversity maintenance. Mangrove forest biodiversity is
significantly enhanced by a large volume of teredinid attacked LWD. Non-tunnelled
LWD has a limited number of species and abundance of individuals due to the
reduced niche availability. A lack of teredinid tunnels within woody detritus will
create a reduced habitat complexity that may likely increase predator-prey
encounters. Differences of spatial structure will influence the frequency of
interactions such as predation or niche exploitation for animals (Warfe and Barmuta,

169
2004; Nurminen et al., 2007). This may also be the case for the spatial structure
teredinid tunnels provide in LWD, which explains the sharp change in animal
assemblages and diversity of animals in LWD without tunnels when compared to
LWD that have been attacked by the Teredinidae. These data clearly illustrate that
the faunal assemblages change and the diversity is increased when the surface area of
LWD increases, attributed by the activity of the Teredinidae.
When considering species diversity, the Shannon-Wiener Index is the most
frequently used diversity indices when measuring the fauna of benthic ecology (Reiss
and Kroucke, 2005). Shannon-Wiener combines species richness with the
community evenness. However, this index is dependent on the sample size
(Magurran, 2004), as larger samples are likely to contain additional resources and
therefore increased species. To effectively rule out the factor of sample size from this
study all LWD samples were calculated to the same volume. Teredinid tunnels
significantly enhance the animal diversity within detrital samples of the same
volume.
The Teredinidae also influence faunal diversity on whole ecosystem level in
the WMP. The Gili forest had the lowest level of teredinid attack on LWD, and the
lowest level of cryptic biodiversity of the sites investigated. Kaluku and Loho had
the highest degree of teredinid tunnelling in LWD. This study demonstrates that,
although LWD is essential for the biodiversity of both the specialist and more
generalist animals (Hilderbrand et al., 1997; Kappes et al., 2009); teredinid tunnels
will increase the internal structural complexity within LWD and the tunnels
significantly enhance ecosystem-level biodiversity within these particular Indonesian
mangrove forests.

170
Teredinid tunnels are home to many animals which cannot bore into the very
hard, undecayed wood. It is for this reason that the Teredinidae can be classed as
ecosystem engineers.
The colonisation and recruitment of fauna in to the drilled wooden blocks
revealed that as time increased the number of different species and number of
individuals colonising also increased. The initial low diversity of animals recorded
from day ten may be due to a lack of microorganism colonisation and thus a lack of
microbial biofilms (Gulis et al., 2004) or that it takes time for organisms to find the
wood. The formations of microbial biofilms have been linked with the colonisation
and presence of invertebrates (Spanhoff et al., 2001; Gulis et al., 2004). As biofilms
increase, invertebrates will colonise (Tank and Winterbourn, 1995; Tank and
Wintrbourn, 1996; Collier and Halliday, 2000).
Other factors may also determine the rate at which animals colonise new
habitats, by means of their mobility threshold (Arsuffi and Suberkropp, 1989),
expressed as the foraging range of an animal deemed safe within the limits of
potential predation risks and foraging for food. Animals are likely to be less selective
feeders when food items and other resources are widely dispersed relative to their
foraging range because the risk of predation increases as distance between food items
become greater (Schoener, 1971). Thus, less mobile animals will likely be the least
frequent to colonise new habitats. Animals with a greater mobility are found to be
more selective about the quality of food items than their less mobile congeners.
However, mobile species become less selective when their mobility threshold is
breached (Karieiva, 1982).
The invertebrate fauna examined by Arsuffi and Suberkropp (1989) ranked
fauna by their mobility capabilities, they demonstrated that the more mobile the
171
forager, the greater its ability to be more discriminate (Arsuffi and Suberkropp,
1989). The recruitment of fauna to drilled wooden blocks also revealed a mobility
gradient, with the most common recorded species from the drilled wooden blocks
being the most mobile to the least common fauna being sessile. Thus, more mobile
species will have a greater chance of occupying the available tunnel niche.
The level of complexity also had an influence upon the colonisation of the
drilled wooden blocks. This was demonstrated by the larger holes within the drilled
blocks, as they had the greatest number of species and diversity. It is likely that the
increased surface area of tunnels were less difficult to locate compared to smaller
tunnels.
The tunnelling of teredinids within the mangrove forests of the Tukang Besi
provides many niches within LWD. Thus teredinids increase microhabitat
heterogeneity due to their tunnelling action. It is the behaviour of the teredinids that
create a high complexity of tunnels that lead to a broad range of co-existing animals
within LWD. The activity of the Teredinidae within Indonesian mangrove forests
will increase the faunal diversity at whole ecosystem level and the fauna from the
teredinid-attacked LWD range in animals found in tropical terrestrial forests to sub-
tidal marine habitats in the mangroves from the WMP. Spatial heterogeneity is a
fundamental property of the natural world (Kostylev et al., 2005) and heterogeneity
within an ecosystem is a vital component for the interaction of co-existing animals
(Petren and Case, 1998; Gratwicke and Speight, 2005). By comparison structurally
simple habitats are not able to support the same levels of biodiversity when
compared with habitats consisting of high levels of complexity and rugosity (Levin,
1992).
172
Chapter 6
BIODIVERSITY MAINTENANCE BY VACANT TEREDINID
TUNNELS
6.1 Introduction
In mature mangrove forests there are considerable quantities of large woody
debris (LWD) in the intertidal zone which are tunnelled by teredinids (Cragg, 2007;
Filho et al., 2008). These animals are prolific excavators of wood and through their
tunnelling they influence the flux of carbon in mangrove forests by the amount of
wood they process (Robertson and Daniel, 1989a; Filho et al., 2008). Within the logs
the numbers of teredinids can be huge (Distel, 2003). Teredinids will create a
complex mass of tunnels (Figure 6.1 a). The tunnels are cylinders that range in size
and diameter which taper to a small opening at the wood surface. However, many
openings emerge when wood is heavily tunnelled and the surface is broken open.
Teredinid death may support biodiversity as teredinids leave niches for animals to
exploit the vacant tunnels (Cragg and Hendy, 2010).
In general, mangrove forests are known to support biodiversity as an
ecosystem service (Kathiresan and Bingham, 2001; Nagelkerken et al., 2008),
provided by the huge amount of wood. Prop-roots belonging to the mangrove trees
Rhizophora provide cover to many vulnerable and small fish, which are drawn to the
complexity of the roots to decrease their risk of predation (Verweij et al., 2006).
However, at low tide this refuge may not be available. Animals living within
teredinid-attacked LWD probably do so to avoid predators. The main purpose for
seeking refuge for animals in cryptic habitats is to avoid predation (Ruxton et al.,
173
2004). Many animals seek refuge in teredinid-attacked LWD in the Wakatobi
mangrove forests (Cragg and Hendy, 2010). Two examples of animals found in
vacant teredinid tunnels were of particular interest, a fish Parioglossus interruptus,
and a spider Desis martensi.
In a study of the animals living within mangrove wood on islands of the
Tukang Besi Archipelago, Indonesia, the interrupted dartfish, Parioglossus
interruptus (Suzuki and Senou, 1994) and the intertidal spider, Desis martensi (L.
Koch, 1872) were commonly found within teredinid tunnelled wood (Figure 6.1 b
and c, Cragg and Hendy, 2010). Interrupted dartfish are also known from Iriomote
Island, Japan (Suzuki and Senou, 1994) and New Guinea (Rennis and Hoese, 1985).
Dartfish (Ptereleotridae) are bathypelagic gobioids inhabiting warm, temperate to
tropical tidal estuaries and mangrove forests throughout the Western Pacific and
Indian Oceans (McDowall, 2001). These fish typically occupy structurally complex
habitats such as seagrass beds or mangrove roots that provide protection from
predators as well as access to the zooplankton upon which they feed (Keith et al.,
2004). Desis martensi (Desidae) are known from Singapore. These spiders are
thought to forage for food at night and seek refuge in rock crevices and shells to
avoid tidal immersion (The Singapore Red Data Book, 2008). Desids have a wide
distribution spanning from the Galapagos to the South China Sea (Roth, 1967).
Both of these species are interesting due to their unusual nature; an aquatic
species, that frequently experiences episodes of emersion and an intertidal species
that frequently experiences episodes of immersion. Fish follow the ebbing tide out
(Sheaves, 2005) and wetland spiders migrate to higher elevations (Adis and Junk,
2002) to avoid emersion and immersion; however P. interruptus and D. martensi

174
remain within the Tukang Besi mangrove habitats throughout the complete tidal
cycle.
The mangrove forests belonging to the islands of the Tukang Besi
Archipelago experience large diel changes in water temperature, oxygen levels and
salinity (Taylor et al., 2005; Cragg and Hendy, 2010). Such rapid changes of salinity
and temperature are common with intertidal mangrove forests (Tomascik et al.,
1997). These environmental fluctuations may be buffered within the teredinid tunnel
niche. Dartfish and spiders may seek refuge within tunnelled wood for protection
from high temperatures, while avoiding desiccation as well as predation. This study
examined whether the niche provided by teredinid-tunnelled wood utilised by
dartfish and desids is critical for their distribution. This study tested the hypotheses
that dartfish and spiders 1. reduce their risk of predation by taking refuge in
teredinid-tunnelled wood at low tide, and 2. are protected by the tunnels from
extreme temperatures. This study describes a previously unreported cryptic, wood-
dwelling behaviour for dartfish and desids. In addition, this study also reveals the
biodiversity maintenance provided by the cryptic habitat of vacant teredinid tunnels
and assesses the significance of this behaviour in the autecology of the fish and
spiders.
Samples of LWD from the Langira forest were collected to determine the
abundance and distribution of fish and spiders during low tides. Numbers of dartfish
not in wood were quantified at high tide and foraging desids were searched for
during day and night time hours. Size comparisons of dartfish collected from within
wood and dartfish caught at hightide, not in wood were determined. Measurements
of dartfish and desid diameters and tunnels were compared to establish if they have a
close geometric fit within the tunnels.
175
Laboratory experiments investigating fish and spiders were conducted to
provide insights of their behaviour and ecology. Individual spiders were observed in
plastic tubs to determine if they emerge from tunnels during day time and night time
hours. Spiders were coaxed in to glass tubes to observe their leg arrangement when
inside teredinid tunnels. When inside the glass tubes, the spiders were immersed in
seawater to demonstrate the water-tight properties of their webs. Dartfish were
observed in aquaria that contain the calcareous linings of teredinid tunnels to
determine their behaviour within those tunnels. In addition, fewer tunnels were
placed into each aquarium than dartfish to determine if the fish bunch within the
tunnels. A range of different diameter tunnels were used in each aquarium to
establish if dartfish behaviour changes with increasing area of cryptic habitat. Using
data loggers, temperature was recorded within woody detritus. Ambient air
temperatures and water temperatures adjacent to each detrital sample containing
temperature loggers were also recorded. Temperature cooling in wood was examined
using a thermometer and a wind tunnel. To compare fluctuations of the temperature
data, inside and outside LWD, non-invasive temperature tolerance experiments were
used for P. interruptus. Critical Thermal Maxima (CTM) of P. interruptus
determined if their physiological temperature tolerance is suited to the changes of
abiotic temperatures within the mangrove environment.
6.2 Materials and methods
6.2.1 Field studies
Samples of LWD, defined as wood pieces more than 20 mm in diameter,
were collected from all LWD encountered along eight transects in the Rhizophora
stylosa-dominated mangrove forest, Langira, Kaledupa Island. The transects
extended perpendicularly from the strandline extending out to the seaward fringe for

176
a mean distance of 380 m. A total of 196 pieces of LWD were collected from the
transects. These were split lengthwise and photographed to estimate the proportion of
wood removed by teredinid tunnelling, then broken open to remove all fauna
occupying teredinid tunnels. The same transects were used to estimate the abundance
and distribution of Desis martensi not in LWD during day-time (8am – 3pm) and
night-time (10pm – 3am) low tides. Dartfish (n = 188) and desids (n = 58) living
within the LWD were counted and measured (± 0.1 mm). Measurements of dartfish
in wood were compared with lengths of dartfish (n = 271) not in wood and caught at
high tide. The internal diameters of 1455 randomly chosen teredinid tunnels in LWD
from Langira were measured using callipers. Measurements of dartfish and desid
diameters (for fish, standard diameter recorded at the operculum base and for spiders,
the diameter of the abdomen was recorded) and tunnels were also compared.
Measurements of length and diameters were made from images of the sampled fish
and spiders using the digital analysis package ImageTool Version 3.00 (The
University of Texas Health Science Centre at San Antonio). Within this text D.
martensi body length refers to the cephalothorax + abdomen.
Numbers of free-swimming dartfish in tidal mangrove creeks and in the water
between Rhizophora prop roots fringing open water were counted by snorkel visual
census at high tide during day time and at night using a dive torch. During the day,
counts were made in belt transects measuring 25 x 4 metres placed at random along
creeks in the low- (n = 9), mid- (n = 9) and high intertidal (n = 9) areas of the forest,
and at night, transects (n = 4) were established in the same areas and tidal zones
respectively. Visual census was not extended beyond the fringing areas as densely
packed roots prevented access.
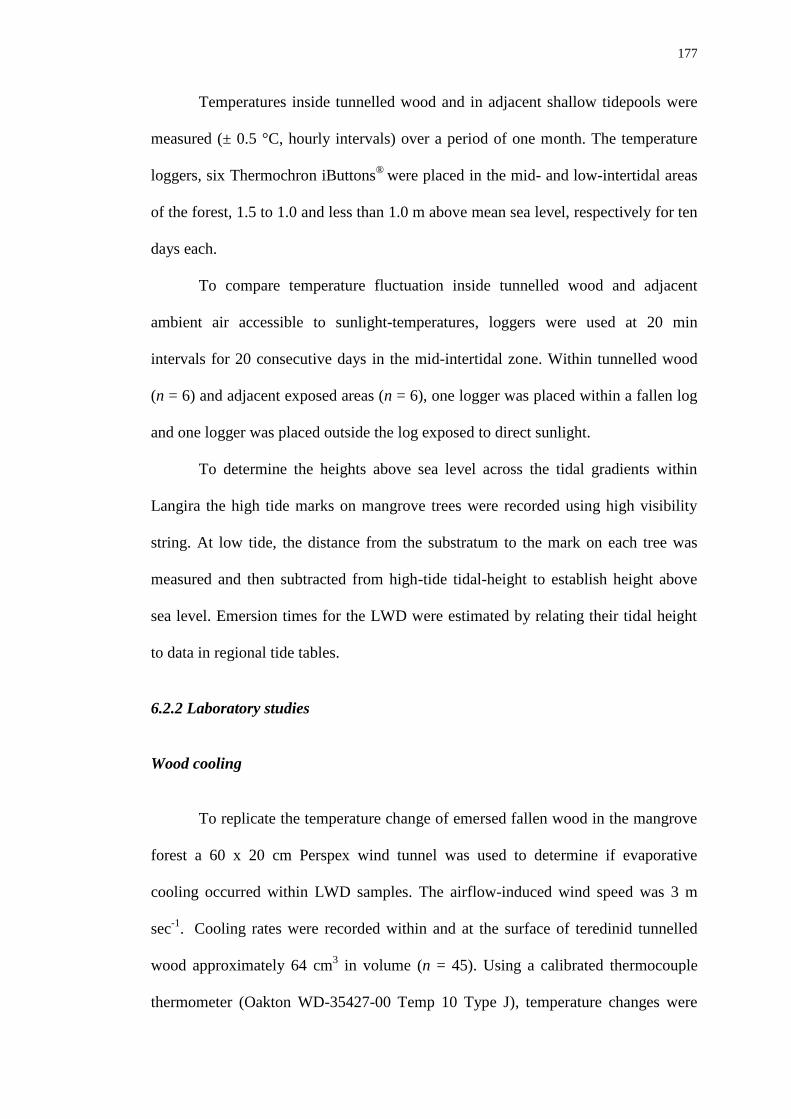
177
Temperatures inside tunnelled wood and in adjacent shallow tidepools were
measured (± 0.5 °C, hourly intervals) over a period of one month. The temperature
loggers, six Thermochron iButtons®
were placed in the mid- and low-intertidal areas
of the forest, 1.5 to 1.0 and less than 1.0 m above mean sea level, respectively for ten
days each.
To compare temperature fluctuation inside tunnelled wood and adjacent
ambient air accessible to sunlight-temperatures, loggers were used at 20 min
intervals for 20 consecutive days in the mid-intertidal zone. Within tunnelled wood
(n = 6) and adjacent exposed areas (n = 6), one logger was placed within a fallen log
and one logger was placed outside the log exposed to direct sunlight.
To determine the heights above sea level across the tidal gradients within
Langira the high tide marks on mangrove trees were recorded using high visibility
string. At low tide, the distance from the substratum to the mark on each tree was
measured and then subtracted from high-tide tidal-height to establish height above
sea level. Emersion times for the LWD were estimated by relating their tidal height
to data in regional tide tables.
6.2.2 Laboratory studies
Wood cooling
To replicate the temperature change of emersed fallen wood in the mangrove
forest a 60 x 20 cm Perspex wind tunnel was used to determine if evaporative
cooling occurred within LWD samples. The airflow-induced wind speed was 3 m
sec-1
. Cooling rates were recorded within and at the surface of teredinid tunnelled
wood approximately 64 cm3 in volume (n = 45). Using a calibrated thermocouple
thermometer (Oakton WD-35427-00 Temp 10 Type J), temperature changes were

178
recorded over 30 minutes within the wind tunnel. The thermometer had two
temperature probes; one probe was placed upon the wood surface and the other 3 cm
below the surface of the LWD sample. Within the wind tunnel, each wood sample
was placed on a mesh-box to ensure that all sides received equal air-flow.
Critical thermal maxima of dartfish
The upper thermal tolerance of dartfish was determined using groups of
twenty dartfish some with, and some without access to teredinid tunnels in three
aquaria. The dartfish were acclimated for 7-10 days at 27 or 35 °C. The low and high
acclimation temperatures chosen represent the approximate average temperature of
open water and representative high temperatures in tidepools around Kaledupa,
respectively (Taylor et al., 2005; Eme and Bennett, 2009a). The aquaria were placed
within a 95-L bath. The water in each aquarium was aerated by a linear air pump.
Approximately 30% of the water was changed daily. Heat in the bath was provided
by a 300 W glass AZOO® heater (AZOO, Taikong Corp, Taiwan), and water in the
bath was circulated using two AZOO® pumps. Dartfish were fed Sera
® Vegetarian
Diet flake food (Montgomery, PA, USA) once per day but not fed 24 h prior to the
critical thermal maximum (CTM) trials. Fish acclimated to 35 C were brought to
this constant acclimation temperature by increasing the water temperature 1.9 ± 0.9
°C d-1
for 4 d, and then held at this constant temperature for 7d. Fish acclimated to 27
C were held at this constant acclimation temperature for 7d.
Following 7 d of acclimation, each fish was exposed to a CTM trial which
consisted of a temperature increase of 0.3 °C min-1
until loss of equilibrium (LOE)
was observed. For each CTM trial, randomly selected fish were placed into 250-ml
Nalgene® beakers filled with clean seawater at appropriate constant acclimation

179
temperature. Beakers were suspended within a 20-L, insulated, recirculating water
bath and provided with moderate aeration to prevent thermal stratification. A
mercury thermometer (certified Fisherbrand® NIST) was used to monitor the
temperature in each beaker. Water temperature in the CTM bath was raised using
600-800W of aquarium heater wattage until final LOE was reached. LOE was
defined as the inability to maintain dorso-ventral orientation for at least one minute
(Beitinger et al., 2000). For trials with teredinid tunnels, fish were placed into CTM
beakers with a piece of calcareous lining from a teredinid tunnel measuring 3-5 cm in
length and kept at acclimation temperature at least 6 hours prior to the trial.
Following experiments, fish were released at their site of capture.
Dartfish behaviour observations
Ten dartfish were placed into each of four aquaria. Each aquarium contained
nine teredinid tunnels. Observations of dartfish locations were recorded hourly each
day during day-time (8am-3pm) and night-time (9pm-2am). After four days, the
dartfish in each aquarium were replaced three times with a new group of ten fish, and
given 24 hours to acclimate. All fish were released at their site of capture following
experiments.
Desid behaviour
Spiders collected from decaying logs were placed in plastic tubs with a small
piece of teredinid-attacked wood. To determine if spiders remained within wood day-
time and night-time observations were made. Observations for each spider were
recorded for 3 - 5 days. The total number of observation days for the desids was 75
days.
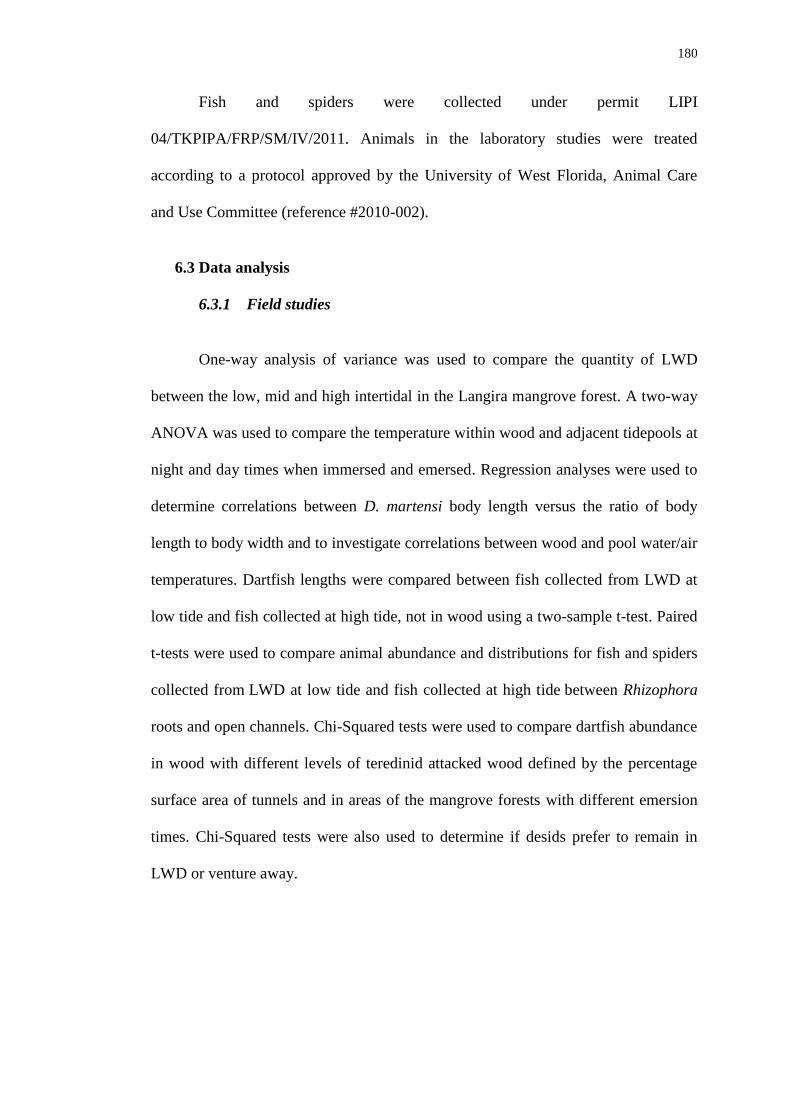
180
Fish and spiders were collected under permit LIPI
04/TKPIPA/FRP/SM/IV/2011. Animals in the laboratory studies were treated
according to a protocol approved by the University of West Florida, Animal Care
and Use Committee (reference #2010-002).
6.3 Data analysis
6.3.1 Field studies
One-way analysis of variance was used to compare the quantity of LWD
between the low, mid and high intertidal in the Langira mangrove forest. A two-way
ANOVA was used to compare the temperature within wood and adjacent tidepools at
night and day times when immersed and emersed. Regression analyses were used to
determine correlations between D. martensi body length versus the ratio of body
length to body width and to investigate correlations between wood and pool water/air
temperatures. Dartfish lengths were compared between fish collected from LWD at
low tide and fish collected at high tide, not in wood using a two-sample t-test. Paired
t-tests were used to compare animal abundance and distributions for fish and spiders
collected from LWD at low tide and fish collected at high tide between Rhizophora
roots and open channels. Chi-Squared tests were used to compare dartfish abundance
in wood with different levels of teredinid attacked wood defined by the percentage
surface area of tunnels and in areas of the mangrove forests with different emersion
times. Chi-Squared tests were also used to determine if desids prefer to remain in
LWD or venture away.
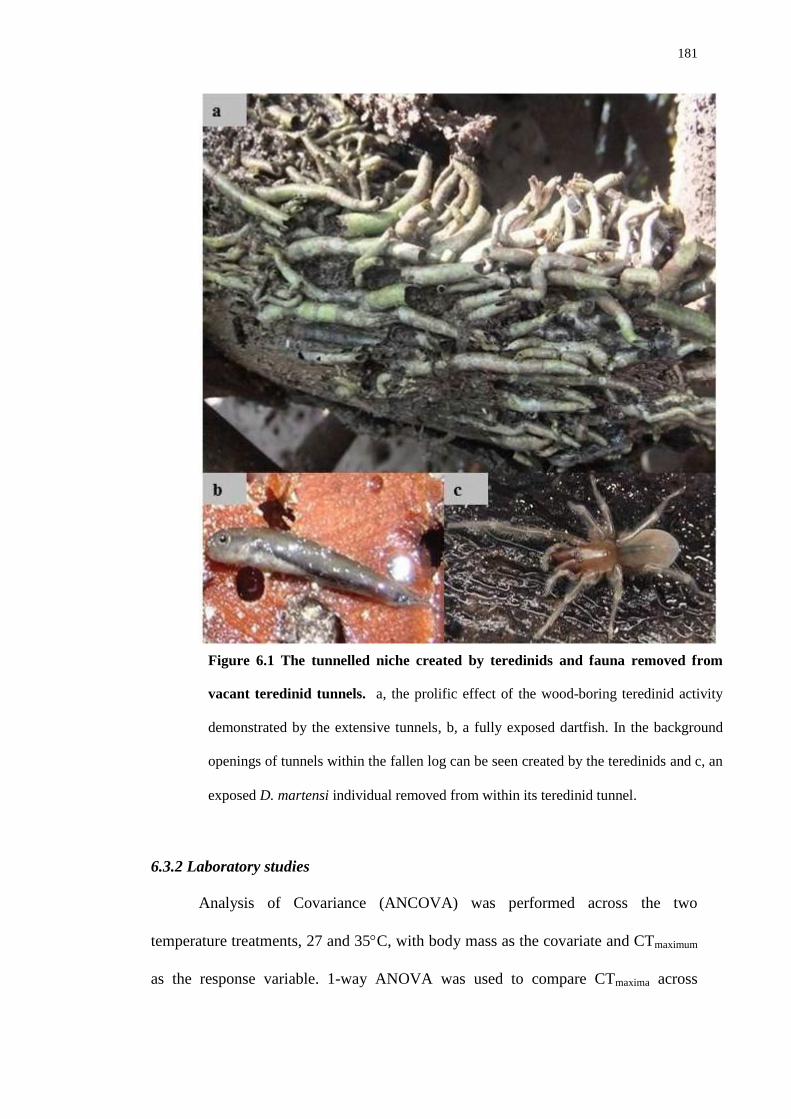
181
6.3.2 Laboratory studies
Analysis of Covariance (ANCOVA) was performed across the two
temperature treatments, 27 and 35C, with body mass as the covariate and CTmaximum
as the response variable. 1-way ANOVA was used to compare CTmaxima across
Figure 6.1 The tunnelled niche created by teredinids and fauna removed from
vacant teredinid tunnels. a, the prolific effect of the wood-boring teredinid activity
demonstrated by the extensive tunnels, b, a fully exposed dartfish. In the background
openings of tunnels within the fallen log can be seen created by the teredinids and c, an
exposed D. martensi individual removed from within its teredinid tunnel.

182
acclimation treatments and between tunnel treatments. Comparisons of day and night
time numbers of dartfish within tunnels were tested using Chi-Square tests. Tukey’s
Studentised Range (TSR) post-hoc test separated values into statistically distinct
subsets for all ANOVAs. Count data were square root transformed and all
measurements were log transformed. All statistical significance were determined
based on α = 0.05. Statistical analyses were performed using MINITAB (MINITAB
Inc, version 13.20).
6.4 Results
6.4.1 Temperature analysis
Mean temperatures measured within emersed wood were lower than in tide
pools adjacent to the wood (Figure 6.2 a-b: 2-way ANOVA, with wood/pool,
emersion/immersion and night/day as factors, F1,1272 = 61.68, p = < 0.001). This
difference was more marked in the mid intertidal zone (Figure 6.2 a). The
temperature differential between tunnels in wood and adjacent tide pools was most
marked when tide pool temperatures peaked (10am – 4 pm), which occurred at low
tide during day-time in the mid intertidal. Temperature lowering within wood was
most marked when tide pool temperatures peaked (Figure 6.2 c and d), which
occurred at low tide, during day-time (10am – 4pm) in the mid-intertidal when
compared with night time hours and immersed wood (Tukey’s pairwise
comparisons).

183
b
Temperature lowering in wood was most marked when temperatures of sun-
exposed wood substratum was emersed during low tide at day-times (10am – 4pm) in
the mid-intertidal (Figure 6.3, R-Sq (adj) = 0.69, F1, 1182 = 2646.25, p = < 0.001).
a
c
ab
cd d
e
b
d
23
24
25
26
27
28
29
30
Peak
day
Night Peak
day
Night
Emersed Immersed
Tem
per
atu
re (
°C) pool wood
a
c
a
b b
d
a
c
23
24
25
26
27
28
29
30
Peak day Night Peak day Night
Emersed Immersed
Tem
per
atu
re (
°C)
pool wood
y = -0.33x + 7.35
R² = 0.16
-7
-5
-3
-1
1
25 30 35 40
Dif
feren
ce (
°C)
wit
hin
wo
od
Temperature (°C) of tide pool
y = -0.42x + 11.32
R² = 0.52
-7
-5
-3
-1
1
25 30 35 40
Dif
feren
ce (
°C)
wit
hin
wo
od
Temperature (°C) of tide pool
Figure 6.2, Analysis of variance and regressions of temperatures recorded within
the Langira mangrove. a Temperature differences recorded at night (6 pm – 6 am)
and day (10 am – 4 pm) times during high and low tides within wood and tide pools
from the mid-intertidal zone (mean ± SE), and, (b) the low-intertidal zone. Letters
above the bars = Tukey’s pairwise comparisons, (c) the temperature differential within
the mid and (d) low zones between wood and tide pools.
Mid-intertidal Low-intertidal a
c d

184
When tunnelled wood was subject to airflow, temperatures were slightly
reduced (approximately 1 degree C) at the surface, but by over two degrees C in the
tunnels (Figure 6.4). The rate of cooling was 6.7 times greater inside teredinid
tunnelled wood compared to the surface. The mean rate of cooling on the wood
surface was 0.03 ± 0.01 °C min-1
(mean ± SE, n = 45) and the rate of cooling within
the centre was 0.2 ± 0.01 °C min-1
.
y = -0.66x + 16.8
R² = 0.69
-14
-12
-10
-8
-6
-4
-2
0
2
4
6
15 20 25 30 35 40 45
Dif
feren
ce (
°C)
wit
hin
wo
od
Temperature (°C) of ambient air
Figure 6.3, Variation in temperature differential between air and
wood recorded from Langira. Variation across the range of air
temperatures measured at Langira in the temperature differential between
interior of tunnelled wood and air outside the wood.
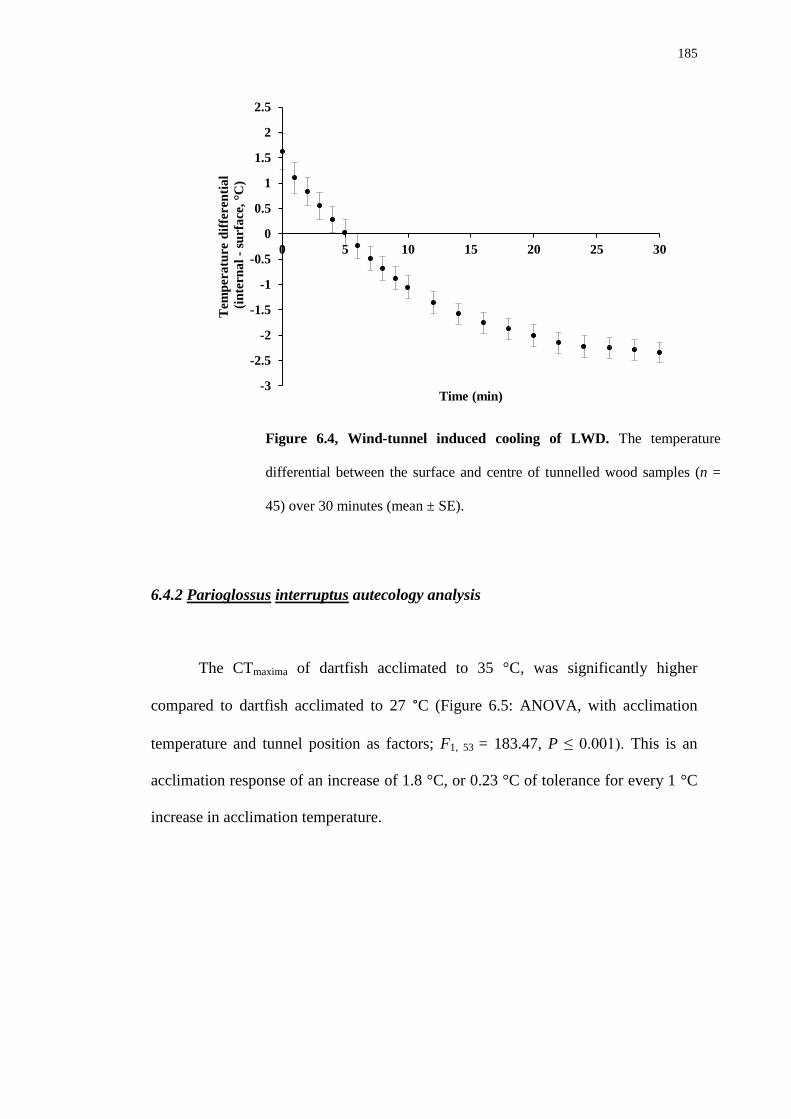
185
6.4.2 Parioglossus interruptus autecology analysis
The CTmaxima of dartfish acclimated to 35 °C, was significantly higher
compared to dartfish acclimated to 27 °C (Figure 6.5: ANOVA, with acclimation
temperature and tunnel position as factors; F1, 53 = 183.47, P ≤ 0.001). This is an
acclimation response of an increase of 1.8 °C, or 0.23 °C of tolerance for every 1 °C
increase in acclimation temperature.
-3
-2.5
-2
-1.5
-1
-0.5
0
0.5
1
1.5
2
2.5
0 5 10 15 20 25 30
Tem
per
atu
re d
iffe
ren
tia
l
(in
tern
al
- su
rfa
ce,
°C)
Time (min)
Figure 6.4, Wind-tunnel induced cooling of LWD. The temperature
differential between the surface and centre of tunnelled wood samples (n =
45) over 30 minutes (mean ± SE).

186
Very few of the teredinid tunnels had a smaller diameter than the dartfish,
and most dartfish had diameters that overlapped the diameter range of the most
numerous tunnel sizes (Figure 6.6 a). The lengths of dartfish collected at high tide,
not in LWD tended to be longer than that of dartfish collected from within wood at
low tide, 2.6 ± 0.02 cm (mean ± SE, n = 271) compared with 2.1 ± 0.03 cm (n = 188)
respectively (Figure 6.6 b: Two-Sample t-test; dartfish at high tide vs. dartfish in
wood, t = 14.48, P ≤ 0.001).
40
40.5
41
41.5
42
42.5
43C
riti
cal
Th
erm
al
Ma
xim
um
(°C
)
No tunnels Tunnels
35°C
27°C
Figure 6.5, Critical thermal maxima of dartfish. Fish acclimated to 27 °C
and 35 °C had no difference of temperature tolerance with or without out
tunnels. Significant differences of temperature tolerance between acclimated
fish to 27 °C and 35 °C were found (mean ± SE).
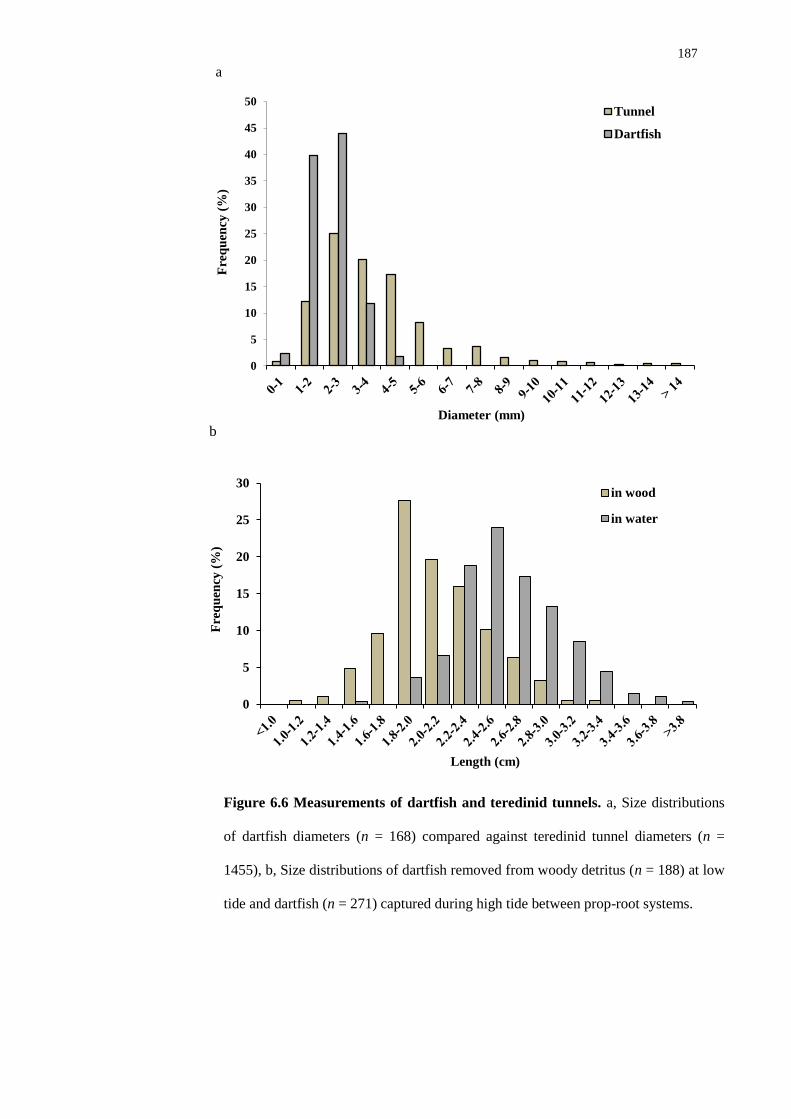
187
0
5
10
15
20
25
30
35
40
45
50
Fre
qu
ency
(%
)
Diameter (mm)
Tunnel
Dartfish
0
5
10
15
20
25
30
Fre
qu
ency
(%
)
Length (cm)
in wood
in water
a
b
Figure 6.6 Measurements of dartfish and teredinid tunnels. a, Size distributions
of dartfish diameters (n = 168) compared against teredinid tunnel diameters (n =
1455), b, Size distributions of dartfish removed from woody detritus (n = 188) at low
tide and dartfish (n = 271) captured during high tide between prop-root systems.

188
Analysis of the LWD samples revealed that wood with a higher percentage
surface area of teredinid tunnelling had a greater frequency of dartfish occupying the
vacant tunnels (Figure 6.7: Chi-Squared P ≤ 0.001).
The degree of tidal emersion also affected the degree of LWD occupancy of
dartfish (Figure 6.8). With increasing emersion time (h), the amount of wood
occupied by dartfish was reduced. The greatest proportion of wood occupied by
dartfish was collected in areas of the forest with less than five hours of emersion
(Chi-Squared P ≤ 0.001).
97
34
36
17
12
0
5
10
15
20
25
30
35
40
45
< 20 20 - 35 35 - 50 50 - 65 > 65
% O
ccu
pie
d b
y d
art
fish
% of section tunnelled
Figure 6.7, Samples of teredinid-attacked LWD categorised by the level of teredinid
activity imposed upon each woody detrital sample. The percentage of total woody items
(n = 196) occupied by dartfish. Numbers above the bars indicate the number of detrital
samples analysed.
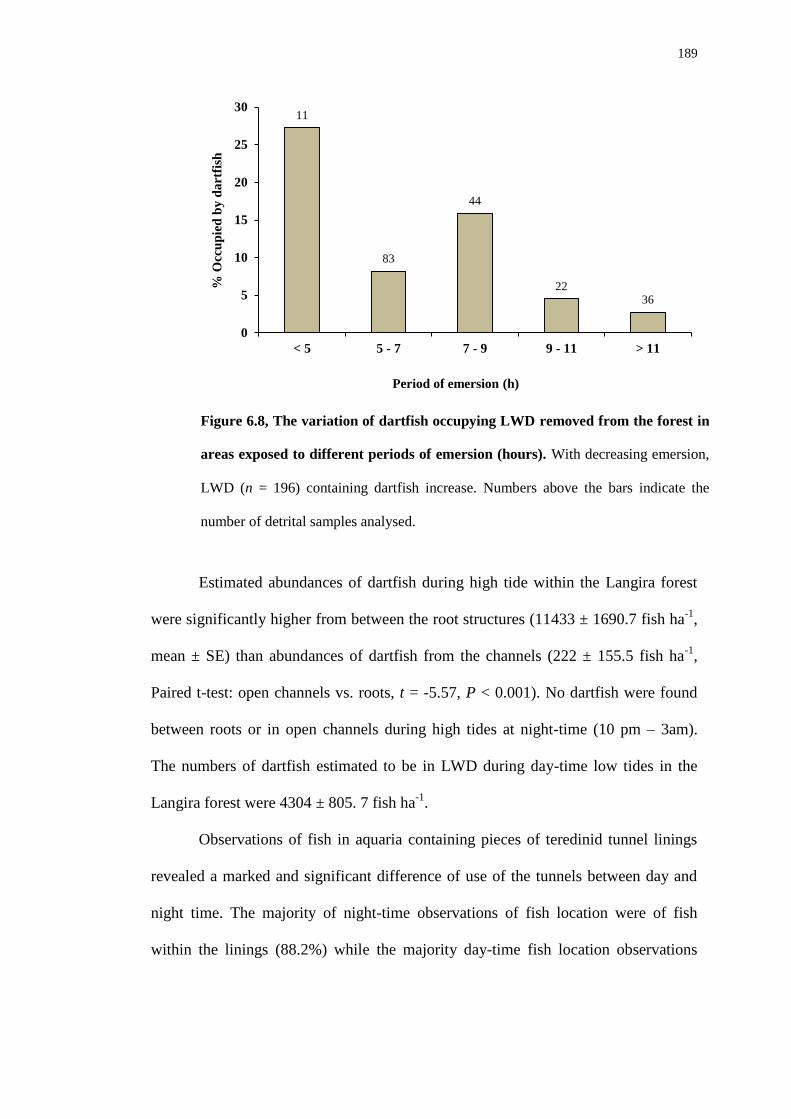
189
Estimated abundances of dartfish during high tide within the Langira forest
were significantly higher from between the root structures (11433 ± 1690.7 fish ha-1
,
mean ± SE) than abundances of dartfish from the channels (222 ± 155.5 fish ha-1
,
Paired t-test: open channels vs. roots, t = -5.57, P < 0.001). No dartfish were found
between roots or in open channels during high tides at night-time (10 pm – 3am).
The numbers of dartfish estimated to be in LWD during day-time low tides in the
Langira forest were 4304 ± 805. 7 fish ha-1
.
Observations of fish in aquaria containing pieces of teredinid tunnel linings
revealed a marked and significant difference of use of the tunnels between day and
night time. The majority of night-time observations of fish location were of fish
within the linings (88.2%) while the majority day-time fish location observations
11
83
44
22 36
0
5
10
15
20
25
30
< 5 5 - 7 7 - 9 9 - 11 > 11
% O
ccu
pie
d b
y d
art
fish
Period of emersion (h)
Figure 6.8, The variation of dartfish occupying LWD removed from the forest in
areas exposed to different periods of emersion (hours). With decreasing emersion,
LWD (n = 196) containing dartfish increase. Numbers above the bars indicate the
number of detrital samples analysed.
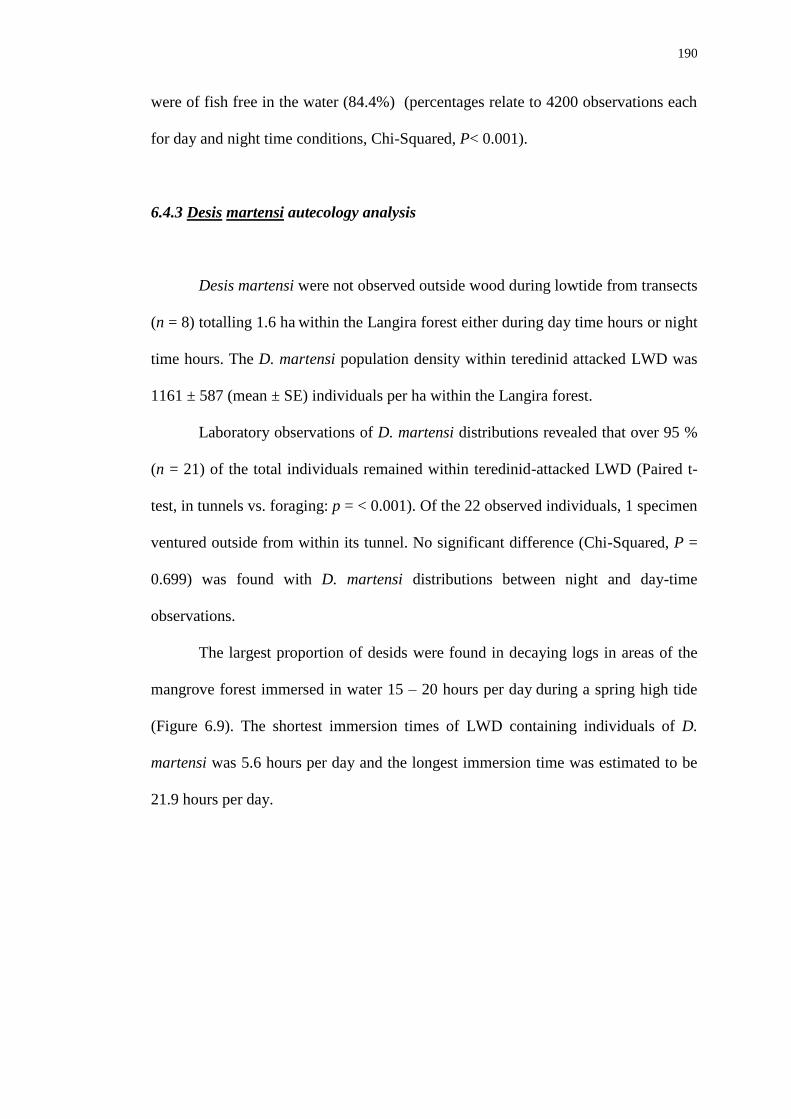
190
were of fish free in the water (84.4%) (percentages relate to 4200 observations each
for day and night time conditions, Chi-Squared, P< 0.001).
6.4.3 Desis martensi autecology analysis
Desis martensi were not observed outside wood during lowtide from transects
(n = 8) totalling 1.6 ha within the Langira forest either during day time hours or night
time hours. The D. martensi population density within teredinid attacked LWD was
1161 ± 587 (mean ± SE) individuals per ha within the Langira forest.
Laboratory observations of D. martensi distributions revealed that over 95 %
(n = 21) of the total individuals remained within teredinid-attacked LWD (Paired t-
test, in tunnels vs. foraging: p = < 0.001). Of the 22 observed individuals, 1 specimen
ventured outside from within its tunnel. No significant difference (Chi-Squared, P =
0.699) was found with D. martensi distributions between night and day-time
observations.
The largest proportion of desids were found in decaying logs in areas of the
mangrove forest immersed in water 15 – 20 hours per day during a spring high tide
(Figure 6.9). The shortest immersion times of LWD containing individuals of D.
martensi was 5.6 hours per day and the longest immersion time was estimated to be
21.9 hours per day.
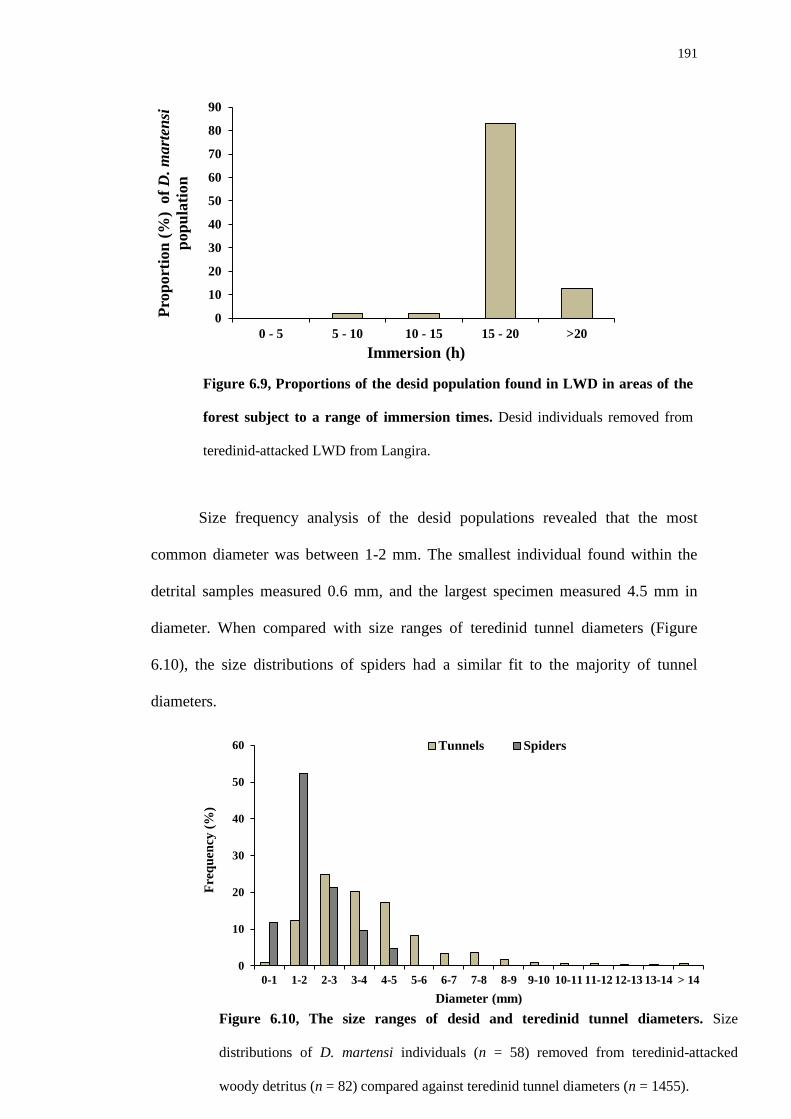
191
Size frequency analysis of the desid populations revealed that the most
common diameter was between 1-2 mm. The smallest individual found within the
detrital samples measured 0.6 mm, and the largest specimen measured 4.5 mm in
diameter. When compared with size ranges of teredinid tunnel diameters (Figure
6.10), the size distributions of spiders had a similar fit to the majority of tunnel
diameters.
0
10
20
30
40
50
60
70
80
90
0 - 5 5 - 10 10 - 15 15 - 20 >20
Pro
port
ion
(%
) o
f D
. m
art
ensi
pop
ula
tion
Immersion (h)
0
10
20
30
40
50
60
0-1 1-2 2-3 3-4 4-5 5-6 6-7 7-8 8-9 9-10 10-11 11-12 12-13 13-14 > 14
Fre
qu
ency
(%
)
Diameter (mm)
Tunnels Spiders
Figure 6.9, Proportions of the desid population found in LWD in areas of the
forest subject to a range of immersion times. Desid individuals removed from
teredinid-attacked LWD from Langira.
Figure 6.10, The size ranges of desid and teredinid tunnel diameters. Size
distributions of D. martensi individuals (n = 58) removed from teredinid-attacked
woody detritus (n = 82) compared against teredinid tunnel diameters (n = 1455).
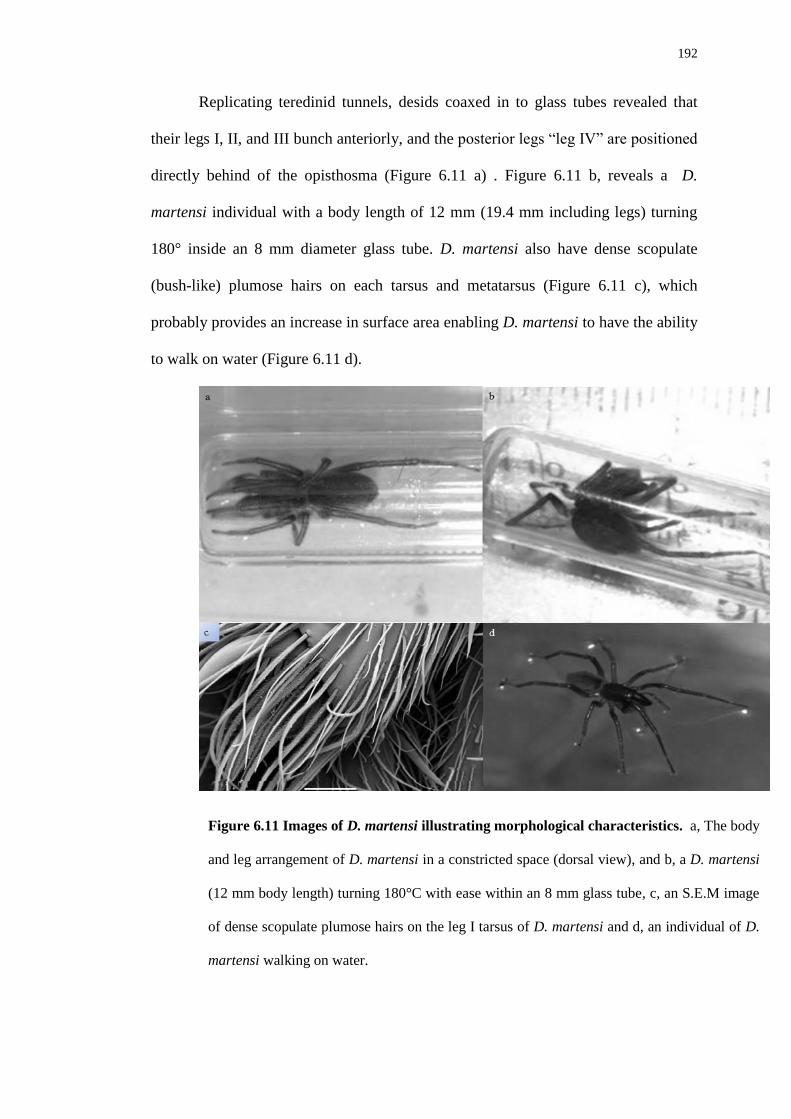
192
Replicating teredinid tunnels, desids coaxed in to glass tubes revealed that
their legs I, II, and III bunch anteriorly, and the posterior legs “leg IV” are positioned
directly behind of the opisthosma (Figure 6.11 a) . Figure 6.11 b, reveals a D.
martensi individual with a body length of 12 mm (19.4 mm including legs) turning
180° inside an 8 mm diameter glass tube. D. martensi also have dense scopulate
(bush-like) plumose hairs on each tarsus and metatarsus (Figure 6.11 c), which
probably provides an increase in surface area enabling D. martensi to have the ability
to walk on water (Figure 6.11 d).
Figure 6.11 Images of D. martensi illustrating morphological characteristics. a, The body
and leg arrangement of D. martensi in a constricted space (dorsal view), and b, a D. martensi
(12 mm body length) turning 180°C with ease within an 8 mm glass tube, c, an S.E.M image
of dense scopulate plumose hairs on the leg I tarsus of D. martensi and d, an individual of D.
martensi walking on water.

193
Regression analysis of body length vs. body/width revealed a significant
correlation (F1, 40 = 26.05, p = < 0.001, R-Sq = 0.39). As D. martensi develop from
juveniles in to adults they become more elongate (Figure 6.12).
6.5 Discussion
The effects of teredinid activity may extend after death as the solid wood
becomes riddled with tunnels that can be exploited by other organisms. The use of
teredinid tunnels by dartfish is an unusual and virtually unknown behaviour among
fishes. Juvenile morays, Gymnothorax richardsoni have also been reported to
occasionally occupy tunnelled wood, as do a range of marine invertebrates and
terrestrial arthropods (Cragg and Hendy, 2010). In tropical Atlantic mangrove
ecosystems, the mangrove rivulus, Kryptolebias marmoratus exploits galleries
created by terrestrial insects in decaying mangrove logs (Taylor et al., 2008); a
y = 1.27x + 2.47
R² = 0.39
0
10
20
30
40
50
60
0 2 4 6 8 10 12 14
Ra
tio
(b
od
y l
eng
th/w
idth
)
Body length (mm)
Figure 6.12, The change in body proportions of D. martensi
individuals. The regression demonstrates the ratio of body length and
width against the body length.
194
similar niche, but distinctly higher in the intertidal than the teredinid-tunnelled wood
examined in this study. Indeed, the mangrove rivulus are amphibious even to the
point of foraging on land and may also emerge under damp leaf litter, in crab tunnels
and beneath plastic debris (Davis et al., 1995; Taylor et al., 2008). Dartfish,
however, appear specifically bound to the teredinid-tunnel niche as no other refuge
besides decaying wood was available. In addition, dartfish occupy the tunnel niche
during low tides, which result in those exposed logs and the adjacent tidepools to
experience rapid fluctuations in temperature (minutes to hours). Indeed, mangrove
forests frequently have large-diel fluctuations in temperature (Taylor et al., 2005).
However, the Tukang Besi islands have a diverse array of hyperthermic fishes
common to the Indo-Pacific region, and mangrove forests in this area contain many
fishes with unusual behaviour (Bennett, 2010).
Dartfish show similar thermal tolerance values to many shallow water fishes
in the Tukang Besi islands, particularly tidepool-resident goby species (Eme and
Bennett, 2009a), as they exhibit approximately twice the acclimation response of
tidepool-resident gobies from around Kaledupa Island. Dartfish also have critical
thermal maxima that are higher than those of reef fish species (Eme and Bennett,
2009b; Bennett, 2010). Thus, the dartfish’s thermal biology is that of a robust,
shallow-water fish that has an upper thermal tolerance sufficient to deal with
temperatures above 40 C. However, dartfish may obtain environmental buffering by
avoiding the warmest tidepool temperatures by taking refuge within the cooler vacant
teredinid tunnels. Dartfish would probably have a lower resting metabolic rate inside
the vacant tunnels. Avoiding the most extreme fluctuations in tidepool temperatures
allows for a relatively stable thermal environment. As temperatures become lower

195
within the tunnels the fish may also benefit from evaporative cooling, making
desiccation within LWD unlikely for dartfish.
Considerable numbers of vacant teredinid tunnels were observed within LWD
from the shore to the seaward edge of the mangrove forest. Dartfish probably use
teredinid tunnels to avoid moving into open water during the ebbing tide, therefore
the tunnels may provide a novel predation refuge. Within teredinid-attacked wood,
dartfish occlude the majority of teredinid tunnels; maintaining a close geometric fit
within this cryptic habitat may reduce predation risks as larger predators are not able
to access dartfish within the narrow tunnels. Dartfish will bunch within teredinid
tunnels during the night time. Similar behaviour described as log packing was
reported with K. marmoratus in decaying logs attacked by termites and coleopteran
larvae (Taylor et al., 2008). Dartfish bunching in groups within teredinid tunnels may
reduce their risks of predation, as higher numbers of fish will plug the teredinid
tunnel and may prevent access by predators.
Length measurements of dartfish reveal that the populations removed from
decaying logs were smaller than those caught from between the roots at high tide.
Thus, the more vulnerable smaller individuals in a population are more likely to seek
refuge in wood, and the larger fish make less use of these cryptic refugia.
Furthermore, adult dartfish range up to 3 cm in length (Allen et al., 2003), suggesting
that the smaller dartfish found in the LWD represents an important refuge function
for the vulnerable smaller stages of this species in mangrove forests. It is likely that
the dartfish found in LWD belong to the same population of fish that is found
between the roots and open channels during high tide. Thus, estimates of fish density
in LWD at day-time low tides indicate that almost 40% of dartfish from the Langira
mangrove seek teredinid-attacked LWD. Observations of dartfish swimming at high-

196
tide during night-time revealed zero encounters during extensive surveys of the
mangrove forest. This corroborates our laboratory experiments, which showed that
88% of dartfish were observed within the refuge of teredinid tunnels during night-
time.
During high tide, large numbers of dartfish were frequently seen swimming
in schools between and around the complex Rhizophora root-systems. Other authors
report that small and juvenile fish reduce their risk of predation by hiding among the
mangrove roots (Laegdsgaard and Johnson, 2001; Verweij et al., 2006; MacDonald
et al., 2009). Although dartfish use teredinid tunnels to avoid being carried in to
permanent mangrove creeks or being stranded on mud flats, it appears that they do
follow the ebbing tide out to the outermost seaward edge of the forest. Fallen wood
exposed at low tide at the seaward edge of the forest would have the least exposure
to high temperature fluctuations meaning that the cryptic dartfish have less
probability of desiccation due to lower emersion times, which may explain the higher
numbers of dartfish found in wood at the seaward fringe.
Non-aquatic, intertidal species such as Desis martensi are challenged by
immersion. Many species of spiders live in aquatic ecosystems such as saltmarshes
(Morse, 1997; Petillon et al., 2008; Petillon et al., 2009), and flood plains
(Rothenbucher and Schaefer, 2006) but spider ecology has not been studied in
mangrove ecosystems.
Commonly within the LWD, nests created by D. martensi were found
containing juveniles along with adults in groups from 2 – 5. No foraging desids were
found away from teredinid tunnels at low tide in the forest at day or night times.
However, D. martensi have been reported to forage on the shore at low-tide during
night-times in intertidal regions found in Singapore (The Singapore Red Book,
197
2008). Remaining in tunnels will provide relative safety for the spiders, and the wood
may provide an important energy subsidy; due to high levels of fauna (see chapter 5;
Cragg and Hendy, 2010), which acts as a prey aggregation device.
When in the tunnels, D. martensi produces a water-proof web that protects
them from being immersed. Within wetland habitats spiders either migrate to the
shore or move to higher ground in order to avoid immersion. For example, Pirata
hygrophilus (Lycosidae) will climb trees to avoid immersion (Adis and Junk, 2002).
However, for Desis remaining in teredinid-attacked wood may also reduce the risk of
being predated. Being exposed and visible to predators will have obvious risks,
especially in less complex environments (Marczak and Richardson, 2007). Desis also
prefers to remain in LWD found in the low intertidal, where there is a greater level of
the tunnel niche due to increased teredinid activity in the low-intertidal. Furthermore,
due to high availability of the many tunnels in the low intertidal, there may be a high
level of prey items for the spiders.
D. martensi may also use the LWD to avoid extreme temperatures, therefore
reducing their risk of desiccation. During low tide, day time ambient air temperatures
within the mangrove forest peaked at more than 40°C. During the same time the
internal temperature of LWD was recorded below 30°C, a difference of more than
12°C. Spiders are more abundant and active in cooler, shaded areas within their
environment (Riechert and Tracy, 1975). Extreme temperature may be a limiting
factor for the foraging capabilities of spiders. Spiders prefer cooler areas with less
prey items than areas of increased temperatures with higher densities of prey
(Riechert and Tracy, 1975). Thus, the cooler temperatures within wood coupled with
the high level of prey items provide an avoidance strategy from high temperatures
combined with an enhanced exposure to food items. The benefits of avoiding adverse

198
temperatures and having plenty of prey items at your doorstep highlight teredinid-
attacked LWD as an ideal habit for D. martensi.
Very few spiders are obligately aquatic. Those that are show a range of
interesting adaptations, Argyroneta aquatica, is an air-breathing spider that spends
the majority of its life submerged in freshwater habitats (Seymour and Hetz, 2011).
A. aquatica builds a dome-shaped web between aquatic plants. The spider fills the
dome-web with air carried from the surface by use of a plastron, hydrofuge hairs that
trap air bubbles. The air-filled dome can take up dissolved O2 from the surrounding
water acting as a physical gill; pO2 diffuses from the water and through the web in to
the spiders nest (Seymour and Hetz, 2011). Terrestrial spiders also have this ability
to build underwater webs that have similar properties to an anatomical gill (Rovner,
1987). Dysdera crocata and Ariadna bicolor are both terrestrial spiders that have the
ability to survive underwater for up to ten days when in their nests (Rovner, 1987).
Nonetheless, for the intertidal specialist Desis marina, the physical gill effect did not
increase their survival time when underwater as these desid species are found living
within their web nests in the holdfast cavities of kelp - which have adequate air
supplies (McQueen and McLay, 1983 cited in Rovner, 1987). When out of water, D.
marina has been reported to venture out of their kelp holdfasts and forage for food
(Rovner, 1987), though this present study suggests this may not be necessary. Unlike
D. marina, D. martensi may likely be obligate to decaying wood as they appear not
to venture out of the teredinid tunnels when their woody habitat is emerged.
More than 40% of desids within teredinid-attacked LWD were between 1 - 2
mm. The maximum sizes of desids ranged up to 4 – 5 mm diameter. This suggests
that Desis martensi has a life history strategy centred on strong parental care, with
lots of energy invested in to its young. D. marina individuals from a rocky shore in

199
New Zealand laid eggs from September – January, and hatching is complete by May
(McLay and Hayward, 1987). The first two instars after hatching remain in the nest
until July – August. It was also noted that female D. marina laid 3 to 4 eggs (McLay
and Howard, 1987). Thus, the common frequency and occurrence of 2 – 5 individual
D. martensi, usually 1 adult with 2 – 4 juveniles within teredinid tunnels from
Langira suggest that D. martensi have a similar reproductive strategy to D. marina.
D. martensi are physically and morphologically adapted to their intertidal
habitat within teredinid tunnels. These data demonstrate that as D. martensi mature
from juveniles to adults they become increasingly longer than wide; producing
elongate body morphology. Other authors state that the body, cephalothorax and
opisthosoma of D. martensi is longer than it is wide (Roth, 1967). The elongate body
structure is the ideal shape for living within a vacant teredinid tunnel. Moreover,
similar to dartfish, desids also occlude the most frequent size ranges of teredinid
tunnels. When the spiders enter teredinid tunnels they adopt a constrained leg
arrangement making a narrow stance within the tunnel. When in the tunnels the
anterior limbs, legs I, II and III are forward positioned. In addition, the anterior limbs
have tarsal trichobothria, sensory hairs (Roth, 1967), that may aid for prey capture
when the spider is in its tunnel. D. martensi presumably waits in ambush within its
tunnel for small crustaceans such as cirolanids and/or taltrids to come in to contact
with the long sensory hairs on the anterior legs which may in turn trigger D. martensi
to strike.
The spiders have other diagnostic features and characteristics that make life
within teredinid-attacked LWD easier. D. martensi have a malleable body. Spider
flexibility is not uncommon (personal communication, Dr Hannah Wood). The
flexible turning ability within narrow diameter tunnels is advantageous for D.
200
martensi as it enables them to turn with ease within narrow tunnels when hunting
prey items. Suitable tunnel location is also essential. The complex inter-twining
teredinid tunnels within fragmented decaying wood when emersed can be water-
filled and/or drained, closed off by either sediment or from the calcareous cap the
teredinids produce at the distal end of their tunnels or from other predators. Thus, the
ability to be hyper-flexible and remaining mobile is a huge advantage in order to
avoid potential risks within teredinid tunnels, such as immersion or being predated
upon.
D. martensi have large tracheae confined to the abdomen (Roth, 1967).
Desids are aquatic and amphibious, and their tracheae are important adaptation to
being able to spend many hours immersed (Selden, 2001). More than eighty percent
of D. martensi populations within the Langira mangrove forest are immersed for
more than eighteen hours per day during spring high tides. It has been hypothesised
that the tracheae are more efficient than other respiratory organs, such as book lungs
in preventing water loss from spiders (Levi, 1967); this is vital for D. martensi as the
saline environment may increase osmotic stress (Gross, 1957; Pierce, 1982;
Gimenez, 2003). D. martensi also possess heavily scopulate plumose hairs, which are
dense bush-like hairs at the tips of their legs. The scopulate plumose hairs may
enhance D. martensi’s ability to walk on water; an advantageous ability for an
intertidal animal within an aquatic environment.
This study is the first to report a likely obligatory exploitation by a fish and a
spider of an intertidal niche provided by teredinid tunnels and unequivocally reveals
the fundamental role of the Teredinidae in niche creation. Vacant teredinid tunnels
provide a novel ecosystem service within LWD in seaward mangrove forests. This
study also demonstrates that seeking environmental buffering by remaining cryptic
201
within teredinid tunnels is an important issue for these species. Lastly, the
exploitation of LWD by dartfish and desids emphasises the detrimental impact of
forest harvesting. Mangrove forests that are logged will likely impact the abundance
and distribution of dartfish and desids in Indonesian mangrove forests, as well as
numerous other cryptic, wood dwelling organisms.

202
Chapter 7
GENERAL DISCUSSION
The mangrove forests in the WMP are connected to sea grass beds and coral
reefs. Such connectivity of important ecosystems has rarely been studied in
Indonesia (Tomascik et al., 1997). These ecosystems are important for their nursery
function (Xavier et al., 2012), and flow of energy between the habitats (Granek et al.,
2009). Indeed, damage to these ecosystems, whether natural or anthropogenic, will
disrupt the flow of nutrients across the ecosystems and reduce the biodiversity. The
most biologically diverse substratum in the WMP mangrove forests is large woody
detritus (LWD), in particular LWD that had been attacked by teredinids. These items
of LWD provide a spatial subsidy that permits fish to remain in the mangrove forests
at low tide and non-aquatic animals to remain at high tide. Remaining within the
mangrove forests limits migrations, therefore remaining within the forests may
reduce predation risks (Wang et al., 2009), particularly for vulnerable species and
juveniles. LWD within the forests provides alternative refuges for the mangrove
fauna if the complexity of the mangroves has declined (Sheaves, 2005).
If the rate of wood harvesting within Indonesian mangrove forests continues
then this may have a direct threat to the abundance and distribution of fauna that
depend upon the vacant teredinid tunnels within LWD. Fallen wood is an important
resource within the mangrove forests, and the tunnelling of teredinids enhances the
habitat complexity. Chapters 3, 5 and 6 reveal that teredinids are ecosystem
engineers. Chapter five demonstrated that increases of habitat complexity driven by
teredinids can positively affect ecosystem-level species-richness. To increase species
richness at ecosystem level the engineering species must create conditions not

203
present elsewhere in the landscape and other animals must be able to live only in the
engineer-created patches (Wright et al., 2002). This means that for an animal to be
considered as an ecosystem engineer, species other than that of the engineering
species must be obligate to the habitat created by the ecosystem engineer; such
animals are discussed in Chapter Six.
Chapter six demonstrated that vacant teredinid tunnels within LWD are used
by many animals within mangrove forests in the WMP, including juveniles and
vulnerable species. Thus, LWD enhances biodiversity maintenance and predation
refuges in mangrove ecosystems, as a large proportion of individuals exploit this
resource. The role of mangrove forests as a predation refuge may be a consequence
of the relationship between habitat complexity and predation success (MacDonald et
al., 2008). The success of juvenile and vulnerable animals in mangrove habitats are
due to the increased niche availability, which reduces predator-prey interactions
(Warfe and Barmuta, 2004; Saha et al., 2009).
Within natural undisturbed ecosystems, teredinids may be considered as
ecosystem engineers. Ecosystem engineering accounts for the interaction between an
organism and its environment. The engineering species activity results by directly or
indirectly transforming the availability of resources to other species (Jones et al.,
1994). Ecosystem engineers modify their environment by creating changes in biotic
or abiotic materials, which will ultimately result in the modification, maintenance
and creation of new habitats or niches leading to increased habitat heterogeneity
(Jones et al., 1994; Wright et al., 2002; Berkenbusch and Rowden, 2003). Although,
in areas of marine environments that necessitate the use of man-made wooden
substrata teredinids are considered as pests because they incur much damage to
wharfs and pilings (Laverty, 2002). However, the findings reported in parts of
204
chapters three, five and six suggest that teredinids are ecosystem engineers within the
seaward edge of mangrove forests of the Tukang Besi as they break down large
volumes of LWD, increase ecosystem-level biodiversity of these otherwise species-
poor habitats (Duke et al., 2007) and create a predation refuge for vulnerable and
juvenile animals. Thus, the abundance and distribution of the fauna dependent upon
LWD may be affected by harvesting of the mangrove wood (Donato et al., 2011).
The biodegradation of LWD by herbivory and decay within the mangrove
ecosystems serves as the basis for an elaborate food-web. A consortium of organisms
break down the fallen trees in the WMP mangrove forests. Such organisms range
from coleopterans, termites, basidiomycetes and teredinids. These organisms process
much of the fallen trees that enter the detrital food-chain, recycling the organic
carbon back into the ecosystem. LWD will increase habitat complexity (O’Connor,
1991), nutrient enrichment from mineralisation (Gulis et al., 2004), and enhance
deposition and stabilisation of fine sediments (Diez et al., 2000; Haschenburger and
Rice, 2004). Within the mid- to low- intertidal areas of mangrove ecosystems,
teredinids have a key role in the mechanical-breakdown of LWD (Robertson and
Daniel, 1989a; Kohlmeyer et al., 1995) as they enhance the recycling of nutrients
after they have processed the fallen wood (Robertson and Daniel, 1989a).
Recent research has highlighted the fact that mangrove forests are under
threat, with an estimated 1 – 2 % each year disappearing globally as a result of wood-
harvesting practices (Duke et al., 2007; Donato et al., 2011; Lewis et al., 2011),
mainly due to production of prawn farms (Martinez-Alier, 2001). Of the 146,500 km2
of global mangrove forests, 34,931 km2
or 23.8% are located in Indonesia (Spalding
et al., 1997). It is estimated that more than 31% of Indonesian mangrove forests have
disappeared in the last 30 years (Wilkie and Fortuna, 2003). Thus, more than 1 % of
205
Indonesian mangrove forests are being cleared every year with no sign indicating
that it is reducing. Indeed, mangroves cleared for prawn farms incur much damage to
the natural environment with declines of invertebrates and fish due to the loss of
habitat from uprooted mangrove trees (Martinez-Alier, 2001). The loss of ecosystem
services as a result from forest harvesting will be reduced predation avoidance for
juvenile fish and invertebrates and reduced deposition of fine sediments as
mangroves stabilise sediments. Thus, forest harvesting will decrease species richness
and increase water turbidity of adjacent ecosystems. Of the mangrove forests
surveyed from this study the greatest impact was found in the Laulua forest (Figure
7.1 a). This forest was heavily cleared with vast areas of bare substrata, and
mangrove forest dead-zones with no fauna observed compared to undisturbed areas.
Within the WMP mangrove forests, local demand of mangrove-derived materials for
artisanal fishing and construction is great (Cullen, 2010). The harvesting of
mangrove wood may lead to a socio-economic issue. Livelihoods are dependent
upon fish catches, meaning that the maintenance and up-keep of fish catching
devices is necessary (Figure 7.1 b). Thus, the WMP mangroves are under constant
harvesting pressure (Figure 7.1 c and d). This harvesting will lead to an ecological
negative feed-back loop, as the harvesting of mangroves will impact the biodiversity,
therefore human livelihoods will decline (Martinez-Alier, 2001).
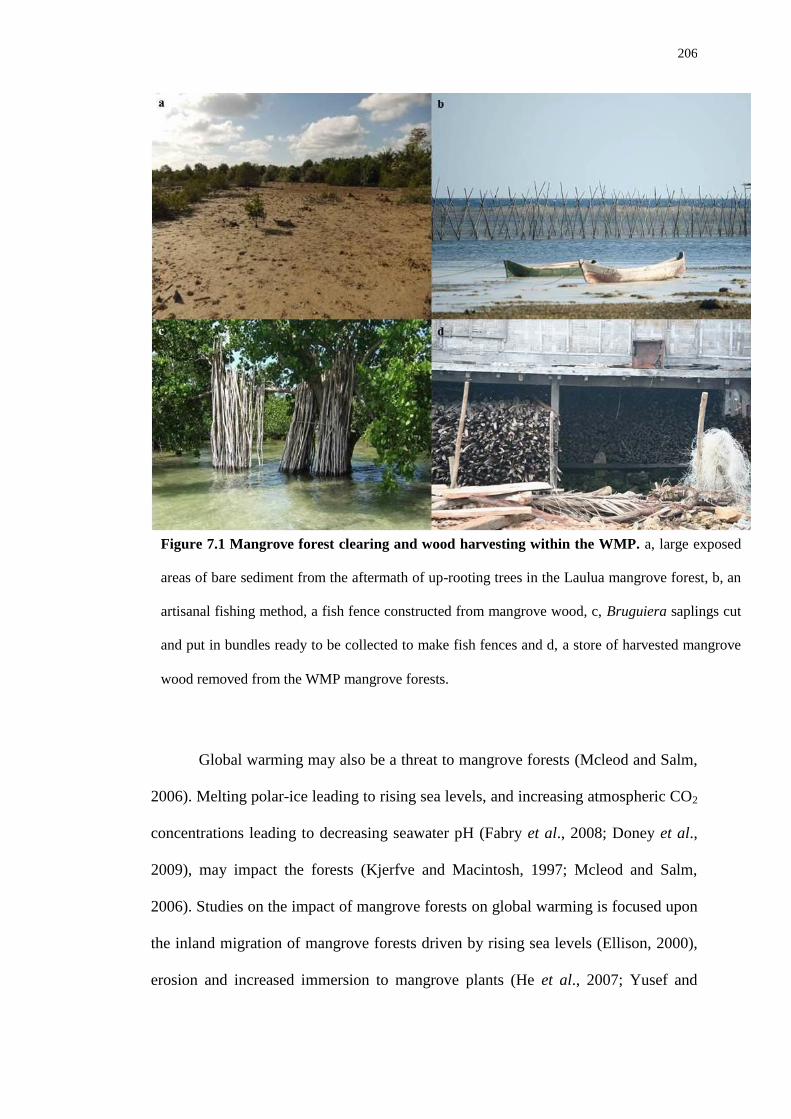
206
Global warming may also be a threat to mangrove forests (Mcleod and Salm,
2006). Melting polar-ice leading to rising sea levels, and increasing atmospheric CO2
concentrations leading to decreasing seawater pH (Fabry et al., 2008; Doney et al.,
2009), may impact the forests (Kjerfve and Macintosh, 1997; Mcleod and Salm,
2006). Studies on the impact of mangrove forests on global warming is focused upon
the inland migration of mangrove forests driven by rising sea levels (Ellison, 2000),
erosion and increased immersion to mangrove plants (He et al., 2007; Yusef and
Figure 7.1 Mangrove forest clearing and wood harvesting within the WMP. a, large exposed
areas of bare sediment from the aftermath of up-rooting trees in the Laulua mangrove forest, b, an
artisanal fishing method, a fish fence constructed from mangrove wood, c, Bruguiera saplings cut
and put in bundles ready to be collected to make fish fences and d, a store of harvested mangrove
wood removed from the WMP mangrove forests.
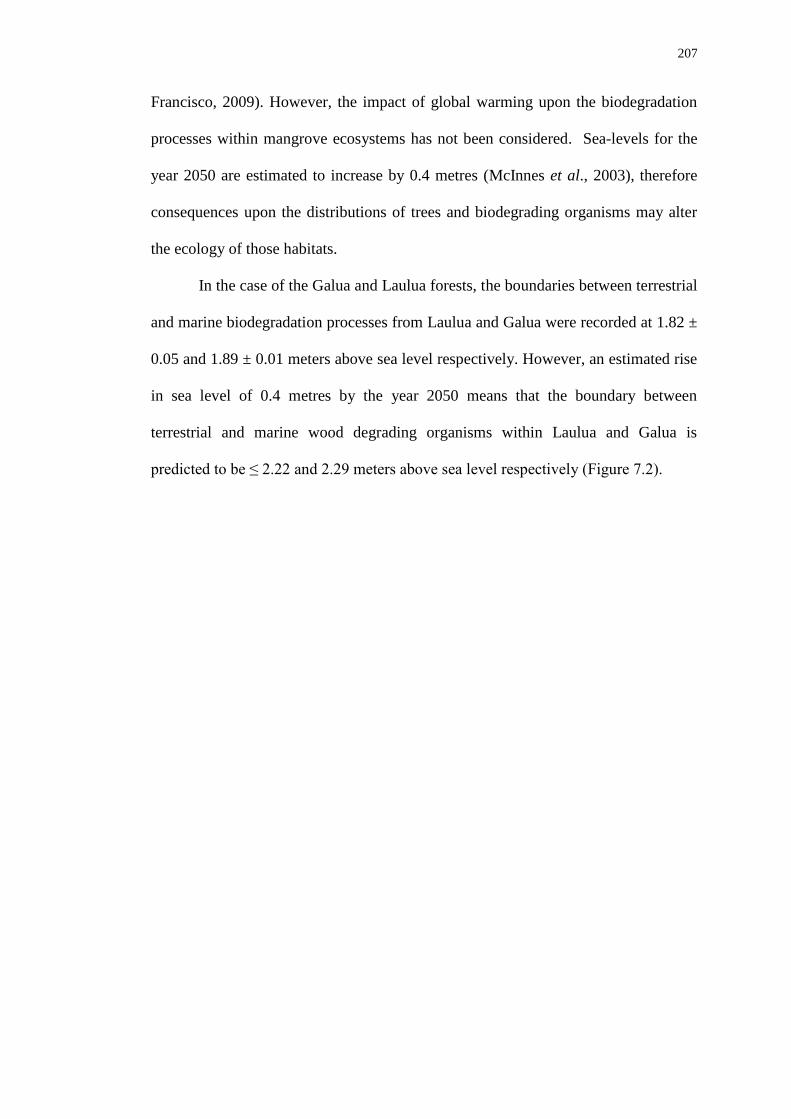
207
Francisco, 2009). However, the impact of global warming upon the biodegradation
processes within mangrove ecosystems has not been considered. Sea-levels for the
year 2050 are estimated to increase by 0.4 metres (McInnes et al., 2003), therefore
consequences upon the distributions of trees and biodegrading organisms may alter
the ecology of those habitats.
In the case of the Galua and Laulua forests, the boundaries between terrestrial
and marine biodegradation processes from Laulua and Galua were recorded at 1.82 ±
0.05 and 1.89 ± 0.01 meters above sea level respectively. However, an estimated rise
in sea level of 0.4 metres by the year 2050 means that the boundary between
terrestrial and marine wood degrading organisms within Laulua and Galua is
predicted to be ≤ 2.22 and 2.29 meters above sea level respectively (Figure 7.2).
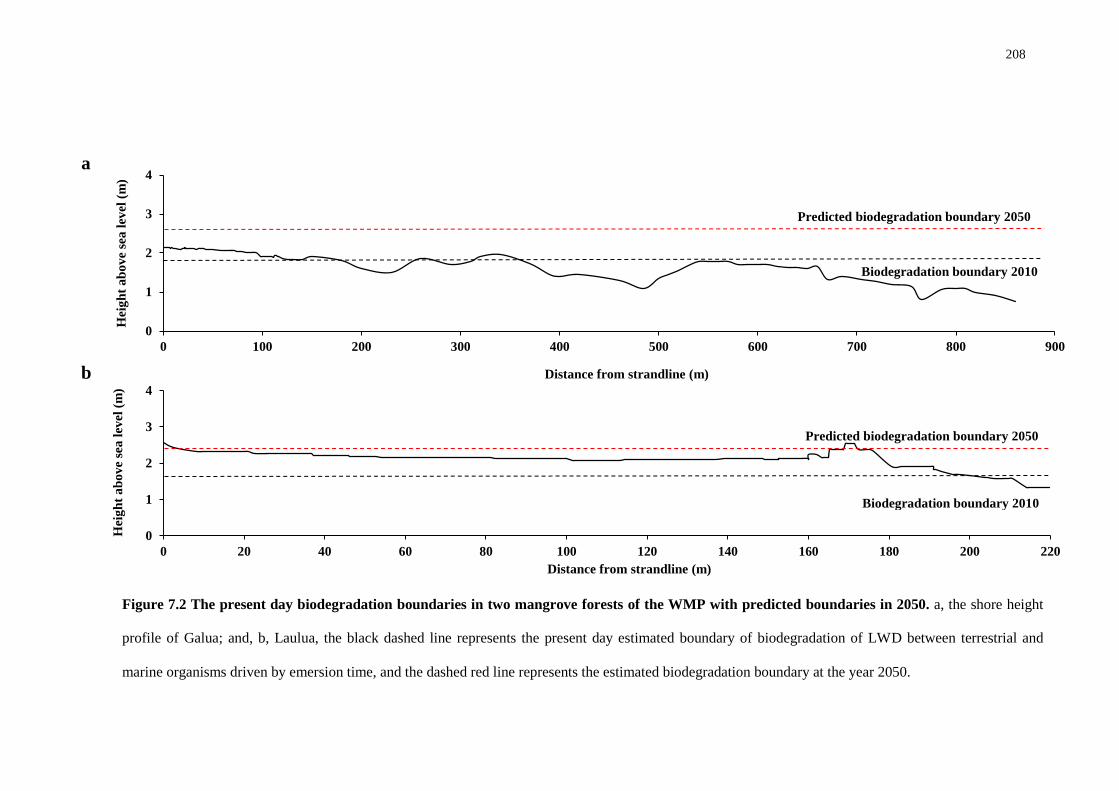
208
0
1
2
3
4
0 100 200 300 400 500 600 700 800 900
Hei
gh
t a
bo
ve
sea
lev
el (
m)
Distance from strandline (m)
Predicted biodegradation boundary 2050
0
1
2
3
4
0 20 40 60 80 100 120 140 160 180 200 220
Hei
gh
t a
bo
ve
sea
lev
el (
m)
Distance from strandline (m)
Predicted biodegradation boundary 2050
a
b
Figure 7.2 The present day biodegradation boundaries in two mangrove forests of the WMP with predicted boundaries in 2050. a, the shore height
profile of Galua; and, b, Laulua, the black dashed line represents the present day estimated boundary of biodegradation of LWD between terrestrial and
marine organisms driven by emersion time, and the dashed red line represents the estimated biodegradation boundary at the year 2050.
Biodegradation boundary 2010
Biodegradation boundary 2010
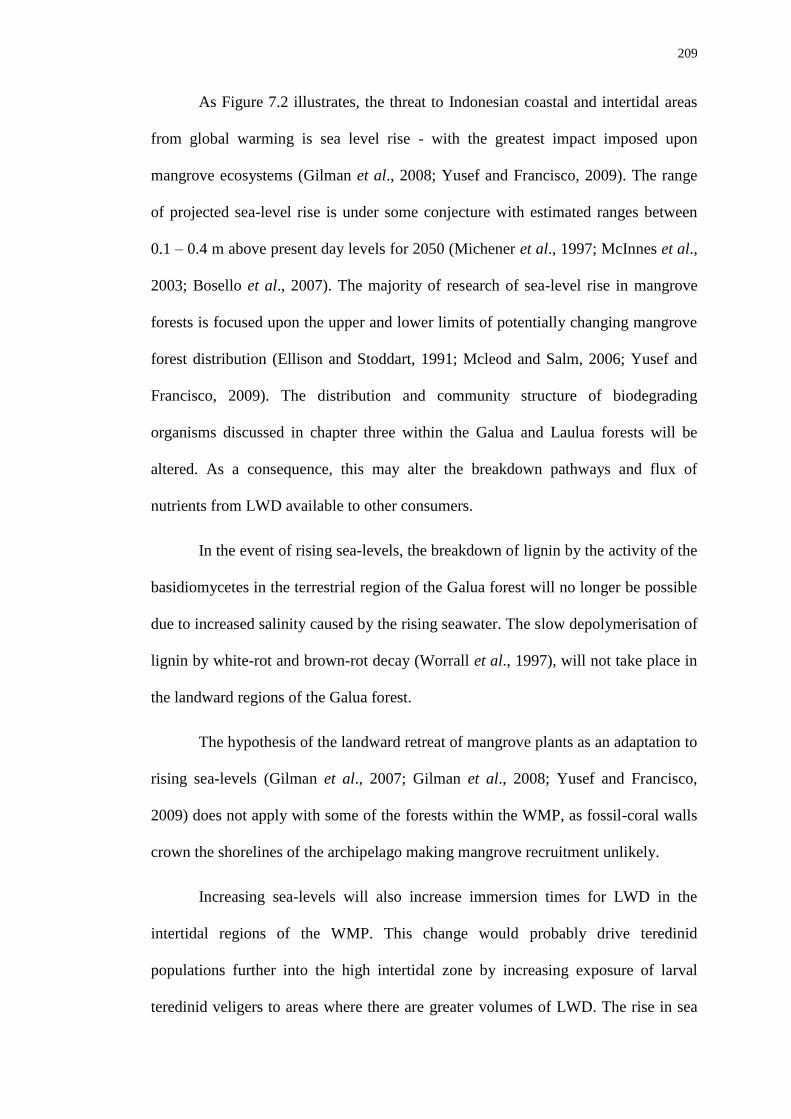
209
As Figure 7.2 illustrates, the threat to Indonesian coastal and intertidal areas
from global warming is sea level rise - with the greatest impact imposed upon
mangrove ecosystems (Gilman et al., 2008; Yusef and Francisco, 2009). The range
of projected sea-level rise is under some conjecture with estimated ranges between
0.1 – 0.4 m above present day levels for 2050 (Michener et al., 1997; McInnes et al.,
2003; Bosello et al., 2007). The majority of research of sea-level rise in mangrove
forests is focused upon the upper and lower limits of potentially changing mangrove
forest distribution (Ellison and Stoddart, 1991; Mcleod and Salm, 2006; Yusef and
Francisco, 2009). The distribution and community structure of biodegrading
organisms discussed in chapter three within the Galua and Laulua forests will be
altered. As a consequence, this may alter the breakdown pathways and flux of
nutrients from LWD available to other consumers.
In the event of rising sea-levels, the breakdown of lignin by the activity of the
basidiomycetes in the terrestrial region of the Galua forest will no longer be possible
due to increased salinity caused by the rising seawater. The slow depolymerisation of
lignin by white-rot and brown-rot decay (Worrall et al., 1997), will not take place in
the landward regions of the Galua forest.
The hypothesis of the landward retreat of mangrove plants as an adaptation to
rising sea-levels (Gilman et al., 2007; Gilman et al., 2008; Yusef and Francisco,
2009) does not apply with some of the forests within the WMP, as fossil-coral walls
crown the shorelines of the archipelago making mangrove recruitment unlikely.
Increasing sea-levels will also increase immersion times for LWD in the
intertidal regions of the WMP. This change would probably drive teredinid
populations further into the high intertidal zone by increasing exposure of larval
teredinid veligers to areas where there are greater volumes of LWD. The rise in sea

210
levels would probably decrease the abundance and distribution of the coleopteran
larvae and termite communities within the intertidal regions due to increased
exposure to immersion. The breakdown processes of LWD and how the
consequently generated organic carbon may then be re-introduced back into the
forest may be drastically altered by shifting wood biodegradation processes driven by
rising sea-levels.
Mangrove forests such as those from this study will likely be sensitive to
rising sea-levels due to their inability to migrate landward. If the rate of sea-level rise
is greater than the rate of change in forest surface elevation, then this would hinder
the landward retreat of trees (Gilman, 2004; Gilman et al., 2007). The landward
succession of trees would likely depend upon the ability of those trees to colonise
new habitats such as increasing shore height elevation (Gilman et al., 2007).
However, many of the forests discussed within the chapters of this research have a
landward boundary characterised by fossil-coral walls. Thus, any potential landward
migration of those forests would not be possible. The lack of landward migration,
coupled with elevated rises in sea levels would likely have adverse consequences for
the re-distribution of the biodegradation processes that breakdown the LWD.
Increasing levels of atmospheric CO2 are also linked to global warming,
further contributing to problems within marine environments such as coral reefs
(Hoegh-Guldberg et al., 2007; Doney et al., 2009) and calcium carbonate-producing
organisms (Parker et al., 2009). Although, increasing atmospheric CO2 may have
significant ecological problems for coral reefs and animals such as oysters, such
consequences have not been considered for teredinids within mangrove forest
environments. The biodegradation boundary of LWD in mangrove forests between
terrestrial and marine processes would be changed. The effect of decreased pH upon
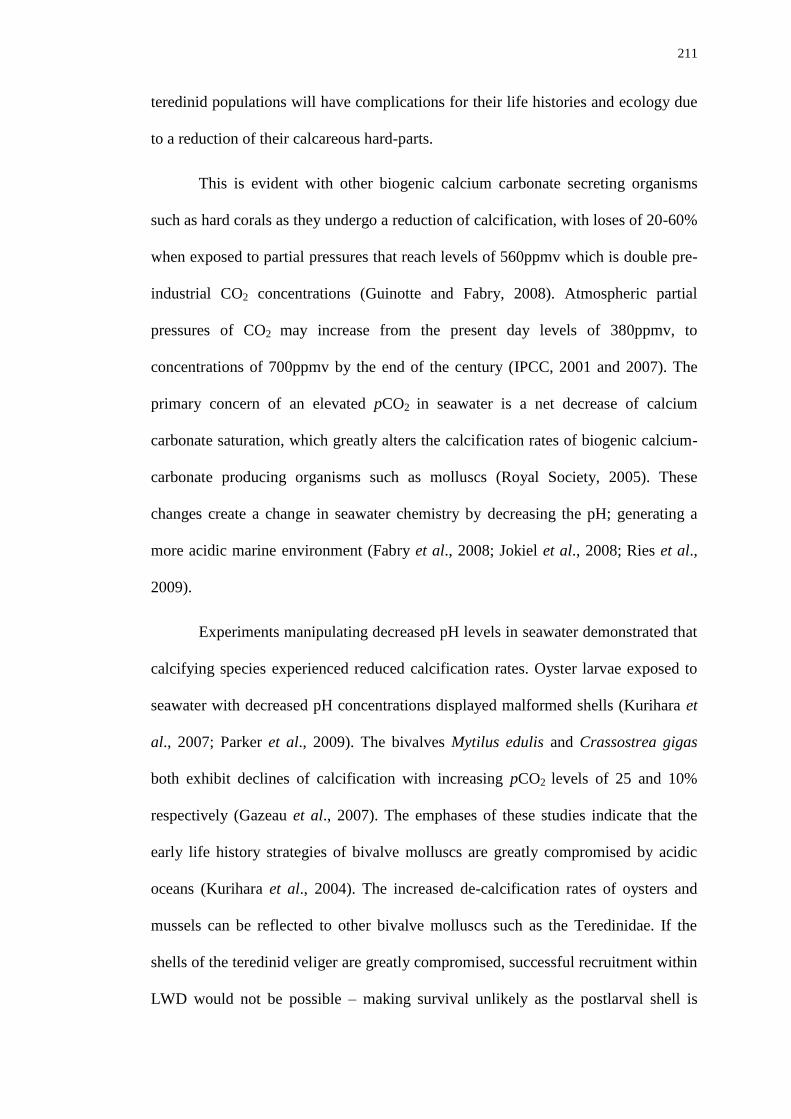
211
teredinid populations will have complications for their life histories and ecology due
to a reduction of their calcareous hard-parts.
This is evident with other biogenic calcium carbonate secreting organisms
such as hard corals as they undergo a reduction of calcification, with loses of 20-60%
when exposed to partial pressures that reach levels of 560ppmv which is double pre-
industrial CO2 concentrations (Guinotte and Fabry, 2008). Atmospheric partial
pressures of CO2 may increase from the present day levels of 380ppmv, to
concentrations of 700ppmv by the end of the century (IPCC, 2001 and 2007). The
primary concern of an elevated pCO2 in seawater is a net decrease of calcium
carbonate saturation, which greatly alters the calcification rates of biogenic calcium-
carbonate producing organisms such as molluscs (Royal Society, 2005). These
changes create a change in seawater chemistry by decreasing the pH; generating a
more acidic marine environment (Fabry et al., 2008; Jokiel et al., 2008; Ries et al.,
2009).
Experiments manipulating decreased pH levels in seawater demonstrated that
calcifying species experienced reduced calcification rates. Oyster larvae exposed to
seawater with decreased pH concentrations displayed malformed shells (Kurihara et
al., 2007; Parker et al., 2009). The bivalves Mytilus edulis and Crassostrea gigas
both exhibit declines of calcification with increasing pCO2 levels of 25 and 10%
respectively (Gazeau et al., 2007). The emphases of these studies indicate that the
early life history strategies of bivalve molluscs are greatly compromised by acidic
oceans (Kurihara et al., 2004). The increased de-calcification rates of oysters and
mussels can be reflected to other bivalve molluscs such as the Teredinidae. If the
shells of the teredinid veliger are greatly compromised, successful recruitment within
LWD would not be possible – making survival unlikely as the postlarval shell is

212
needed for burrowing (Turner, 1976). Upon development, proteinaceous and
calcareous material is added to the juvenile teredinid shell, which has teeth-like
projections used for rasping. Teredinids also produce calcareous pallets - exclusive to
the family (Turner, 1966). Teredinid boring rates ranges from 0.03 to 3.85mm day-1
,
which accelerates with increasing length of the body (Manyak, 1982).
If decreasing pH inhibits teredinid settlement, this may consequently transfer
the competitive benefit to non-calcifying animals. If global warming increases sea-
levels and ocean acidification as predicted; there would be a reduction with the
volume of LWD processed in mangrove ecosystems. The reduced wood-
biodegradation in the mid- to low- intertidal areas of the forests would have further
detrimental consequences, as LWD serves as an integral and essential source of
nutrients (Gee and Somerfield, 1997), and is the base of an elaborate food web
(Benner and Hodson, 1985).
As a consequence of global warming, increasing sea level rise and partial
pressures of CO2 concentrations has revealed the need to investigate the effect of
global warming upon the distribution of the terrestrial and marine biodegradation
processes. Global warming may induce shifts of the biodegradation processes within
mangrove ecosystems, with unknown consequences. The forests from the Tukang
Besi Archipelago have a wide tidal range extending from mean sea level to the high
intertidal. Conversely, mangrove forests from the Caribbean have a comparatively
limited tidal regime that range in height by 20 to 40 cm (Ilka C. Feller, personal
communication). The investigation of the biodegradation boundary of LWD in
forests from the Caribbean is necessary, due to the limited tidal flow. A different
suite of biodegradation processes may be found within Caribbean mangrove forests
due to the reduced emersion time. Differences of the biodegradation processes may
213
provide insights into the effect of wood-degradation within permanently and tidally
inundated forests. Increasing ocean acidification may have ecological implications
for the marine biodegrading detritivores in mangrove ecosystems, which may
ultimately affect the flow of nutrients to other ecosystems.
Final conclusions
Despite being considered as economic pests, the Teredinidae are the
dominant biodegraders of LWD within the seaward edges of mangrove forests. The
fragmentation of LWD in the mid to low intertidal areas of the forests are enhanced
by teredinids. Much of the LWD within the mangrove forests is processed and
recycled back into the ecosystem due to the mechanical effect and digestion by
teredinids. The tunnelling activity of teredinids significantly modifies the
environment, increases the mangrove faunal diversity at ecosystem level and creates
niches for animals that exhibit obligate behaviour to that substrate. Furthermore,
teredinid-attacked LWD has the greatest faunal diversity compared to mangrove
forest sediments and Rhizophora prop-roots within the mangrove forests of the
WMP. These data demonstrate that the teredinid populations within the forests of the
Tukang Besi Archipelago can be defined as ecosystem engineers.
Teredinids and their tunnelling of LWD within Indonesian forests will be
affected by increasing wood harvesting pressures and global warming. If wood
harvesting continues there will be a reduction of mangrove faunal diversity, due to
the reduced woody habitat and lack of teredinid tunnel niches. If sea levels rise and
ocean pH levels decrease as predicted there will be a redistribution of the wood-
biodegrading organisms ultimately leading to potentially changing plant zonation,
with fewer nutrients sequestered within the mangrove forest sediments combined

214
with a build-up of LWD and reduced flow of recycled mangrove-derived organic
carbon to adjacent ecosystems.
Priorities for further research in this area are needed to address issues
concerning global warming. Experiments to determine the de-calcification rates of
larval and adult teredinid populations would provide insights into reduced boring
rates and estimates of increasing volumes of LWD in mangrove forests. Experiments
could be used to replicate global warming-induced ocean acidification, and to
investigate the effect of decreased pH upon the Teredinidae – as the recycling of
organic carbon may be compromised in these coastal habitats due to global warming.
Successful mangrove forest management depends on their current status and
the prediction of detrimental ecological issues after the ecosystem structure and
function has been altered. Thus, projects that maintain the mangrove forest habitat
complexity after the trees have been harvested by way of implanting fallen logs may
enhance the faunal diversity of impacted mangrove areas in the WMP and maintain
the flow of organic carbon from LWD.
215
Reference list
Adams, E. S., Atkinson, L., and Bulmer, M. S. 2007 Relatedness, recognition errors, and
colony fusion in the termite Nasutitermes corniger. Behavioural Ecology and
Sociobiology. 61, 1195 – 1201
Adis, J., and Junk, W. J. 2002 Terrestrial invertebrates inhabiting lowland river floodplains
of Central Amazonia and Central Europe: a review. Freshwater Biology. 47, 711 –
731
Agrawal, A. A. 1999 Induced responces to herbivory in wild radish: effects on several
herbivore and plant fitness. Ecology. 80, 1713 – 1723
Agrawal, A. A., Strauss, S. Y., and Stout, M. J. 1999 Costs of reduced responses and
tolerance to herbivory in male and female fitness components of wild radish.
Evolution. 53, 1093 - 1104
Allen, J. A., Ewel, K.C., Keeland, B. D., Tara, T. and Smith III, T. J. 2000 Downed wood in
Micronesian mangrove forests. Wetlands. 20, 169 – 176
Allen, G., Roger, S., Human, H., Deloach, N. 2003 Reef Fish Identification - Tropical
Pacific. Florida, New World Publications, Inc. USA
Allen, G. R. 2008 Conservation hotspots of biodiversity and endemism for Indo-Pacific
coral reef fishes. Aquatic Conservation, Marine and Freshwater Ecosystems. 18, 541
– 556
Alongi, D. M. 1987 The influence of mangrove-derived tannins on intertidal meiobenthos in
tropical estuaries. Oecologia. 71, 537 – 540
Alongi, M. D. 2002 Present state and future of the world’s mangrove forests. Environmental
Conservation. 29, 331 – 349

216
Alongi, D., 2007 The mangrove forests of Papua. pp. 824-857. In: Marshall, A. J., and
Beehler, B. M. (eds) In The Ecology of Papua. The Ecology of Indonesia Series,
Volume 5, Periplus Editions Ltd
Alongi, D. M. 2009 Paradigm shifts in mangrove biology. Chapter 22, in Perillo, G. M. E.,
Wolanski, E., Cahoon, D. R., and Brinson, M. M. (eds.) Coastal Wetlands: An
Integrated Ecosystem Approach. Elsevier Press.
Ananda, K., and Sridhar, K. R. 2004 Diversity of filamentous fungi on decomposing leaf
and woody litter of mangrove forests in the southeast coast of India. Current Science.
87, 1431 - 1437
Arnett, R. H. 1951 A revision of the Neartic Oedemeridae. The American Midland
Naturalist. 45, 257 - 391
Arsuffi, T. L., Suberkropp, K. 1989 Selective feeding by shredders on leaf-colonising stream
fungi: comparison of macroinvertebrate taxa. Oecologia. 79, 30 – 37
Ashton, E. C., and Macintosh, D. J. 2002 Preliminary assessment of the plant diversity and
community ecology of the Sematan mangrove forest, Sarawak, Malaysia. Forest
Ecology and Management. 166, 111 - 129
Babu, R., Varadharajan, D., Soundarapandian, P., and Balasubramanian, R. 2010 Fungi
diversity in different coastal marine ecosystem along South East coast of India.
International Journal of Microbiological Research. 1, 175 - 178
Barkati, S., and Tirmizi, N. M. 1991 The environmental impact of wood-borers in mangrove
swamps. Symposia of the Zoological Society of London. 63, 251 – 263
Barnes, R. S. K. 2003 Interactions between benthic molluscs in a Sulawesi mangal,
Indonesia: the cerithiid mud-creeper Cerithium coralium and potamidid mud-
whelks, Terebralia spp. Journal of the Marine Biological Association of the United
Kingdom. 83, 483 – 487

217
Beitinger, T.L., Bennett, W.A., & McCauley, R.W 2000 Temperature tolerances of North
American freshwater fishes exposed to dynamic changes in temperature.
Environmental Biology of Fishes. 58, 237 – 275
Benke, A. C., Henry III, R. L., Gillespie, D. M., and Hunter, R. J. 1985 Importance of snag
habitat for animal production in Southeastern streams. Fisheries. 10, 8 – 13
Benner, R., and Hodson, R. E. 1985 Microbial degradation of the leachable and
lignocellulosic components of leaves and wood from Rhizophora mangle in a
tropical mangrove swamp. Marine Ecology Progress Series. 23, 221 - 230
Bennett, W.A. 2010 Extreme physiology of intertidal fishes of the Wakatobi. In Marine
Research and Conservation in the Coral Triangle: The Wakatobi National Park (eds
J. Clifton, R. K. F. Unsworth & D. J. Smith), pp. 111–128 Nova Science Publishers,
New York
Berkenbusch, K., and Rowden, A. A. 2003 Ecosystem engineering – moving away from
‘just-so’ stories. New Zealand Journal of Ecology. 27, 67 - 73
Bilby, E. R., and Likens, G. E. 1980 Importance of orbanic debris dams in the structure and
function of stream ecosystems. Ecology. 6, 1107 – 1113
Blasco, F., Saenger, P., and Janolet, E. 1996 Mangroves as indicators of coastal change.
Catena. 27, 167 - 178
Bloch, R. 1952 Wound healing in higher plants II. Botanical Review. 18, 655 – 679
Borges, L. M. S., Cragg, S. M., Bergot, J., Williams, J. R., Shayler, B., and Sawyer, G. S.
2008 Laboratory screening of tropical hardwoods for natural resistance to the marine
borer Limnoria quadripunctata: The role of leachable and non-leachable factors.
Holzforschung. 62, 99 - 111
Borojevic, K., Steiner Jr. W. E., Gerisch, R., Zazzaro, C., and Ward, C. 2010 Pests in an
ancient Egyptian harbour. Journal of Archaeological Science. 37, 2449 – 2458
218
Bosello, F., Roson, R., and Tol, R. S. J. 2007 Economy-wide estimates of the implications of
climate change: sea level rise. Environmental and Resource Economics. 37, 549 -
571
Bosire, J. O., Dahdouh-Guebas, F., Kairo, J. G., Wartel, S., Kazungu, J., and Koedan, N.
2006 Success rates of recruited tree species and their contribution to the structural
development of reforested mangrove stands. Marine Ecology Progress Series. 325,
85 - 91
Boto, K. G., and Bunt. J. S. 1982 Carbon export from mangroves. Journal of Marine and
Freshwater Research. 105 - 110
Bouillon, S., Connolly, R. M., and Lee, S. Y. 2008 Organic matter exchange and cycling in
mangrove ecosystems: Recent insights from stable isotope studies. Journal of Sea
Research. 59, 44 - 58
Bouma, T. J., Olenin, S., Reise, K., and Ysebaert, T. 2009 Ecosystem engineering and
biodiversity in coastal sediments: posing hypotheses. Helgoland Marine Research.
63, 95 – 106
Brearley, A., Chalermwat, K., and Kakhai, N. 2003 Pholadidae and Teredinidae (Mollusca:
Bivalvia) collected from mangrove habitats on the Burrup Peninsula, Western
Australia. In, Wells, F. E., Walker, D. I., and Jones, D. S. (Eds) The marine flora
and fauna of Dampier, Western Australia. Western Australia Museum, Perth,
Western Australia. 345 - 356pp
Brooks, R. A., and Bell, S. S. 2002 Mangrove response to attack by a root boring isopod:
root repair versus architectural modification. Marine Ecology Progress Series. 231,
85 – 90

219
Brooks, A. P., Gehrke, P. C., Jansen, J. D., and Abbe, T. B. 2004 Experimental
reintroduction of wood debris on the Williams River, NSW: geomorphic and
ecological responses. River Research and Applications. 20, 513 – 536
Brush, G. S. 2009 Historical land use, nitrogen, and coastal eutrophication: a paleoecological
perspective. Estuaries and Coasts. 32, 18 - 28
Bucher, V. V. C., Pointing, S. B., Hyde, K. D., and Reddy, C. A. 2004 Production of wood
decay enzymes, loss of mass, and lignin solubilisation in wood by diverse tropical
freshwater fungi. Microbial Ecology. 48, 331 - 337
Bunt, J. S., Boto, K. G., and Boto, G. 1979 A survey method of estimating potential levels of
mangrove forest primary production. Marine Biology. 52, 123 - 128
Castillo, G., and Demoulin, V. 1997 NaCl salinity and temperature effects on growth of
three wood-rotting basidiomycetes from a Papua New Guinea coastal forest.
Mycology Research. 101, 341 – 344
Cerri, C. E. P., Easter, M., Paustian, K., Killian, K., Coleman, K., Bernoux, M., Falloon, P.,
Powlson, D. S., Batjes, N. H., Milne, E., Cerri, C. C. 2007 Predicted soil organic
carbon stocks and changes in the Brazilian Amazon between 2000 and 2030.
Agriculture, Ecosystems and Environment. 122, 58 – 72
Chan, Y. H. 1982 Storage and release of organic carbon in Peninsular Malaysia.
International Journal of Environmental Studies. 18, 211 - 222
Clausen, R., and York, R. 2008 Global biodiversity decline of marine and freshwater fish: a
cross-national analysis of economic, demographic, and ecological influences. Social
Science Research. 37, 1310 – 1320
Clifton, J., and Unsworth, R. K. F. 2010 Introduction In: Clifton, J., Unsworth, R., and
Smith, D. (Eds.). Marine Research and Conservation in the Coral Triangle. Nova
Science Publishers, Hauppauge, New York

220
Clough, B. F. 1984 Mangroves. In: Control of Crop Productivity. Academic press, Sydney.
pp 253 -268
Collier, K. J., and Halliday, J. N. 2000 Macroinvertebrate-wood associations during decay of
plantation pine in New Zealand pumice-bed streams: stable habitat or trophic
subsidy? Journal of the North American Benthological Society. 19, 94 – 111
Connell, J. H. 1978 Diversity in tropical rain forests and coral reefs. Science. 199, 1302 –
1310
Cookson, L. J., Cragg, S. M., and Hendy, I. W. 2012 Wood-boring limnoriids (Crustacea,
Isopoda) including a new species from mangrove forests of the Tukang Besi
Archipelago, Indonesia. Zootaxa. 3248, 25 - 34
Coomans, E. H. 1969 Biological aspects of mangrove molluscs in the West Indies.
Proceedings of the Third European Malacological Congress. 9, 79 - 84
Correa, M. D. O. D. A., and Uieda, V. S. 2008 Composition of the aquatic invertebrate fauna
associated to the mangrove vegetation of a coastal river, analysed through a
manipulative experiment. Pan-American Journal of Aquatic Sciences. 3, 23 - 31
Crabbe, M. J. C., and Smith, D. J. 2005 Sediment impacts on growth rates of Acropora and
Porites corals from fringing reefs of Sulawesi, Indonesia. Coral Reefs. 24, 437 - 441
Cragg, S. M. In, The Ecology of Papua; Behler, B. M.; Marshall, A. J.; Eds, Periplus:
Singapore, 2007. pp539 - 563
Cragg, S. M., Jumel, M. C., Al-Horani, F. A. & Hendy, I.W. 2009 The life history
characteristics of the wood-boring bivalve Teredo bartschi are suited to the elevated
salinity, oligotrophic circulation in the Gulf of Aqaba, Red Sea. Journal of
Experiemental Marine Biology and Ecology. 375, 99 – 105
221
Cragg, S.M., Hendy, I.W. 2010 Mangrove Forests of the Wakatobi National Park. In:
Clifton, J., Unsworth R.K.F., and Smith, D.J. (Eds.), Marine Research and
Conservation in the Coral Triangle. Nova Science Publishers, Hauppauge, New
York
Cullen, L. C., Pretty, J., Smith, D., and Pilgrim, S. E. 2007 Links between local ecological
knowledge and wealth in indigenous communities of Indonesia: implications for
conservation of marine resources. Journal of Social Science. 2, 289 – 299
Cullen, L. C. 2010 Marine resource dependence and natural resource use patterns in the
Wakatobi In: Clifton, J., Unsworth, R. K. F., and Smith, D. J. (Eds.), Marine
Research and Conservation in the Coral Triangle. Nova Science Publishers,
Hauppauge, New York
Dahlgren, C. P., Kellison, T. G., Adams, A. J., Gillanders, B. M., Kendall, M. S., Layman,
C. A., Ley, J. A., Nagelkerken, I., and Serafy, J. E. 2006 Marine nurseries and
effective juvenile habitats: concepts and applications. Marine Ecology Progress
Series. 312, 291 – 295
Davis, W.P., Taylor, D.S. and Turner, B.J 1995 Does the autecology of the mangrove rivulus
fish (Rivulus marmoratus) reflect a paradigm for mangrove ecosystem sensitivity?
Bulletin of Marine Science. 57, 208 – 214
Davis, S. E., Corronado-Molina, C., Childers, D. L. and Day, J. W. 2003 Temporally
dependant C, N, and P dynamics associated with the decay of Rhizophora mangle L.
Leaf litter in oligotrophic mangrove wetlands of the southern Everglades. Aquatic
Botany. 75, 199 - 215
Dechart, G., Veldkamp, E., and Brumme, R. 2005 Are partial nutrient balances suitable to
evaluate nutrient sustainability of land use systems? Results from a case study in
Central Sulawesi, Indonesia. Nutrient Cycling in Agroforestry. 72, 201 - 212
222
Diez, J. R., Larranaga, S., Elosegi, A., and Pozo, J. 2000 Effect of removal of wood on
streambed stability and retention of organic matter. Journal of the North American
Benthological Society. 19, 621 - 632
Distel, L. D. 2003 The biology of marine wood boring bivalves and their bacterial
endosymbionts. American Chemical Society. 253 – 271
Donato, D. C., Kauffman, J. B., Murdiyarso, D., Kurnianto, S., Stidham, M., and Kanninen,
M. 2011 Mangroves among the most carbon-rich forests in the tropics. Nature
Geoscience. 4, 293 – 297
Doney, S. C., Fabry, V. J., Feely, R. A., and Kleypas, J. A. 2009 Ocean acidification: The
other CO2 problem. Annual Review of Marine Science. 1, 169 - 192
Donner, S. D., Knutson, T. R., and Oppenheimer, M. 2007 Model-based assessment of the
role of human-induced climate change in the 2005 Caribbean coral bleaching event.
Proceedings of the National Academy of Sciences. 1 – 6
Doorn, W. G. V., and Cruz, P. 2000 Evidence for a wounding-induced xylem occlusion in
stems of cut chrysanthemum flowers. Postharvest Biology and Technology. 19, 73 –
83
Duke, C. N., Bunt. S. J., and Williams. T. W. 1981 Mangrove litter fall in north-eastern
Australia. I. Annual totals by component in selected species. Australian Journal of
Botany. 29, 547 - 53
Duke, N. C. (1992), Mangrove floristics and biogeography, in Tropical Mangrove
Ecosystems, Coastal Estuarine Series., vol. 41, edited by A. I. Robertson and D. M.
Alongi, pp. 63–100, AGU, Washington, DC
Duke, N. C., Ball, M. C., and Ellison, J. C. 1998 Factors influencing biodiversity and
distribution gradients in mangroves. Global Ecology and Biogeography Letters. 7, 27
– 47
223
Duke, N. C. 2001 Gap creation and regenerative processes driving diversity and structure of
mangrove ecosystems. Wetlands Ecology and Management. 9, 257 – 269
Duke, N. C., Meynecke, J-O., Dittmann, S., Ellison, A. M., Anger, K., Berger, U., Cannicci,
S., Dielle, K., Ewel, K. C., Field, C. D., Koedam, N., Lee, S. Y., Marchand, C.,
Nordhaus, I., Dahdouh-Guebas, F. 2007 A World without mangroves? Science. 317,
41 – 42
Eggert, C., Temp, V., and Eriksson, K. L. 1996 The lignolytic system of the white rot fungus
Pycnoporus cinnaburinus: Purification and characterisation of the laccase. Applied
and Environmental Microbiology. 62, 1151 – 1158
Ejechi, B. O. 2002 Microbial deterioration of partially submerged service timbers in a
tropical inter-tidal zone. International Biodeterioration and Biodegradation. 51, 115
– 118
Ellison, A. M., and Farnsworth, E. J. 1990 The ecology of Belizean mangrove-root fouling
communities. I. Epibenthic fauna are barriers to isopod attack of red mangrove roots.
Journal of Experimental Marine Biology and Ecology. 142, 91 - 104
Ellison, J. C., and Stoddart, D. R. 1991 Mangrove ecosystem collapse during predicted sea-
level rise: Holocene analogues and implications. Journal of Coastal Research. 7,
151 - 165
Ellison, A. M., and Farnsworth, E. J. 1992 The ecology of Belizean mangrove-root fouling
communities: patterns of epibont distribution and abundance, and effects on root
growth. Hydrobiologia. 247, 87 - 98
Ellison, A. M., and Farnsworth, E. J. 1996 Spatial and temporal variability in growth of
Rhizophora mangle saplings on coral cays: links with variation in insolation,
herbivory, and local sedimentation rate. Journal of Ecology. 84, 717 – 731

224
Ellison, J. C. 2000 How South Pacific mangroves may respond to predicted climate change
and sea-level rise. In, Gillespie, A., and Burns, W. C. G. (eds.) Climate Change in
the South Pacific: Impacts and responses in Australia, New Zealand and small
Island states, Dordrecht, Netherlands, Kluwer Academic Publishers, The
Netherlands. 289 - 301
Eme, J., and Bennett, W. A. 2009a Acute temperature quotient responses of fishes reflect
their divergent thermal habitats in the Banda Sea, Sulawesi, Indonesia. Australian
Journal of Zoology. 57, 357 - 362
Eme, J. and Bennett, W. A. 2009b Critical thermal tolerance polygons of tropical marine fish
from Sulawesi, Indonesia. Journal of Thermal Biology. 34, 220 – 225
Engelhart, S. E., Horton, B. P., Roberts, D. H., Bryant, C. L., and Corbett, D. R. 2007
Mangrove pollen of Indonesia and its suitability as a sea-level indicator. Marine
geology. 242, 65 - 81
Evans, T. A., Inta, R., and Lenz, M. 2007 Foraging vibration signals attract foragers and
identify food size in the drywood termite, Cryptotermes secundus. Insectes Sociaux.
54, 374 – 382
Everett, R. A., and Ruiz, G. M. 1993 Coarse woody debris as a refuge from predation in
aquatic communities. An experimental test. Oecologia. 93, 475 – 486
Fabry, V. J, Seibel, B. A., Feely, R. A., and Orr, J. C. 2008 Impacts of ocean acidification on
marine fauna and ecosystem processes. ICES Journal of Marine Science. 65, 414 -
432
Feller, I. C., and Mathis, W. N. 1997 Primary herbivory by wood-boring insects along an
architectural gradient of Rhizophora mangle. Biotropica. 29, 440 - 451
Feller, I. C., and Mckee, K. L. 1999 Small gap creation in Belizean mangrove forests by a
wood boring insect. Biotropica. 31, 607 - 617
225
Feller, I. C. 2002 The role of herbivory by wood-boring insects in mangrove ecosystems in
Belize. Oikos. 97, 167 - 176
Filho, C. S., Tagliaro, C. H. & Beasley, C. R. 2008 Seasonal abundance of the shipworm
Neoteredo reynei (Bivalvia, Teredinidae) in mangrove driftwood from a northern
Brazilian beach. Iheringia Series of Zoology. 98, 17 – 23
Foley, J. A., Asner, G. P., Costa, M. H., Coe, M. T., DeFries, R., Gibbs, H. K., Howard, E.
A., Olson, S., Patz, J., Ramankutty, N., and Snyder, P. 2007 Amazonia revealed:
forest degradation and loss of ecosystem goods and services in the Amazon Basin.
Frontiers in Ecology and the Environment. 5, 25 – 32
Fryar, S. C., Davies, J., Booth, W., Hodgkiss, I. J., and Hyde, K. D. 2004 Succession of
fungi on dead and live wood in brackish water in Brunei. Mycologia. 96, 219 - 225
Gaume, L., and Mckey, D. 1997 Benefits conferred by “timid” ants: active anti-herbivore
protection of the rainforest tree Leonardoxa africana by the minute ant
Petalomyrmex phylax. Oecologia. 112, 209 - 216
Gazeau, F., Quiblier, C., Jansen, J. M., Gattuso, J. P., Middelburg, J. J., and Heip, C. H. R.
2007 Impact of elevated CO2 on shellfish calcification. Geophysical Research
Letters. 34, 1 - 5
Gee, J. M., and Somerfield, J. P. 1997 Do mangrove diversity and litter decay promote
meiofaunal diversity? Journal of Experimental Marine Biology and Ecology. 218,
13 - 33
Giesen, W., Wulfraat, S., Zieven, M., and Scholten, L. 2006 Mangrove guidebook for
Southeast Asia. RAP Publication 2006/07. Bangkok, Thailand. FAO regional office
for Asia and the Pacific and Wetlands international. ISBN 974-7946-85-8
Gilbert, G. S., and Sousa, W. D. 2002 Host specialisation among wood-decay polypore fungi
in a Caribbean mangrove forest. Biotropica. 34, 396 - 404
226
Gill, A. M., and Tomlinson, P. B. 1971 Studies on the growth of red mangrove (Rhizophora
mangle L.) 2. Growth and differentiation of aerial roots. Biotropica. 3, 63 - 77
Gill, A. M., and Tomlinson, P. B. 1977 Studies on the growth of red mangrove (Rhizophora
mangle L.) 4. The adult root system. Biotropica. 9, 145 – 155
Gilman, E. 2004 Assessing and managing coastal ecosystem response to change in sea-level
and climate. Prepared for the international research foundation for development
forum on small island developing states: challenges, prospects and international
cooperation for sustainable development. Contribution to the Barbados +10 United
Nations International meeting on sustainable development of small island
developing states, Port Louis, Mauritius, 10-14 January 2005. Honolulu, Blue Ocean
Institute
Gilman, E., Ellison, J., and Coleman, R. 2007 Assessment of mangrove response to
projected relative sea-level rise and recent historical reconstruction of shoreline
position. Environmental Monitoring Assessment. 124, 105 - 130
Gilman, E., Ellison, J., Sauni Jr, I., and Tuaumu, S. 2007 Trends in surface elevations of
American Samoa mangroves. Wetlands Ecology Management. 15, 391 - 404
Gilman, E. L., Ellison, J., Duke, N. C., and Field, C. 2008 Threats to mangroves from
climate change and adaptation options. Aquatic Botany. 89, 237 - 250
Gimenez, L. 2003 Potential effects of physiological plastic responses to salinity on
population networks of the estuarine crab Chasmagnathus granulate. Helgoland
Marine Research. 56, 265 – 273
Godwin, S. L. 2003 Hull fouling of maritime vessels as a pathway for marine species
invasions to the Hawaiian Islands. Biofouling. 19, 123 – 131
Granek, E., and Ruttenburg, B. J. 2008 Changes in biotic and abiotic processes following
mangrove clearing. Estuarine, Coastal and Shelf Science. 80, 555 - 562
227
Granek, E. F., Compton, J. E., and Phillips, D. L. 2009 Mangrove-exported nutrient
incorporation by sessile coral reef invertebrates. Ecosystems. 12, 462 - 472
Gratwicke, B., and Speight, M. R. 2005 The relationship between fish species richness,
abundance and habitat complexity in a range of shallow tropical marine habitats.
Journal of Fish Biology. 66, 650 - 667
Greenwood, J. L., Rosemond, A. D., Wallace, J. B., Cross, W. F., and Weyers, H. S. 2007
Nutrients stimulate leaf breakdown rates and detritivore biomass: bottom-up effects
via heterotrophic pathways. Oecologia. 151, 637 - 649
Gross, W. J. 1957 An analysis of response to osmotic stress in selected decapod crustacea.
Biological Bulletin. 1, 43 – 62
Grossman, G. D., Ratajczak Jr, R. E., Crawford, M., and Freeman, M. C. 1998 Assemblage
organization in stream fishes: effects of environmental variation and interspecific
interactions. Ecological Monographs. 68, 395 – 420
Guinotte, J. M., and Fabry, V. J. 2008 Ocean acidification and its potential effects on marine
ecosystems. Annual New York Academy of Science. 1134, 320 - 342
Gulis, V. V., Rosemond, A. D., Suberkropp, K., Weyers, H. S., and Benstead, J. P. 2004
Effects of nutrient enrichment on the decomposition of wood and associated
microbial activity in streams. Freshwater Biology. 49, 1437 – 1447
Hall, R., and Wilson, M. E. J. 2000 Neogene sutures in eastern Indonesia. Journal of Asian
Earth Sciences. 18, 781 – 808
Han, L., Huang, X., Sattler, I., Dahse, H-M, Fu, H., Lin, W., and Grabley, S. 2004 New
diterpenoids from the marine mangrove Bruguiera gymnorrhiza. Journal of Natural
Products. 67, 1620 - 1623

228
Hanley, M. E., Lamont, B. B., Fairbanks, M. M., and Rafferty, C. M. 2007 Plant structural
traits and their role in anti-herbivore defence. Perspectives in Plant Ecology,
Evolution and Systematics. 8, 157 – 178
Haschenburger, J. K., and Rice, S. P. 2004 Changes in woody debris and bed material
texture in a gravel-bed channel. Geomorphology. 60, 241 – 267
Hata, H., Kudo, S., Yamano, H., Kurano, N., Kayanne, H. 2002 Organic carbon flux in
Shiraho coral reef (Ishigaki Island, Japan). Marine Ecology Progress Series. 232,
129 - 140
Hauff, R. D., Ewel, K. C., and Jack, J. 2006 Tracking human disturbance in mangroves:
estimating harvest rates on a Micronesian Island. Wetlands Ecology and
Management. 14, 95 - 105
Haukioja, E., and Koricheva, J. 2000 Tolerance to herbivory in woody vs. herbaceous plants.
Evolutionary Ecology. 14, 551 – 562
He, B., Lai, T., Fan, H., Wang, W., and Zhang, H. 2007 Comparison of flooding-tolerance in
four mangrove species in a diurnal tidal zone in the Beibu Gulf. Estuarine, Coastal
and Shelf Science. 74, 254 - 262
Hilderbrand, R. H., Lemly, A. D., Dolloff, A., and Harpster, K. L. 1997 Effects of large
woody debris placement on stream channels and benthic macroinvertebrates.
Canadian Journal of Fish and Aquatic Science. 54, 931 – 939
Hoegh-Guldberg, O., Mumby, P. T., Hooten, A. J., Steneck, R. S., Greenfield, P., Gomez,
E., Harvell, C. D., Sale, P. F., Edwards, A. J., Caldeira, K., Knowlton, N., Eakin, C.
M., Iglesias-Prieto, R., Muthiga, N., Bradbury, R. H., Dubi, A., and Hatziolos, M. E.
2007 Coral reefs under rapid climate change and ocean acidification. Science. 318,
1737 - 1742
229
Hol, G. W. H., Macel, M., Van Veen, J. A., and Meijden, E. V. D. 2004 Root damage and
aboveground herbivory change concentration and composition of pyrrolizidine
alkaloids of Senecio jacobaea. Basic and Applied Ecology. 5, 253 – 260
Hughes, T. P. 1994 Catastrophes, phase-shifts, and large-scale degradation of a Caribbean
coral reef. Science. 265, 1547 - 1551
IPCC. Climate change 2001: the scientific basis contribution of working group 1 to the Third
assessment report of the intergovernmental panel on climate change. Cambridge
University Press. Cambridge
IPCC. Climate change 2007: the physical science basis. Contribution of working group 1 to
the Forth assessment report of the intergovernmental panel on climate change.
Cambridge University Press. Cambridge
Jimenez, A. J., and Sauter, K. 1991 Structure and dynamics of mangrove forests along a
flooding gradient. Estuaries. 14, 49 - 56
Jimenez, A. G., and Bennett, W. A. 2005 Respiratory physiology of three Indo-Pacific
fiddler crabs: metabolic responces to intertidal zonation patterns. Crustaceana. 78,
965 – 974
Jokiel, P. L., Rodgers., K. S., Kuffner., I. B., Andersson, A. J., Cox, E. F., and Mackenzie, F.
T. 2008 Ocean acidification and calcifying reef organisms: a mesocosm
investigation. Coral Reefs. 27, 473 - 483
Jones, E. B. G., and Byrne, P. J. 1976 Physiology of the higher marine fungi. In Recent
advances in aquatic mycology (ed. E. B. G. Jones), pp. 135-175. Elek Science:
London
Jones, C. G., Lawton, J. H., and Shachak, M. 1994 Organisms as ecosystem engineers.
Oikos. 69, 373 – 386

230
Jones, D. T., and Eggleton, P. 2000 Sampling termite assemblages in tropical forests: testing
a rapid biodiversity assessment protocol. Journal of Applied Ecology. 37, 191 - 203
Jones, M., Mandelik, Y., and Dayan, T. 2001 Coexistence of temporally partitioned spiny
mice: roles of habitat structure and foraging behaviour. Ecology. 82, 2164 – 2176
Joshi, H. and Ghose, M. 2003 Forest structure and species distribution along soil salinity and
pH gradient in mangrove swamps of the Sundarbans. Tropical Ecology. 44, 197 - 206
Kairo, J. G., Bosire, J., Langat, J., Kirui, B., and Koedam, N. 2009 Allometry and biomass
distribution in replanted mangrove plantations at Gazi Bay, Kenya. Aquatic
Conservation: Marine and Freshwater Ecosystems. 19, 63 - 69
Kalmis, E., Yasa, I., Kalyoncu, F., Pazarbasi, B., and Kocyigit, A. 2008 Ligninolytic enzyme
activities in mycelium of some wild and commercial mushrooms. African Journal of
Biotechnology. 23, 4314 - 4320
Kappes, H., Jabin, M., Kulfan, J., Zach, P., and Top, W. 2009 Spatial patterns of litter-
dwelling taxa in relation to the amounts of coarse woody debris in European
temperate deciduous forests. Forest Ecology and Management. 257, 1255 - 1260
Karban, R., and Myers, J. H. 1989 Induced plant responses to herbivory. Annual Review of
Ecology and Systematics. 20, 331 – 348
Karban, R., Agrawal, A. A., and Mangel, M. 1997 The benefits of induced defences against
herbivores. Ecology. 78, 1351 - 1355
Karieiva, P. 1982 Experimental and mathematical analyses of herbivore movement:
quantifying the influence of plant spacing and quality of foraging discrimination.
Ecological Monographs. 52, 261 – 282
Karlsson, O. M., Richardson, J. S., and Kiffney, P. M. 2005 Modelling organic matter
dynamics in headwater streams of south-western British Columbia, Canada.
Ecological Modelling. 183, 463 - 476

231
Kathiresan, K. and Bingham, L. B. 2001 Biology of Mangroves and Mangrove Ecosystems.
Advances in Marine Biology. 40, 81 - 251
Keith, P., Bosc, P. and Valade, P. 2004 A new species of Parioglossus (Gobioidei,
Ptereleotridae) from Seychelles islands. Cybium. 28, 341 - 344
Kenyon, R. A., Loneragan, N. R., Manson, F. J., Vance, D. J., and Venables, W. N. 2004
Allopatric distribution of juvenile red-legged banana prawns (Penaeus indicus H.
Milne Edwards, 1837) and juvenile white banana prawns (Penaeus merguiensis De
Man, 1888), and inferred extensive migration, the Joseph Bonaparte Gulf, northwest
Australia. Journal of Experimental Marine Biology and Ecology. 309, 79 – 108
Kjerfve, B., and Macintosh, D. J. 1997 The impact of climate change on mangrove
ecosystems. Proceedings of mangrove ecosystem studies in Latin America and
Africa sponsored by UNESCO, Brazil. 1993. pp.1 - 7
Kleypas, J. A. 1996 Coral reef development under naturally turbid conditions: fringing reefs
near Broad Sound, Australia. Coral reefs. 15, 153 - 167
Kohlmeyer, J., Bebout, B. and Volkmann-Kohlmeyer, B. 1995 Decomposition of mangrove
wood by marine fungi and teredinids in Belize. Marine Ecology. 16, 27 – 39
Komiyama, A., Poungparn, S., and Kato, S. 2005 Common allometric equations for
estimating the tree weight of mangroves. Journal of Tropical Ecology. 21, 471 - 477
Komiyama, A., Ong, J. E., and Poungparn, S. 2008 Allometry, biomass, and productivity of
mangrove forests: A review. Aquatic Botany. 89, 128 - 137
Korb, J., and Lenz, M. 2004 Reproductive decision-making in the termite, Cryptotermes
secundus (Kalotermitidae), under variable food conditions. Behavioural Ecology.
15, 390 – 395
Korb, J. 2008 The ecology of social evolution in termites. In: Ecology of Social Evolution
(eds. Korb, J., and Heinze, J.), Springer Press, Heidelberg, pp. 151 – 174
232
Kostylev, V. E., Erlandsson, J., Ming, M. Y., and Williams, G. A. 2005 The relative
importance of habitat complexity and surface area in assessing biodiversity: Fractal
application on rocky shores. Ecological Complexity. 2, 272 - 286
Krauss, K. W., Doyle, T. W., Twilley, R. R., Smith, T. T., Whelan, K. R. T., and Sullivan, J.
K. 2005 Woody debris in the mangrove forests of south Florida. Biotropica. 37, 9 -
15
Krauss, K. W., Lovelock, C. E., Mckee, K. L., Lopez-Hoffman, L., Ewe, S. M. L., and
Sousa, W. P. 2008 Environmental drivers in mangrove establishment and early
development: a review. Aquatic Botany. 89, 105 - 127
Kristensen, E., Bouillon, S., Dittmar, T., and Marchand, C. 2008 Organic carbon dynamics
in mangrove ecosystems: A review. Aquatic Botany. 89, 201 - 219
Kruitwagen, G., Nagelkerken, I., Lugendo, B. R., Mgaya, Y. D., and Bonga, W. 2010
Importance of different carbon sources for macroinvertebrates and fishes of an
interlinked mangrove-mudflat ecosystem (Tanzania). Estuarine, Coastal and Shelf
Science. 88, 464 – 472
Kurihara, H., Shimode, S., and Shirayama, Y. 2004 Sub-lethal effects of elevated
concentration of CO2 on planktonic copepods and sea urchins. Journal of
Oceanography. 60, 743 - 750
Kurihara, H., Kato, S., and Ishimatsu, A. 2007 Effects of increased seawater pCO2 on early
development of the oyster Crassostrea gigas. Aquatic Biology. 1, 91 - 98
Kwakkel-Hol, A. 2006 Tourism in Wakatobi Marine National Park. http://www.coral-
triangle.org. Accessed May 2012.
Laegdsgaard, P., and Johnson, C. 2001 Why do juvenile fish utilize mangrove habitats?
Journal of Experimental Marine Biology and Ecology. 257, 229 – 253
233
Lambert, R. L., Lang, G. E., and Reiners, W. A. 1980 Loss of mass and chemical change in
decaying boles of a subalpine balsam fir forest. Ecology. 61, 1460 - 1473
Lang, G. E., and Knight, D. H. 1979 Decay rates for the boles of tropical trees in Panama.
Biotropica. 11, 316 - 317
Larson, M. G., Booth, D. B., and Morley, S. A. 2001 Effectiveness of large woody debris in
stream rehabilitation projects in urban basins. Ecological Engineering. 18, 211 – 226
Laurance, W. F., Lovejoy, T. E., Vasconcelos, H. L., Bruna, E. M., Didham, R. K., Stouffer,
P. C., Gascon, C., Bierregaard, R. O., Laurance, S. G., and Sampaio, E. 2002
Ecosystem decay of Amazonian forest fragments: a 22-year investigation.
Conservation Biology. 16, 605 - 618
Laverty, R. 2002 Advanced engineered wood composits. Forest Products Journal. 52, 18 –
26
Lennartsson, T., Nilsson, P., and Tuomi, J. 1998 Induction of overcompensation in the field
gentian, Gentianella campestris. Ecology. 79, 1061 – 1072
Leonel, M. V. R., Lopes, S. G. B. C., de Moraes, D. T., and Aversari, M. 2006 The
interference of methods in the collection of teredinids (Mollusca, Bivalvia) in
mangrove habitats. Iheringia, Series of Zoology. 96, 25 - 30
Leponce, M., Roisin, Y., and Pasteels, J. M. 1995 Environmental influences on the arboreal
nesting termite community in New Guinean Coconut plantations. Community and
Ecosystem Ecology. 24, 1442 - 1452
Levi, H. W. 1967 Adaptations of respiratory systems of spiders. Evolution. 3, 571 – 583
Levin, S. A. 1992 The problem of pattern and scale in ecology: The Robert H. MacArthur
award lecture. Ecology. 73, 1943 - 1967
Lewis, M., Pryor, R., and Wilking, L. 2011 Fate and effects of anthropogenic chemicals in
mangrove ecosystems: A review. Environmental Pollution. 159, 2328 – 2346
234
Lira-Medeiros, C. F., Parisod, C., Fernandes, R. A., Mata, C. S., Cardoso, M. A., and
Ferreira, P. C. G. 2010 Epigenetic variation in variation in mangrove plants
occurring in contrasting natural environment. PloS One. 5, 1 - 8
Lonsdale, D., Pautasso, M., and Holdenrieder, O. 2008 Wood-decaying fungi in the forest -
conservation needs and management options. European Journal of Forest Research.
127, 1-22
Lugo, A. E. 1980 Mangrove ecosystems: Successional or steady state? Biotropica. 12, 65 -
72
Lugo, A. E., and Snedaker, S. C. 1974 The ecology of mangroves. Annual Review of
Ecology, Evolution and Systematics. 5, 39 - 64
Luo, J., Serafy, J. E., Sponaugle, S., Teare, P. B., and Kieckbusch, D. 2009 Movement of
grey snapper Lutjanus griseus among subtropical seagrass, mangrove, and coral reef
habitats. Marine Ecology Progress Series. 380, 255 – 269
MacDonald, J. A., Glover, T., and Weis, J. S. 2008 The impact of mangrove prop-root
epibionts on juvenile reef fishes: A field experiment using artificial roots and
epifauna. Estuaries and Coasts. 31, 981 – 993
MacDonald, J. A., Shahrestani, S., and Weis, J. S. 2009 Behaviour and space utilization of
two common fishes within Caribbean mangroves: implications for the protective
function of mangrove habitats. Estuarine, Coastal and Shelf Science. 84, 195 – 201
MacIntosh, H., Nys, R. D., and Whelan, S. 2012 Shipworms as a model for competition and
coexistence in specialized habitats. Marine Ecology Progress Series. 461, 95 - 105
Magurran, A. E. 2004 Measuring Biological Diversity. Blackwell Publishing: Oxford, UK
Malhi, Y., Meir, P., and Brown, S. 2002 Forests, carbon and global climate. Philosophical
Transactions of the Royal Society A: Physical, Mathematical and Engineering
Sciences. 360, 1567 - 1591

235
Manyak, D. M. 1982 A Device for the collection and study of Wood-boring Molluscs:
Application to Boring Rates and Boring Movements of the Shipworm Bankia gouldi.
Estuaries. 5, 224 - 229
Marchand, C., Lallier-Verges, E., and Baltzer, F. 2003 The composition of bulk sedimentary
organic matter in relation to the dynamic features of a mangrove-fringed coast in
French Guiana. Estuarine Coastal and Shelf Sciences. 56, 119 - 130
Marczak, L. B., and Richardson, J. S. 2007 Spiders and subsides: results from the riparian
zone of a coastal temperate rainforest. Journal of Animal Ecology. 76, 687 – 694
Maria, G. L., and Sridhar, K. R. 2002 Richness and diversity of filamentous fungi on woody
litter of mangroves along the West coast of India. Current Science. 83, 1573 - 1580
Maria, G. L., and Sridhar, K. R. 2003 Diversity of filamentous fungi on woody litter of five
mangrove plant species from the southwest coast of India. Fungal Diversity. 14, 109
- 126
Martinez-Alier, J. 2001 Ecological conflicts and valuation: mangroves versus shrimps in the
late 1990s. Environment and Planning C: Government and Policy. 19, 713 - 728
McArdle, B. H., and Anderson, M. J. 2001 Fitting multivariate models to community data: a
comment on distance-based redundancy analysis. Ecology. 82, 290 - 297
McDowall, R.M 2001 Parioglossus (Teleostei: Gobioidei: Microdesmidae) in New Zealand.
New Zealand Journal of Marine and Freshwater Research. 35, 165 – 172
McElhinny, C., Gibbons, P., Brack, C., and Bauhus, J. 2005 Forest and woodland stand
structural complexity: its definition and measurement. Forest Ecology and
Management. 218, 1 - 14
McInnes, K. L., Walsh, K. J. E., Hubbert, G. D., and Beer, T. 2003 Impact of sea-level rise
and storm surges on a coastal community. Natural Hazards. 30, 187 - 207
236
McKee, K. L., and Faulkner, P. L. 2000 Restoration of biochemical function in mangrove
forests. Restoration Ecology. 8, 247 – 259
Mckeon, C. S., and Feller, I. C. 2004 The supratidal fauna of Twin Cays, Belize. National
Museum of Natural History, Smithsonian environmental research center. Atoll
Research Bulletin. 526, 1 - 22
McLay, C. L., and Hayward, T. L. 1987 Reproductive biology of the intertidal spider Desis
marina (Araneae: Desidae) on a New Zealand rocky shore. Journal of Zoology. 2,
357 – 372
McLeod, E., and Salm, R. V. 2006 Managing mangroves for resilience to climate change.
IUCN. Gland, Switzerland. 64pp
McQueen, D. J., and McLay, C. L. 1983 How does the intertidal spider Desis marina
(Hector) remain under water for such a long time? New Zealand Journal of Zoology.
10, 383 – 392
McWilliams, J. P., Cote, I. M., Gill, J. A., Sutherland, W. J., and Watkinson, A. R. 2005
Accelerating impacts of temperature-induced coral bleaching in the Caribbean.
Ecology. 86, 2055 - 2060
Merritt, N. R. C., and Starr, C. K. 2010 Comparative nesting habits and colony composition
of three arboreal termites (Isoptera: Termitidae) in Trinidad and Tobago, West
Indies. Sociobiology. 56, 611 – 622
Michener, W. K., Blood, E. R., Bildstein, K. L., Brinson, M. M., and Gardner, L. R. 1997
Climate change, hurricanes and tropical storms, and rising sea level in coastal
wetlands. Ecological Applications. 7, 770 - 801
Middleton, A. B., and McKee, L. K. 2001 Degradation of mangrove tissues and implications
for peat formation in Belizean island forests. Journal of Ecology. 89, 818 - 828
237
Morse, D. H. 1997 Distribution, movement , and activity patterns of an intertidal wolf spider
Pardosa lapidicina population (Araneae, Lycosidae). The Jounal of Arachnology. 25,
1 – 10
Morton, B. 1983 Mangrove Bivalves. In: Wilbur, K. W. (ed.) The Mollusca, Vol. 2.
Academic Press, New York. p. 77 - 139
Muller-Karger, F. E., Varela, R., Thunell, R., Luerssen, R., Hu, C., and Walsh, J. J. 2005
The importance of continental margins in the global carbon cycle. Geophysical
Research Letters. 32, 1 – 4
Mumby, P. J., Edwards, A. J., Arias-Gonzalez, J. E., Lindeman, K. C., Blackwell, P. G.,
Gall, A., Gorczynska, M. I., Harborne, P. G., Pescod, C. L., Renken, H., Wabnitz, C.
C. C., and Llewellyn, G. 2003 Mangroves enhance the biomass of coral reef fish
communities in the Caribbean. Nature. 427, 533 – 536
Nagelkerken, I., and van der Velde, G. 2004 Are Caribbean mangroves important feeding
grounds for juvenile reef fish from adjacent seagrass beds? Marine Ecology Progress
Series. 274, 143 – 151
Nagelkerken, I., Blaber, S. J. M., Bouillon, S., Green, P., Haywood, M., Kirton, L. G.,
Meynecke, J. O., Pawlik, J., Penrose, H. M., Sasekumar, A. & Somerfield, P J. 2008
The habitat function of mangroves for terrestrial and marine fauna: A review.
Aquatic Botony. 89, 155 – 185
Nagelkerken, I., Schryver, A. M., Verweij, M. C., Dahdouh-Guebas, F., Van der Velde, G.,
and Koedam, N. 2010 Differences in root architecture influence attraction of fishes
to mangroves: A field experiment mimicking roots of different lengths, orientation
and complexity. Journal of Experimental Marine Biology and Ecology. 396, 27 - 34
Ng, P. K. L., and Sivasothi, N. 1999 A guide to the mangroves of Singapore. Singapore
Science Center, Singapore
238
Nilsson, T. 1973 Studies on wood degradation and cellulolytic activity of microfungi. Studia
Forestalia Suecica. No. 104
Nisbet, T. R. 2001 The role of forest management in controlling diffuse pollution in UK
forestry. Forest Ecology and Management. 143, 215 - 226
Nordhaus, I., and Wolff, M. 2007 Feeding ecology of the mangrove crab Ucides cordatus
(Ocypodidae): food choice, food quality and assimilation efficiency. Marine Biology.
151, 1665 – 1681
Novotny, V., Drozd, P., Miller, S. E., Kulfan, M., Janda, M., Basset, Y., and Weiblen, G. D.
2006 Why are so many species of herbivorous insects in tropical rainforests?
Science. 313, 1115 – 1118
Novotny, V., Miller, S. E., Hulcr, J., Drew, R. A. I., Basset, Y., Janda, M., Setliff., Darrow,
K., Stewart, A. J. A., Auga, J., Isua, B., Molem, K., Manumbor, M., Tamtiai, E,
Mogia, M., and Weiblen, G. D. 2007 Low beta diversity of herbivorous insects in
tropical forests. Nature. 448, 692 - 695
Nurminen, L., Horppila, J., and Pekcan-Hekim, Z. 2007 Effect of light and predator
abundance on the habitat choice of plant-attached zooplankton. Freshwater Biology.
52, 539 – 548
O’Connor, N. A. 1991 The effects of habitat complexity on the macroinvertebrates
colonising wood substrates in a lowland stream. Oecologia. 85, 504 - 512
Ong, J. E., Khoon, G. W., and Clough, B. F. 1995 Structure and productivity of a 20-year-
old stand of Rhizophora apiculata Bl. mangrove forest. Journal of Biogeography. 22,
417-424
Ong, J. E., Gong, W. K., and Wong, C. H. 2004 Allometry and partitioning of the mangrove,
Rhizophora apiculata. Forest Ecology and Management. 188, 395 - 408

239
Paige, K. N., and Whitham, T. G. 1987 Overcompensation in response to mammalian
herbivory: the advantage of being eaten. The American Naturalist. 129, 407 – 416
Paige, K. N. 1992 Overcompensation in response to mammalian herbivory: from mutualistic
to antagonistic interactions. Ecology. 73, 2076 – 2085
Paige, K. N. 1999 Regrowth following ungulate herbivory in Ipomopsis aggregata:
geographic evidence for overcompensation. Oecologia. 118, 316 – 323
Pandolfi, J. M., Bradbury, R. H., Sala, E., Hughes, T. P., Bjorndal, K. A., Cooke, R. G.,
McArdle, D., McClenachan, L., Newman, M. J. H., Paredes, G., Warner, R. R., and
Jackson, J. B. C. 2003 Global trajectories of the long-term decline of coral reef
ecosystems. Science. 301, 955 - 958
Parker, L. M., Ross, P. M., and O’Connor, W. A. 2009 The effect of ocean acidification and
temperature on the fertilization and embryonic development of the Sydney rock
oyster Saccostrea glomerata (Gould 1850). Global Change Biology. 15, 2123 - 2136
Perry, D. M. 1988 Effects of associated fauna on growth and productivity in the red
mangrove. Ecology. 69, 1064 - 1075
Petillon, J., Georges, A., Canard, A., Lafeuvre, J-C, Bakker, J. P., and Ysnel, F. 2008
Influence of abiotic factors on spider and ground beetle communities in different salt-
marsh systems. Basic and Applied Ecology. 9, 743 – 751
Petillon, J., Montaigne, W., and Renault, D. 2009 Hypoxia coma as a strategy to survive
inundation in a salt-marsh inhabiting spider. Biology Letters. 5, 442-445
Petren, K., and Case, T. J. 1998 Habitat structure determines competition intensity and
invasion success in gecko lizards. Proceedings of the National Acadamy of Science,
USA. 95, 11739 – 11744
Pi, N., Tam, N. F. Y., Wu, Y., and Wang, M. H. 2009 Root anatomy and spatial pattern of
radial oxygen loss of eight true mangrove species. Aquatic Botany. 90, 222-230
240
Pierce, S. K. 1982 Invertebrate cell volume control mechanisms: A coordinated use of
intracellular amino acids and inorganic ions as osmotic solute. Biological Bulletin.
163, 405 – 419
Pilgrim, S., Cullen, L., Smith, D., and Pretty, J. 2007 Hidden harvest or hidden revenue – a
local resource use in a remote region of Southeast Sulawesi, Indonesia. Indian
Journal of Traditional Knowledge. 6, 150 – 159
Plaziat, J.C. 1984 Mollusc distribution in the mangal. In: Por, F.D., Dor, I. (eds.),
Hydrobiology of the Mangal, The Ecosystem of the Mangrove Forests. Developments
in Hydrobiology 20. Dr. W. Junk Publishers, The Hague.
Poff, N. L., and Allan, D. J. 1995 Functional organization of stream fish assemblages in
relation to hydrological variability. Ecology. 76, 606 – 627
Polidoro, B. A., Carpenter, K. E., Collins, L., Duke, N. C., Ellison, A. M., Ellison, J. C.,
Farnsworth, E. J., Fernando, E. S., Kathiresan, K., Koedam, N. E., Livingstone, S. R.,
Miyagi, T., Moore, G. E., Nam, V. N., Ong, J. E., Primavera, J. H., Salmo III, S. G.,
Sanciangco, J. C., Sukardjo, S., Wand, Y., and Yong, J. W. H. 2010 The loss of
species: mangrove extinction risk and geographic areas of global concern. PLoS
ONE. 5, e10095.doi:10.1371/journal.pone.0010095
Polis, G. A., Anderson, W. B., and Holt, R. D. 1997 Toward an integration of landscape and
food web ecology: The dynamics of spatially subsidized food webs. Annual Review
of Ecology and Systematics. 28, 289 – 316
Prasad, M. B. K., and Ramanathan, A. L. 2008 Sedimentary nutrient dynamics in a tropical
estuarine mangrove ecosystem. Estuarine, Coastal and Shelf Science. 80, 60 – 66
Prasannarai, K., and Sridhar, K. R. 2003 Abundance and diversity of marine fungi on
intertidal woody litter of the West coast of India on prolonged incubation. Fungal
Diversity. 14, 127-141
241
Proffitt, E. C., and Devlin, D. J. 2005 Grazing by the intertidal gastropod Melampus coffeus
greatly increases mangrove leaf litter degradation rates. Marine Ecology Progress
Series. 296, 209 – 218
Progar, R. A., Schowalter, T. D., Freitay, C. M., and Morrell, J. J. 2000 Respiration from
coarse woody debris as affected by moisture and saprotroph functional diversity in
western Oregon. Oecologia. 124, 426-431
Ravikumar, M., Sridhar, K. R., Sivakumar, T., Karamchand, K. S., Sivakunmar, N., and
Vellaiyan, R. 2009 Diversity of filamentous fungi on coastal woody debris after
tsunami on the southeast coast of India. Czech Mycology Journal. 61, 107-115
Rayner, S. M. 1983 Distribution of teredinids (Mollusca: Teredinidae) in Papua New
Guinea. Records of the Australian Museum. 35, 61 – 76
Rehm, A. E. 1976 The effects of the wood-boring isopod Sphaeroma terebrans on the
mangrove communities of Florida. Environmental Conservation. 3, 47 - 57
Rehm, A., and Humm, H. J. 1973 Sphaeroma terebrans: a threat to the mangroves of
southwestern Florida. Science. 182, 173 - 174
Reiss, H., and Kroncke, I. 2005 Seasonal variability of benthic indices: An approach to test
the applicability of different indices for ecosystem quality assessment. Marine
Pollution Bulletin. 50, 1490 – 1499
Rennis, D.S. and Hoese, D. F 1985 A review of the genus Parioglossus, with descriptions of
six new species (Pisces: Gobioidei). Records of the Australian Museum. 36, 169–201
Riechert, S. E., and Tracy, R. C. 1975 Thermal balance and prey availability: bases for a
model relating web-site characteristics to sider reproductive success. Ecology. 56,
265 – 284
242
Ribi, G. 1982 Differential colonization of roots of Rhizophora mangle by the woodboring
isopod Sphaeroma terebrans as a mechanism to increase root density. Marine
Ecology. 3, 13 - 19
Ries, J. B., Cohen, A. L., and McCorkle, D. C. 2009 Marine calcifiers exhibit mixed
responses to CO2 induced ocean acidification. Geological Society of America. 12,
1131-1134
Rimmer, M. A., Battaglene, S. L., Dostine, P. L. 1983 Observations on the Distribution of
Bankia australis Calman (Mollusca: Teredinidae) in the Patonga Creek Mangrove
Swamp, New South Wales. Australian Journal of Marine and Freshwater Research.
34, 355–357
Roberts, C. M., McClean, C. J., Veron, J. E. N., Hawkins, J. P., Allen, G. R., McAllister, D.
E., Mittermeier, C. G., Schueler, F. W., Spalding, M., Wells, F., Vynne, C., and
Werner, T. B. 2002 Marine biodiversity hotspots and conservation priorities for
tropical reefs. Science. 295, 1280 – 1284
Robertson. I. A., 1985 The determination of trophic relationships in mangrove-dominated
systems: Areas of Darkness. Proceedings of the Research for Development Seminar
held at the Australian Institute of Marine Sciences. 291 - 304
Robertson, A. I., and Daniel, P. A. 1989a Decomposition and the annual flux of detritus
from fallen timber in tropical mangrove forests. Limnology and Oceanography. 34,
640 - 646
Robertson, A. I. 1990 Plant-animal interactions and the structure and function of mangrove
forest ecosystems. Australian Journal of Ecology. 16, 433 - 443
Roisin, Y., Dejean, A., Corbara, B., Orivel, J., Samaniego, M., and Leponce, M. 2006
Vertical stratification of the termite assemblage in a neotropical rainforest.
Oecologia. 149, 301 – 311

243
Ronnback, P., Troell, M., Kautsky, N., and Primavera, J. H. 1999 Distribution pattern of
shrimp and fish among Avicennia and Rhizophora microhabitats in the Pagbilao
mangroves, Philippines. Estuarine, Coastal and Shelf Science. 48, 223 – 234
Ronnback, P., Macia, A., Almqvist, G., Schultz, L., and Troell, M. 2002 Do penaeid shrimps
have a preference for mangrove habitats? Distribution pattern analysis on Inhaca
Island, Mozambique. Estuarine, Coastal and Shelf Science. 55, 427 – 436
Roonwal, M. L. 1954 The marine borer, Bactronophorus thoracities (Gould) [Mollusca,
Eulamellibranchiata, Teredinidae], as a pest of living trees in the mangrove forests of
the Sunderbans, Bengal, India. Proceedings of the Zoological Society. 7, 91 – 103
Roth, V. D. 1967 Descriptions of the spider families Desidae and Argyronetidae. American
Museum Novitates. 2292, 1 - 9
Roth, L. C. 1992 Hurricanes and mangrove regeneration: Effects of Hurricane Joan, October
1988, on the vegetation of Isla del Venado, Bluefields, Nicaragua. Biotropica. 24,
375 – 384
Roth, B. M., Kaplan, I. C., Sass, G. G., Johnson, P. T., Marburg, A. E., Yannarell, A. C.,
Havlicek, T. D., Willis, T. V., Turner, M. G., and Carpenter, S. R. 2007 Linking
terrestrial and aquatic ecosystems. The role of woody habitat in lake food webs.
Ecological Modelling. 203, 439 – 452
Rothenbucher, J., and Schaefer, M. 2006 Submersion tolerance in floodplain arthropod
communities. Basic and Applied Ecology. 7, 398 – 408
Rovner, J. S. 1987 Nests of terrestrial spiders maintain a physical gill: flooding and the
evolution of silk constructions. Journal of Arachnology. 14, 327 – 337
Royal Society, 2005 Ocean acidification due to increasing atmospheric carbon dioxide.
Policy document 12/05 Royal Society, London, The Clyvedon Press. Ltd, Cardiff

244
Ruxton, G. D., Sherrett, T. N., and Speed, M. P. 2004 Avoiding Attack: The Evolutionary
Ecology of Crypsis, Warning Signals and Mimicry. Oxford, UK: Oxford University
Press
Saha, N., Aditya, G., and Saha, G. K. 2009 Habitat complexity reduces prey vulnerability:
An experimental analysis using aquatic insect predators and immature dipteran prey.
Journal of Asia-Pacific Entomology. 12, 233 – 239
Sanchirico, J. N., and Mumby, P. 2009 Mapping ecosystem functions to the variation of
ecosystem services: implications of species-habitat associations for coastal land-use
decisions. Theoretical Ecology. 2, 67 – 77
Sarma, V. V., and Vittal, B. P. R. 2001 Biodiversity of manglicolous fungi on selected plants
in the Godavari and Krishna deltas, East coast of India. Fungal Diversity. 6, 115 -
130
Sasekumar, A. and Chong, V. C. 1998 Faunal diversity in Malaysian mangroves. Global
Ecology and Biogeography Letters. 7, 57 - 60
Scheltema, R. S. 1971 Dispersal of phytoplanktotrophic Shipworm larvae (Bivalvia:
Teredinidae) over long distances by ocean currents. Marine Biology. 11, 5 - 11
Schoener, T. W. 1971 Theory of feeding strategies. Annual Review of Ecology and
Systematics. 2, 369 – 404
Schories, D., Barletta-Bergan, A., Barletta, M., Krumme, U., Meklig, U., and Rademaker, V.
2003 The keystone role of leaf-removing crabs in mangrove forests of North Brazil.
Wetlands Ecology and Management. 11, 243 - 255
Selden, P. A. 2001 Eocene spiders from the Isle of Wight with preserved respiratory
structures. Palaeontology. 44, 695 – 729
Seymour, R. S., and Hetz, S. K. 2011 The diving bell and the spider: the physical gill of
Argyroneta aquatica. The Journal of Experimental Biology. 214, 2175 – 2181
245
Sheaves, M. 2005 Nature and consequences of biological connectivity in mangrove systems.
Marine Ecology Progress Series. 302, 293 - 305
Sherman, E. R., Fahey, J. T. and Martinez, P. 2003 Spatial patterns of biomass and
aboveground net primary productivity in a mangrove ecosystem in the Dominican
Republic. Ecosystems. 6, 384 - 398
Shields, J. R. F. D., Knight, S. S., and Stofleth, J. M. 2006 Large woody addition for aquatic
habitat rehabilitation in an incited, sand-bed stream, Little Topashaw Creek,
Mississippi. River Research and Applications. 22, 803 – 817
Shirvell, C. S. 1990 Role of instream rootwads as juvenile Coho salmon (Oncorhynchus
kisutch) and steelhead trout (O. mykiss) cover habitat under verying streamflows.
Canadian Journal of Fisheries and Aquatic Sciences. 47, 852 – 861
Si, A., Bellwood, O., and Alexander, C. G. 2002 Evidence for filter-feeding by the wood-
boring isopod, Sphaeroma terebrans (Crustacea: Peracarida). The Journal of
Zoology. 256, 463 - 471
Simberloff, D., Brown, B. J., and Lowrie, S. 1978 Isopod and insect root borers may benefit
Florida mangroves. Science. 201, 630 – 632
Smith, N. F., Wilcox, C., and Lessmann, J. M. 2009 Fiddler crab burrowing affects growth
and production of the white mangrove (Laguncularia racemosa) in a restored Florida
coastal marsh. Marine Biology. 156, 2255 - 2266
Smock, L. A., Metzler, G. M., and Gladden, J. E. 1989 Role of debris in the structure and
functioning of low-gradient headwater streams. Ecology. 70, 764 – 775
Sousa, W. P., Quek, S. P., Mitchell, B. J. 2003 Regeneration of Rhizophora mangle in a
Caribbean mangrove forest: interacting effects of canopy disturbance and a stem-
boring beetle. Oecologia. 137, 437 – 445

246
Spalding, M. D., Blasco, F., and Field, C. D. (eds) 1997 World Mangrove Atlas. The
international society for mangrove ecosystems, Okinawa, Japan
Spanhoff, B., Alecke, C., and Meyer, E. I. 2001 Simple method for rating the decay stages of
submerged woody debris. Journal of the North American Benthological Society. 20,
385 – 394
Spurr, E. B., and McGregor, P. G. 2003 Potential invertebrate antifeedants for toxic baits
used for vertebrate pest control. Science for Conservation. 232, 1 - 36
Storry, K. A., Weldrick, C. K., Mews, M., Zimmer, M., and Jelinski, D. E. 2006 Intertidal
coarse woody debris: A spatial subsidy as shelter or feeding habitat for gastropods?
Estuarine, Coastal and Shelf Science. 66, 197 – 203
Strauss, S. Y., and Agrawal, A. A. 1999 The ecology and evolution of plant tolerance to
herbivory. Tree. 14, 179 – 185
Suzuki, T. and Senou, H. 1994 Parioglossus interruptus, a new species of goby from the
western Pacific. Japanese Journal of Ichthyology. 41, 281–286
Svavarsson, J., Melckzedeck, O. K. W., and Olafsson, E. 2002 Does the wood-borer
Sphaeroma terebrans (Crustacea) shape the distribution of the mangrove Rhizophora
mucronata ? Ambio. 31, 574 – 579
Syms, C., and Jones, G. P. 2000 Disturbance, habitat structure, and the dynamics of a coral-
reef fish community. Ecology. 81, 2714 – 2729
Taniguchi, H., and Tokeshi, M. 2004 Effects of habitat complexity on benthic assemblages
in a variable environment. Freshwater Biology. 49, 1164 - 1178
Tank, J. L., and Winterbourn, M. J. 1995 Biofilm development and invertebrate colonization
of wood in four New Zealand streams of contrasting pH. Freshwater Biology. 34,
303 – 315

247
Tank, J. L., and Winterbourn, M. J. 1996 Microbial activity and invertebrate colonisation of
wood in a New Zealand forest stream. New Zealand Journal of Marine and
Freshwater Research. 30, 271 – 280
Taylor, J. R., Cook, M. M., Kirkpatrick, S. N., Galleher., Eme, J., and Bennett, W. A. 2005
Thermal tactics of air-breathing and non air-breathing Goboids inhabiting mangrove
tidepools on Palau Hoga, Sulawesi, Indonesia. Copeia. 4, 886 - 893
Taylor, D.S., Turner, B.J., Davis, W.P. & Chapman, B.B. 2008 A novel terrestrial fish
habitat inside emergent logs. American Naturalist. 171, 263 – 266
Tedersoo, L., Koljalg, U., Hallenberg, N., and Larsson, K. H. 2003 Fine scale distribution of
ectomycorrhizal fungi and roots across substrate layers including coarse woody
debris in a mixed forest. New Phytologist. 159, 153 - 165
The Singapore Red Data Book. 2008 www. wildsingapore. com/wildfacts /arachnida/
desis.htm. Accessed May 2010
Tomascik, T., Mah, A. J., Nontji, A., and Moosa, M. K. 1997 The Ecology of the Indonesian
Seas Part Two. The ecology of Indonesia series, volume VIII. Periplus Editions,
Singapore.
Tse, P., Nip, T. H. M., and Wong, C. K. 2008 Nursery function of mangrove: a comparison
with mudflat in terms of fish species composition and fish diet. Estuarine, Coastal
and Shelf Science. 80, 235 – 242
Turner, R. D. 1966 A Survey and Illustrated Catelogue of the Teredinidae (Mollusca:
Bilvalvia). Harvard, The Museum of Comparative Zoology. pp. 265
Turner, R.D., 1971 Identification of Marine Wood Boring Molluscs. In: Jones, E.B.G.,
Eltringham, S.K. (Eds.), Marine Borers and Fouling Organisms of Wood. OECD,
Paris, pp. 17 – 64

248
Turner, R. D. 1976 Some Factors Involved in the Settlement and Metamorphosis of Marine
Bivalve Larvae. In: J. M., Sharpley and A. M. Kaplan, eds., Proceedings of the 3rd
International Biodegradation Symposium. Applied Science, Barkin, UK. 409 - 416
Unsworth, R. K. F., De Leon, P. S., Garrard, S. L., Jompa, J., Smith, D. J., and Bell. J. J.
2008 High connectivity of Indo-Pacific seagrass fish assemblages with mangrove
and coral reef habitats. Marine Ecology Progress Series. 353, 213 – 224
Valiela, I., Bowen, J. L., and York, J. K. 2001 Mangrove forests: one of the world’s
threatened major tropical environments. Bioscience. 51, 807 – 815
Verweij, M. C., Nagelkerken, I., de Graaff, D., Peeters, M., Bakker, E. J., and van der Velde,
G. 2006 Structure, food and shade attract juvenile coral reef fish to mangrove and
seagrass habitats: a field experiment. Marine Ecology Progress Series. 306, 257 –
268
Vittal, B. P. R., and Sarma, V. V. 2006 Diversity and ecology of fungi on mangroves of Bay
of Bengal region – an overview. Indian Journal of Marine Sciences. 35, 308 - 317
Walters, B. B. 2005a Patterns of local wood use and cutting of Philippine mangrove forests.
Economic Botany. 59, 66 – 76
Walters, B. B. 2005b Ecological effects of small-scale cutting of Philippine mangrove
forests. Forest Ecology and Management. 206, 331 - 348
Walters, B. B., Rounback, P., Kovacs, J. M., Crona, B., Hussain, S. A., Badola, R.,
Primavera, J. H., Barbier, E., and Dahdouh-Guebas, F. 2008 Ethnobiology, socio-
economics and management of mangrove forests: A review. Aquatic Botany. 89, 220
- 236
Wang, M., Huang, Z., Shi, F., and Wang, W. 2009 Are vegetated areas of mangroves
attractive to juvenile and small fish? The case of Dongzhaigang Bay, Hainan Island,
China. Estuarine, Coastal and Shelf Science. 85, 208 – 216

249
Warfe, D. M., and Barmuta, L. A. 2004 Habitat complexity mediates the foraging success of
multiple predator species. Oecologia. 141, 171 – 178
Weedon, J. T., Cornwell, W.K., Cornelisson, H. C., Zanne, A. E., Wirth, C., and Coomes, D.
A. 2009 Global meta-analysis of wood decomposition rates: a role for trait variation
among tree species. Ecology Letters. 12, 45 - 56
Wier, A. M., Schnitzler, M. A., Tattar, T. A., Klekowski, JR, E. J., and Stern, A. I. 1996
Wound periderm development in red mangrove, Rhizophora mangle L. International
Journal of Plant Science. 157, 63 - 70
Wilkie, M. L., and Fortuna, S. 2003 Status and trends in mangrove area extent Worldwide,
Indonesia. http://www.fao.org/docrep/007/j1533e/j1533E46.htm. Accessed July 2010
Willis, S. C., Winemiller, K. O., and Lopez-Fernandez, H. 2005 Habitat structural
complexity and morphological diversity of fish assemblages in a Neo-tropical
floodplain river. Oecologia. 142, 284 - 295
Woodroffe, C. D. 1982 Geomorphology and development of mangrove swamps, Grand
Caymen Island, West Indies. Bulletin of Marine Science. 32, 381 – 398
Worrall, J. J., Anagnost, S. E., and Zabel, R. A. 1997 Comparison of wood decay among
diverse lignicolous fungi. Mycologia. 89, 199 - 219
Wright, J. P., Jones, C. G., and Flecker, A. S. 2002 An ecosystem engineer, the beaver,
increases species richness at the landscape scale. Oecologia. 132, 96 – 101
Wright, J. P., and Flecker, A. S. 2004 Deforesting the riverscape: the effects of wood on fish
diversity in a Venezuelan piedmont stream. Biological Conservation. 120, 439 – 447
250
Xavier, J. H. D. A., Cordeiro, C. A. M. M., Tenorio, G. D., Diniz, A. D. F., Junior, E. P. N.
P., Rosa, R. S., and Rosa, I. L. 2012 Fish assemblages of the Mamanguape
Environmental Protection Area, NE Brazil: abundance, composition and
microhabitat availability along the mangrove-reef gradient. Neotropical Ichthyology.
10, 109 - 122
Yulianto, E., Sukapti, W. S., Rahardjo, A. T., Noeradi, D., Siregar, D. A., Suparan, P., and
Hirakawa, K. 2004 Mangrove shoreline responses to Holocene environmental
change, Makassar Strait, Indonesia. Review of Palaeobotany and Palynology. 131,
251 – 268
Yusef, A. A., and Francisco, H. 2009 Climate Change Vulnerability Mapping for Southeast
Asia. Economy and Environment Program for Southeast Asia (EEPSEA). Singapore