Payyanur Khadi Centre..
70
INTRODUCTION The study was conducted in Payyanur khadi centre, Kerala to find the effectiveness of labour welfare measures. The study intends to see the satisfaction level of labours on the facilities provided by the khadi board and how these welfare measures boost the labour morale. The study on effectiveness of labour welfare measures gives the management an indication of the level of satisfaction among the labours regarding the general working condition and the other facilities provided by the organization. This helps the management to know the general morale of labours. And can help the board to implement effective welfare measures. In this project all the discussions are evolved around labour welfare measures of Payyanur khadi centre. The details of khadi such as objectives, functions and labour welfare measures are stated in this report. Payyanur khadi centre is a pioneer in manufacturing and selling khadi products to the people of India. 1
-
Upload
jithin-k-chandran -
Category
Documents
-
view
993 -
download
21
Transcript of Payyanur Khadi Centre..

INTRODUCTION
The study was conducted in Payyanur khadi centre, Kerala to find the effectiveness of labour welfare measures. The study intends to see the satisfaction level of labours on the facilities provided by the khadi board and how these welfare measures boost the labour morale. The study on effectiveness of labour welfare measures gives the management an indication of the level of satisfaction among the labours regarding the general working condition and the other facilities provided by the organization. This helps the management to know the general morale of labours. And can help the board to implement effective welfare measures.
In this project all the discussions are evolved around labour welfare measures of Payyanur khadi centre. The details of khadi such as objectives, functions and labour welfare measures are stated in this report. Payyanur khadi centre is a pioneer in manufacturing and selling khadi products to the people of India.
1

COMPANY PROFILE
Khadi is an Indian fabric and it is also known by another name ‘Khaddar’. It is made by spinning the threads on an instrument known as ‘Charkha’. During pre-independence era the movement of khadi manufacturing gained momentum under the guidance of father of nation Mahatma Gandhiji. This movement of khadi manufacturing and wearing started as to discourage the Indians from wearing of foreign clothes. Its concept was developed by Mahatma Gandhi. It was a symbol for political agendas during the fight for independence in India against the British rule. It was primarily a means to provide employment to the unemployed rural population of India at that time. The Indian flag has to be also made from khadi material. Thus it holds national importance; we could even call it the national fabric of India. It has the unique property of keeping the wearer warm in winter as well as cool in summer season. This fabric has coarse texture and gets easily crumpled, therefore in order to keep it firm and stiff, starch is to be added. This fabric on washing is more enhanced thus the more you wash it, better the look. Khadi is not easily worn out for years together, at least for 4-5 years. Very attractive and designer apparel are made by doing handwork on them garments made from it. Khadi spinning is generally done by girls and women and weaving mostly by men. During spinning of khadi the threads are interwoven in such a manner that it provides passage of air circulation in the fabric. Apart from this unique property, it also provides warmth in winter season which is quite surprising factor.
Khadi cotton is required to be starched so that it does not get easily crumpled. It comes in many colors and is not harmful to the skin as synthetic fabrics. This cotton is very soothing in summer season as ample amount of air ventilation is there, it has the capacity to absorb moisture therefore it easily soaks the sweat and keeps the wearer cool and dry. Khadi cotton comes in plain as well as in printed fabrics. The most common outfit of made from khadi cotton is the ‘Kurta’. Many types of apparel are manufactured from khadi cotton like saris, salwar suits, fabric yarns, western tops, shirts, trousers, skirts, handkerchief, etc. It is a very durable fabric.
2

In khadi silk, the ratio of khadi and silk fabric is 50:50. This fabric requires dry cleaning. It shrinks about 3% after the first wash. It is quite an expensive fabric. Khadi silk provides a royal and rich look. The various types of apparels made from khadi silk are salwar kameez, kurta pajama, saris, dupattas, shirts, vest and jackets. Apparels like kurta, jacket, sari blouses requires lining to be given to ensure its longetivity.Previously khadi was dyed in earthy color tones and was used to make traditional garments but now designers are experimenting by dyeing khadi with striking colors like limegreen, violet, baby pink, turquoise blue, etc. Stylish garments like mini skirts, halter neck tops, racer tops, tunics, etc are made from khadi.Khadi is hand woven and hand spun fabric which takes time to be made. It is mainly manufactured in rural areas of India. In previous times it was considered as the fabric for the poor rural workers & farmers. But wearing khadi is no more for the poor, many high profile personalities and economically sound people prefer to wear it. It is considered as one of the most beautiful Indian fabric. The khadi wearer gets a royal and distinguishable look due to its fall and style. It symbolizes luxury and uniqueness.
Khadi & Village Industries and their role in rural development The Kerala Gandhi Smark Nidhi, which is the sate unit of the National Gandhi Memorial Fund, New Delhi, has been functioning from 1951, though it was formally registered under Travancore Cochin Charitable Societies Act in the year 1962 only. It is a matter of great satisfaction that Sri.K.Janardanan Pillai, who has been associated with this great organization from day ones, and who is the motive force, is with us and is able to practicipate in the Golden Jubilee Celebrations. Kerala Gandhi Smarak Nidhi is a unique organization, which has attempted from the beginning, to concretize almost all the aspects of Gandhian Constructive Programmes, literally all over this State, right from Parassala in South to Kasargode in the North. It was emboldened to attempt this daunting task, because of the form resolve of a galaxy of leaders, social activities, and field workers, whom the founding fathers could identify and bring in its fold. Legendary figures like Sarva Sree K.Kelappan, K.P.Madhavan Nair, K.Radhakrishna Menon, and a host of other equally great personalities devoted a lot of time, and selfless service, to bring up this noble body. A second line of organisers, with considerable clout in their respective areas, secured valuable land by Multi purpose rural development
3

centres. Gandhi Smarak Seva Kendrams were organised utilizing local leadership in over a dozen localities a senior worker of Nidhi, proving regular liason with the parent body-by the first half of 1980s 64 rural development centres were set up, which extended a variety of services to rural artisans, agriculturists, women and children.
4

INDUSTRY PROFILE
Payyanur was a major center of promotion of Khadi and still retain this tradition. Even today we can see a lot of people wearing Khadi in Payyanur which is not commonly seen in other parts of Kerala. This Khadi movement was started in Payyanur by the great freedom fighter of Payyanur, CH Govindan Nambiar. Unnamman Unithiri of Karivellur and Vaidyar VP Sreekanda Poduval also did a lot for the promotion and propagation of Khadi. The patriotic poems of Mahakavi Kuttamath and KeluNair also helped Khadi movement.
The Khadi movement was a part of the Independence struggle. In order to boycott the foreign clothes, Gandhiji called upon the people to make their clothes by themselves. Khadar or Khadi is the cloth made of hand-spurn thread using the simple instruments like 'charkha". The 'charkha' was also selected as the emblem in the national flag during the freedom struggle.
The organization called Charka Sangh was formed in 1925 with Head Office at Wardah and Gandhiji was the president of this society until his death. The motive of this society was to promote and circulate Khadi among the people. In 1930, NP Raghava Poduval of Shornur (popularly known as Raghavji) came to Payyanur for the formation and operation of Charka Sangh. In 1934 Payyanur was selected as the Head Office of Charka Sangh's Kerala Unit and CK. Kartha (Ernakulam) was the first secretary of the HO. After this charkas became popular in Payyanur and the surrounding places. The thin and soft cloth made in Payyanur Khadi Sangh gained nation wide attraction and it got the brand name as "Payyanur Special". When Gandhiji visited Payyanur in 1934, the Khadi activities of Payyanur was specially congratulated by him .During 1937-39 when Rajaji became the Chief minister of Madras State ( Payyanur was a part of Madras State) a Charka-making unit was started in Payyanur with the Government financing. In 1941 the Head Office of the Kerala Charka Sangh was shifted from Payyanur to Kozhikode Gandhi Asramam but the production and selling units remained here. In 1946, the then Chief Minister of Madras, T. Prakasam, after consulting with Gandhiji, took a decision to takeover five Khadi Centers and Payyanur Center was one among them. Gradually the Charka Sangh faded out of the picture and the Center fully came under the Government control. The Payyanur Farka Gramodaya Khadi Sangham was started in 1958 . VP Narayana Poduval, E. Narayanan Nair and N. Raghava Shenoy were the promoters of this new center. Later this center came under the control of Kerala Khadi &Village Industries Board.
5

Even though it is very difficult to compete with the modern industrial world of today under the new liberalization atmosphere, Payyanur Khadi is trying its level best to survive. It is the responsibility of each individual of Payyanur to do whatever he/she can to keep this industry alive and thus to retain the rich tradition.
6
CHRONOLOGY OF EVENTS
1920 Nagpur session (1920) the Indian National Congress decided to encourage "Khadi". The first Khadi Production Centre was established at Katiawad, Gujarat, Mahatma Gandhi used to refer to Khadi as "The livery of freedom
1923 Development of All India Board under the Indian National Congress by Gandhiji. 1925 Setting up of All India Spinners Association (AISA) / Akhil Bharat Charkha Sangh
1935 All India Village Industries Association (AIVIA) was formed.
1946 Govt. of Madras sought the advice of Gandhiji and set up a Department for Khadi.
1948 Govt. of India recognized the role of Rural Cottage Industries in the Industrial Policy Resolution, 1948. Constituent Assembly included Cottage Industries in Rural Areas among the directive Principles of the Constitution in Article 43. These ideas were elaborated in the First five-year Plan, which laid down the Policy framework for setting up of a body for Khadi and Village Industries. Central Govt. also recommended for setting up of a Board.
1953 In accordance with these recommendations, Govt. of India set up All India Khadi & Village Industries Board in January, 1953. (AIKVIB)
1955 It was decided that a statutory body should replace the Board.
1956 Khadi and Village Industries Commission Act 1956 was passed.
1957 Kerala Khadi and Village Industries Board Act (Act IX) was passed and The Board came into existence.
OBJECTIVES OF KHADI
7

The Kerala Khadi and Village Industries Board is a statutory body constituted by the act of 1957, vested with the responsibility of organizing and promoting Khadi and village industries in the state. The board implements the programs through co-operative, registered institutions, individuals and departmental units by imparting/availing assistance from Government of Kerala, Khadi commission and nationalized banks.
Promotion of Khadi and Village industries. Comprehensive range of support to Khadi and Village Industry
entrepreneurs. Marketing support to the beneficiary units of the board Co-ordination and monitoring of around 25000 units, which have, came
up in Kerala with the assistance of board. Providing training to potential entrepreneurs in various sectors including
weaving and spinning, pottery, bee keeping and host of other activities. Formulation and implementation of focused programs and schemes for
the revival of sick industries and units. Providing technical assistance to the upcoming units in order to
materialize the objectives, board has formulated various schemes and implemented them successfully.
FUNCTIONS OF KHADI
8

Some of the major functions of KKVIC are……
The KKVIC is charged with the planning, promotion, organization and
implementation of programs for the development of Khadi and other
Village Industries in the rural areas in coordination with other agencies
engaged in rural development where ever necessary.
Its function also comprise building up of a reserve of raw materials and
implements for supply to producers, creation of common service facilities
for processing of raw materials as finished goods and provision of
facilities for marketing of Khadi village industries products apart from
organization of training of artisans engaged in these industries and co-
operative efforts amongst them.
To promote the sale and marketing of Khadi and/or products of village
industries or handicrafts, the KKVIC may forge linkages with established
marketing agencies where ever feasible and necessary.
The KKVIC is also charged with the responsibility of encouraging and
promoting research in the production techniques and equipment employed
in the KHADI AND VILLAGE INDUSTRIES sector and providing
facilities for the study of the problems relating to it.
The KKVIC is entrusted with the task of providing financial assistance to
institutions and individuals for development and operation of KHADI
AND VILLAGE INDUSTRIES and guiding them through supply of
designs, prototypes and other technical information.
The KKVIC may also undertake directly or through other agencies studies
concerning the problems of KHADI and /or VILLAGE I NDUSTRIES
besides research or establishing pilot projects for the development of
KHADI AND VILLAGE INDUSTRIES.
9

Government PoliciesKhadi and village industries commission’ is the Indian government body which
promotes the usage of khadi. Khadi production and selling comes under the small
10

scale industry sector. This government body was created by an act which was
passed by the Parliament. This gave a boost to the khadi manufacturing sector of
India, as a result many new outlets of khadi gramodyog opened all over the
country. These shops sell stitched as well as unstitched khadi fabrics. Every year
starting from the date- 3rd October to January 29th all khadi gramodyog bhavans
provide discount to the public on various khadi products. It comes under the
category of Indian handloom. This sector also generates employment for the rural
population of India. Indian government conducts various exhibitions and trade fairs
in India and abroad to promote this fabric.
The small scale industries engaged in manufacturing of khadi gets economic
redemption for the raw materials and production costs by Indian government.
According to a recent survey done it provides employment to 14.97 lakhs of
people, the total annual production of khadi is 111.49 million sq. mtrs.
Khadi over the decades has moved from a freedom fighter’s identity fabric to a
fashion garment. Today there is such an increasing demand for khadi that despite
of the thousands of workers involved in spinning and producing khadi fabric, the
demand of the market does not gets fulfilled.
OBJECTIVES OF THE STUDY
Primary Objective
11

To study the effectiveness of Labour welfare measures in Payyanur Khadi centre.
Secondary Objectives
To find out the importance of labour welfare measures in Khadi and Village Industries.
To analyze the role of labour welfare measures in Khadi and Village Industries.
To study the problems those are facing by the workers in Payyanur khadi centre.
12

RESEARCH METHODOLOGY
RESEARCH – MEANINGResearch is an art of scientific investigation. According to Redmen and Mary defines research as a “systematic effort to gain knowledge”. Research methodology is way to systematically solve the research problem. It is a plan of action for a research project and explains in detail how data are collected and analyzed. This research study is a descriptive research study.
RESEARCH DESIGN
A research design is a plan that specifies the objectives of the study, method to be adopted in the data collection, tools in data analysis and hypothesis to be framed. “A research design is an arrangement of condition for collection and analysis of data in a manner that aims to combine relevance to research purpose with economy in procedure”.
NATURE OF DATAa) Primary data
The primary data are collected from the labours of Payyanur khadi centre through a direct structured questionnaire.
b) Secondary dataCompany profiles, websites, magazines, articles were used widely as a support to primary data.
SAMPLING SIZE AND TECHNIQUE
Size of the sample
It refers to the number of items to be selected from the universe to Constitute as a sample. In this study 25 employees of Payyanur khadi centre in Kerala was selected as size of sample.
Sample design The sampling technique used in this study is simple random sampling method. This method is also called as the method of chance selection. Each and every item of population has equal chance to be included in the sample.
13

Population design The population of this study is the total employee in the company. It is finite population. There are different processing units for the organization, for this study I have taken only labours in two processing units.
Questionnaire The questions are arranged logical sequence. The questionnaire consists of a variety of questions presented to the labours for the response.
STATISTICAL TOOLS USED
To analyze and interpret collected data percentage method was used.
Percentage method
The percentage is used for making comparison between two or more series of da ta . I t i s used to c lass i fy the opinion of the respondent for d i f ferent fac tors . I t i s calculated as
14
[No: of respondents’ favorable ÷ Total no: of respondents’] × 100

LIMITATIONS OF THE STUDY
Time is the major limit in factor of the study. The result of the study is mainly depends on the information given by
the respondents, which may be sometimes biased. The workers are not ready to expose them self. The study suffers from the limitation of focus group opinion that is
generalizing the opinion of a relatively small number of respondents.
15

1.1) Table showing number of labours in different units.
PAYYANUR KHADI CENTRE, PAYYANUR
Details of production centres
S.No: Name of the unit Numbers of labours
Spinning UnitKannur District
1 Alakkad 182 Chapparappadavu 103 Cheruthazham 94 Eruvassi 175 Ettukudukka 96 Ezhom 327 Kadannappalli 298 Kakkara 229 Kannapuram 2310 Karivellur 911 Koluvalli 612 Kookkanam 713 Koorara 714 Kottiyodi 3215 Kovvappuram 1516 Koyyam 2217 Kunhimangalam 2018 Kuttur 1219 Malappattam 2220 Maloor 2021 Manantheri 2322 Mathil 2023 Mavilayi 1224 Meloor 1925 Nelloonni 2426 Pappinissery 527 Parassinikkadavu 228 Paradu 4
16

29 Parayaram 2630 Pilathara 1831 Pinarayi 2532 Bishap House, Thalassery 1733 Pattuvam 1934 Pazhayangadi 2335 Peringom 836 Pullupara 2337 Punchakkadu 2038 Thalipparamba 839 Thannada 1440 Thekkumbadu 2741 Vimalassery 1542 Peralassery 1143 Vellur 2044 Papparatta 4145 Punnachery 646 Panthakkappara 2347 Payam 848 Velladu 849 Peravoor 1450 Paravoor 751 Mathamangalam 25
Kasaragod District52 Bheemanadi 1653 Elerithattu 1654 Kadumeni 1055 Kallyottu 1156 Kayyoor 3557 Kodakkadu 2958 Korayichal 1159 Madikkai 1760 Thrikkaripur 1361 Nileswar 1862 Parappa 463 Poyinachi 1164 Ramnagar 865 Valiyapoyyil 19
17

66 Cheruvathur 3067 Karimoola 3268 Munnadu 17
Total 1153
Weaving unitFor other related
activitiesKannur District
1 Anchampeedika 42 332 Cherukunnu 10 53 Eruvassy 6 104 Ettukudukka 6 35 Kakkara 17 56 Kannavamkolani 14 37 Kookkanam 10 68 Kunhimangalam 34 69 Kuttyattur 10 610 Kunnaru 19 411 Kannadiparamba 9 1112 Malappattam 16 113 Maloor 14 1214 Mananthery 18 915 Muthathy 25 416 Naduvil 15 617 Nelloonni 24 818 Papparatta 18 919 Nettoor 10 620 Parassinikkadavu 7 121 Pariyaram 7 522 Peralassery 4 223 Peravoor 37 424 Pullupara 8 525 Ramanthali 8 226 Thimiri 14 927 Karivellur 10 528 Kandoth 8 3
Kasaragod District29 Bheemanadi 4 3
18

30 Cheruvathur 15 831 Kayyoor 19 632 Kolamkulam 5 633 Korayichal 10 534 Parappa 10 435 Periyanganam 28 636 Ramnagar 6 637 Valiyapoyyil 16 638 Thrikkaripur 5 139 Elambachi 20 6
KHADI SUB CENTRES1 Karivellur 15 -2 Vellur 34 -3 Kunhimangalam 9 -4 Pazhayangadi 20 -5 M.C.P.S Payyanur 10 -
Total 646 240
19
1.2) Table showing details of staff strength
Details of Staff StrengthSl. No Designation Sanctioned
postNo: of Staffs
Working1 Director 12 Project Officer 1 13 Assistant Registrar 1 14 Junior Accounts Officer 15 Village Industrial Officer 16 Office Manager 17 Store Superintendent 18 Manager Godown 19 Junior Superintendent 210 SG/UD/LD Typist 311 Clerk Cum Typist 112 Store Keeper 113 UD/LD/1st Gr/2nd Gr: Assistant 20 1114 Boy Attender/Peon/Boy Assistant15 Assistant Manager/Manager KGS 3 116 SCI/JCI 4 317 Store Assistant 118 KEO/KDO/TA Khadi 319 Beekeeping Field Man 1 220 Loom Inspector 121 Carpenter 122 Spinning/Weaving Instructor 70 6223 Village Oil Instructor 124 Driver 225 Amber Manager 126 Dye House Manager 127 Training Centre Instructor 2
Total 134 87
20

LABOUR WELFARE
The term labour welfare means the efforts to make life worth living for workmen. It includes anything that is done for the comfort and improvement of employees and is provided over and above the wages. Welfare helps in keeping the morale and motivation of the employees high so as to retain the employees for longer duration. The welfare measures need not be in monetary terms only but in any kind/forms. Employee welfare includes monitoring of working conditions, creation of industrial harmony through infrastructure for health, industrial relation and insurance against diseases, accidents and unemployment for the workers and their families. Labor welfare entails all those activities of employer, which are directed towards providing the employees with certain facilities and services in addition to wages or salaries.Labour welfare fund is a deduction from the employee wages as well as from the employer side according to the state government slab and submitted to the department.
The benefit is for the labours whose wages are below Rs.50/- can avail the hospitality and the insurance facility by the state government free of cost.
21

INCENTIVES TO KHADI ARTISANS
Khadi Sector in Kerala at present employs 12000 artisans, mostly women below the poverty line. Since we have built in infrastructures in the form of work shed, godown and marketing outlets, there is lot of scope for raising the number of beneficiaries by another 20,000 without additional investment on infrastructure. At the same time, having regard to the high rural wage level in the state, the artisans expect a comparatively high wage in spinning and weaving too. Further the weavers in handloom sector, who weave khadi too, expect wages on par with the rate in handloom sector. Introduction of more weavers ensures additional employment to 6 times their number in spinning. In the back ground it is necessary to provide incentive to spinners and weavers, to enhance production and ensure reasonable income to the artisans. Since this sector employs women more particularly unemployed house wives, the expansion of work in this sector will help poverty alleviation in villages.
With a view to continue the spinners and weavers in the khadi sector and attract more artisans to this sector, the government is providing incentive to artisans based on their production. The present rate of production incentives to khadi artisans are given below
Spinners = 30 paise per Hank for spinning.
Weavers =90 paise per Hanks consumed by the weaver
22

WELFARE MEASURES OF KHADI
The government of Kerala gives full support to the Khadi sector in extending welfare measures to the Khadi artisans. The state government has constituted a separate board viz. Kerala Khadi workers welfare fund board which is unique in the country. The state government extends financial support in the form of contribution to the fund. The welfare fund board has three regional officers for its smooth functioning. Every artisan has worked as a Khadi worker for a period of 240 days is eligible for membership to the fund. He/She has to contribute 12% of their annual wage to the fund, and equal amounts (12%) by the Khadi institution and the government.
The following benefits are extended to the artisans from the welfare fund board:
Superannuation pension * Minimum pension (10 year service) = Rs 300/-
* Maximum pension (30 years service) = Rs 700/-
Disability pension(Minimum 2 years service is required) = Rs 100/-
Family pension- rate of superannuation pension Medical benefits for one financial year up to Rs 750/- Funeral benefits Rs 500/- Assistance for marriage of women artisans or daughters = Rs 2000/- Maternity benefits (only for 2 times) (2 year continuous service is necessary)
= Rs 750/-
EDUCATIONAL BENEFITS
23

1) For children studying above SSLC up to Rs 500/- per year2) For engg/medicine/agriculture/veterinary up to Rs 3000/- per year
INSURANCE SCHEME OF KHADI ARTISANSPresently the KVIC is running an insurance scheme titled “Khadi Karinagar Janasree Bheema Yogana” for the welfare of Khadi artisans. As per this scheme Rs 20,000/- is given for natural death and Rs 50,000/- for accidental death, Rs 50,000/- is provided for permanent disability due to accident and Rs 25,000/- for partial disability. Education benefit of Rs 1200/- per year is admissible from Std IX to XII. The premium amount of Rs 200 is met from the following sources.Government of India Rs 100/-KVIC Rs 50/-KVIB Rs 25/-Artisans Rs 25/-
24

ORGANIZATIONAL STRUCTUREOF KERALA KHADI LABOUR WELFARE BOARD FOR THE YEAR 2011
Name Position
K.Dhananjayan Chairman
P.Somarajan Pillai Chief Executive Officer
T.Govindan Ex Officio
P.Rajendradas Board Member
K.P.Gopala Poduval Board Member
K.O.Paulose Board Member
Mohan Raju Board Member
H.Hashim Board Member
25

Data analysis and Interpretation
2.1) Table showing the number of years of experience of workers
Experience Frequency Percentage
Less than 5 years 28 28
5-10 years 28 28
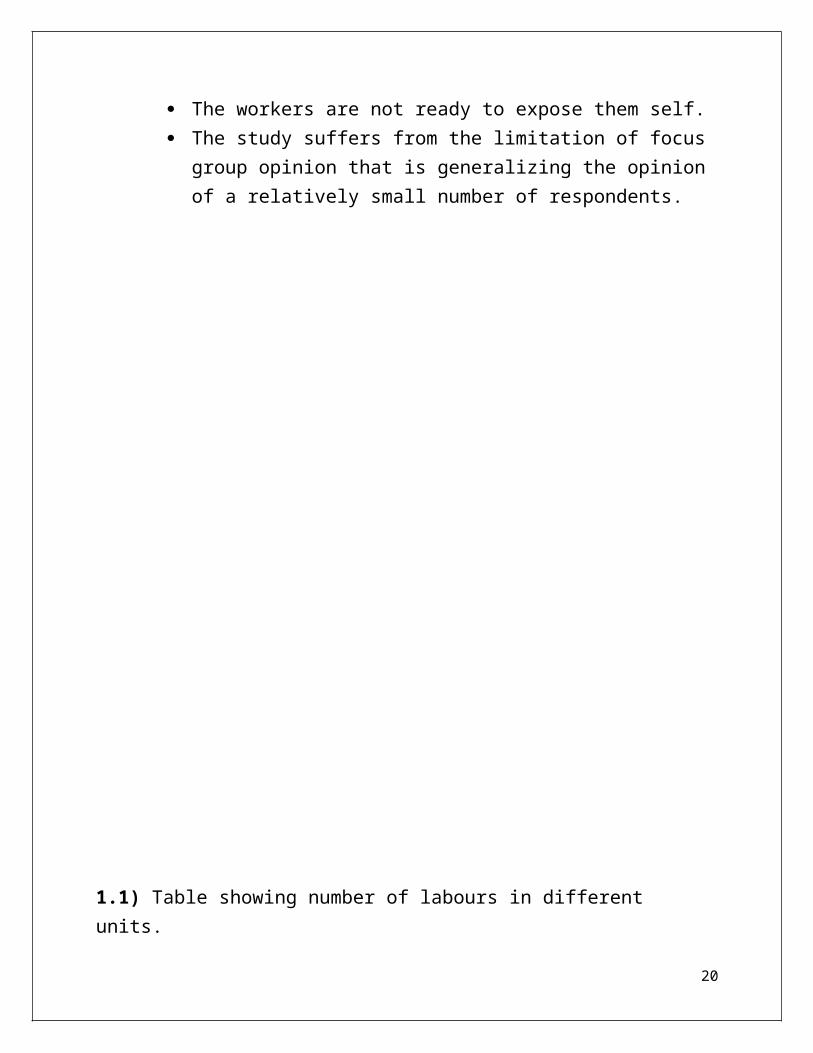
10-20 years 32 32
More than 20 years 12 12
Inference:
From the above Table and Chart it is clear that 28% of the workers has less than 5 years of experience,28% has between 5 years and 10 years of experience, 32%workers has between 10 years and 20 years of experience and 12% workers has more than 20 years of experience.
3.1) Chart represents the work experience of labours.
Less than 5 years
5-10 years 10-20 years More than 20 years
05
101520253035
Experience
26

2.2) Table showing number of workers those who are eligible for workers welfare measures of khadi.
opinion frequency Percentage
yes 100 100
no 0 0
3.2) Chart represents the number of labours eligible for welfare measures.
yes no0
20
40
60
80
100
120
Eligibility
Inference:
From the above Table and Chart it is clear that all the workers who were undergone this study is eligible for the workers welfare measures of khadi.
27

2.3) Table showing the welfare measures that are prevalent now.
OPINION Frequency PercentageAll the welfare measures 48 48Medical benefit and educational benefit
28 28
Medical benefit and insurance benefit
24 24
None of these 0 0
2.3) Chart represents the welfare measures that are prevalent now.
4828
24
0
Welfare Measures
Inference:
From the above table and chart 48% of the workers are enjoying all the welfare measures, 28% of workers are enjoying medical benefit and educational benefit, and 24% workers are enjoying medical benefit and insurance benefit and no one is working without having any welfare measures.
28

2.4) Table showing the family protection scheme provided by the institution
Opinion Frequency Percentage
Yes 64 64
No 36 36
3.4) Chart represents family protection scheme of labours.
yes No
64
36
Family Protection Scheme
Inference:
From the above table and chart, its clear that 64% of the workers has family protection scheme provided by the Institution and 36% has no such scheme.
29

2.5) Table showing whether the welfare measures are beneficial to the workers
Opinion Frequency Percentage
Yes 96 96
No 4 4
3.5) Chart represents whether the welfare measures are beneficial to the workers.
96%
4%
Benefit
Inference:
From the above Table and Pie Chart it’s clear that 96% of the workers are satisfied with the present beneficial measures and 4% are not.
30

2.6) Table showing whether the worker applied for Mediclaim
Opinion Frequency Percentage
Yes 20 20
No 80 80
3.6) Chart represents the percentage of labours that are applied for mediclaim.
Yes No0
102030405060708090
Applied for Mediclaim
Inference:
Above table and chart showing 20% of the workers are applied for mediclaim and 80% of workers are not.
31

2.7) Table showing reimbursement of mediclaim.
Opinion Frequency Percentage
Yes 20 20
No 0 0
Not applicable 80 80
3.7) Chart represents the reimbursement of mediclaim.
Yes No Not applicable0
10
20
30
40
50
60
70
80
Reimbursement of mediclaim
Inference:
From the above table and chart we can interpret that 20% of the workers got the applied amount of mediclaim. 80% of the workers are not applied for the mediclaim benefit.
32

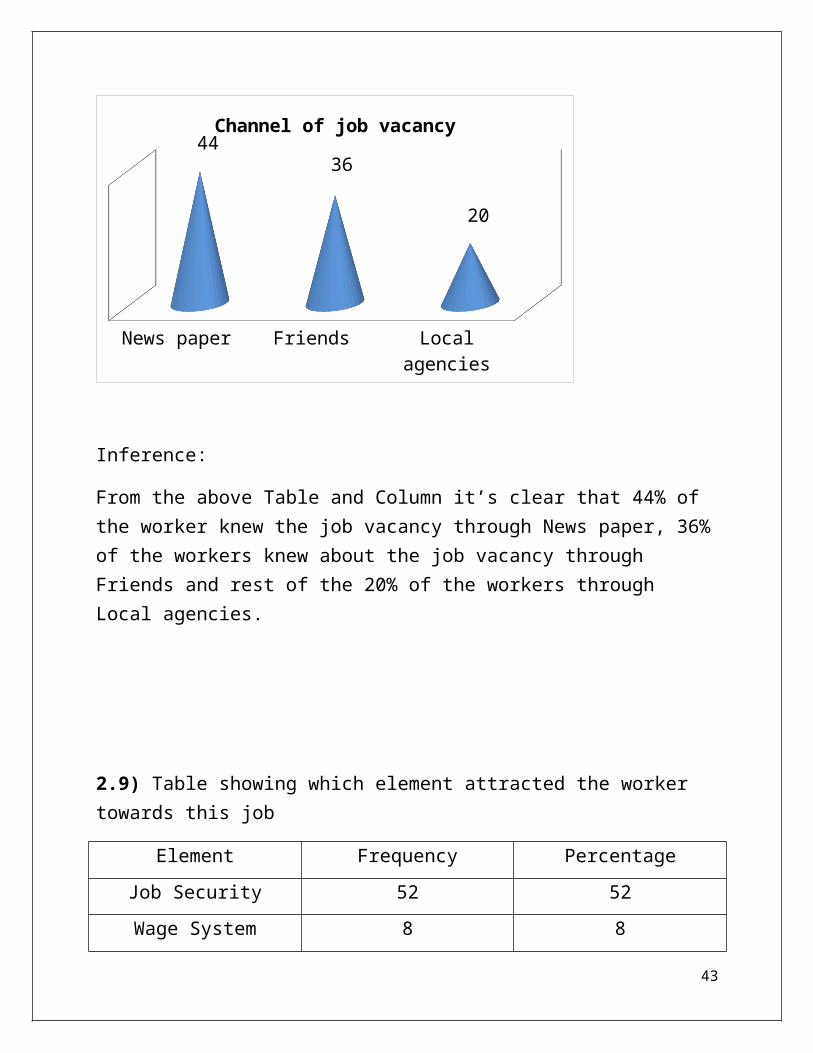
2.8) Table showing how the workers came to know about the job vacancy.
Channel Frequency Percentage
News paper 44 44
Friends 36 36
Local agencies 20 20
3.8) Chart represents the channel of job vacancy.
News paper Friends Local agencies
4436
20
Channel of job vacancy
Inference:
From the above Table and Column it’s clear that 44% of the worker knew the job vacancy through News paper, 36% of the workers knew about the job vacancy through Friends and rest of the 20% of the workers through Local agencies.
33
2.9) Table showing which element attracted the worker towards this job
Element Frequency Percentage
Job Security 52 52
Wage System 8 8
Work Environment 40 40
3.9) Chart represents the element of attraction towards the job.
Job Security
Wag
e Syste
m
Work Enviro
nment
0
20
40
60
Element of attraction
Frequency
Inference:
From the above table and chart its clear that 52% of the workers are attracted by job security, 8% are attracted by wage system and 40%of workers are attracted by Work Environment.
34

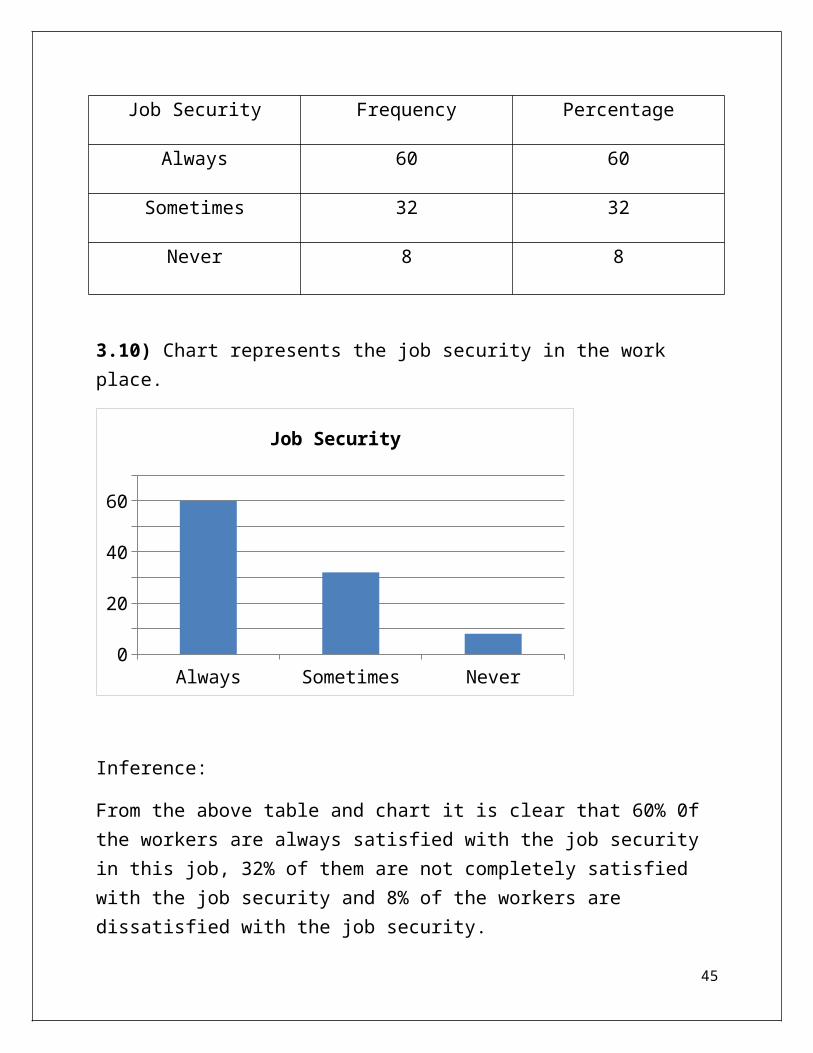
2.10) Table showing Job security in work place.
Job Security Frequency Percentage
Always 60 60
Sometimes 32 32
Never 8 8
3.10) Chart represents the job security in the work place.
Always Sometimes Never0
10203040506070
Job Security
Inference:
From the above table and chart it is clear that 60% 0f the workers are always satisfied with the job security in this job, 32% of them are not completely satisfied with the job security and 8% of the workers are dissatisfied with the job security.
35

2.11) Table showing the workers attitude towards piece rate wage system
Opinion Frequency PercentageStrongly agree 8 8
Agree 32 32Disagree 36 36
Strongly disagree 24 24
3.11) Chart represents the attitude of labours towards piece rate wage system.
Strongly agree Agree Disagree Strongly disagree
05
10152025303540
Piece rate wage System
Inference:
From the above table and chart it is clear that 8% of the workers are strongly agree with piece rate wage system,32% of the workers are agree with the piece rate wage system, 36% of the workers are disagree with the present wage system and 24% of them are strongly disagree with the piece rate wage system.
36

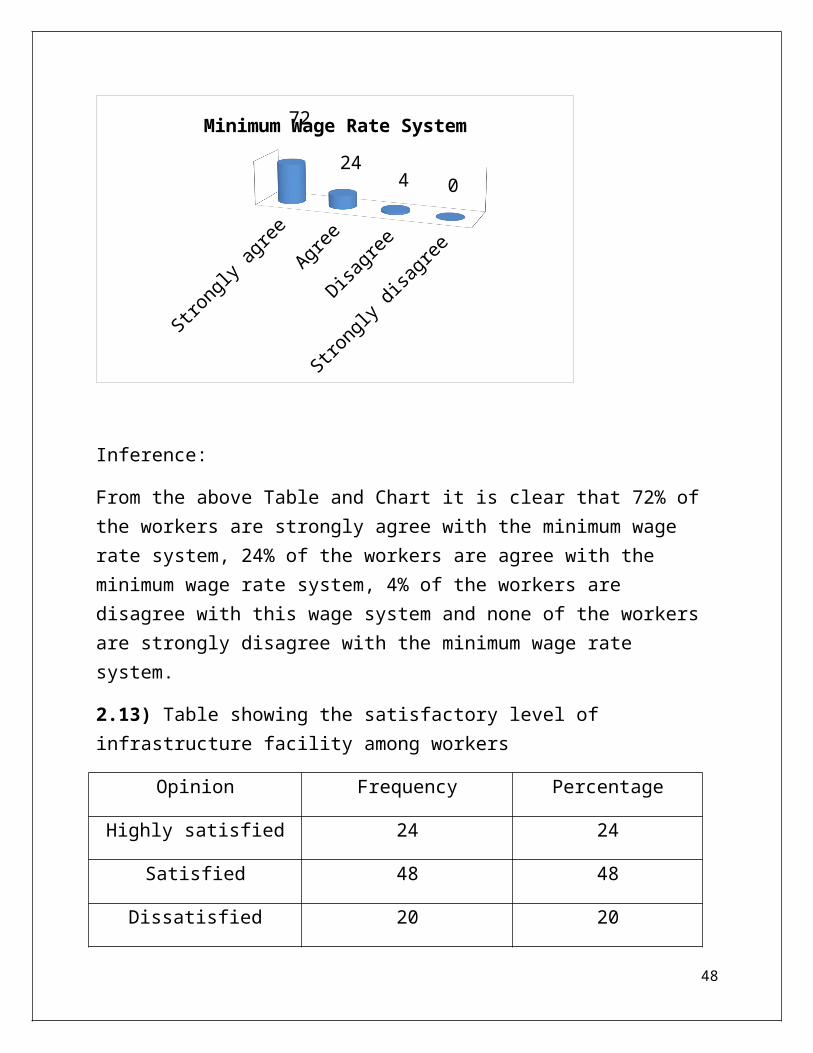
2.12) Table showing the necessity of minimum rate wage system.
Opinion Frequency Percentage
Strongly agree 72 72
Agree 24 24
Disagree 4 4
Strongly disagree 0 0
3.12) Chart represents the opinion of labours towards minimum wage rate system.
Strongly agree Agree Disagree Strongly
disagree
72
24
40
Minimum Wage Rate System
Inference:
From the above Table and Chart it is clear that 72% of the workers are strongly agree with the minimum wage rate system, 24% of the workers are agree with the minimum wage rate system, 4% of the workers are disagree with this wage system and none of the workers are strongly disagree with the minimum wage rate system.
37

2.13) Table showing the satisfactory level of infrastructure facility among workers
Opinion Frequency Percentage
Highly satisfied 24 24
Satisfied 48 48
Dissatisfied 20 20
Highly dissatisfied 8 8
3.13) Chart represents the satisfactory level of labours about the infrastructure.
Highly satisfied Satisfied Dissatisfied Highly dissatisfied05
101520253035404550
Infrastructure
Inference:
It is clear that 24% of the workers are highly satisfied with the infrastructure in the work place, 48% of them are satisfied, 20% of the workers are dissatisfied with the present infrastructure facility and 8% of them are highly dissatisfied.
38

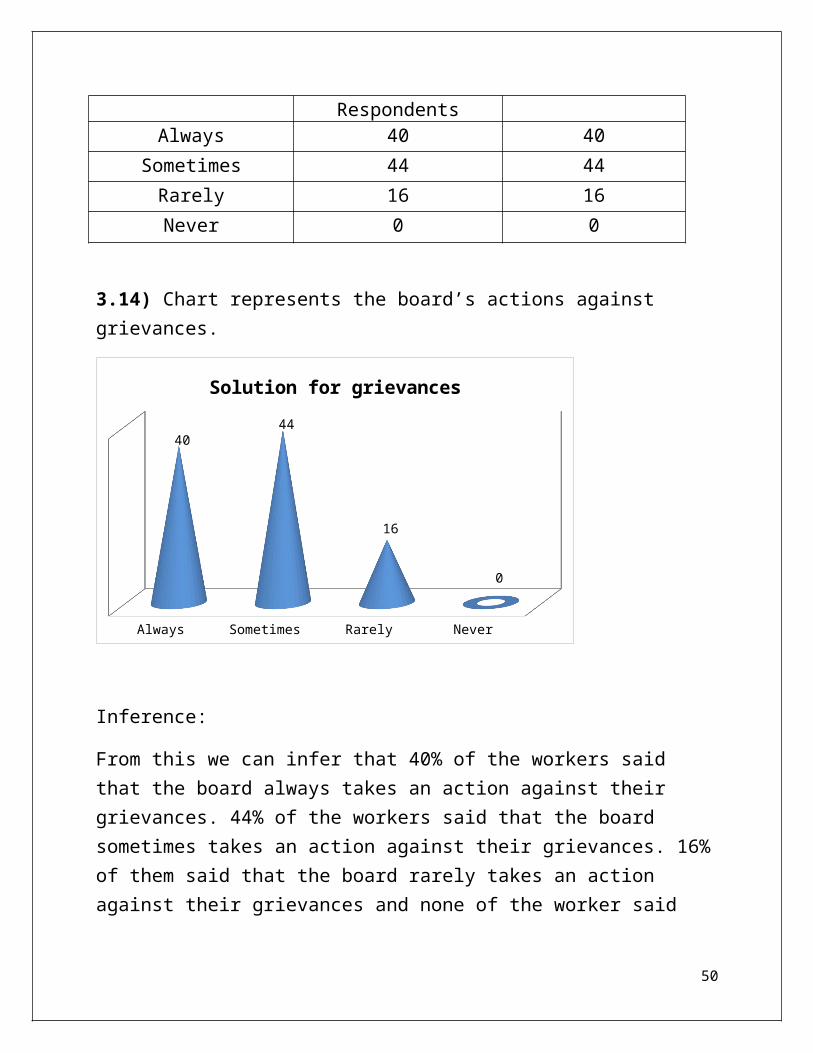
2.14) Table showing opinion of labours regarding board’s actions against labour grievances
Opinion No: of Respondents Percentage
Always 40 40
Sometimes 44 44
Rarely 16 16
Never 0 0
3.14) Chart represents the board’s actions against grievances.
Always Sometimes Rarely Never
4044
16
0
Solution for grievances
Inference:
From this we can infer that 40% of the workers said that the board always takes an action against their grievances. 44% of the workers said that the board sometimes takes an action against their grievances. 16% of them said that the board rarely takes an action against their grievances and none of the worker said that the board never takes an action against their grievances.
39

2.15) Table showing the level of communication between supervisors and labours.
Opinion Frequency Percentage
High 44 44
Moderate 48 48
Low 8 8
3.15) Chart represents the level of communication between supervisors and labours
44%
48%
8%
Level of communication between supervisors and workers
High Moderate Low
Inference:
From the above table we can infer that 44% of the workers said that there is a high level of communication between supervisors and workers, 48% stated that there is a moderate level of communication between supervisors and workers and 8% of them stated that there is a low level of communication between supervisors and workers.
40

2.16) Table showing the relationship between supervisors and workers.
Opinion Frequency Percentage
Cordial 36 36
Moderate 56 56
Low 8 8
3.16) Chart represents the relationship between supervisors and workers.
Cordial Moderate Low
36
56
8
Relationship between supervisors and workers
Inference:
From the above table and chart it is clear that the 36% of the workers opinion is that the relationship between supervisors and workers is cordial, 56% of the workers opinion is that the relationship between supervisors and workers is moderate and 8% of the workers stated that the relationship between supervisors and workers is low.
41

2.17) Table showing the relationship between co-workers.
Opinion No: of respondents Percentage
Cordial 84 84
Moderate 16 16
Low 0 0
3.17) Chart represents the relationship between co-workers.
Cordial Moderate Low0
20
40
60
80
100
Relationship between co-workers
Inference:
From the above table and chart we can infer that 84% of the workers opinion is that there is a cordial relationship between co-workers, 16% of the workers stated that there is a moderate relationship between co-workers and none of them stated that there is a low relationship between co-workers.
42
2.18) Table showing whether the workers feel under employment in this area.
Opinion No: of respondents Percentage
Always 16 16
Sometimes 40 40
Never 44 44
3.18) Chart showing whether the workers feel under employment in this sector.
Always Sometimes Never0
10
20
30
40
50
Under employment
Inference:
From this table and chart we can infer that 16% of the workers always feel under employment, 40% of the workers sometimes feel under employment and 44% of workers never feel under employment in this sector.
43

2.19) Table showing whether the institution following mechanization.
Opinion No: of respondents Percentage
Strongly agree 36 36
Agree 56 56
Disagree 8 8
Strongly disagree 0 o
3.19) Chart represents whether the institution following mechanization.
Strongly agree
Agree Disagree Strongly disagree
36
56
80
Mechanization
Inference:
From this table and chart it is clear that 36% of the workers are strongly agree with the statement, 56% of them are agree, 8% of them are disagree with the statement and none of them are strongly disagree with the statement.
44
2.20) Table showing satisfactory level of labours regarding welfare and safety measures of Payyanur khadi centre.
Opinion No: of respondent Percentage
Yes 40 40
No 60 60
3.20) Chart showing satisfactory level of labours.
Yes40%No
60%
Satisfactory level
Inference:
From the above table and chart we can infer that 60% of the workers are not satisfied with the safety and welfare measures of khadi and 40% of the workers are satisfied with the safety and welfare measures of khadi.
45

FINDINGS
Service is the primary motive of this enterprise. Most of the workers are well experienced persons in this sector. All the workers who were undergone this study is eligible for labour welfare
measures of Khadi. 68% 0f the workers are enjoying all the welfare measures of Khadi. Most of the workers are the member of family protection scheme. The welfare measures of Khadi are beneficial to a large number of workers. Most of the workers are not applied for the Mediclaim at any circumstances
and the people who are applied for the mediclaim were made beneficial to them.
Most of the people attracted towards this job by the job security that are provided by the Institution.
Most of the workers are not satisfied with the infrastructure. Most of the workers are not satisfied with the present labour welfare
measures of khadi and they are demanding a fixed rate wage system.
46

SUGGESTIONS
Many of the workers are supporting the minimum wage rate system. That means a fixed rate wage system; this may help the workers to work effectively and efficiently in all the seasons.
The Institution can provide drinking water facility for the workers. The Institution can improve the grievance handling system so that they can
increase the workers satisfaction. Change in Climatic condition is negatively affecting the spinning workers,
to reduce this problem the Institution should find out some solution. The people who are in the dyeing section have not that much job security, if
the Institution verifies their needs it may help them to work effectively. The labours who are working in the cotton processing unit needs the mask
and helmet to avoid lung diseases and skin diseases.
47
CONCLUSION
From this report it is crystal clear that the khadi is mainly focusing on service motive and of course it is surviving only because of the government grants. The study on effectiveness of labour welfare measures helps the board to know the satisfaction level of the labours about the welfare measures provided by the Institution. From this study we can infer that the majority of the employees are not satisfied with the welfare measures. So that the Institution can primarily concentrate on the labour welfare measures and secondly focuses on other facilities like drinking water facility, uniform, and safety measures to inspire the labour morale. The board has to consider the fixed rate wage system to boost the labours. Then only the productivity achieves the target.
48

QUESTIONNAIRE
Name of the respondent:Place :Age :Qualification : Below SSLC SSLC Higher secondary Under graduation
1) Number of years of experience
a) below 5 years b) 5-10years c) 10-20years
d) more than 20 years
2) Are you eligible for Khadi workers welfare measures? Yes No
3) Which are the welfare measures that you are prevalent now?a) All the welfare measuresb) Medical benefit and Educational benefitc) Medical benefit and Insurance benefitd) None of these
4) Have you any family protection scheme provided by the Institution? Yes No
5) Is this welfare measures are beneficial to you? Yes No
6) Do you ever applied for the mediclaim at any circumstances? Yes No
7) Did you get the allowed amount? Yes No Not applicable
8) Are you enjoying the Festival allowance? Yes No
9) How would you come to know about the job Vacancy? Through
a) News paper b) Friends c) Local agencies 10) Which element attracted you towards this job?
49
a) Job security b) wage system c) work environment11) Do you feel job security in this field?
a) Always b) Sometimes c) Never
12) Piece rate wage system is correct wage system.a) Strongly agree b) agree c) disagree d) strongly
disagree 13) Minimum wage system is necessary
a) Strongly agree b) agree c) disagree d) strongly disagree
14) Do you satisfied with the infrastructure?a) Highly satisfied b) satisfied c) dissatisfied
d) highly dissatisfied 15) Whether the climatic conditions influence the productivity?
Yes No16) Level of communication with supervisors and workers
a) High b) moderate c) low 17) Relationship between supervisors and workers
a) Cordial b) moderate c) indifferent 18) Relationship between co-workers
a) Cordial b) moderate c) low 19) Does the board solve all your grievances?
a) Always b) sometimes c) Rarely d) never 20) Institution is following Job Rotation in some areas
a) Strongly agree b) agree c) disagree d) strongly disagree
21) Following mechanization in some areasa) Strongly agree b) agree c) disagree d) strongly
disagree22) Are you feeling under employment in this sector?
a) Always b) sometimes c) never23) Are you satisfied with the work you do?
a) Always b) sometimes c) rarely d) never 24) In general are you satisfied with the welfare and safety measures
given by the Kerala khadi board?
50

Yes No25) Kindly give your suggestions for any desired improvements in the
Current welfare system ……………………………………………………………………..
51

52