
Partnership for Safe Water - Guidelines for Phase IV ... utility management...Partnership for Safe...
18
Partnership for Safe Water Guidelines for Phase IV Application for the “Excellence in Water Treatment” Award February 2003 (Revised March 2011) Objective of Phase IV The objective of Phase IV is to provide recognition to plants that have achieved the highest possible levels of turbidity performance. Utilities that are considering pursuing Phase IV recognition must understand that they will be assessed against very stringent performance goals. Phase IV represents a much higher performance level over Phase III of the Partnership. Participation in Phase IV is voluntary and is not required for continuing membership in Phase III of the Partnership program. But a treatment plant must be a Phase III award plant in good standing to apply for Phase IV. Plants successfully completing Phase IV will receive the “Excellence in Water Treatment” award. Phase IV provides recognition to those plants that: A. Demonstrate that they have addressed the parameters in the “areas of improvement” and “areas of good faith effort” identified during the PEAC assessment of their Phase III activities and brought them all into an “area of strength.” B. Demonstrate that they are obtaining the high levels of performance by meeting or bettering the Partnership for Safe Water Phase IV Performance Goals listed in Table 1. C. Demonstrate the capability to maintain these levels of performance long-term by addressing the issues in the complacency/reliability guidelines presented in Table 2. For Phase IV, the performance goals in Table 1 will be based on all turbidity values from individual filters at 15-minute intervals. This is a significant change from Phase III where 4-hour data from combined filter effluent was used. This will mean that utilities meeting the performance goals in Phase III may not achieve Phase IV performance. In working with performance goals that are the basis for Phase IV, the Partnership for Safe Water would like those utilities participating in this phase to understand the following position statement regarding the use of numerical performance goals by the Partnership program.
Transcript of Partnership for Safe Water - Guidelines for Phase IV ... utility management...Partnership for Safe...
Partnership for Safe Water
Guidelines for Phase IV Application for the “Excellence in Water Treatment” Award February 2003
(Revised March 2011)
Objective of Phase IV The objective of Phase IV is to provide recognition to plants that have achieved the highest possible levels of turbidity performance. Utilities that are considering pursuing Phase IV recognition must understand that they will be assessed against very stringent performance goals. Phase IV represents a much higher performance level over Phase III of the Partnership. Participation in Phase IV is voluntary and is not required for continuing membership in Phase III of the Partnership program. But a treatment plant must be a Phase III award plant in good standing to apply for Phase IV. Plants successfully completing Phase IV will receive the “Excellence in Water Treatment” award. Phase IV provides recognition to those plants that:
A. Demonstrate that they have addressed the parameters in the “areas of improvement” and “areas of good faith effort” identified during the PEAC assessment of their Phase III activities and brought them all into an “area of strength.”
B. Demonstrate that they are obtaining the high levels of performance by meeting or bettering the
Partnership for Safe Water Phase IV Performance Goals listed in Table 1. C. Demonstrate the capability to maintain these levels of performance long-term by addressing the
issues in the complacency/reliability guidelines presented in Table 2. For Phase IV, the performance goals in Table 1 will be based on all turbidity values from individual filters at 15-minute intervals. This is a significant change from Phase III where 4-hour data from combined filter effluent was used. This will mean that utilities meeting the performance goals in Phase III may not achieve Phase IV performance. In working with performance goals that are the basis for Phase IV, the Partnership for Safe Water would like those utilities participating in this phase to understand the following position statement regarding the use of numerical performance goals by the Partnership program.

Table 1. Partnership for Safe Water Phase IV Performance Goals
General Data Monitoring Requirements
Daily raw water turbidity
Settled water turbidity at 4-hour time increments from each sedimentation basin
On-line (continuous) turbidity from each filter
One turbidity profile, that includes a backwash profile, from the filter run with the maximum value for each month
Combined filter effluent at 4-hour time increments
Individual Sedimentation Basin Performance Goals Settled water turbidity less than 1.0 NTU 95 percent of the time when raw water
turbidity is less than or equal to 10 NTU
Settled water turbidity less than 2.0 NTU 95 percent of the time when raw water turbidity is greater than 10 NTU
Individual Filter Performance Goals Filtered water turbidity less than 0.10 NTU 95 percent of the time based on
values recorded at 15 minute time intervals
96th, 97
th, 98
th, 99
th percentile values that indicate consistent filter performance
Maximum filtered water turbidity equal to or less than 0.30 NTU
Maximum backwash recovery period of 15 minutes (time turbidity is above
0.10 NTU)
Combined Filter Performance Goal Combined filter effluent turbidity of less than 0.10 NTU 95 percent of the time.
Disinfection Performance Criteria CT values to achieve required log inactivation of Giardia and virus
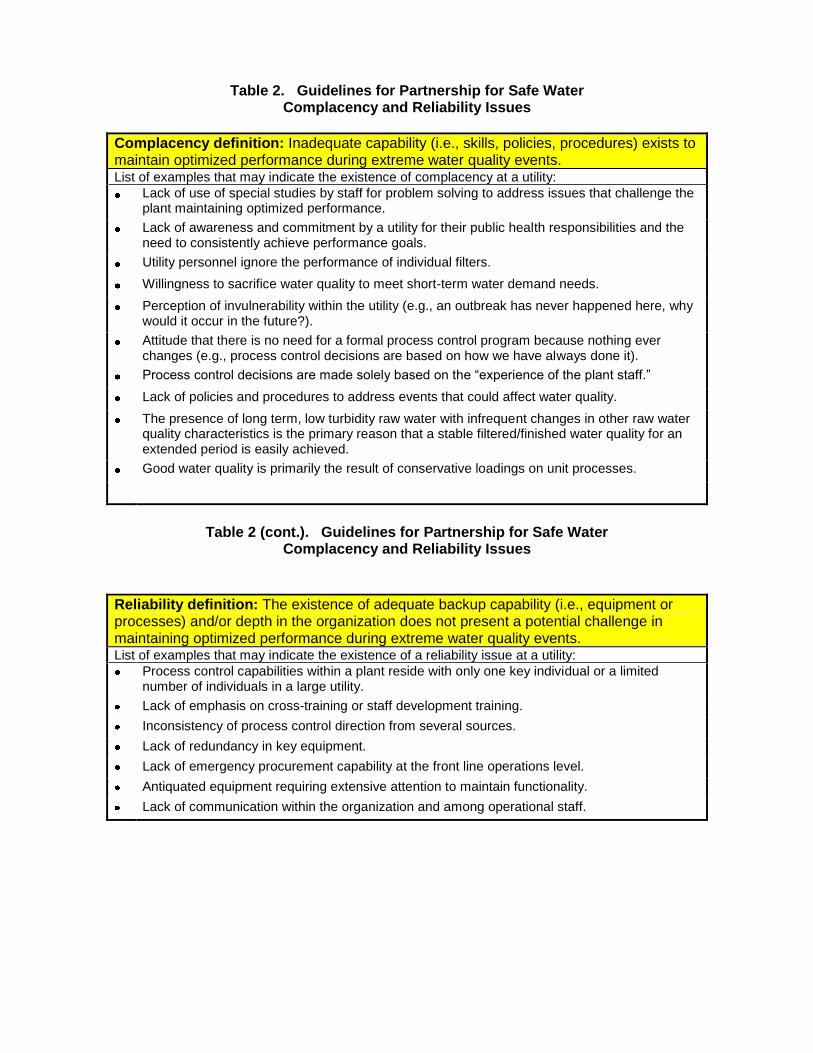
Table 2. Guidelines for Partnership for Safe Water Complacency and Reliability Issues
Complacency definition: Inadequate capability (i.e., skills, policies, procedures) exists to maintain optimized performance during extreme water quality events. List of examples that may indicate the existence of complacency at a utility:
Lack of use of special studies by staff for problem solving to address issues that challenge the plant maintaining optimized performance.
Lack of awareness and commitment by a utility for their public health responsibilities and the need to consistently achieve performance goals.
Utility personnel ignore the performance of individual filters.
Willingness to sacrifice water quality to meet short-term water demand needs.
Perception of invulnerability within the utility (e.g., an outbreak has never happened here, why would it occur in the future?).
Attitude that there is no need for a formal process control program because nothing ever changes (e.g., process control decisions are based on how we have always done it).
Process control decisions are made solely based on the “experience of the plant staff.”
Lack of policies and procedures to address events that could affect water quality.
The presence of long term, low turbidity raw water with infrequent changes in other raw water quality characteristics is the primary reason that a stable filtered/finished water quality for an extended period is easily achieved.
Good water quality is primarily the result of conservative loadings on unit processes.
Table 2 (cont.). Guidelines for Partnership for Safe Water
Complacency and Reliability Issues
Reliability definition: The existence of adequate backup capability (i.e., equipment or processes) and/or depth in the organization does not present a potential challenge in maintaining optimized performance during extreme water quality events. List of examples that may indicate the existence of a reliability issue at a utility:
Process control capabilities within a plant reside with only one key individual or a limited number of individuals in a large utility.
Lack of emphasis on cross-training or staff development training.
Inconsistency of process control direction from several sources.
Lack of redundancy in key equipment.
Lack of emergency procurement capability at the front line operations level.
Antiquated equipment requiring extensive attention to maintain functionality.
Lack of communication within the organization and among operational staff.
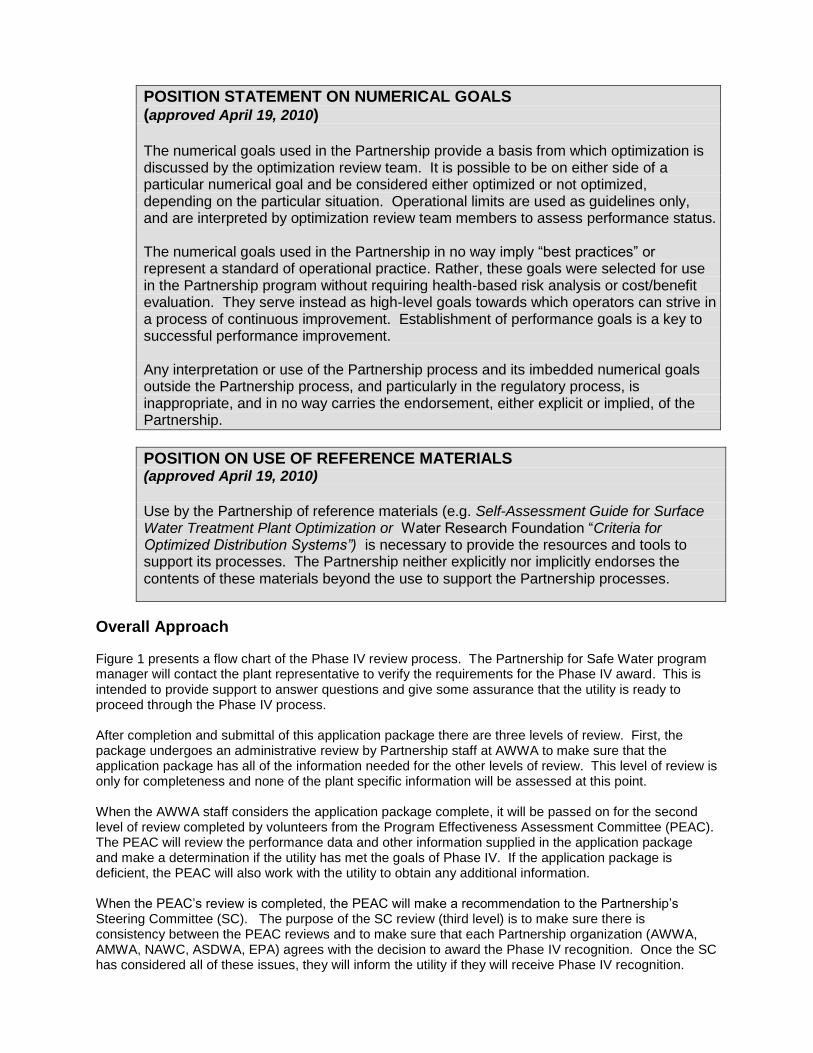
POSITION STATEMENT ON NUMERICAL GOALS (approved April 19, 2010) The numerical goals used in the Partnership provide a basis from which optimization is discussed by the optimization review team. It is possible to be on either side of a particular numerical goal and be considered either optimized or not optimized, depending on the particular situation. Operational limits are used as guidelines only, and are interpreted by optimization review team members to assess performance status. The numerical goals used in the Partnership in no way imply “best practices” or represent a standard of operational practice. Rather, these goals were selected for use in the Partnership program without requiring health-based risk analysis or cost/benefit evaluation. They serve instead as high-level goals towards which operators can strive in a process of continuous improvement. Establishment of performance goals is a key to successful performance improvement. Any interpretation or use of the Partnership process and its imbedded numerical goals outside the Partnership process, and particularly in the regulatory process, is inappropriate, and in no way carries the endorsement, either explicit or implied, of the Partnership.
POSITION ON USE OF REFERENCE MATERIALS (approved April 19, 2010)
Use by the Partnership of reference materials (e.g. Self-Assessment Guide for Surface Water Treatment Plant Optimization or Water Research Foundation “Criteria for Optimized Distribution Systems”) is necessary to provide the resources and tools to support its processes. The Partnership neither explicitly nor implicitly endorses the contents of these materials beyond the use to support the Partnership processes.
Overall Approach Figure 1 presents a flow chart of the Phase IV review process. The Partnership for Safe Water program manager will contact the plant representative to verify the requirements for the Phase IV award. This is intended to provide support to answer questions and give some assurance that the utility is ready to proceed through the Phase IV process. After completion and submittal of this application package there are three levels of review. First, the package undergoes an administrative review by Partnership staff at AWWA to make sure that the application package has all of the information needed for the other levels of review. This level of review is only for completeness and none of the plant specific information will be assessed at this point. When the AWWA staff considers the application package complete, it will be passed on for the second level of review completed by volunteers from the Program Effectiveness Assessment Committee (PEAC). The PEAC will review the performance data and other information supplied in the application package and make a determination if the utility has met the goals of Phase IV. If the application package is deficient, the PEAC will also work with the utility to obtain any additional information. When the PEAC’s review is completed, the PEAC will make a recommendation to the Partnership’s Steering Committee (SC). The purpose of the SC review (third level) is to make sure there is consistency between the PEAC reviews and to make sure that each Partnership organization (AWWA, AMWA, NAWC, ASDWA, EPA) agrees with the decision to award the Phase IV recognition. Once the SC has considered all of these issues, they will inform the utility if they will receive Phase IV recognition.

After receiving Phase IV, the utility will have to submit performance data annually to renew their Phase IV status. Submit the most recent 12-month period performance data as described in the Phase IV Application guidelines. Provide a copy of the previous performance data report for comparison. A written interpretation report should examine plant performance trends and verify that optimized performance (meeting all of the Phase IV performance goals) has been maintained. Explain any settled or finished water turbidity values that exceed Partnership Phase IV goals and what steps you have taken to prevent these occurrences in the future. State that the plant has not received a notice of violation since the last annual report. If the plant received a notice of violation, send a copy and explain the circumstances.
At a minimum, the annual report must include: 1. Plant settled water turbidity results from each settling basin (or clarifier) for the most recent 12-month
period (and a copy of last year’s data) using the Partnership data collection software. 2. Plant filtered water turbidity results from the combined filtered effluent for the most recent 12-month
period (and a copy of last year’s data) using the Partnership data collection software. 3. Individual monthly filter turbidity statistics tables, as indicated in the Phase IV application guidelines,
for the most recent 12-month period (and a copy of last year’s data). Clearly explain the source of the turbidity data (maximum values during the sampling period, reading taken at specific times, or other data sampling method).
4. One turbidity profile, that includes a backwash profile, from the filter run with the maximum value for each month
5. The profiles should be accompanied by a narrative description of any unusual turbidity values. 6. A narrative explanation of all individual turbidity values that exceed 0.30 NTU from each filter for the
most recent 12-month period. The narrative should include: explanation of performance trends; verification that Phase IV goals continue to be attained; explanation of each individual turbidity excursion above the Phase IV goals; explanation of measures to ensure that exceedances to not occur in the future; descriptions of recent operations, process or source changes and plans for the immediate future and how these have affected or may affect plant performance.
7. A brief narrative that explains why this plant should continue to maintain it’s status as one of the best run plants in the U.S. and receive a one-year renewal of “Excellence in Water Treatment” status.
8. A written statement that the utility has not received a notice of violation for any applicable regulation. General Requirements
Participation in Phase IV is voluntary and is not required for continuing membership in Phase III of the Partnership program.
Prior to Phase IV application, the plant must have completed Phase III (received the “Directors Award” and be a current Partnership member in good standing) and have addressed the “areas of improvement” and “areas of good faith effort” identified by the PEAC to elevate all 14 general parameters up to an “area of strength.”
Plant must complete the Phase IV application process that includes all documents and data listed in the Phase IV minimum reporting requirements checklist.
The plant submits one year of performance data as outlined in application package described below.
The plant provides the Partnership narratives on how they have addressed the issues in the complacency/reliability guidelines.
The Partnership program provides no guarantee that the plant will receive Phase IV recognition after completing the application process.
Phase IV award plants must submit annual reports (as described above and in the annual reporting requirements) to maintain Phase IV “Excellence in Water Treatment” status.

Application Package Requirements Objective of the Application Package The documents, narrative discussion, and data submitted for Phase IV of the Partnership for Safe Water provide evidence that the treatment plant is optimized. This phase of the Partnership for Safe Water is an optional activity of the program where the utility must demonstrate to an off-site group of PEAC volunteers their capability to meet stringent performance goals that satisfy the goals of Phase IV. The intent of the application package is to provide the PEAC with the information they need to assess if the utility has met the intent of Phase IV and should receive Phase IV recognition. It is, therefore, in the best interest of the utility that they provide as much relevant information as possible in the application package to assist the PEAC in their review. Organize the Phase IV application package using the Document Check List (Appendix A). Use tabs or numbered chapters to clearly identify each item in the list. The reviewers can more easily complete the review if the application is organized in this manner. Contents of Application Package Changes to Address Phase III Findings As part of the Phase IV application, the utility must demonstrate that they have used the results of Phase III to make changes and further enhance their plant’s operation and/or administration that could potentially lead to further improved performance. In developing Phase III, the Partnership realized that there are inherent limitations with an off-site review of a Phase III completion report by the PEAC. These limitations are related to the problems of completely understanding the unique situation at the plant based on the review of a Phase III completion report. For this reason, the Phase III process does not provide specific recommendations, but points the plant into general areas where the PEAC had concerns. Upon receiving their Phase III recognition, the utility also receives a list of 14 general parameters that have been placed into the categories “area of strength”,“areas of good faith effort” and “areas of improvement.” The intent of this section of the application package is to make sure that the plant has used the Phase III findings and, as appropriate, made the necessary changes towards continuous water quality improvements. This section of the application package should include discussions of how the plant has addressed the parameters in the “areas of improvement” and “areas of good faith effort” identified during the PEAC assessment of their Phase III activities and brought them all into an “area of strength.” The utility also has the option of disputing the findings of the PEAC with an explanation of why a particular rating for a parameter was inappropriate or difficult to translate into specific changes at the plant. The PEAC, however, will be the final judge that decides if the Phase III findings have been adequately addressed by the utility. The Partnership would like for the utility to provide the best explanation possible of the changes made or the rationale why the utility did not agree with a specific parameter. This section should also include any discussions with the PEAC with regard to the Phase III results or during the Phase IV facilitation process. Example: Changes to Address Phase III Findings In this example the package that the utility received with its Phase III recognition, the PEAC had identified four parameters in the area “areas of strength”, nine in the area “good faith effort” and one in the area “areas for improvement.” The utility would then need to provide a discussion of what they have done to address the “good faith effort” and “areas for improvement” parameters. If the utility disagrees with the PEAC on any parameters, they would include their rationale for changing the rating. The following is an example of how the utility could show that they addressed the parameter in the “areas for improvement” category. A similar discussion would be provided for each parameter not listed as an “areas of strength”.

The parameter that the PEAC put in the “areas for improvement” was Understand/Explain performance deviations. The following are examples of the discussions that could be included in the application package:
The plant staff reviewed the definition of this parameter and discussed what the PEAC could have seen in their completion report that would have led them to not rank this parameter higher. The definition of this parameter is as follows:
Understand/Explain Performance Deviations - The participant has demonstrated the capability to discuss deviations from optimum performance goals in a logical and convincing manner. The submittal should demonstrate an understanding of deviations and should impart an urgency to rectify deviations, both short term and long term. A lower rating should be given if no mention is made to address performance deviations in the data submitted.
Plant staff then reviewed the performance data submitted with their completion report and the self-assessment manual. The data showed an increase in the finished water turbidity for a 6 week period in June and it was determined that the report had not included any explanation of this event.
Plant records were reviewed to assess why this increase in turbidity occurred. This resulted in the following findings:
- There were equipment problems with the streaming current monitor (SCM) used to make process control decisions and no backup unit was available. - The plant superintendent did not realize that this performance deviation had occurred and that there was no formal process to report performance deviations. - The plant staff had no alternative process control procedures for unusual situations where the
SCM did not provide sufficient process control to maintain optimum finished water quality.
Based on this assessment following receipt of the Phase III report, the utility took the following steps:
- Purchased a spare SCM as a backup to the primary SCM. - Established a process where the plant staff met when there were performance deviations
above 0.10 NTU to discuss actions to be taken immediately to address the performance problems. The performance deviations, actions taken as the result of the meeting and documentation of the current levels of performance were then discussed with the plant superintendent.
- Pulled jar testing apparatus out of storage and established a training program for all plant operators in its use.
- Required a jar test every week by each shift to confirm the coagulant dose set by the SCM.
This activity was documented and made part of the Phase IV application package. Plant Turbidity Performance Data The major consideration for determining if a plant is eligible for Phase IV recognition is if it is meeting the performance goals shown in Table 1. Data from the plant raw, settled, and combined filter effluent for the most recent 12-month period must be submitted using the Partnership for Safe Water data collection spreadsheet software. The entire page (shown in Figure 2) that includes the table of monthly plant statistics must be provided (not just the saved file that is sent to AWWA for the annual report). The 95
th percentile values for each month must satisfy
the performance goals shown in Table 1. Any monthly values that do not meet the goals must be accompanied by a narrative explanation that describes the circumstances and justifies Phase IV conformance in spite of these results. Explain the source of the data included in the spreadsheets (maximum values, specific times, other).
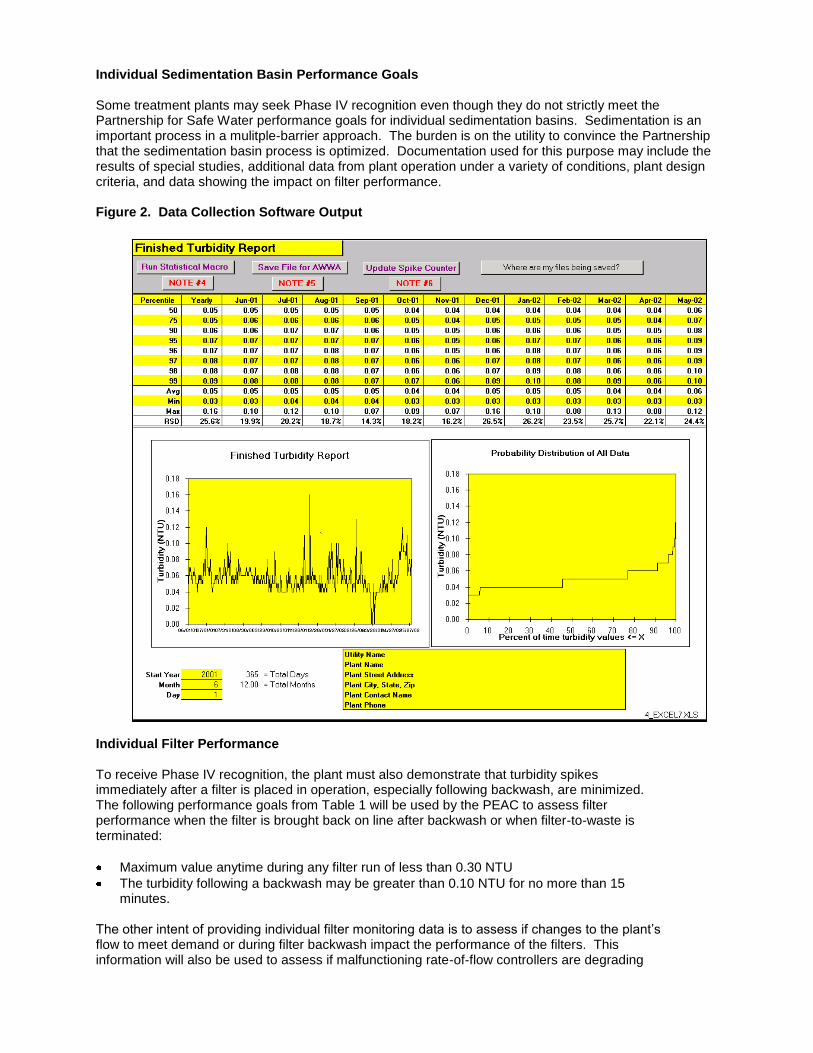
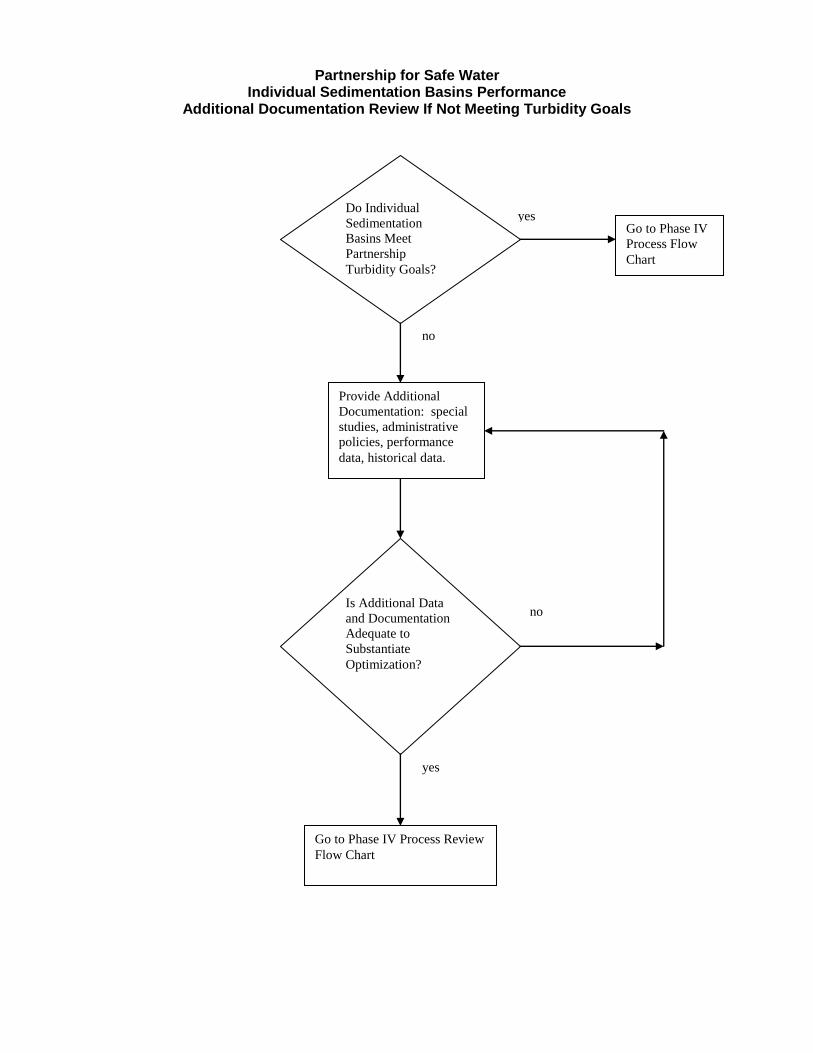
Individual Sedimentation Basin Performance Goals Some treatment plants may seek Phase IV recognition even though they do not strictly meet the Partnership for Safe Water performance goals for individual sedimentation basins. Sedimentation is an important process in a mulitple-barrier approach. The burden is on the utility to convince the Partnership that the sedimentation basin process is optimized. Documentation used for this purpose may include the results of special studies, additional data from plant operation under a variety of conditions, plant design criteria, and data showing the impact on filter performance. Figure 2. Data Collection Software Output
Individual Filter Performance To receive Phase IV recognition, the plant must also demonstrate that turbidity spikes immediately after a filter is placed in operation, especially following backwash, are minimized. The following performance goals from Table 1 will be used by the PEAC to assess filter performance when the filter is brought back on line after backwash or when filter-to-waste is terminated:
Maximum value anytime during any filter run of less than 0.30 NTU
The turbidity following a backwash may be greater than 0.10 NTU for no more than 15 minutes.
The other intent of providing individual filter monitoring data is to assess if changes to the plant’s flow to meet demand or during filter backwash impact the performance of the filters. This information will also be used to assess if malfunctioning rate-of-flow controllers are degrading
filter performance. In addition, individual filter effluent will more closely indicate optimized coagulant control.
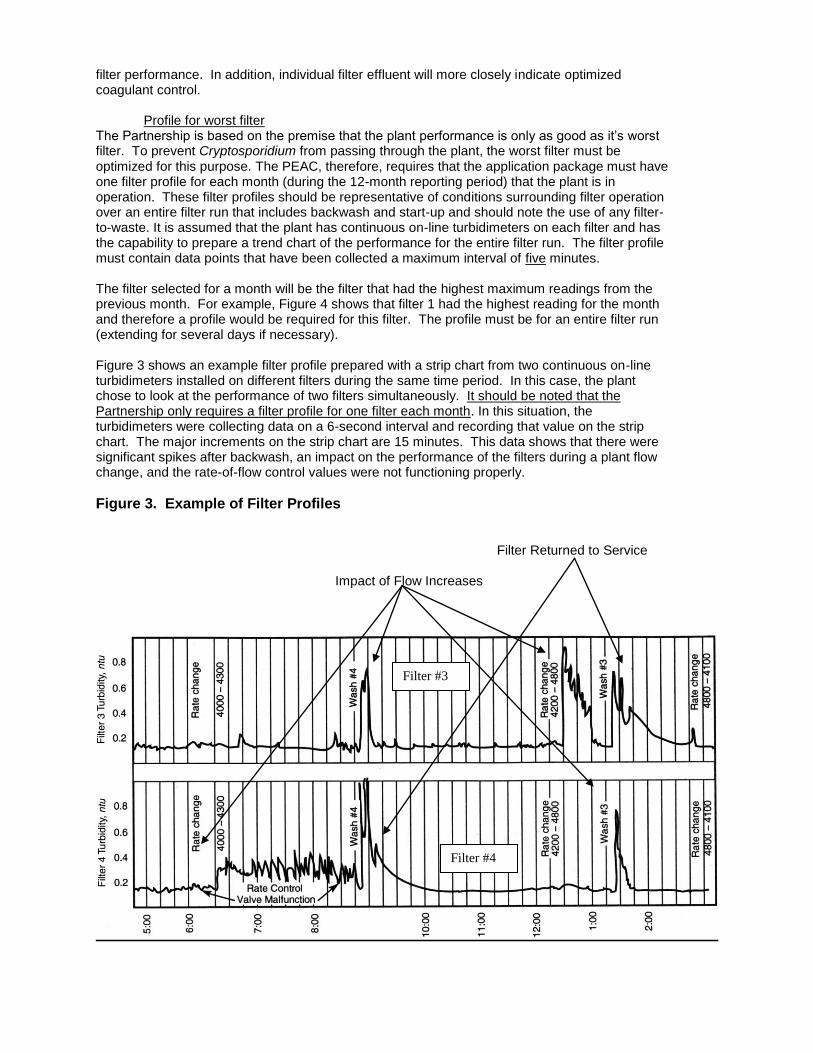
Profile for worst filter The Partnership is based on the premise that the plant performance is only as good as it’s worst filter. To prevent Cryptosporidium from passing through the plant, the worst filter must be optimized for this purpose. The PEAC, therefore, requires that the application package must have one filter profile for each month (during the 12-month reporting period) that the plant is in operation. These filter profiles should be representative of conditions surrounding filter operation over an entire filter run that includes backwash and start-up and should note the use of any filter-to-waste. It is assumed that the plant has continuous on-line turbidimeters on each filter and has the capability to prepare a trend chart of the performance for the entire filter run. The filter profile must contain data points that have been collected a maximum interval of five minutes. The filter selected for a month will be the filter that had the highest maximum readings from the previous month. For example, Figure 4 shows that filter 1 had the highest reading for the month and therefore a profile would be required for this filter. The profile must be for an entire filter run (extending for several days if necessary). Figure 3 shows an example filter profile prepared with a strip chart from two continuous on-line turbidimeters installed on different filters during the same time period. In this case, the plant chose to look at the performance of two filters simultaneously. It should be noted that the Partnership only requires a filter profile for one filter each month. In this situation, the turbidimeters were collecting data on a 6-second interval and recording that value on the strip chart. The major increments on the strip chart are 15 minutes. This data shows that there were significant spikes after backwash, an impact on the performance of the filters during a plant flow change, and the rate-of-flow control values were not functioning properly.
Figure 3. Example of Filter Profiles Filter Returned to Service Impact of Flow Increases
Filter #4
Filter #3
The plant may use any method they consider feasible and reasonable to demonstrate to the Partnership that they can meet the above criteria. The only requirement is that the filter profile be based on samples taken at 5-minute intervals (or more often). Each plant is unique and will have different filter monitoring systems (e.g., SCADA, monitors with recorders, monitors only, etc.) that makes providing specific universal requirements difficult. The following are presented as possible alternatives for supplying the required filter profiles:
Copies of strip chart recorders during the filter run.
Trend charts developed from SCADA systems.
Trend charts from an EXCEL spreadsheet derived from SCADA data
The PEAC may request additional filter profiles to help substantiate phase IV operational performance.
Monthly Individual filter statistics Plants must report on the performance of each filter for each month during the 12-month reporting period. Performance is based on turbidity values taken from each filter at 15-minute intervals with percentile statistics (95
th, 96
th, 97
th, 98
th, 99
th percentile values) calculated for each month. The plant will use it’s
own computer programs to generate the report. The Phase IV minimum entry level requirement is that each filter’s monthly 95
th percentile value shall be equal to or less that 0.10 NTU.
The other statistics (96
th-99
th percentiles) are required to be calculated and submitted in the application
package. These additional measures will be examined by the PEAC to establish performance consistency and confirm a high level of plant control. The PEAC may inquire for further explanation if the higher percentile values depart significantly from the 95
th percentile. An example of a report format is
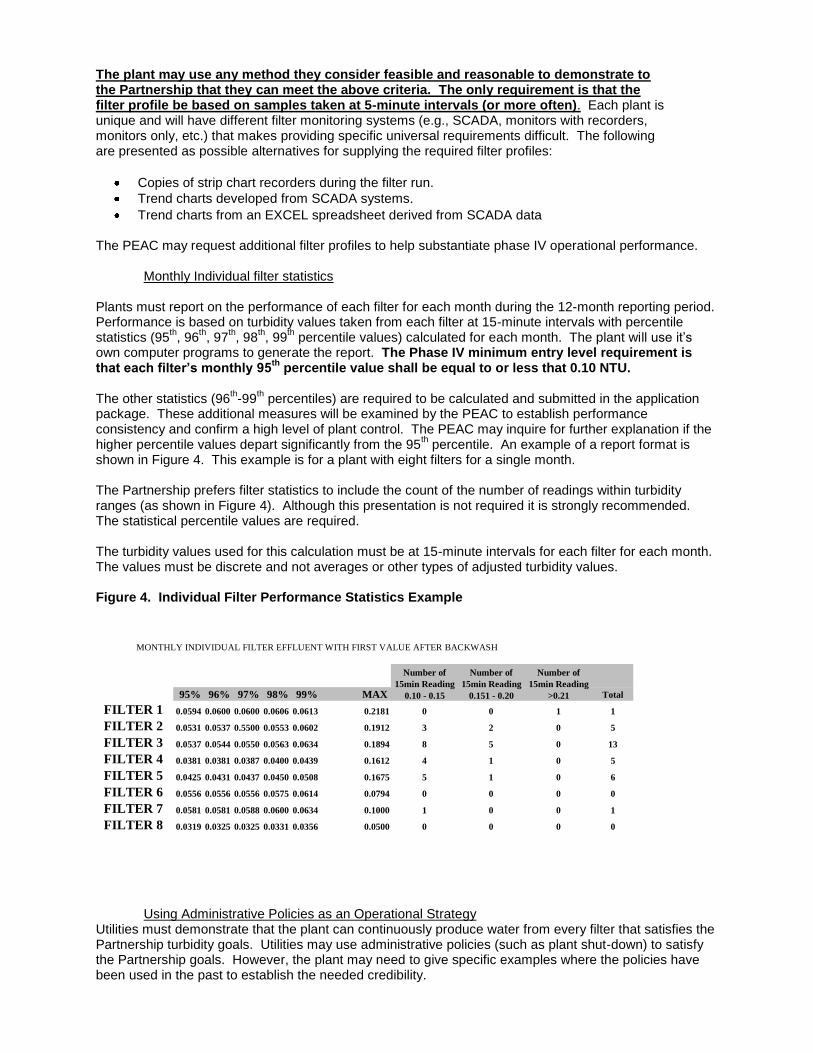
shown in Figure 4. This example is for a plant with eight filters for a single month. The Partnership prefers filter statistics to include the count of the number of readings within turbidity ranges (as shown in Figure 4). Although this presentation is not required it is strongly recommended. The statistical percentile values are required. The turbidity values used for this calculation must be at 15-minute intervals for each filter for each month. The values must be discrete and not averages or other types of adjusted turbidity values. Figure 4. Individual Filter Performance Statistics Example
Using Administrative Policies as an Operational Strategy
Utilities must demonstrate that the plant can continuously produce water from every filter that satisfies the Partnership turbidity goals. Utilities may use administrative policies (such as plant shut-down) to satisfy the Partnership goals. However, the plant may need to give specific examples where the policies have been used in the past to establish the needed credibility.
95% 96% 97% 98% 99% MAX Total
FILTER 1 0.0594 0.0600 0.0600 0.0606 0.0613 0.2181 0 0 1 1
FILTER 2 0.0531 0.0537 0.5500 0.0553 0.0602 0.1912 3 2 0 5
FILTER 3 0.0537 0.0544 0.0550 0.0563 0.0634 0.1894 8 5 0 13
FILTER 4 0.0381 0.0381 0.0387 0.0400 0.0439 0.1612 4 1 0 5
FILTER 5 0.0425 0.0431 0.0437 0.0450 0.0508 0.1675 5 1 0 6
FILTER 6 0.0556 0.0556 0.0556 0.0575 0.0614 0.0794 0 0 0 0
FILTER 7 0.0581 0.0581 0.0588 0.0600 0.0634 0.1000 1 0 0 1
FILTER 8 0.0319 0.0325 0.0325 0.0331 0.0356 0.0500 0 0 0 0
Number of
15min Reading
>0.21
MONTHLY INDIVIDUAL FILTER EFFLUENT WITH FIRST VALUE AFTER BACKWASH
Number of
15min Reading
0.10 - 0.15
Number of
15min Reading
0.151 - 0.20
Explanation of turbidity spikes
Turbidity values above 0.30 NTU may indicate that a filter is not optimized for particle removal. The Partnership requires the written explanation of all individual filter turbidity (taken at 15-minute intervals) values greater than 0.30 NTU. The burden is on the plant to adequately explain these values. In some cases, to back up the narrative, the plant should provide additional information or data to support the explanation. Data Collection and Quality Control Conclusions about the performance of the plant and its component processes must be based on accurate and verifiable data. The plant must provide documentation that describes how sample locations were chosen and include any data that demonstrates that the sample accurately represents the water being sampled. For example, if sample taps in a central plant laboratory are used for plant finished water tests a special study should have been performed to verify that this sample gives the same result as water collected at the plant discharge. The plant must provide documentation (as a minimum submit the example individual filter effluent turbidity checklist (in appendix B) or similar information regarding the type of instruments that are being used to provide any data provided in the Phase IV application. The documentation should also describe the frequency of calibration and offer standard operating procedures regarding the removal of data due to instrument malfunction. The plant must provide adequate information on instrumentation and quality control to assure the PEAC that formal procedures are in place and are followed to ensure that the data is of the highest quality. Please note that data submitted should not be averages of discrete data points.
Plants with Particle Count Data
A utility that is submitting a Phase IV application package is not required to submit any particle count data, but is strongly encouraged to do so if this information is available. Particle count data along with turbidity data provides the strongest evidence possible that a plant is meeting the optimization goals. The intent of this section is make sure that utilities understand how they can use particle count information to supplement the turbidity data in the Phase IV application package. A utility that has particle count data is encouraged to use this data to demonstrate enhanced particle removal over what is possible with turbidity data alone. Utilities that have made the decision to install particle counters usually have already met the Partnership’s turbidity performance goals and are aware of the benefits of particle counters to further enhance their abilities to maximize particle removal in their plants. The intent of encouraging a utility to include their particle count information in the Phase IV application is to allow the PEAC to assess if the information is being used for process control decisions and that the maximum value is being obtained from their commitment to particle counters.
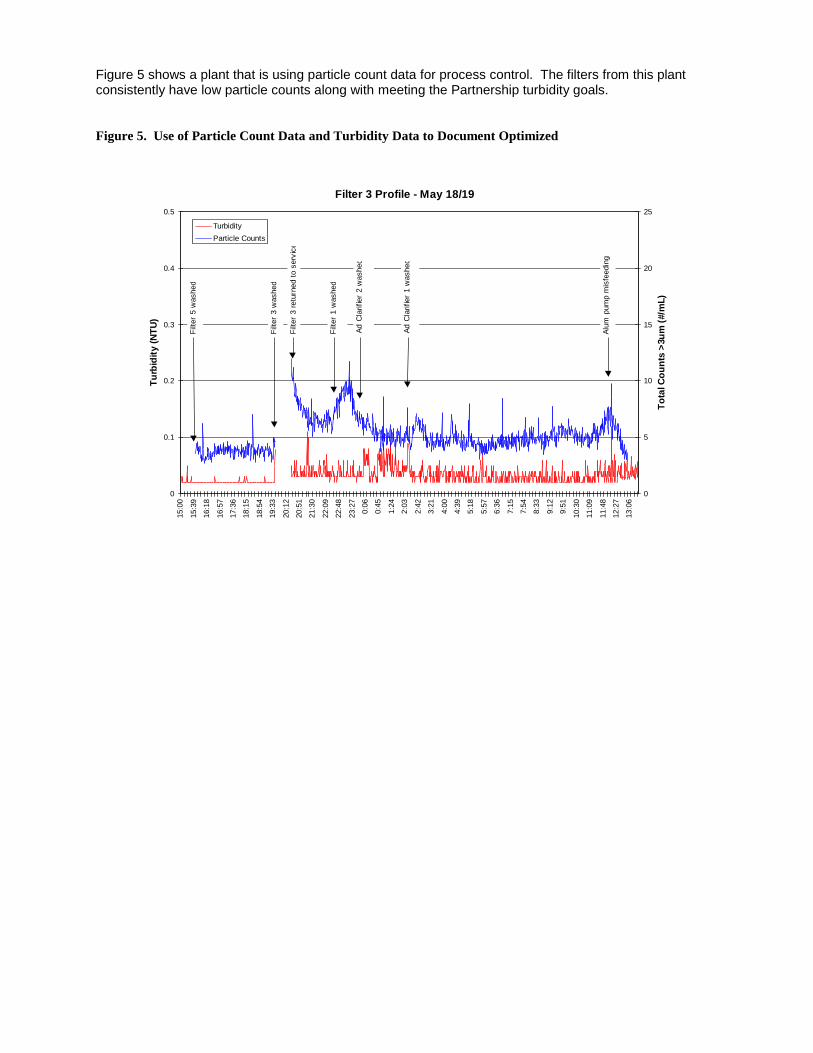
Figure 5 shows a plant that is using particle count data for process control. The filters from this plant consistently have low particle counts along with meeting the Partnership turbidity goals.
Figure 5. Use of Particle Count Data and Turbidity Data to Document Optimized
Filter 3 Profile - May 18/19
0
0.1
0.2
0.3
0.4
0.5
15:0
0
15:3
9
16:1
8
16:5
7
17:3
6
18:1
5
18:5
4
19:3
3
20:1
2
20:5
1
21:3
0
22:0
9
22:4
8
23:2
7
0:0
6
0:4
5
1:2
4
2:0
3
2:4
2
3:2
1
4:0
0
4:3
9
5:1
8
5:5
7
6:3
6
7:1
5
7:5
4
8:3
3
9:1
2
9:5
1
10:3
0
11:0
9
11:4
8
12:2
7
13:0
6
Tu
rbid
ity (
NT
U)
0
5
10
15
20
25
To
tal C
ou
nts
>3u
m (
#/m
L)
Turbidity
Particle Counts
Filt
er
5 w
ashed
Filt
er
3 w
ashed
Filt
er
1 w
ashed
Ad C
larifier
2 w
ashed
Ad C
larifier
1 w
ashed
Alu
m p
um
p m
isfe
edin
g
Filt
er
3 r
etu
rned t
o s
erv
ice

Narratives on Complacency and Reliability Issues
The last portion of the application package is intended to give the PEAC information that they can assess the utility’s capability to maintain the levels of performance demonstrated in the data submitted over the long term. They will complete this assessment by reviewing the following information against the issues presented in complacency/reliability guidelines presented in Table 2.
Narratives are to be provided by the utility on the following four issues. In reviewing these narratives, the PEAC will be looking for information that gives them confidence that the utility understands these issues and has seriously considered them.
1. During the last 10 years explain how the plant personnel staff responded to the last major episode of poor water quality (preferably an event that caused poor finished water quality) including what process control procedures and special studies were completed. Also explain what you learned from that experience and what changes were made in plant operations to respond to these situations in the future. Use raw and finished data profiles as part of a detailed discussion of the event. Demonstration of developed process control skills is particularly important to describe.
2. If the plant did not encounter any major episodes of poor water quality, how would the plant staff respond to deteriorating finished water quality during unusual changes in raw water quality that have never been experienced before? This narrative should explain how the plant personnel would deal with a situation where all of the usual process control procedures do not maintain optimized performance. This narrative should present a clear strategy for dealing with this situation including how and who would implement it. 3. How would the plant staff be directed to respond in situations where the system was experiencing peak water demand, but they thought that plant flows needed to be reduced to maintain optimized performance? This narrative could include any formal policies around this area and case histories of how the utility has responded to these situations in the past. 4. Provide examples that demonstrate the plant staff’s ability to perform special studies to solve water quality problems. This narrative could include formal special study procedures and case histories of how the plant staff has resolved water quality problem in a structured systematic way. 5. Provide a narrative on how the plant has addressed the reliability issues in Table 2. This could include a listing of key process equipment and how redundancy has been provided. A discussion of the age of the key equipment could also be provided and why its age does not impact the plant’s ability of maintain optimized performance. For Further Information on Applying for Phase IV, contact:
Partnership Coordinator Partnership for Safe Water American Water Works Assoc. 6666 W. Quincy Ave. Denver, CO 80235 Phone: (303) 347-6169 FAX: (303) 794-6303 e-mail: [email protected]

Appendix A Partnership for Safe Water
Phase IV Application Document Check List Minimum Requirements
The requirements listed below are the minimum that will be accepted before the PEAC can begin its review for Phase IV recognition. The plant is encouraged to provide any additional information that may be helpful for the PEAC to understand any unusual data or plant situations. The burden is on the plant to provide adequate information for the PEAC review. The PEAC may request, at their discretion, any additional information it may need to fully assess the performance of the plant to satisfy Phase IV requirements.
1. Plant Raw water turbidity results for the most recent 12-month period using the Partnership data collection software (example shown in Figure 2).
2. Plant settled water turbidity results from each settling basin (or clarifier) for the most recent 12-month period using the Partnership data collection software.
3. Plant filtered water turbidity results from the combined filtered effluent for the most recent 12-month period using the Partnership data collection software. Explain source of the data (maximum values, specific times, other).
4. Plant schematic from the Phase III report.
5. Copy of the Phase III summary report from the PEAC that indicates “area of strength”, “area of good faith effort”, and “area of improvement” for the fourteen judgement categories.
6. A narrative that describes how each of the general parameters from the PEAC Phase III summary report that were judged as “area of good faith effort” and “area of improvement” have been elevated to an “area of strength.”
7. Individual monthly filter turbidity statistics tables similar as shown in Figure 4 for the most recent 12-month period. Explain any missing data (data gaps). Explain source of the data (maximum values, specific times, other).
8. One turbidity profile, that includes a backwash profile, from the filter run with the maximum value for each month.
9. The profile should be accompanied by a narrative description of any unusual turbidity values.
10. A narrative that answers the questions on complacency and reliability.
11. A narrative that describes the plant procedures for sample collection and quality control (including information similar to Appendix B) to ensure data integrity.
12. A narrative explanation of all individual turbidity values that exceed 0.30 NTU from each filter for the most recent 12-month period.
13. A brief narrative that explains why this plant should be recognized as one of the best run plants in the U.S. and receive the Partnership’s award for “Excellence in Water Treatment.”
14. A cover letter that included contact information, name of plant, utility name, and provides the name, telephone number, and e-mail address of the primary contact.
15. A written statement that the utility has not received a notice of violation for any applicable regulation.
Please mail the application package to: Partnership Coordinator Partnership for Safe Water American Water Works Association 6666 W. Quincy Ave. Denver, CO 80235

Appendix B
Partnership Phase IV individual filter effluent turbidity evaluation checklist
Turbidimeters on-line for each filter? YES ____ NO ____ Number of turbidimeters in use on filters Turbidimeter Make (example: Hach, GLI, etc): Turbidimeter Model (example: 1720D, etc) Note: List all types of turbidimeters in use on filters Tapping location relative to filter effluent valve: BEFORE ____ or AFTER ____ or OTHER (describe) Tapping location relative to sampling of filter to waste stream: DOES ____or DOESN’T ____ SAMPLE Filter-To-Waste Tap sampling location on pipe: Vertical ____
Diagonal-up ____ Diagonal-down ____ Horizontal ____ Bottom ____
Turbidimeters close to sample tap: YES ____ or NO ____ If NO, explain: Turbidimeter Calibration with: Formazine ____ or USEPA approved pre-mixed ____ Turbidimeter Calibration Frequency at least quarterly: YES ____ or NO ____ If NO, explain Turbidimeter verification according to manufacturer’s recommended method: Yes ____ or NO ____ Turbidimeter verification frequency at least monthly: YES ____ or NO ____ If NO, explain IFE turbidity value reported based upon: Bubble reject mode: enabled ____ or disabled ____ Signal average (seconds): 6 ____ or 30 ____ or 60 ____ or OTHER Print frequency (minutes): Data transmitted via: Signal Output module (SOM) YES ____ or NO ____ SCADA: YES ____ or NO ____ (describe: ) Other Software: YES ____ or NO ____ (describe: ) Stripchart: YES ____ or NO ____

Data transfer to Spreadsheet via: Manual entry: YES ____ or NO ____ Direct link with SCADA: YES ____ or NO ____ Direct link with signal output module: YES ____ or NO ____ Direct link with other software: YES ____ or NO ____ Other: If SCADA used, describe SCADA polling interval: IN SECONDS ____or IN MINUTES ____ If frequency in minutes, then how many? Describe the data manipulation, if any, performed manually, or by the signal output module, SCADA, or other software prior to placing a value into final percentile spreadsheet: (examples: delta saving, double delta saving, etc) Describe how often “print frequency” data is collected for use in the spreadsheet: (example: data is “printed” by turbidimeter every 1 minute, continuously scanned by SCADA within seconds polling interval, and placed into a SCADA file using real time values every scan, this file is then used by a program to grab data from this file every 15 minutes, this data selection is initiated at 00:01 hours and continues every 15 minutes thereafter. This “15 minute data” are transferred via a direct link software to excel, where it is written to floppy disk and then copied to final spreadsheet for percentile determination.): Did the final submitted percentile calculations include the following 15 minute data values? First data value after a wash: YES ____ or NO ____ Data values during a wash: YES ____ or NO ____ Data values during documented maintenance activities: YES ____ or NO ____ Does your utility do the following:
Assign one person to track IFE turbidity values on a monthly basis? YES ____ or NO ____ Document time interval post backwash peak is above 0.10 NTU? YES ____ or NO ____ Document all maintenance (calibrations, verifications, flushing) related turbidity spikes? YES ____ or NO ____
Other information:
Thank-you for taking the time to complete this form, accurate answers will allow the Partnership
Committee reviewing your report to understand the relationship of your submitted data to optimization.
Partnership for Safe Water Individual Sedimentation Basins Performance
Additional Documentation Review If Not Meeting Turbidity Goals
Do Individual
Sedimentation
Basins Meet
Partnership
Turbidity Goals?
Go to Phase IV
Process Flow
Chart
yes
no
Provide Additional
Documentation: special
studies, administrative
policies, performance
data, historical data.
Is Additional Data
and Documentation
Adequate to
Substantiate
Optimization?
Go to Phase IV Process Review
Flow Chart
no
yes

Utility Completes Registration at least three months prior to submitting Phase IV
Application. AWWA Program Manager Answers any Phase IV Questions.
Utility Submits 5 Copies of Completion Report to AWWA
Office.
Report is Forwarded to Program Manager for Initial Screening.
Has Utility Submitted all Items on the Phase IV
Checklist?
Program Manager Requests Clairification or Add’l Info Not Provided in Self-Assessment Report.
Report Forwarded to PEAC for Review.
Yes
Has Utility Provided Information
Requested?
Yes
Partnership for Safe Water Phase IV Process
If Necessary, Review Team Requests Add’l Information
from Utility; Provides Feedback on Report.
Has Utility Adequately
Addressed all Key Issues?
PEAC Chair Recommends Excellence in Water Treatment Award to PSW
Steering Committee.
Report is Returned to Utility.
No
No
Yes
No
Review Team Recommends Phase IV Award to PEAC Chair.
Figure 1. Phase IV Review Process


