PARTICIPATORY PLANNING FOR FOREST AND LANDSCAPE ... · PARTICIPATORY PLANNING FOR FOREST AND...
25
PARTICIPATORY PLANNING FOR FOREST AND LANDSCAPE RESTORATION IN SOUTH SUMATRA, INDONESIA Andree Ekadinata, Sonya Dewi, Satrio Wicaksono and M. Sofiyuddin
Transcript of PARTICIPATORY PLANNING FOR FOREST AND LANDSCAPE ... · PARTICIPATORY PLANNING FOR FOREST AND...

PARTICIPATORY PLANNING FOR FOREST AND LANDSCAPE RESTORATION IN
SOUTH SUMATRA, INDONESIA
Andree Ekadinata, Sonya Dewi, Satrio Wicaksono and M. Sofiyuddin

Forest and Landscape Restoration (FLR)Opportunities & Challenge
• Opportunities: More than two billion hectares of land around the world that would benefit from some type of restoration intervention (GPFLR, 2011).
• Depending on the state of degradation of an initially forested ecosystem, restoration can at least partially restore levels of biodiversity and ecosystem services given adequate time and financial investment.
• Past work has been overwhelmingly focused on site-level restoration, and relatively little effort has been directed toward understanding links between restoration and factors that determine historical contingency
• Few attempts have been made to systematically evaluate restoration economic effectiveness.
IUCN and WRI. 2014. A guide to the Restoration Opportunities Assessment Methodology (ROAM): Assessing forest landscape restoration opportunities at the national or sub-national level. Working Paper (Road-test edition). Gland, Switzerland: IUCN. 125pp.
Chazdon, R. L. 2008. Beyond deforestation: restoring forests and ecosystem services on degraded lands. Science 320:1458-1460. http://dx.doi.org/10.1126/science.1155365Burdvig L A. 2011. The Restoration of Biodiversity : Where Has Research Been and Where Does It Need To Go ? American Journal of Botany 98(3): 549–558

Forest and Landscape Restoration Assessment [FLORAS]Piloting An Inclusive-Integrative-Informed Planning Processes for FLR in Indonesia
• Restoration should be focused on restoring function at the landscape level. Consider and restore entire landscapes as opposed to individual sites.
• Restoring forward. Restore the functionality of the landscape, making it better to provide a rich habitat, prevent flooding and withstand the impacts of climate change
• The planning process should be inclusive where it involved all relevant stakeholders
• Integrative planning system which include a multi-level planning processes. To ensure successful implementation, it is important to include restoration bigger development objective.
• An informed process of restoration planning based on the best data and local knowledge available.

• Objectives: Increased capacity of stakeholders in two targeted landscapes in South Sumatra and Jambi to conduct forest and landscape restoration (FLR) through informed, inclusive and integrative planning processes.
• Study sites: Musi Watershed (7.7 million hectares) in South Sumatra and Batanghari Watershed (4.4 million hectares) in Jambi, Indonesia.
Batanghari Watershed
Musi Watershed
FLORAS Objectives and Study Sites

• [FLORAS] strive to adopt Restoration Opportunities Assessment Methodolog(ROAM) framework into technical steps which are suitable for local context and stakeholders mindset in Indonesia
• [FLORAS] aims to facilitate and strengthen capacity of local partners through multi-stakeholders dialog and training sessions to produce feasibility analysis, strategy, and action plan on forest and landscape restoration in Indonesia
IUCN and WRI. 2014. A guide to the Restoration Opportunities Assessment Methodology (ROAM): Assessing forest landscape restoration opportunities at the national or sub-national level. Working Paper (Road-test edition). Gland, Switzerland: IUCN. 125pp.
[FLORAS] in 6 Steps
Engagement with boundary partner
Understanding drivers and identfying restoration objective
Mapping opportunities, option and priority for restoration
Social economic assessment
Drivers of degradation
Value chain analysis for restoration
Feasibility analysis
Ex-ante-impact of restoration
Restoration strategy and
roadmap
Public consultation and financial dialog
Landscape Site
1
2
3
4 5
6
Action plan at
site level
+
Value chain
analysis on
restoration
action

• Works together with key stakeholders at provincial, district and land management unit level to facilitate restoration planning at landscape scale
• Strengthen knowledge and capacity of through series of join study and training
• Initiate a watershed restoration planning processes through participatory approach
At the micro/site-level,
collaborating with Forest
Management Units
At the meso-level,
collaborating with District
Planning Agency
At the macro/watershed-
level, partnering with
Watershed Management
Forum, established by the
Governor
Identifying and engaging key stakeholdersSTEP
1
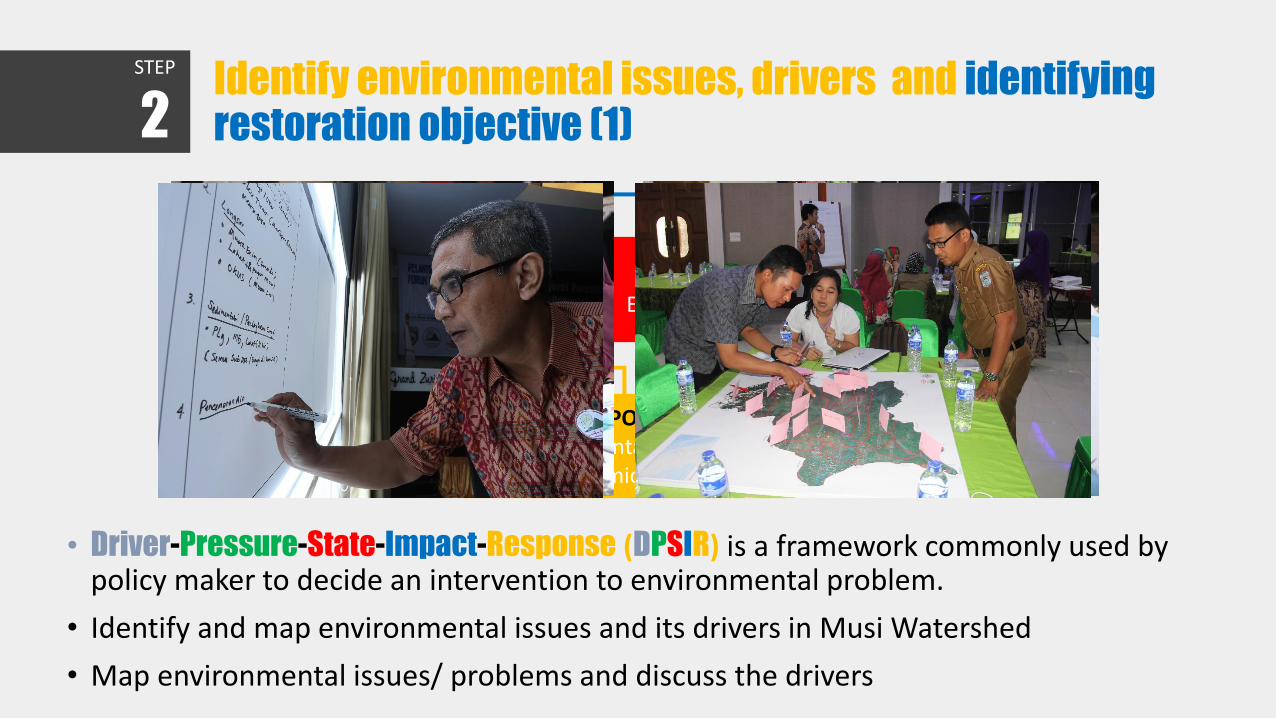
• Driver-Pressure-State-Impact-Response (DPSIR) is a framework commonly used by policy maker to decide an intervention to environmental problem.
• Identify and map environmental issues and its drivers in Musi Watershed
• Map environmental issues/ problems and discuss the drivers
DRIVERSHuman needs
PRESSUREHuman
activities
STATEEcosystem
IMPACTEnvironmental Services-
Economic-Social
RESPONSEEnvironmental Services-
Economic-Social
Identify environmental issues, drivers and identifying restoration objective (1)
STEP
2

0 5 10 15 20 25
Loss of waters sources
Lack of clean water
Sea water intrusion
Decrease of land productivity
Water quality
River sedminetation
Drought
Landslide
Forest fire
Flood
Drought Water quality Land productivity
Flood Landslide Fires
0 5 10 15
Demand for housing
Land use plan
Shifting cultivation
Tenurial conflict
Coastal area development
Conversion to tree crop
Sea water rise
Problem with drainage
Ilegal logging
Swamp reclamation for housing
Illegal mining
Sedimentation
Bad waste management
Lost of swamp for factory
Loss of forest cover in the lowland
Agriculture
expansion
Insutrial
activities
Swamp reclamation
for settlement
Illegal logging Sedimentation Forest conversion
Identify environmental issues, drivers and identifying restoration objective (1)
STEP
2

Designated/
expected
landscape’s
function
Protection
Forest production
Agriculture
Others
Actual
landscape’s
function
Protection
Forest production
Agriculture
Others
Expected function of a landscape based on local policy or trade-off between demands, economic benefits, culture, development objective, tenure
Proxy : land use plan, spatial plan, development master plan, forest designation map, land allocation etc.
Actual function of a landscape based on field assessment, scientific research, satellite
image observation, local information, statistic data
Proxy : land cover map, disaster map, environmental services map, erosion prone map, biodiversity/ habitat degradation data
The observed
landscape
functioned
properly
>> No needs
for FLR
The observed
landscape
does not
functioned as
expected
>> FLR required
Mapping opportunities, option and prioritySTEP
3

1. Create planning unit using combination of classes from layers of designated function and actual function
2. Conduct focus group discussion to capture stakeholders perception on designated vs actual function
3. Identify land with function degradation by building consensus on degradation of function
4. Assess potential restoration options using pebble distribution method 1
Forest
Designation
2012
Land Cover Map
2014
Planning
Unit
1Sheil, D. and Liswanti, N. 2006. Scoring the importance of tropical forest landscapes with local people: patterns and insight. Environmental Management 38: 126-136. http://www.springerlink.com/content/p413465746536731/fulltext.pdf
Mapping opportunities, option and prioritySTEP
3

• More than 1,2 million hectares or 17% of Musi Watershed are identified as potential area for restoration, which have deviation/ degradation from expected function
• Around 0.2 million hectares or 18% of the potential area for restoration are located on peatland
• More than 0.3 million hectares or 26% are located in protected area
286.484 539.255 436.640
Natural
regeneration
Assisted
regeneration
Rehabilitation/
reclamation
23.7%
43.7%
35.6%
Restoration Options
Mapping opportunities, option and prioritySTEP
3

Developing strategy & analyzing ex-ante impact of FLR
• Land Use Planning for Multiple Environmental Services (LUMENS)
• LUMENS is a framework accompanied with with a user-friendly and publicly available software that allows inclusivity, integration and informed negotiation of land use within a landscape. It is a spatially explicit, semi agent-based model that can accommodate a broad range of scenarios
• LUMENS was used to develop restoration strategy and assessing restoration impact on environmental services, land use profitability, regional economic and other indicators.
STEP
4
0
10000
20000
30000
Huta
n lin
dung
Huta
n pr
oduk
si
Perk
ebun
an
perk
otaa
n
Perta
nian
lahan
bas
ah
Perta
nian
lahan
ker
ing
Sem
pada
n su
ngai
Tam
an n
asion
al
factor(Z_NAME)
value
factor(Traj)Loss to bare land and abandonedLoss to croplandLoss to infrastructureLoss to logged-over forestOtherRecovery to agroforestRecovery to forestRecovery to tree croppingStable natural forest
0
25
50
75
100
0 25 50 75 100TECI (%)
Ha
bita
t P
rop
ort
ion
(%)

On-going LUMENS process
Supports from: EU, DANIDA, BMU-ICI, MACF, FTAPartnerships with: Bappenas, local government offices, GIZ, CCROM-IPB, BrawijayaUniversity, NGOs, private sectors

PURPlanning Unit Reconciliation
QUESQuantification ofenvironmental services
TATrade-off analysis
SCIENDOScenario simulation anddevelopment
LUMENS MODULES
Developing strategy & analyzing ex-ante impact of FLRSTEP
4
PLANNING UNIT
RECONCILIATION
PUR
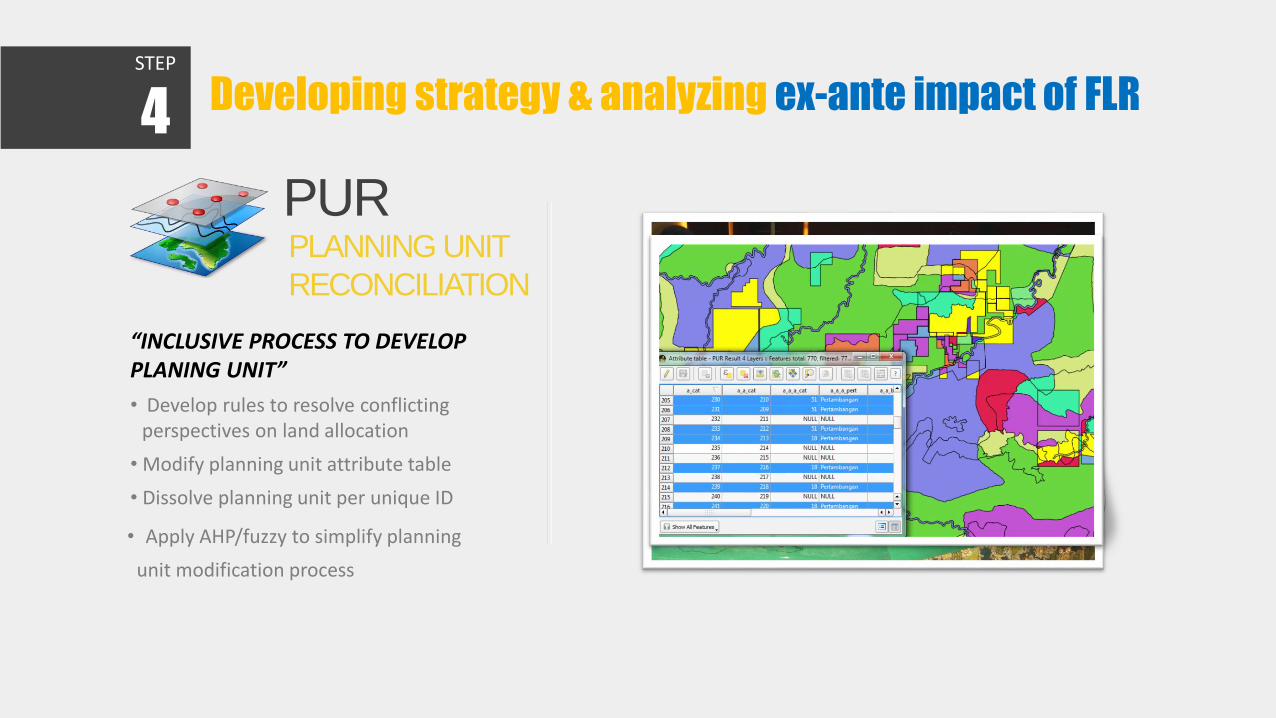
“INCLUSIVE PROCESS TO DEVELOP PLANING UNIT”
• Develop rules to resolve conflicting perspectives on land allocation
• Modify planning unit attribute table
• Dissolve planning unit per unique ID
• Apply AHP/fuzzy to simplify planning
unit modification process
Developing strategy & analyzing ex-ante impact of FLRSTEP
4
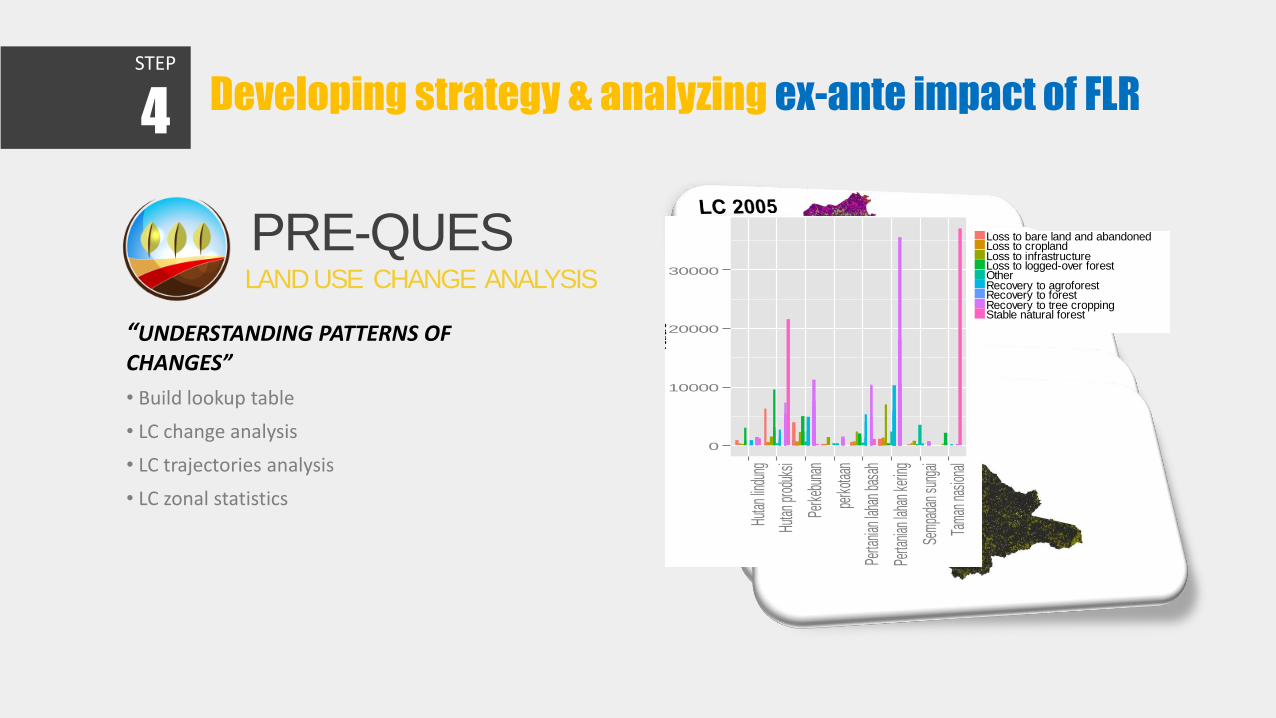
“UNDERSTANDING PATTERNS OF CHANGES”
• Build lookup table
• LC change analysis
• LC trajectories analysis
• LC zonal statistics
0
10000
20000
30000
Hutan
lindu
ng
Hutan
prod
uksi
Perk
ebun
an
perk
otaan
Perta
nian l
ahan
basa
h
Perta
nian l
ahan
kerin
g
Semp
adan
sung
ai
Tama
n nas
ional
factor(Z_NAME)
value
factor(Traj)Loss to bare land and abandonedLoss to croplandLoss to infrastructureLoss to logged-over forestOtherRecovery to agroforestRecovery to forestRecovery to tree croppingStable natural forest
0
10000
20000
30000
Huta
n lin
dung
Huta
n p
roduksi
Perk
ebunan
perk
ota
an
Pert
ania
n lahan b
asah
Pert
ania
n lahan k
eri
ng
Sem
padan s
ungai
Tam
an n
asio
nal
factor(Z_NAME)
valu
e
factor(Traj)Loss to bare land and abandonedLoss to croplandLoss to infrastructureLoss to logged-over forestOtherRecovery to agroforestRecovery to forestRecovery to tree croppingStable natural forest
LAND USE CHANGE ANALYSIS
PRE-QUES
Developing strategy & analyzing ex-ante impact of FLRSTEP
4

Carbon stock of land use systems are obtained from plot-level measurement and allometric modelling
QUES-CCARBON ACCOUNTING
“QUANTIFYING CARBON DYNAMICS”
• Carbon density mapping
• Carbon sequestration & emission
mapping
• Generate database
Developing strategy & analyzing ex-ante impact of FLRSTEP
4

“DIVERSITY AT LANDSCAPE SCALE”
Measure Degree of Integration of Focal Area, based on:
• User defined habitat
• Plot level data or expert
judgment
• Landscape configuration and composition0
25
50
75
100
0 25 50 75 100TECI (%)
Ha
bita
t P
rop
ort
ion
(%)
23.53 %
T-1: 2005
0
25
50
75
100
0 25 50 75 100TECI (%)
Ha
bita
t P
rop
ort
ion
(%)
12.92 %
Degree of Integration of Focal Area (DIFA)
T: 2010
Reduction in DIFA between T-1 to T : 12.61%
QUES-BBIODIVERSITY ASSESMENT

“EXPLORE MULTIPLE SCENARIOS”
•NPV as an indicator
• Regional economic indicators : GDRP, labor absorption, sectoral linkages
•Opportunity cost curve
• Co-benefit among ES
• Costs and benefit of providers vs users of ES
ID Land cover NPV ($/ha)1Undisturbed Forest 0.00
4Timber Plantation 4392.335Agroforest 1040.00
6Estate 4948.678Cropland 25418.00
11Settlement 5787.00
Transition Probability
Matrix
opportunity cost curve
TAOPPORTUNITY COST
Developing strategy & analyzing ex-ante impact of FLRSTEP
4

PROJECTING THE FUTURE, WITH AND WITHOUT INTERVENTION
•Spatial variables as drivers
•Economic, policy, conservation strategies as drivers of land use changes
•Various Transition Potential Modeling Methods, e.g. ANN
•spatially explicit cellular automata simulation
•Model validation
planning unit
map
land cover
maps
Spatial
variables
Projected land cover mapsSCIENDOLAND USE CHANGE SIMULATIONS
Developing strategy & analyzing ex-ante impact of FLRSTEP
4

0
500
1.000
1.500
2.000
2.500
3.000
3.500
4.000
Periods [0] 2014-2015
[1] 2015-2016
[2] 2016-2017
[3] 2017-2018
[4] 2018-2019
[5] 2019-2020
[6] 2020-2021
[7] 2021-2022
[8] 2022-2023
[9] 2023-2024
[10] 2024-2025
[11] 2025-2026
[12] 2026-2027
[13] 2027-2028
[14] 2028-2029
[15] 2029-2030
Mill
ion
s
Natural regeneration scenario
Assisted regeneration scenarioRehabilitation/reclamation scenario
Developing strategy & analyzing ex-ante impact of FLRSTEP
4

1. Mapping to identify priority area for restoration, derived from watershed-level potential restoration area;
2. Developing common objectives and restoration actions among key partners;
3. Assessing biophysical characteristics of the restoration site and in-depth discussion on restoration option with the local community in the vicinity of the site;
4. Assessing feasibility using Restoration Diagnostic questionnaire;
5. Developing strategy and business plan;
6. Conducting cost benefit analysis
1
2
3
Developing action plan at site levelSTEP
5

• Public consultation was conducted at multiple level to assess restoration strategy and action plan with broader stakeholder including key decision makers.
• Financial dialog was also conducted as a part of the public consultation processes to assess potential funding mechanism beyond state budget. Donors, CSO, bank and private sectors were invited to join the processes
Conducting public consultation and financial dialogSTEP
6
Achievement and Conclusion
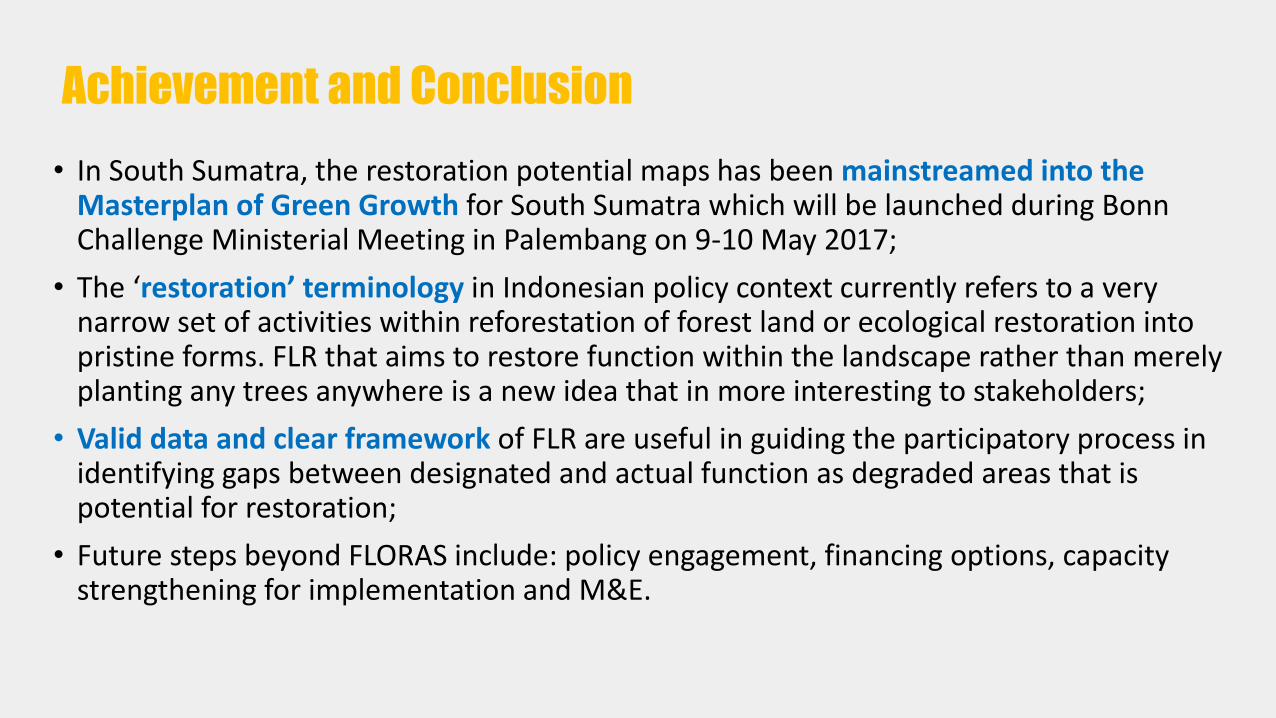
• In South Sumatra, the restoration potential maps has been mainstreamed into the Masterplan of Green Growth for South Sumatra which will be launched during Bonn Challenge Ministerial Meeting in Palembang on 9-10 May 2017;
• The ‘restoration’ terminology in Indonesian policy context currently refers to a very narrow set of activities within reforestation of forest land or ecological restoration into pristine forms. FLR that aims to restore function within the landscape rather than merely planting any trees anywhere is a new idea that in more interesting to stakeholders;
• Valid data and clear framework of FLR are useful in guiding the participatory process in identifying gaps between designated and actual function as degraded areas that is potential for restoration;
• Future steps beyond FLORAS include: policy engagement, financing options, capacity strengthening for implementation and M&E.

Thank you