Paramount Gold - Sleeper Project - PEA Technical Report · Paramount Gold and Silver Corp....
261
TECHNICAL REPORT AND PRELIMINARY ECONOMIC ASSESSMENT SLEEPER GOLD PROJECT, NEVADA USA PARAMOUNT GOLD AND SILVER CORP. JULY 30, 2012 PREPARED BY SCOTT E. WILSON CONSULTING, INC. SRK CONSULTING (CHILE) S.A. Scott E Wilson Consulting Inc 9137 S. Ridgeline Blvd., Ste 140 Highlands Ranch, CO 80129 Phone: (720) 348-1646 Fax: (303) 790-1872 www.wilsonmining.com
Transcript of Paramount Gold - Sleeper Project - PEA Technical Report · Paramount Gold and Silver Corp....

TECHNICAL REPORT AND
PRELIMINARY ECONOMIC ASSESSMENT
SLEEPER GOLD PROJECT, NEVADA
USA
PARAMOUNT GOLD AND SILVER CORP.
JULY 30, 2012
PREPARED BY
SCOTT E. WILSON CONSULTING, INC.
SRK CONSULTING (CHILE) S.A.
Scott E Wilson Consulting Inc
9137 S. Ridgeline Blvd., Ste 140
Highlands Ranch, CO 80129
Phone: (720) 348-1646
Fax: (303) 790-1872
www.wilsonmining.com
Paramount Gold and Silver Corp. Technical Report – Sleeper Project Page II
Scott E. Wilson Consulting, Inc. Sleeper Technical Report
DATE AND SIGNATURE PAGE
Technical Report and Preliminary Economic Assessment Sleeper Gold Project, Nevada, U.S.A.
Paramount Gold and Silver Corp.
665 Anderson Street
Winnemucca, Nevada
U.S.A.
Scott E. Wilson Consulting, Inc.
9137 S. Ridgeline Blvd., Ste 140
Highlands Ranch, CO 80129
USA
Website: www.wilsonmining.com
Tel: +1 (720) 348-1646
Fax: +1 (303) 790-1872
SRK Consulting (Chile) S.A.
Av. Apoquindo 4001, Piso 7º
Las Condes - Santiago
Chile
e-mail: [email protected]
website: www.srk.cl
Tel: +(56-2) 4890 800
Fax: +(56-2) 4890 801
SRK Project Number 05-2410-01
Paramount Gold and Silver Corp. Technical Report – Sleeper Project Page III
Scott E. Wilson Consulting, Inc. Sleeper Technical Report
Compiled by:
Scott E. Wilson
President, Scott E. Wilson Consulting, Inc.
William Pennstrom, Jr.
President, Pennstrom Consulting, Inc.
George Even
Principal Geologist, SRK
Carl E. Brechtel
Mining Engineer, Carl Brechtel Consulting, LLC
Paramount Gold and Silver Corp. Technical Report – Sleeper Project Page IV
Scott E. Wilson Consulting, Inc. Sleeper Technical Report
AUTHOR’S CERTIFICATE – GEORGE EVAN
I, George Even, residing at Vital Apoquindo 941, Las Condes, Santiago, Chile, do hereby certify that:
1. I am a Principal Geologist with the firm of SRK Consulting (Chile) S.A. (SRK) with an office at Av. Vitacura 2939 Piso 5, Las Condes, Santiago, Chile;
2. I am a graduate of San Diego State University in San Diego, California U.S.A. with a BSc. in Geology in 1972. I have practiced my profession continuously since 1972;
3. I am a Professional Geologist registered with the AusIMM of Australia (#228861) and also with the AIG (#3616) of Australia;
4. I have not received, nor do I expect to receive, any interest, directly or indirectly, in the Sleeper project or securities of Paramount Gold.
5. That, as of the date of this certificate, to the best of my knowledge, information and belief, this technical report contains all scientific and technical information that is required to be disclosed to make the technical report not misleading;
6. I have read National Instrument 43-101 and Form 43-101F1 and by reason of my education and past relevant work experience, I fulfill the requirements to be a “Qualified Person” for the purposes of NI 43-101. This technical report has been prepared in compliance with National Instrument 43-101 and Form 43-101F1;
7. As a qualified person, I am independent of the issuer as defined in Section 1.4 of National Instrument 43-101;
8. I am the author of the relevant portions of the following Sections of this report: 4, 5, 6, 7, 8, 9, 10, 11, 12, 14 and portions of 1, 2, 25, 26 and 27;
9. I have had no involvement, prior to this current work, with the Paramount Sleeper Property; 10. I have visited the Sleeper project and surrounding area during May, 2011; 11. SRK Consulting (Chile) S.A. was retained by Paramount Gold to prepare a mineral resource
estimate for the Sleeper project. This assignment was completed using CIM “Best practice” and Canadian Securities Administrators National Instrument 43-101 guidelines. The preceding report is based on our review of project files and discussions with Paramount Gold personnel;
12. I consent to the filing of the Technical Report with the securities regulatory authorities. Dated September 12, 2012
_____________________________ Signature of Qualified Person George Even Principle Geologist Printed Name of Qualified Person
Paramount Gold and Silver Corp. Technical Report – Sleeper Project Page V
Scott E. Wilson Consulting, Inc. Sleeper Technical Report
AUTHOR’S CERTIFICATE – SCOTT E. WILSON CPG
I, Scott Wilson, President of Scott E. Wilson Consulting, Inc., do hereby certify that:
1. I am currently employed as President by Scott E. Wilson Consulting, Inc., 9137 S. Ridgeline Blvd., Suite 140, Highlands Ranch, Colorado 80129. I graduated with a Bachelor of Arts degree in Geology from the California State University, Sacramento in 1989.
2. I am a Certified Professional Geologist and member of the American Institute of Professional Geologists (CPG #10965) and a Registered Member (#4025107) of the Society for Mining, Metallurgy and Exploration, Inc.
3. I have been employed as either a geologist or an engineer continuously for a total of 22 years. My experience included resource estimation, mine planning geological modeling and geostatistical evaluations of numerous projects throughout North and South America.
4. I have read the definition of “Qualified Person” set out in National Instrument 43-101 (“NI 43-101”) and certify that, by reason of my education, affiliation with a professional association and past relevant work experience, which includes acting as a Long Range Planning Engineer at Round Mountain, Nevada from 1994 through 1998 as well as numerous roles in equipment sizing studies as a consultant for U.S. Borax, Allied Nevada Gold Corporation and Placer Dome’s Bald Mountain Mine, I fulfill the requirements to be a “Qualified Person” for the purposes of NI 43-101.
5. I am the lead author of the technical report titled “Technical Report and Preliminary Economic Assessment for the Sleeper Gold Project, Nevada, USA dated July 30, 2012 (the “Technical Report”). I visited the Sleeper property on May 7, 2012 for one day.
6. As of the date of this certificate, to the best of my knowledge, information and belief, the portion of the Technical Report for which I am responsible contains all scientific and technical information that is required to be disclosed to make the portion of the Technical Report for which I am responsible not misleading.
7. That I have read NI 43-101 and Form 43-101F1, and that this technical report was prepared in compliance with NI 43-101
8. I am independent of the issuer applying all of the tests in section 1.5 of National Instrument 43-101.
9. I consent to the filing of the Technical Report with any stock exchange and other regulatory authority and any publication by them, including electronic publication in the public company files on their websites accessible by the public, of the Technical Report.
Dated September 12, 2012.
Scott E. Wilson, C.P.G.
Paramount Gold and Silver Corp. Technical Report – Sleeper Project Page VI
Scott E. Wilson Consulting, Inc. Sleeper Technical Report
AUTHOR’S CERTIFICATE – BILL PENNSTROM JR.
I, William Pennstrom, Jr., President of Pennstrom Consulting Inc., do hereby certify that:
1. I am a consulting metallurgical engineer and President of Pennstrom Consulting, Inc. 2728 Southshire Rd. Highlands Ranch, CO 80126, USA.
2. I am a graduate of the University of Missouri Rolla (currently known as Missouri S&T) with a BS degree in Metallurgical Engineering. I am also a graduate of Webster University in St. Louis, MO, with a MA degree in Business Management.
3. I am a Registered Member in good standing of the Society of Mining, Metallurgy and Exploration. I am also a Qualified Professional Member of the Mining and Metallurgical Society of America.
4. I have worked in the Mineral Processing Industry for a total of 28 years since before, during, and after my attending the University of Missouri. I have been an independent process/metallurgical consultant for the last nine (9) years for the mining industry.
5. I have read the definition of “qualified person” set out in National Instrument 43-101 and certify that by reason of education, experience, independence and affiliation with a professional association, I meet the requirements of an Independent Qualified Person as defined in National Instrument 43-101.
6. I am responsible for the preparation of Sections 13, 17, and 21, and relevant portions of Sections 1, 2, 25 and 26 of the technical report titled “Technical Report and Preliminary Economic Assessment for the Sleeper Gold Project, Nevada, USA” dated July 30, 2012 (the “Technical Report”). I visited the property on May 7, 2012.
7. Prior to being retained by Paramount Gold and Silver Corp., I have not previously worked on this deposit.
8. As of the date of this certificate, to the best of my knowledge, information and belief, the portion of the Technical Report for which I am responsible contains all scientific and technical information that is required to be disclosed to make the portion of the Technical Report for which I am responsible not misleading.
9. I am independent of the issuer applying all of the tests in section 1.5 of National Instrument 43-101.
10. I have read National Instrument 43-101 and Form 43-101F1, and the Technical Report has been prepared in compliance with that instrument and form.
Dated September 12, 2012
(signed) William Pennstrom, Jr. [Sealed]
William Pennstrom, Jr., M.A.
Paramount Gold and Silver Corp. Technical Report – Sleeper Project Page VII
Scott E. Wilson Consulting, Inc. Sleeper Technical Report
AUTHOR’S CERTIFICATE – CARL E. BRECHTEL, PE
I, Carl E. Brechtel, Principal, Carl Brechtel Consulting LLC, do hereby certify that:
1. I am a consulting mining engineer and Principal of Carl Brechtel Consulting LLC, 6439 Umber Circle, Arvada, CO 80007.
2. I am a graduate of the University of Utah, with a BS in Geological Engineering and an MS in Mining Engineering.
3. I am a Registered Member (SME 353000RM) in good standing of the Society of Mining, Metallurgy and Exploration, and a licensed Professional Engineer in the States of Colorado and Nevada, USA.
4. I have worked in the Mining Industry for 37 years. 5. I have read the definition of “qualified person” set out in National Instrument 43-101 and certify
that by reason of education, experience, independence and affiliation with a professional association, I meet the requirements of an Independent Qualified Person as defined in National Instrument 43-101.
6. I am responsible for the preparation of Sections 18, 19, 20, 21 and 22, and relevant portions of Sections 1, 2, 25 and 26 of the technical report titled “Technical Report and Preliminary Economic Assessment for the Sleeper Gold Project, Nevada, USA” dated July 30, 2012 2012 (the “Technical Report”). I have visited the property on May 7, 2012.
7. Prior to being retained by Paramount Gold and Silver Corp., I have not previously worked on this deposit.
8. As of the date of this certificate, to the best of my knowledge, information and belief, the portion of the Technical Report for which I am responsible contains all scientific and technical information that is required to be disclosed to make the portion of the Technical Report for which I am responsible not misleading.
9. I am independent of the issuer applying all of the tests in section 1.5 of National Instrument 43-101.
10. I have read National Instrument 43-101 and Form 43-101F1, and the Technical Report has been prepared in compliance with that instrument and form.
Dated September 12, 2012
(signed) Carl E. Brechtel [Sealed]
Carl E. Brechtel, PE
Paramount Gold and Silver Corp. Technical Report – Sleeper Project Page VIII
Scott E. Wilson Consulting, Inc. Sleeper Technical Report
Table of Contents
1 Summary ....................................................................................................................................... 1
1.1 Introduction .................................................................................................................................. 1
1.2 History ........................................................................................................................................... 1
1.3 Geology and Mineralization .......................................................................................................... 1
1.4 Geological Modeling ..................................................................................................................... 2
1.5 Exploration and Drilling ................................................................................................................. 2
1.6 Mineral Resources ........................................................................................................................ 3
1.7 Mine Planning ............................................................................................................................... 4
1.8 Metallurgy ..................................................................................................................................... 5
1.9 Capital Costs .................................................................................................................................. 6
1.10 Operating Costs ............................................................................................................................. 6
1.11 Economic Analysis ......................................................................................................................... 6
1.12 Infrastructure ................................................................................................................................ 7
1.13 Interpretation and Conclusions .................................................................................................... 7
1.14 Recommendations ........................................................................................................................ 8
2 Introduction .................................................................................................................................. 9
2.1 Scope of Work ............................................................................................................................. 10
2.2 Work Program ............................................................................................................................. 10
2.3 Basis of the Technical Report ...................................................................................................... 11
2.4 Qualifications of SEWC and SRK .................................................................................................. 11
2.5 Site Visit....................................................................................................................................... 12
2.6 Acknowledgements ..................................................................................................................... 12
3 Reliance on Other Experts and Disclaimer .................................................................................. 13
4 Property Description and Location ............................................................................................. 15
4.1 Introduction ................................................................................................................................ 15
4.1.1 Land Tenure ........................................................................................................................ 15
4.2 Underlying Ownership ................................................................................................................ 16
4.3 Mineral Rights in Nevada ............................................................................................................ 16
Paramount Gold and Silver Corp. Technical Report – Sleeper Project Page IX
Scott E. Wilson Consulting, Inc. Sleeper Technical Report
4.4 Environmental Studies, Permitting and Social or Community Impact ........................................ 17
5 Accessibility, Climate, Local Resources, Infrastructure and Physiography ................................. 19
6 History ......................................................................................................................................... 20
6.1 Pre-AMAX .................................................................................................................................... 20
6.2 AMAX .......................................................................................................................................... 20
6.3 X-CAL ........................................................................................................................................... 21
6.4 New Sleeper Gold ....................................................................................................................... 21
6.5 Paramount .................................................................................................................................. 23
7 Geological Setting, Mineralization and Modeling ....................................................................... 24
7.1 Regional Geology ........................................................................................................................ 24
7.2 Property Geology ........................................................................................................................ 26
7.3 Mineralization ............................................................................................................................. 30
7.3.1 Mineralization and Alteration ............................................................................................. 30
7.4 Geological Modeling ................................................................................................................... 31
7.4.1 Methodology ....................................................................................................................... 31
7.4.2 Summary of Geological Modeling Process .......................................................................... 34
7.4.3 Structural Modeling ............................................................................................................ 35
7.4.4 Mineralization Model .......................................................................................................... 37
7.4.5 Lithological Model ............................................................................................................... 39
7.4.6 Results and Recommendations ........................................................................................... 42
7.4.7 Recommendations .............................................................................................................. 43
8 Deposit Type ............................................................................................................................... 44
9 Exploration .................................................................................................................................. 45
9.1 2004 and 2005 Exploration Programs ......................................................................................... 45
9.2 2006 and 2007 Exploration Programs ......................................................................................... 45
9.3 Drill Targets Determined is 2006 and 2007 ................................................................................ 46
9.4 Geophysical Surveys.................................................................................................................... 46
9.5 Air Magnetic Survey .................................................................................................................... 47
9.6 Geochemical Surveys .................................................................................................................. 47
Paramount Gold and Silver Corp. Technical Report – Sleeper Project Page X
Scott E. Wilson Consulting, Inc. Sleeper Technical Report
9.7 Surveying ..................................................................................................................................... 47
10 Paramount Drill Program 2010-2011 .......................................................................................... 48
10.1 West Wood Area ......................................................................................................................... 48
10.2 Facilities Area .............................................................................................................................. 49
10.3 Geologic Gold Controls Recognized ............................................................................................ 49
11 Sample Preparation, Analyses and Security................................................................................ 50
11.1 Sample Method ........................................................................................................................... 50
11.2 Procedures for Drilling and Sampling ......................................................................................... 50
11.3 Positioning Drill Equipment ........................................................................................................ 51
11.4 Collecting Core ............................................................................................................................ 51
11.5 Reverse Circulation Drilling ......................................................................................................... 52
11.6 Paramount 2010-2011 Drill Programme ..................................................................................... 53
11.7 Sample Control Procedures ........................................................................................................ 54
11.8 Assay Submittal for Core and RCD .............................................................................................. 55
11.9 Duplicate Samples and Reference Materials .............................................................................. 55
11.10 Security ................................................................................................................................... 55
11.11 Specific Gravity Data ............................................................................................................... 56
12 Data Verification ......................................................................................................................... 58
12.1 AMAX Data .................................................................................................................................. 58
12.2 2007 Assay Quality Control Programme ..................................................................................... 59
12.3 Field Duplicates ........................................................................................................................... 59
12.4 Reference Samples ...................................................................................................................... 59
12.5 Assay Submittal for Core and RCD .............................................................................................. 60
12.6 SRK Data Verification .................................................................................................................. 60
13 Mineral Processing and Metallurgy ............................................................................................ 62
13.1 Process Recovery Assumptions ................................................................................................... 68
14 Mineral Resource Estimation ...................................................................................................... 70
14.1 Introduction ................................................................................................................................ 70
14.2 Development ............................................................................................................................... 70
Paramount Gold and Silver Corp. Technical Report – Sleeper Project Page XI
Scott E. Wilson Consulting, Inc. Sleeper Technical Report
14.2.1 Geology ............................................................................................................................... 70
14.2.2 Database ............................................................................................................................. 73
14.2.3 Estimation Unit ................................................................................................................... 84
14.2.4 Contact Profile Analysis ...................................................................................................... 92
14.3 Au and Ag Variographic Analysis ................................................................................................. 94
14.3.1 Variographic Maps .............................................................................................................. 94
14.3.2 Down the Hole Variograms ................................................................................................. 96
14.3.3 Directional Variograms ..................................................................................................... 110
14.4 Au and Ag Resource Estimation ................................................................................................ 124
14.4.1 Block Model ...................................................................................................................... 124
14.4.2 High Grade Values ............................................................................................................. 125
14.4.3 Au and Ag Estimation Plan ................................................................................................ 126
14.5 Au and Ag Validations ............................................................................................................... 130
14.5.1 Conditional Bias Review .................................................................................................... 130
14.6 Resource Classification ............................................................................................................. 138
14.7 Mineral Zone ............................................................................................................................. 138
14.8 Densities .................................................................................................................................... 140
14.9 Re-block..................................................................................................................................... 140
14.10 Volume .................................................................................................................................. 141
14.11 In-Mine Resources ................................................................................................................ 145
14.12 Estimation of Global Resource in Mine Dumps .................................................................... 145
15 Mineral Reserve Estimates ....................................................................................................... 146
16 Mining Methods ........................................................................................................................ 147
16.1 Mine Optimaztion ..................................................................................................................... 147
16.2 Mine Dewatering ...................................................................................................................... 151
16.3 Production Schedule ................................................................................................................. 152
16.4 Mobile Equipment Fleet ........................................................................................................... 153
17 Recovery Methods .................................................................................................................... 155
18 Infrastructure ............................................................................................................................ 156
Paramount Gold and Silver Corp. Technical Report – Sleeper Project Page XII
Scott E. Wilson Consulting, Inc. Sleeper Technical Report
18.1 Location and Access .................................................................................................................. 156
18.2 Human Resources ..................................................................................................................... 156
18.3 Electrical Power......................................................................................................................... 156
18.4 Water ........................................................................................................................................ 156
18.5 Facilities..................................................................................................................................... 157
18.6 Heap Leach pad and ADR plant ................................................................................................. 160
18.7 Overburden Dump .................................................................................................................... 160
19 Market Studies and Contracts................................................................................................... 161
20 Environmental Studies, Permitting and Social or Community Impact ...................................... 162
20.1 Historical Status of the Sleeper Mine ....................................................................................... 162
20.2 Existing Permits ......................................................................................................................... 162
20.3 Permit Requirements for New Mining Operations ................................................................... 163
20.3.1 Plans of Operations/Nevada Reclamation Permit ............................................................ 163
20.3.2 Water Pollution Control Permit Application ..................................................................... 163
20.3.3 Air Quality Operating Permit ............................................................................................ 164
20.3.4 Water Rights...................................................................................................................... 164
20.3.5 Industrial Artificial Pond Permit ........................................................................................ 164
20.3.6 Minor Permites and Applications ..................................................................................... 164
21 Capital and Operating Costs ...................................................................................................... 165
21.1 Capital Costs .............................................................................................................................. 166
21.1.1 Project Capital Cost – Year 1 ............................................................................................. 166
21.1.2 Sustaining Capital .............................................................................................................. 166
21.2 Working Cost ............................................................................................................................. 167
21.3 Initial Fills .................................................................................................................................. 167
21.4 Operating Cost .......................................................................................................................... 167
22 Economic Analysis ..................................................................................................................... 168
22.1 Economic Performance Parameters ......................................................................................... 168
22.2 Cash Flow Schedule ................................................................................................................... 170
22.3 Sensitivity .................................................................................................................................. 170
Paramount Gold and Silver Corp. Technical Report – Sleeper Project Page XIII
Scott E. Wilson Consulting, Inc. Sleeper Technical Report
23 Adjacent Properties .................................................................................................................. 175
24 Other Relevant Data and Information ...................................................................................... 176
25 Interpretation and Conclusions ................................................................................................ 177
26 Recommendations .................................................................................................................... 178
27 References ................................................................................................................................ 179
Paramount Gold and Silver Corp. Technical Report – Sleeper Project Page XIV
Scott E. Wilson Consulting, Inc. Sleeper Technical Report
List of Tables
Table 1.1 Global Measured Resources .......................................................................................................... 3
Table 1.2 Global Indicated Resources ........................................................................................................... 3
Table 1.3 Global Measured Plus Indicated Resources .................................................................................. 3
Table 1.4 Global Inferred Resources ............................................................................................................. 4
Table 1.5 Inferred Resources Contained in Mine Dumps ............................................................................. 4
Table 1.6 In-pit Resources and Mineralized Dumps Used for Production Scheduling ................................. 5
Table 1.7 Life of Mine Estimated Capital Costs ............................................................................................. 6
Table 1.8 Estimated Unit Operating Costs .................................................................................................... 6
Table 1.9 Pre-Tax Projected Economic Results (US $) .................................................................................. 7
Table 10.1 Paramount drilling in 2010-2011 .............................................................................................. 48
Table 13.1 Historic Heap leach head grades and recoveries (Au) .............................................................. 62
Table 13.2 AMAX Historical Heap Leach Production Statistics ................................................................... 63
Table 13.3 Historic Mill head grades and recoveries (Au) .......................................................................... 63
Table 13.4 Bottle Roll Tests Results Facility Ore KCA, 2008 ........................................................................ 64
Table 13.5 Summary Metallurgical Results, Agitated Cyanidation Tests, Sleeper Waste Dump Composites, P80 19mm Feeds .................................................................................................................... 65
Table 13.6 Provides The Summary Results For Agitated Cyanide Leach Tests Performed On The Westwood And Facilities Core Composites Comparing Gold Recovery Results At Eighty Percent Passing Particle Sizes of 75 µm and 19 mm. ............................................................................................................ 65
Table 13.7 Provides Flotation Test Recovery Data For The Westwood And Facilities Core Composites, And For The North Waste Dump Composites. ............................................................................................ 66
Table 13.8 Summary Gold Results, Column Leach Tests, Waste Dump and .............................................. 66
Table 14.1 Geological Solids ....................................................................................................................... 70
Table 14.2 Variable Assignment.................................................................................................................. 72
Table 14.3 Sectors by Grade ....................................................................................................................... 73
Table 14.4 Au Geological Units of Estimation ............................................................................................. 85
Table 14.5 Ag Geological Units of Estimation ............................................................................................. 89
Table 14.6 Au Contact Profile Analysis of the Sleeper Estimation .............................................................. 93
Table 14.7 Au Unit Contact Profile Analysis of the Facility Estimation ....................................................... 93
Table 14.8 Au Unit Contact Profile Analysis of the West Wood Estimation ............................................... 94
Paramount Gold and Silver Corp. Technical Report – Sleeper Project Page XV
Scott E. Wilson Consulting, Inc. Sleeper Technical Report
Table 14.9 Au Search Angles ....................................................................................................................... 95
Table 14.10 Ag Search Angles ..................................................................................................................... 96
Table 14.11 Nugget Effect per Unit........................................................................................................... 110
Table 14.12 High Grades Restriction ......................................................................................................... 126
Table 14.13 Au Estimation Plan ................................................................................................................ 128
Table 14.14 Ag Estimation Plan ................................................................................................................ 129
Table 14.15 Resource Characterization Values......................................................................................... 138
Table 14.16 Mineral Zone Indicator Kriging .............................................................................................. 140
Table 14.17 Global Volume Per EU ........................................................................................................... 141
Table 14.18 Global Volume per EU by Category ....................................................................................... 142
Table 14.19 Oxide Global Volume per EU with 0.2 ppm Au Cut-off by Category ..................................... 142
Table 14.20 Sulphide Global Volume per EU with 0.25 ppm Au Cut-off by Category .............................. 143
Table 14.21 Oxide Measured and Indicated Mineral Resources at Sleeper by Au cut-off ....................... 143
Table 14.22 Oxide Inferred Mineral Resources at Sleeper by Au cut-off ................................................. 143
Table 14.23 Sulphide Measured and Indicated Mineral Resources at Sleeper by Au cut-off .................. 143
Table 14.24 Sulphide Inferred Mineral Resources At Sleeper By Au Cut-off ............................................ 144
Table 14.25 Alluvial Inferred Mineral Eesources At Sleeper By Au Cut-off .............................................. 144
Table 14.26 Paramount Sleeper Deposit Global Measured Resources As Of October 28, 2011.............. 144
Table 14.27 Paramount Sleeper Deposit Global Indicated Resources as of October 28, 2011 ................ 144
Table 14.28 Paramount Sleeper Deposit Global Measured and indicated ............................................... 144
Table 14.29 Paramount Sleeper Deposit Global Inferred Resources as of October 28, 2011 .................. 145
Table 14.30 Historic Mine Dump Grade Estimation Parameters .............................................................. 145
Table 14.31 Inferred Resource Contained in Mine Dumps ....................................................................... 145
Table 16.1 Parameters Used for Whittle Optimization ............................................................................ 148
Table 16.2 Sleeper Production Volumes, Strip Ratio and Average Grades for Gold Prices from $1,000 - $2,000 per Ounce ...................................................................................................................................... 148
Table 16.3 Component of Sleeper Mining Production ............................................................................. 152
Table 16.4 Projected Production Schedule for Sleeper Mining ................................................................ 153
Table 16.5 Estimated Mobile Equipment Fleet for Sleeper Mining .......................................................... 154
Table 18.1 History Sleeper Mine Layout ................................................................................................... 158
Paramount Gold and Silver Corp. Technical Report – Sleeper Project Page XVI
Scott E. Wilson Consulting, Inc. Sleeper Technical Report
Table 18.2 New Conceptual Sleeper Site Layout ...................................................................................... 159
Table 20.1 REQUIRED MINOR PERMITS AND APPLICATIONS ................................................................... 165
Table 21.1 Total Estimated Capital Expenditure ....................................................................................... 166
Table 21.2 Project Capital Costs Elements - Year 1 .................................................................................. 166
Table 21.3 Sustaining Capital Cost ............................................................................................................ 167
Table 21.4 Sleeper Estimated Unit Operating Costs ................................................................................. 167
Table 22.1 Projected Economic and Physical Performance Parameters for the Sleeper Evaluation Using Base Case and Spot Price Assumptions .................................................................................................... 169
Table 22.2 Summary of the Projected Physical Data for the Estimated Sleeper Production Schedule ... 169
Table 22.3 Projected Operating, Capital and Total Cost Summary - Sleeper Gold and Silver Project ...... 170
Table 22.4 Projected Sleeper Annual Production and Cash Flow (no royalty or tax considered) ............ 171
Table 22.5 Sensitivity of NPV @ 5% and IRR to Gold Price Between $US 1,000 and $US 1,900 per Au Ounce (silver price $US 26.33 per ounce) ................................................................................................. 172
Table 22.6 Sensitivity of NPV @ 5% and IRR to Gold Recovery (silver price $US26.33 per Ounce) ......... 172
Table 22.7 Sensitivity of NPV@5% and IRR for Changes in ...................................................................... 173
Table 22.8 Sensitivity of NPV and IRR to Changes in the Capital Cost ...................................................... 173
Paramount Gold and Silver Corp. Technical Report – Sleeper Project Page XVII
Scott E. Wilson Consulting, Inc. Sleeper Technical Report
List of Figures
Figure 2.1 Location of the Sleeper Project .................................................................................................... 9
Figure 4.1 Sleeper Tenement Map.............................................................................................................. 15
Figure 6.1 Sleeper Resources Areas Studied By The Joint Venture ............................................................ 22
Figure 7.1 Regional Geology of the Sleeper area ........................................................................................ 25
Figure 7.2 Sleeper Deposit Bedrock Geology .............................................................................................. 29
Figure 7.3 Example of implicit modeling of an Au mineralization zone (sliced view of the Westwood Area) .................................................................................................................................................................... 33
Figure 7.4 Schematic cross-section showing relationship between rocks exposed in the Slumbering Hills and at the Sleeper mine, prior to basin and range faulting and ensuing erosion and sedimentation (Conrad et al., 1993). .................................................................................................................................. 34
Figure 7.5 Sleeper Deposit Blasthole and Drillhole Data. ........................................................................... 36
Figure 7.6 Plan View of Au Wireframes (yellow > 0.3 ppm, green > 0.1 ppm, red > 1 ppm). .................... 37
Figure 7.7 3D Sliced View of Au Wireframes (view from the SW). ............................................................. 38
Figure 7.8 Alluvial Au wireframes (view from the SW). .............................................................................. 38
Figure 7.9 Code Partition Chart, Sleeper Lithological Model. ..................................................................... 39
Figure 7.10 Lithological model: Plan view (below overburden) and sliced view from the SW .................. 40
Figure 7.11 Structural domains used as hard boundaries for lithological model. ...................................... 41
Figure 13.1 Column Test Recovery Leach Profiles for Waste Dump Composites, P8019mm Feeds .......... 67
Figure 13.2 Column Test Recovery Leach Profiles for Facilities Oxide Core Composites, P8019mm Feeds .................................................................................................................................................................... 68
Figure 14.1 Sample Length Histograms ...................................................................................................... 74
Figure 14.2 Box Plot Au by Envelopes ......................................................................................................... 74
Figure 14.3 Box Plot Au by Sector ............................................................................................................... 76
Figure 14.4 Box Plot Au by Sector and Envelopes ...................................................................................... 77
Figure 14.5 Box Plot Au by Lithology .......................................................................................................... 78
Figure 14.6 Box Plot Au by Lithology in Sleeper ......................................................................................... 79
Figure 14.7 Box Plot Au by Lithology in Facility .......................................................................................... 80
Figure 14.8 Box Plot Au by Lithology in West Wood .................................................................................. 81
Figure 14.9 Box Plot Ag by Lithology in West Wood Sleeper...................................................................... 82
Figure 14.10 Box Plot Ag by Lithology in Facility ........................................................................................ 83
Paramount Gold and Silver Corp. Technical Report – Sleeper Project Page XVIII
Scott E. Wilson Consulting, Inc. Sleeper Technical Report
Figure 14.11 Box Plot Ag by Lithology in West Wood ................................................................................. 84
Figure 14.12 Au Probability Plots of Sleeper Estimation Unit .................................................................... 86
Figure 14.13 Au Probability Plots of Facility Esimation Unit ....................................................................... 87
Figure 14.14 Au Probability Plots of West Wood Estimination Unit .......................................................... 88
Figure 14.15 Ag Probability Plots Unit of Sleeper Estimation ..................................................................... 90
Figure 14.16 Ag Probability Plots Unit of Facility Estimation ...................................................................... 91
Figure 14.17 Ag Probability Plots Unit of West Wood Estimation .............................................................. 92
Figure 14.18 UG Au 13 DTH Variogram....................................................................................................... 97
Figure 14.19 UG Au 14 DTH Variogram....................................................................................................... 97
Figure 14.20 UG Au 16 DTH Variogram....................................................................................................... 98
Figure 14.21 UG Au 17 DTH Variogram....................................................................................................... 98
Figure 14.22 UG Au 22 DTH Variogram....................................................................................................... 99
Figure 14.23 UG Au 23 DTH Variogram....................................................................................................... 99
Figure 14.24 UG Au 24 DTH Variogram..................................................................................................... 100
Figure 14.25 UG Au 26 DTH Variogram..................................................................................................... 100
Figure 14.26 UG Au 27 DTH Variogram..................................................................................................... 101
Figure 14.27 UG Au 32 DTH Variogram..................................................................................................... 101
Figure 14.28 UG Au 33 DTH Variogram..................................................................................................... 102
Figure 14.29 UG Au 34 DTH Variogram..................................................................................................... 102
Figure 14.30 UG Au 36 DTH Variogram..................................................................................................... 103
Figure 14.31 UG Au 37 DTH Variogram..................................................................................................... 103
Figure 14.32 UG Ag 14 DTH Variogram ..................................................................................................... 104
Figure 14.33 UG Ag 16 DTH Variogram ..................................................................................................... 104
Figure 14.34 UG Ag 17 DTH Variogram ..................................................................................................... 105
Figure 14.35 UG Ag 23 DTH Variogram ..................................................................................................... 105
Figure 14.36 UG Ag 23 DTH Variogram ..................................................................................................... 106
Figure 14.37 UG Ag 26 DTH Variogram ..................................................................................................... 106
Figure 14.38 UG Ag 26 DTH Variogram ..................................................................................................... 107
Figure 14.39 UG Ag 27 DTH Variogram ..................................................................................................... 107
Paramount Gold and Silver Corp. Technical Report – Sleeper Project Page XIX
Scott E. Wilson Consulting, Inc. Sleeper Technical Report
Figure 14.40 UG Ag 32 DTH Variogram ..................................................................................................... 108
Figure 14.41 UG Ag 33 DTH Variogram ..................................................................................................... 108
Figure 14.42 UG Ag 36 DTH Variogram ..................................................................................................... 109
Figure 14.43 UG Ag 37 DTH Variogram ..................................................................................................... 109
Figure 14.44 EU Au 13 Directional Variogram .......................................................................................... 111
Figure 14.45 EU Ag 14 Directional Variogram........................................................................................... 111
Figure 14.46 EU Au 16 Directional Variogram .......................................................................................... 112
Figure 14.47 EU Au 17 Directional Variogram .......................................................................................... 112
Figure 14.48 EU Ag 22 Directional Variogram........................................................................................... 113
Figure 14.49 EU Au 23 Directional Variogram .......................................................................................... 113
Figure 14.50 EU Au 24 Directional Variogram .......................................................................................... 113
Figure 14.51 EU Au 26 Directional Variogram .......................................................................................... 114
Figure 14.52 EU Au 27 Directional Variogram .......................................................................................... 115
Figure 14.53 EU Au 32 Directional Variogram .......................................................................................... 115
Figure 14.54 EU Au 33 Directional Variogram .......................................................................................... 115
Figure 14.55 EU Au 34 Directional Variogram .......................................................................................... 116
Figure 14.56 EU Au 37 Directional Variogram .......................................................................................... 117
Figure 14.57 EU Au 37 Directional Variogram .......................................................................................... 117
Figure 14.58 EU Ag 14 Directional Variogram........................................................................................... 118
Figure 14.59 EU Ag 16 Directional Variogram........................................................................................... 118
Figure 14.60 EU Ag 17 Directional Variogram........................................................................................... 119
Figure 14.61 EU Ag 22 Directional Variogram........................................................................................... 119
Figure 14.62 EU Ag 23 Directional Variogram........................................................................................... 120
Figure 14.63 EU Ag 24 Directional Variogram........................................................................................... 120
Figure 14.64 EU Ag 26 Directional Variogram........................................................................................... 121
Figure 14.65 EU Ag 27 Directional Variogram........................................................................................... 121
Figure 14.66 EU Ag 32 Directional Variogram........................................................................................... 122
Figure 14.67 EU Ag 33 Directional Variogram........................................................................................... 122
Figure 14.68 EU Ag 36 Directional Variogram........................................................................................... 123
Paramount Gold and Silver Corp. Technical Report – Sleeper Project Page XX
Scott E. Wilson Consulting, Inc. Sleeper Technical Report
Figure 14.69 EU Ag 37 Directional Variogram........................................................................................... 123
Figure 14.70 EU Au 12 Conditional Bias .................................................................................................... 130
Figure 14.71 EU Au Conditional Bias ......................................................................................................... 131
Figure 14.72 EU Au 14 Conditional Bias .................................................................................................... 131
Figure 14.73 EU Au 16 Conditional Bias .................................................................................................... 132
Figure 14.74 EU Au 17 Conditional Bias .................................................................................................... 132
Figure 14.75 EU Au 22 Conditional Bias .................................................................................................... 133
Figure 14.76 EU Au 23 Conditional Bias .................................................................................................... 133
Figure 14.77 EU Au 24 Conditional Bias .................................................................................................... 133
Figure 14.78 EU Au 26 Conditional Bias .................................................................................................... 134
Figure 14.79 EU Au 27 Conditional Bias .................................................................................................... 135
Figure 14.80 Sesgo Condicional EU Au 32 ................................................................................................. 135
Figure 14.81 EU Au 33 Conditional Bias .................................................................................................... 136
Figure 14.82 EU Au 34 Conditional Bias .................................................................................................... 136
Figure 14.83 EU Au 36 Conditional Bias .................................................................................................... 136
Figure 14.84 EU Au 37 Conditional Bias .................................................................................................... 137
Figure 14.85 Oxide Indicator Variogram ................................................................................................... 139
Figure 14.86 Sulphide Indicator Variogram .............................................................................................. 139
Figure 16.1 Graphical Comparison of Surface Mine Shells at Gold Price between $1,000 and $2,000 per ounce ........................................................................................................................................................ 149
Figure 16.2 Surface Photograph of the Sleeper Mine Lake With ............................................................. 150
Figure 16.3 Cross-Section through the Existing Sleeper Mine Excavation Showing the .......................... 151
Figure 22.1 Sensitivity of IRR to Operating Cost, Capital Cost and Gold Recovery or Price Around the Base Case Assumptions (0%) ............................................................................................................................. 174
Figure 22.2 Sensitivity of NPV@5% to Changes in Operating Cost, Capital Cost and Gold Recovery or Price Around the Base Case Assumptions (0%) ........................................................................................ 174

Paramount Gold and Silver Corp. Technical Report – Sleeper Project Page 1
Scott E. Wilson Consulting, Inc. Sleeper Technical Report
1 SUMMARY
1.1 INTRODUCTION
Paramount Gold and Silver Corporation in April, 2012 contracted Scott E. Wilson Consulting, Inc. (SEWC) to perform a Preliminary Economic Assessment (PEA) of the Sleeper Gold and Silver Project located in the Awakening Mining District, Humbolt County, Nevada, USA. The PEA was based on a resource and property evaluation performed by SRK Consulting (Chile) S.A. , and reported in “TECHNICAL REPORT PARAMOUNT GOLD AND SILVER CORP., SLEEPER GOLD PROJECT, NEVADA, USA” October 28, 2011.
The Sleeper Gold Property comprises 1,044 unpatented lode mining claims totaling approximately 30 square miles (6,709 hectares).
Paramount Gold and Silver Corp., is a public company listed and trading on the NYSE- American Stock Exchange (NYSE-AMEX) and the Toronto Stock Exchange (TSX). It acquired all the issued and outstanding shares of X-Cal Resources Ltd. in August 2010 by plan of arrangement. Paramount’s head office and mailing address is 665 Anderson Street, Winnemucca, Nevada 84445-3657.
Paramount through its subsidiaries, X-Cal Resources Lt., X-Cal USA Inc, New Sleeper Gold LLC and Sleeper Mining Company LLC control 100% of the 1,044 unpatented lode mining claims. All claims registered in the name of X-Cal USA are currently assigned to the New Sleeper Gold LLC.
1.2 HISTORY
AMAX first began production in 1986. The Sleeper operation was designed to treat oxide mineralization by both milling and heap leaching. There was no flotation circuit in the mill to recover gold bearing sulphides. The early pit mill feed was oxide material, but zones of sulphide mineralization were present in the pit. Reported gold production from the mill was 1,219,880 ounces and 438,609 ounces from heap leaching. Silver production totaled approximately 2.3 million ounces. The mine ceased production in 1996.
1.3 GEOLOGY AND MINERALIZATION
Four main types of gold mineralization are found within the Sleeper deposit and may represent a continuum as the system evolved from a high level, high sulphidation system dominated by intrusion related fluids and volatiles to a low sulphidation meteoric water dominant system. In this setting the paragenetic relationships of the differing mineralization styles are as follows:
• Early -quartz-pyrite-marcasite stockwork • Intermediate -medium-grade, silica-pyrite-marcasite cemented breccias localized on zones of
structural weakness • Late -high-grade, banded, quartz-adularia-electrum-(sericite) veins • Post -alluvial gold-silver deposits in Pliocene gravels
AMAX mined all four types of mineralization, with high-grade material (> 0.1 oz Au/ton) processed through the mill and low-grade (0.006 to 0.1 oz Au/ton) material processed by heap leaching. All were
Paramount Gold and Silver Corp. Technical Report – Sleeper Project Page 2
Scott E. Wilson Consulting, Inc. Sleeper Technical Report
mined by open pit methods from the Sleeper, Wood, and Office pits. The deposit was mined over a north-south distance of 4,500 ft (1,372 m) and an east-west width of approximately 2,100 ft (640 m).
The high-grade bonanza veins are banded and composed of layers of quartz-adularia-electrum, with minor carbonate, barite, and late stibnite. Veins ranging from 1 inch to 20 feet in true width were mined in the Sleeper, East Wood, West Wood and Office vein systems. Numerous other narrower or shorter veins have been found in the course of drilling and mining, including several below the final mined pit, and some hosted within Auld Lang Syne meta-sedimentary rocks.
Medium-grade breccias in the mine, which were clast-supported and cemented by silica, pyrite, marcasite and adularia, typically assay between 0.1 and 1.0 oz Au/ton. The pyrite-marcasite content of the higher-grade breccias was notably higher than in the veins. The silver content in mined breccias was typically three to six times the gold grade. Lower-grade stockwork and breccia mineralization accounted for approximately 20 percent of the gold production. Mineralized breccias extend below the depth of the Sleeper Mine open pits, as demonstrated by X-Cal drilling west of the Wood Pit, where the breccias are particularly rich in sulphides.
Alluvial gold mineralization of Miocene or Pliocene age was found and mined in the western part of the Sleeper pit. This Older Alluvium consists of poorly sorted conglomerates derived mostly from the weathering of altered Sleeper rhyolite and partly from vein/stockwork ores.
1.4 GEOLOGICAL MODELING
Leapfrog Support Chile (LSC) was retained by SRK Chile to create a 3D Geological model of Paramount’s Sleeper gold deposit in Nevada. The deliverable products of this work combines a 3D model for Au and Ag mineralization with a lithological model of the study area, to be used as geological domains for resource estimation by SRK. SRK Consulting geologists in Santiago, Chile, worked together with LSC to check the models and verify the process and interpretations. This was also monitored together with Paramount personnel during several meetings held during the process of this study.
1.5 EXPLORATION AND DRILLING
Following the ceasing of operations by AMAX in 1996, The Sleeper Joint Venture performed drilling in 2004 and 2005 concentrating on the West Wood and Facilities areas. X-Cal Resources drilled the Facilities area in 2006 – 2007, as well as other exploration target areas within the claim block. Paramount’s drilling in 2010 – 2011 concentrated on the West Wood and Facilities areas.
Paramount Gold and Silver Corp. Technical Report – Sleeper Project Page 3
Scott E. Wilson Consulting, Inc. Sleeper Technical Report
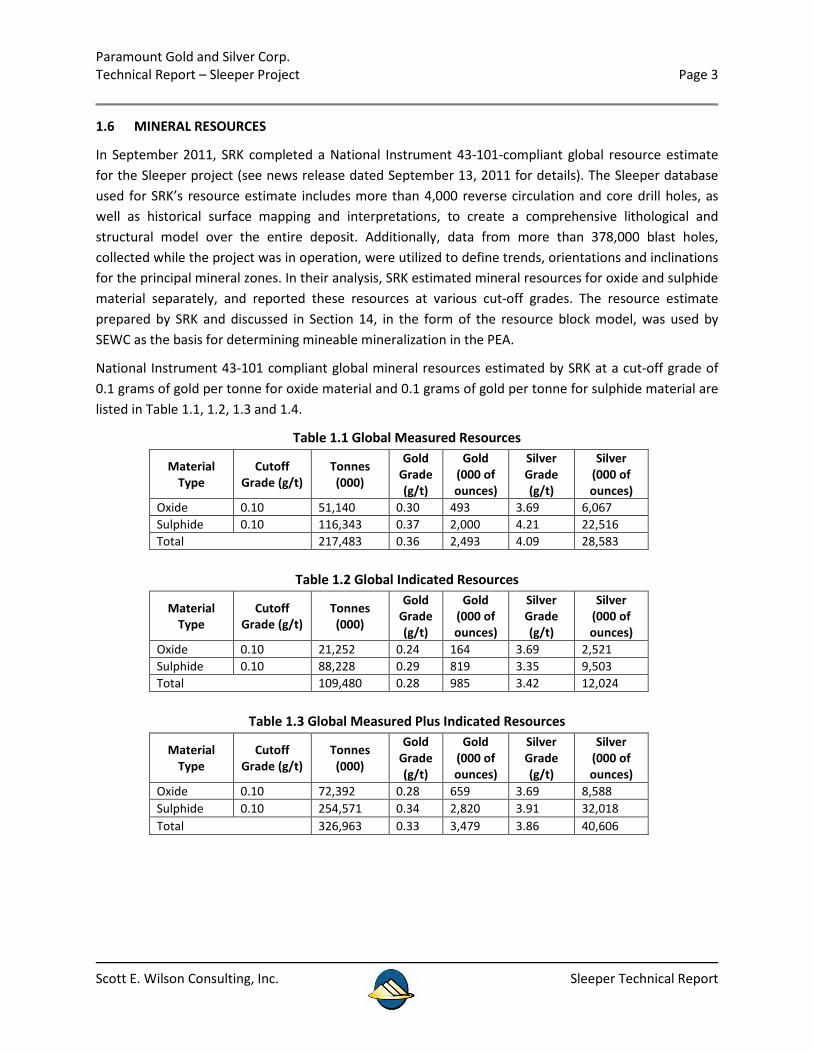
1.6 MINERAL RESOURCES
In September 2011, SRK completed a National Instrument 43-101-compliant global resource estimate for the Sleeper project (see news release dated September 13, 2011 for details). The Sleeper database used for SRK’s resource estimate includes more than 4,000 reverse circulation and core drill holes, as well as historical surface mapping and interpretations, to create a comprehensive lithological and structural model over the entire deposit. Additionally, data from more than 378,000 blast holes, collected while the project was in operation, were utilized to define trends, orientations and inclinations for the principal mineral zones. In their analysis, SRK estimated mineral resources for oxide and sulphide material separately, and reported these resources at various cut-off grades. The resource estimate prepared by SRK and discussed in Section 14, in the form of the resource block model, was used by SEWC as the basis for determining mineable mineralization in the PEA.
National Instrument 43-101 compliant global mineral resources estimated by SRK at a cut-off grade of 0.1 grams of gold per tonne for oxide material and 0.1 grams of gold per tonne for sulphide material are listed in Table 1.1, 1.2, 1.3 and 1.4.
Table 1.1 Global Measured Resources
Material Type
Cutoff Grade (g/t)
Tonnes (000)
Gold Grade (g/t)
Gold (000 of ounces)
Silver Grade (g/t)
Silver (000 of ounces)
Oxide 0.10 51,140 0.30 493 3.69 6,067 Sulphide 0.10 116,343 0.37 2,000 4.21 22,516 Total 217,483 0.36 2,493 4.09 28,583
Table 1.2 Global Indicated Resources
Material Type
Cutoff Grade (g/t)
Tonnes (000)
Gold Grade (g/t)
Gold (000 of ounces)
Silver Grade (g/t)
Silver (000 of ounces)
Oxide 0.10 21,252 0.24 164 3.69 2,521 Sulphide 0.10 88,228 0.29 819 3.35 9,503 Total 109,480 0.28 985 3.42 12,024
Table 1.3 Global Measured Plus Indicated Resources
Material Type
Cutoff Grade (g/t)
Tonnes (000)
Gold Grade (g/t)
Gold (000 of ounces)
Silver Grade (g/t)
Silver (000 of ounces)
Oxide 0.10 72,392 0.28 659 3.69 8,588 Sulphide 0.10 254,571 0.34 2,820 3.91 32,018 Total 326,963 0.33 3,479 3.86 40,606
Paramount Gold and Silver Corp. Technical Report – Sleeper Project Page 4
Scott E. Wilson Consulting, Inc. Sleeper Technical Report
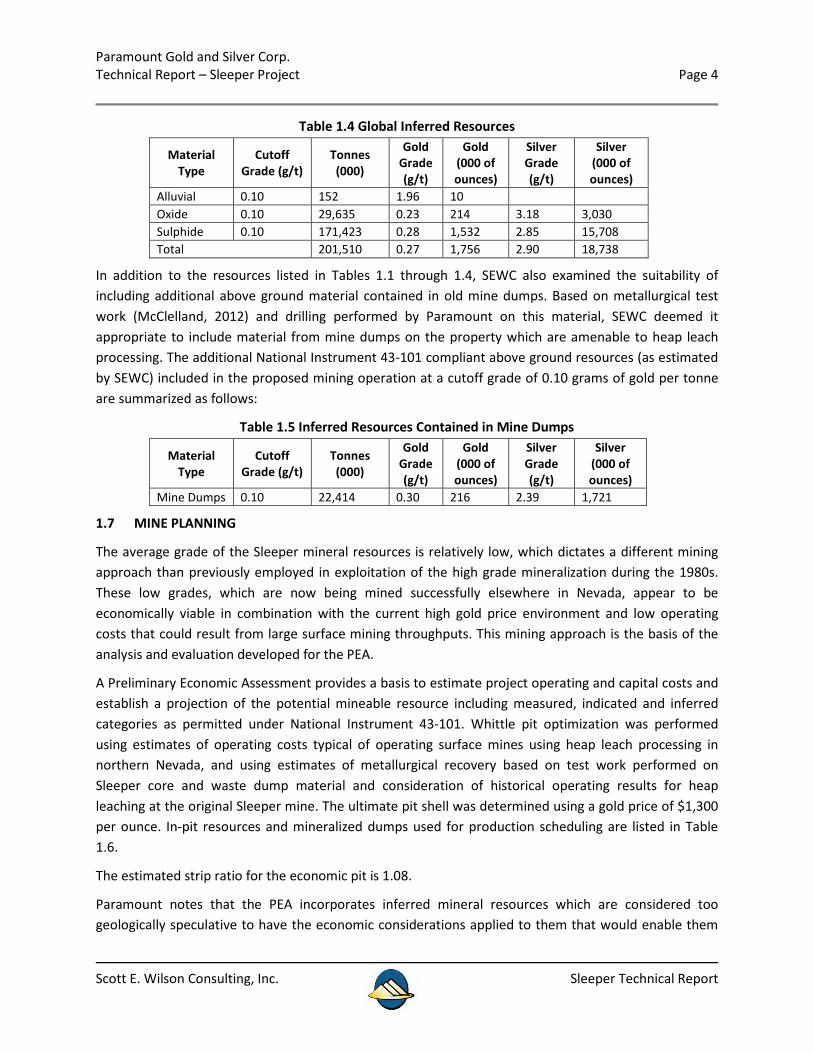
Table 1.4 Global Inferred Resources
Material Type
Cutoff Grade (g/t)
Tonnes (000)
Gold Grade (g/t)
Gold (000 of ounces)
Silver Grade (g/t)
Silver (000 of ounces)
Alluvial 0.10 152 1.96 10 Oxide 0.10 29,635 0.23 214 3.18 3,030 Sulphide 0.10 171,423 0.28 1,532 2.85 15,708 Total 201,510 0.27 1,756 2.90 18,738
In addition to the resources listed in Tables 1.1 through 1.4, SEWC also examined the suitability of including additional above ground material contained in old mine dumps. Based on metallurgical test work (McClelland, 2012) and drilling performed by Paramount on this material, SEWC deemed it appropriate to include material from mine dumps on the property which are amenable to heap leach processing. The additional National Instrument 43-101 compliant above ground resources (as estimated by SEWC) included in the proposed mining operation at a cutoff grade of 0.10 grams of gold per tonne are summarized as follows:
Table 1.5 Inferred Resources Contained in Mine Dumps
Material Type
Cutoff Grade (g/t)
Tonnes (000)
Gold Grade (g/t)
Gold (000 of ounces)
Silver Grade (g/t)
Silver (000 of ounces)
Mine Dumps 0.10 22,414 0.30 216 2.39 1,721
1.7 MINE PLANNING
The average grade of the Sleeper mineral resources is relatively low, which dictates a different mining approach than previously employed in exploitation of the high grade mineralization during the 1980s. These low grades, which are now being mined successfully elsewhere in Nevada, appear to be economically viable in combination with the current high gold price environment and low operating costs that could result from large surface mining throughputs. This mining approach is the basis of the analysis and evaluation developed for the PEA.
A Preliminary Economic Assessment provides a basis to estimate project operating and capital costs and establish a projection of the potential mineable resource including measured, indicated and inferred categories as permitted under National Instrument 43-101. Whittle pit optimization was performed using estimates of operating costs typical of operating surface mines using heap leach processing in northern Nevada, and using estimates of metallurgical recovery based on test work performed on Sleeper core and waste dump material and consideration of historical operating results for heap leaching at the original Sleeper mine. The ultimate pit shell was determined using a gold price of $1,300 per ounce. In-pit resources and mineralized dumps used for production scheduling are listed in Table 1.6.
The estimated strip ratio for the economic pit is 1.08.
Paramount notes that the PEA incorporates inferred mineral resources which are considered too geologically speculative to have the economic considerations applied to them that would enable them
Paramount Gold and Silver Corp. Technical Report – Sleeper Project Page 5
Scott E. Wilson Consulting, Inc. Sleeper Technical Report
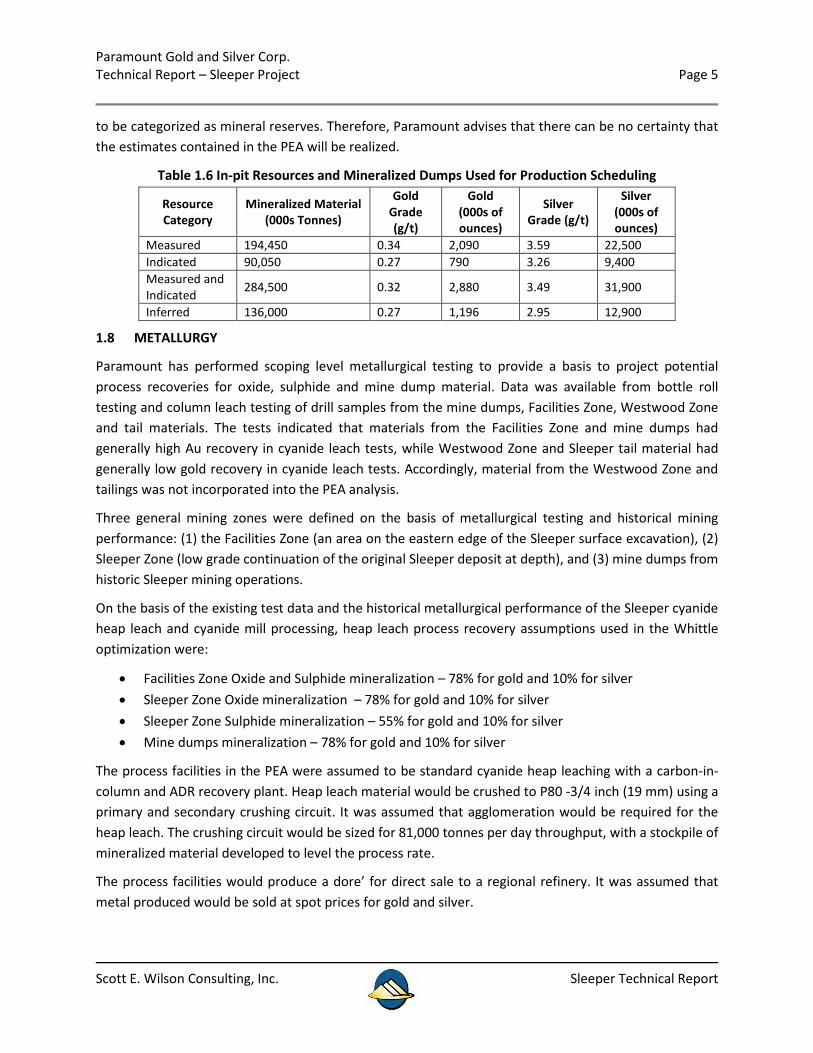
to be categorized as mineral reserves. Therefore, Paramount advises that there can be no certainty that the estimates contained in the PEA will be realized.
Table 1.6 In-pit Resources and Mineralized Dumps Used for Production Scheduling
Resource Category
Mineralized Material (000s Tonnes)
Gold Grade (g/t)
Gold (000s of ounces)
Silver Grade (g/t)
Silver (000s of ounces)
Measured 194,450 0.34 2,090 3.59 22,500 Indicated 90,050 0.27 790 3.26 9,400 Measured and Indicated 284,500 0.32 2,880 3.49 31,900
Inferred 136,000 0.27 1,196 2.95 12,900
1.8 METALLURGY
Paramount has performed scoping level metallurgical testing to provide a basis to project potential process recoveries for oxide, sulphide and mine dump material. Data was available from bottle roll testing and column leach testing of drill samples from the mine dumps, Facilities Zone, Westwood Zone and tail materials. The tests indicated that materials from the Facilities Zone and mine dumps had generally high Au recovery in cyanide leach tests, while Westwood Zone and Sleeper tail material had generally low gold recovery in cyanide leach tests. Accordingly, material from the Westwood Zone and tailings was not incorporated into the PEA analysis.
Three general mining zones were defined on the basis of metallurgical testing and historical mining performance: (1) the Facilities Zone (an area on the eastern edge of the Sleeper surface excavation), (2) Sleeper Zone (low grade continuation of the original Sleeper deposit at depth), and (3) mine dumps from historic Sleeper mining operations.
On the basis of the existing test data and the historical metallurgical performance of the Sleeper cyanide heap leach and cyanide mill processing, heap leach process recovery assumptions used in the Whittle optimization were:
• Facilities Zone Oxide and Sulphide mineralization – 78% for gold and 10% for silver • Sleeper Zone Oxide mineralization – 78% for gold and 10% for silver • Sleeper Zone Sulphide mineralization – 55% for gold and 10% for silver • Mine dumps mineralization – 78% for gold and 10% for silver
The process facilities in the PEA were assumed to be standard cyanide heap leaching with a carbon-in-column and ADR recovery plant. Heap leach material would be crushed to P80 -3/4 inch (19 mm) using a primary and secondary crushing circuit. It was assumed that agglomeration would be required for the heap leach. The crushing circuit would be sized for 81,000 tonnes per day throughput, with a stockpile of mineralized material developed to level the process rate.
The process facilities would produce a dore’ for direct sale to a regional refinery. It was assumed that metal produced would be sold at spot prices for gold and silver.
Paramount Gold and Silver Corp. Technical Report – Sleeper Project Page 6
Scott E. Wilson Consulting, Inc. Sleeper Technical Report
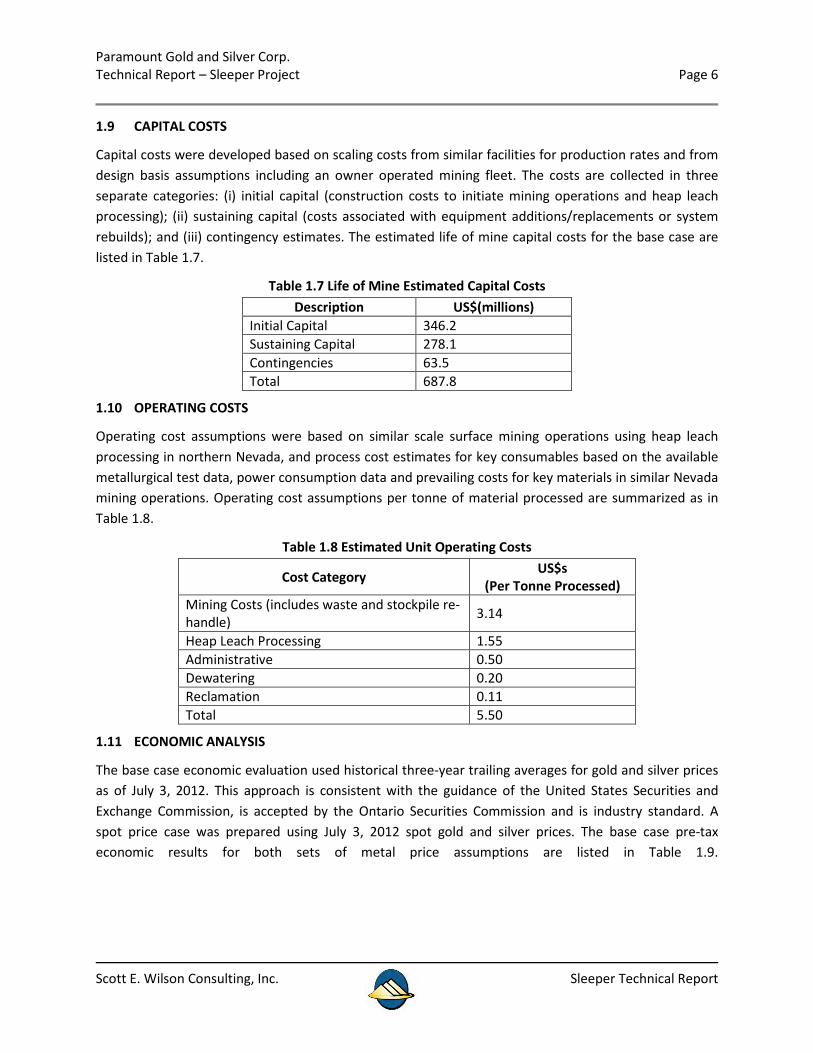
1.9 CAPITAL COSTS
Capital costs were developed based on scaling costs from similar facilities for production rates and from design basis assumptions including an owner operated mining fleet. The costs are collected in three separate categories: (i) initial capital (construction costs to initiate mining operations and heap leach processing); (ii) sustaining capital (costs associated with equipment additions/replacements or system rebuilds); and (iii) contingency estimates. The estimated life of mine capital costs for the base case are listed in Table 1.7.
Table 1.7 Life of Mine Estimated Capital Costs Description US$(millions)
Initial Capital 346.2 Sustaining Capital 278.1 Contingencies 63.5 Total 687.8
1.10 OPERATING COSTS
Operating cost assumptions were based on similar scale surface mining operations using heap leach processing in northern Nevada, and process cost estimates for key consumables based on the available metallurgical test data, power consumption data and prevailing costs for key materials in similar Nevada mining operations. Operating cost assumptions per tonne of material processed are summarized as in Table 1.8.
Table 1.8 Estimated Unit Operating Costs
Cost Category US$s (Per Tonne Processed)
Mining Costs (includes waste and stockpile re-handle) 3.14
Heap Leach Processing 1.55 Administrative 0.50 Dewatering 0.20 Reclamation 0.11 Total 5.50
1.11 ECONOMIC ANALYSIS
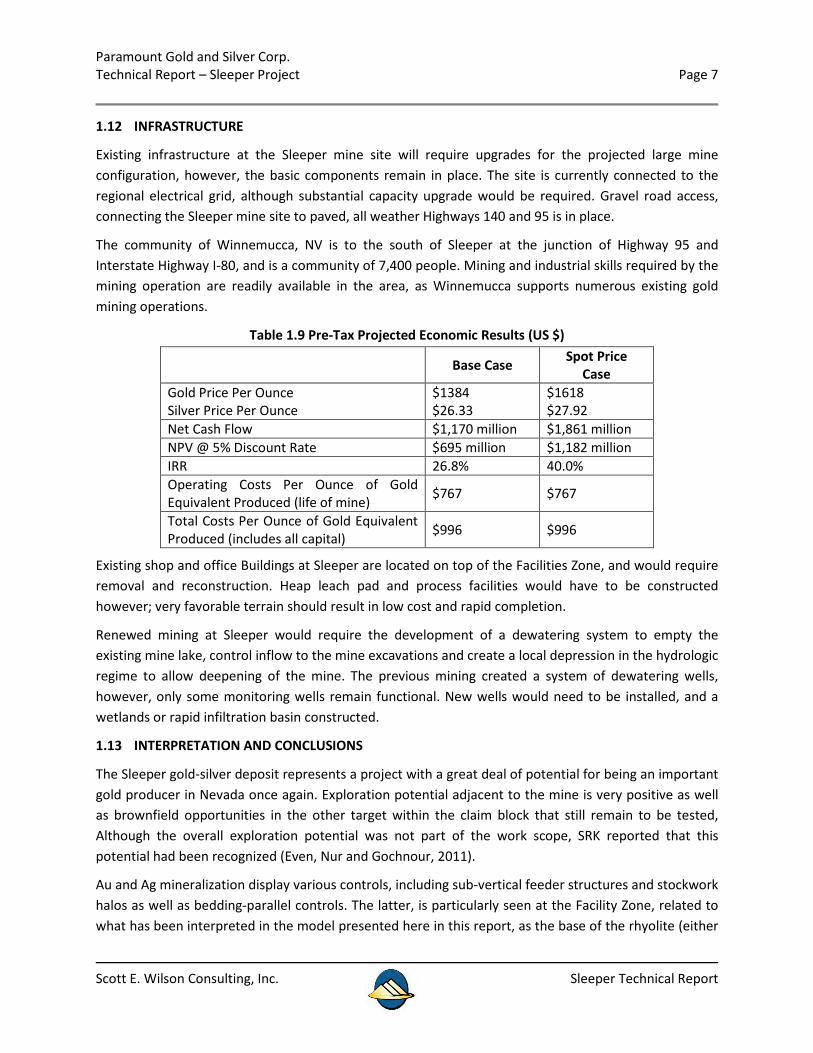
The base case economic evaluation used historical three-year trailing averages for gold and silver prices as of July 3, 2012. This approach is consistent with the guidance of the United States Securities and Exchange Commission, is accepted by the Ontario Securities Commission and is industry standard. A spot price case was prepared using July 3, 2012 spot gold and silver prices. The base case pre-tax economic results for both sets of metal price assumptions are listed in Table 1.9.
Paramount Gold and Silver Corp. Technical Report – Sleeper Project Page 7
Scott E. Wilson Consulting, Inc. Sleeper Technical Report
1.12 INFRASTRUCTURE
Existing infrastructure at the Sleeper mine site will require upgrades for the projected large mine configuration, however, the basic components remain in place. The site is currently connected to the regional electrical grid, although substantial capacity upgrade would be required. Gravel road access, connecting the Sleeper mine site to paved, all weather Highways 140 and 95 is in place.
The community of Winnemucca, NV is to the south of Sleeper at the junction of Highway 95 and Interstate Highway I-80, and is a community of 7,400 people. Mining and industrial skills required by the mining operation are readily available in the area, as Winnemucca supports numerous existing gold mining operations.
Table 1.9 Pre-Tax Projected Economic Results (US $)
Base Case Spot Price Case
Gold Price Per Ounce Silver Price Per Ounce
$1384 $26.33
$1618 $27.92
Net Cash Flow $1,170 million $1,861 million NPV @ 5% Discount Rate $695 million $1,182 million IRR 26.8% 40.0% Operating Costs Per Ounce of Gold Equivalent Produced (life of mine) $767 $767
Total Costs Per Ounce of Gold Equivalent Produced (includes all capital) $996 $996
Existing shop and office Buildings at Sleeper are located on top of the Facilities Zone, and would require removal and reconstruction. Heap leach pad and process facilities would have to be constructed however; very favorable terrain should result in low cost and rapid completion.
Renewed mining at Sleeper would require the development of a dewatering system to empty the existing mine lake, control inflow to the mine excavations and create a local depression in the hydrologic regime to allow deepening of the mine. The previous mining created a system of dewatering wells, however, only some monitoring wells remain functional. New wells would need to be installed, and a wetlands or rapid infiltration basin constructed.
1.13 INTERPRETATION AND CONCLUSIONS
The Sleeper gold-silver deposit represents a project with a great deal of potential for being an important gold producer in Nevada once again. Exploration potential adjacent to the mine is very positive as well as brownfield opportunities in the other target within the claim block that still remain to be tested, Although the overall exploration potential was not part of the work scope, SRK reported that this potential had been recognized (Even, Nur and Gochnour, 2011).
Au and Ag mineralization display various controls, including sub-vertical feeder structures and stockwork halos as well as bedding-parallel controls. The latter, is particularly seen at the Facility Zone, related to what has been interpreted in the model presented here in this report, as the base of the rhyolite (either
Paramount Gold and Silver Corp. Technical Report – Sleeper Project Page 8
Scott E. Wilson Consulting, Inc. Sleeper Technical Report
as a flow or dome) and the contact with the underlying Mesozoic basement. These mineralization trends have not been extensively drilled, and present strong potential for continuity for increasing resources at the project.
1.14 RECOMMENDATIONS
Project Development
Requirements to advance the project with Pre-feasibility and Feasibility Studies should be defined. Two areas of uncertainty in existing information should be addressed in the next steps:
• Metalluurgical Recovery assumptions are based on limited testing information. An expanded metallurgical testing program should be developed to verify metallurgical recovery assumptions for the Facility Zone, deeper Sleeper Zone and mineralized Waste Dumps. This will require a drilling program to develop sample materials.
• Dewatering Engineering needs to be advanced. Dewatering planning should address the expanded mine shapes and water disposal through re-establishment of wetlands or a rapid infilitrationi basin.
QA/QC Controls
SRK recommended (Even, Nur and Gochnour, 2011) that the QA/QC sample and laboratory analysis evaluation be done on a regular basis during drill hole campaigns. When QA/QC analyses are completed after the drill campaign, it can be too late for making necessary adaptations and corrections. Fortunately, there did not seem to a consistent problem with the laboratory analyses, however, more attention to detail in consistently sending check assays to other labs and submitting coarse reject duplicates for analysis should be made.
Geologic Model
SRK (Even, Nur and Gochnour, 2011) recommended that:
• Grades were used as a proxy for mineralization style in the model (vein, stockwork and dissemination). Identifying mineralization style consistently in the database would allow modeling these features directly in a more geologically consistent fashion.
• The lithological units presented here are preliminary, based on the grouping of codes mapped by different companies over a long period of time. It is recommended that the partition suggested here be used as a basis for future drill hole logging review campaigns, in order to produce an integrated lithological coding system applicable to the whole deposit.
• The structures used were determined primarily on the bases of Au grade distribution and previous interpretations and conceptual models. It is recommended that field and drill hole structural information be carefully reviewed and entered into a newly compiled and integrated database as a more detailed structural model will be necessary at a more advanced project stage.
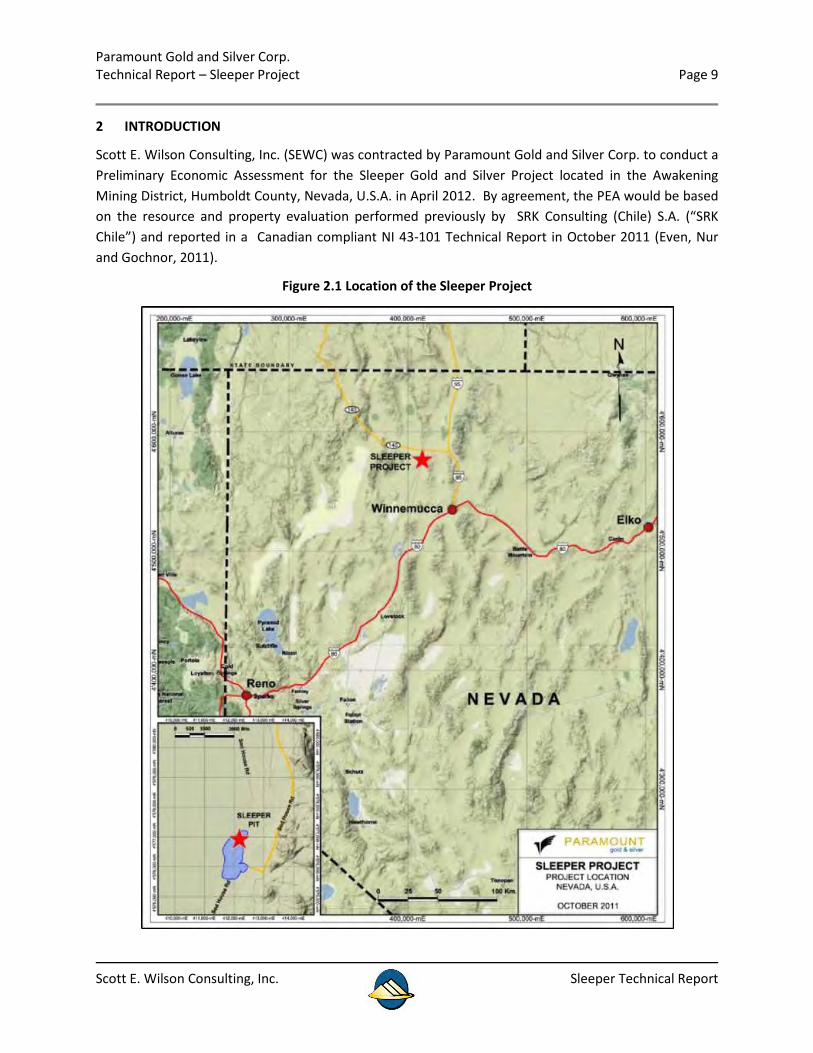
Paramount Gold and Silver Corp. Technical Report – Sleeper Project Page 9
Scott E. Wilson Consulting, Inc. Sleeper Technical Report
2 INTRODUCTION
Scott E. Wilson Consulting, Inc. (SEWC) was contracted by Paramount Gold and Silver Corp. to conduct a Preliminary Economic Assessment for the Sleeper Gold and Silver Project located in the Awakening Mining District, Humboldt County, Nevada, U.S.A. in April 2012. By agreement, the PEA would be based on the resource and property evaluation performed previously by SRK Consulting (Chile) S.A. (“SRK Chile”) and reported in a Canadian compliant NI 43-101 Technical Report in October 2011 (Even, Nur and Gochnor, 2011).
Figure 2.1 Location of the Sleeper Project
Paramount Gold and Silver Corp. Technical Report – Sleeper Project Page 10
Scott E. Wilson Consulting, Inc. Sleeper Technical Report
2.1 SCOPE OF WORK
The SEWC Scope of Work was to perform an evaluation of the potential for the Sleeper Project to become a commercial mining operation. The basis of the evaluation was the resource and property evaluation performed by SRK and reported in the Technical Report by Even, Nur and Gochnour (2011). SEWC was supplied the global resource block model developed by Even, Nur and Gochnour (2011) and used it to perform mine optimization analysis for a surface mine operation, assuming heap leach processing of the produced mineralized material. In addition, SEWC performed a resource estimate for mineralized material in existing mine dumps based on drill sampling and metallurgical testing data. Historic operating reports from the Sleeper mining operations, geologic data from the subsequent drilling and metallurgical testing results were reviewed to develop the input assumptions for the surface mine optimization analysis. A production schedule was then developed and used as the basis for capital and operating cost estimates. An economic assessment was then performed based on projected metallurgical recovery, gold and silver production, and revenue.
The report developed by SRK (Even, Nur and Gochnour, 2011) have been incorporated into this PEA. The Scope of Work for the previous Technical Report included:
1. Geology and Resources Reviewer and QP, SRK Santiago (George Even) - Field Visit, review of QA/QC and NI-43-101 document review.
2. Database Review and Validation - SRK Reno Geologist (Brooke Miller) to visit site and review database
3. Review data stream from the logging of holes to lab results to cross-checking the database. 4. Use blast hole samples, if possible to validate historic AMAX database. 5. Iso-Grade Modeling in Leapfrog - also investigate the possibility of creating a lithological model. 6. Resources, SRK Santiago (Joled Nur) - Perform an Indicator Kriging or Indicator Simulation in
order to obtain an idea of the locations and trends of the principal veins. 7. Perform a mineral resource estimation for gold and silver using the constructed geologic units. 8. Combine and compile a single report document according to CIM NI-43-101 guidelines including
database review and validation, site visit and QA/QC analysis, as well as the geologic model construction and resource estimate.
9. This technical report was prepared following the guidelines of the Canadian Securities Administrators National Instrument 43-101 and Form 43-101F1, and in conformity with generally accepted CIM “Exploration Best Practices” guidelines.
2.2 WORK PROGRAM
The SEWC Team reviewed the SRK Technical Report for the Sleeper Project (Even, Nur and Gochnour, 2011) and was supplied with the resulting global resource block model which was used as a basis of the mining analysis. Additional technical work by various consultants was also reviewed to develop the a conceptual project configuration, which would be the basis of the PEA. The SEWC Team, Scott E. Wilson, Mike Cole, William Pennstrom, Jr. and Carl E. Brechtel visited the Sleeper Project site in Nevada on May
Paramount Gold and Silver Corp. Technical Report – Sleeper Project Page 11
Scott E. Wilson Consulting, Inc. Sleeper Technical Report
7, 2012 where they reviewed the site geology and physical configuration with Paramount Geologist Nancy Wolverson.
The conceptual project configuration was reviewed in a series of conversations with Mr. Glen Van Treek, Paramount Vice President of Exploration, and other senior management of Paramount. Different process configurations were evaluated and SEWC concluded that a high capacity, heap leaching operation treating both oxide and sulphide components of the mineralized material would be most attractive.
2.3 BASIS OF THE TECHNICAL REPORT
This report is based on information collected by SEWC during the site visit and on additional information provided by Paramount. It incorporates work by SRK reported in the previous Sleeper Technical Report Even, Nur and Gochnour, 2011. In that report, SRK conducted certain independent verifications of exploration data from archived files provided for inspection by the Client in Paramount’s Winnemucca, Nevada office. SEWC has reviewed the Technical Report and verified parts of information contained herein and believes the information to be reliable. The SRK Technical Report was based on:
• Discussions with Paramount personnel and reports prepared by Paramount and previous owners of the Sleeper property;
• Personal inspection of the Sleeper project area; • Inspection and review of drill core from the Sleeper Project; • Review of historical exploration work conducted on the property; • Additional information obtained from public domain sources.
2.4 QUALIFICATIONS OF SEWC AND SRK
Scott E. Wilson Consulting Inc. is a small consulting practice located in Highlands Ranch, CO USA providing services to the US and International Mining Industry. SEWC offers services in geologic modeling, geostatistics and resource estimation, and supports mining operations with pit mapping and ore control assistance. Mine engineering experience includes mine optimization, surface and underground mine layout and design, production scheduling, strategic planning, leach pad development and scheduling, equipment selection and operating and capital cost estimation. SEWC has prepared Feasibility Studies and Technical Reports under NI 43-101.
The SRK Group comprises over 1,000 professionals, offering expertise in a wide range of resource engineering disciplines. The SRK Group’s independence is ensured by the fact that it holds no equity in any project and that its ownership rests solely with its staff. This permits SRK to provide its clients with conflict-free and objective recommendations on crucial judgment issues. SRK has a demonstrated track record in undertaking independent assessments of Mineral Resources and Mineral Reserves, project evaluations and audits, technical reports and independent feasibility evaluations to bankable standards on behalf of exploration and mining companies and financial institutions worldwide. The SRK Group has also worked with a large number of major international mining companies and their projects, providing mining industry consultancy service inputs.
Paramount Gold and Silver Corp. Technical Report – Sleeper Project Page 12
Scott E. Wilson Consulting, Inc. Sleeper Technical Report
This technical report was compiled by Scott E. Wilson, Mike Cole, William Pennstrom, Jr. ,Carl E. Brechtel, George Even, Joled Nur and Lee Gochnour.
2.5 SITE VISIT
A site visit was made Scott E. Wilson, Mike Cole, William Pennstrom, Jr. and Carl E. Brechtel on May 7, 2012. The visit was hosted by Paramount Geologist Nancy Wolverson. The purpose of the visit was to inspect the existing site conditions and review the Sleeper geology. Core materials from the Sleeper resource areas were examined at the site.
A site visit was made to the Sleeper property from June 15 -17, 2011 by SRK geologists, Mr. George Even (Santiago office) and Ms. Brooke Miller (Reno office), who were accompanied to the site by Mr. Glen Van Treek and other Paramount geologists. This visit had as its purpose to review the data available, particularly verifying the information used in the drill hole database, as well as procedures used during the mining of the Sleeper deposit and also during the exploration campaigns carried since the mine ceased operations in 1996.
2.6 ACKNOWLEDGEMENTS
SEWC has relied heavily on the work performed previously by SRK in development of the Sleeper Technical Report (Even, Nur and Gochnour, 2011). SEWC would like to acknowledge the support and collaboration provided by Paramount personnel for the preparation of this report, and in particular, Mr. Glen Van Treek and Nancy Wolverson for their assistance.
Paramount Gold and Silver Corp. Technical Report – Sleeper Project Page 13
Scott E. Wilson Consulting, Inc. Sleeper Technical Report
3 RELIANCE ON OTHER EXPERTS AND DISCLAIMER
SEWC’s opinion and conclusions presented in this Technical Report are based on information provided by Paramount Gold and Silver Corp. and reflect technical information and economic conditions at the time of report preparation. SEWC has reviewed the available data and concludes that it is an acceptable basis for development of a Preliminary Economic Assessment. SEWC has relied on estimates of the global mineral resource developed by SRK (Even, Nur and Gochnour, 2011) and on SRK’s evaluation of the geology. SEWC is not qualified to assess the status of environmental permitting or future requirements for permitting a major mining project at Sleeper, and has therefore relied on guidance from Paramount’s environment consultants at Enviroscientists, Inc. of Reno, NV.
SRK’s opinions contained herein and effective October 28, 2011, were based on information provided to SRK by Paramount throughout the course of SRK’s investigations, which in turn reflect various technical and economic conditions at the time of writing. Given the nature of the mining business, these conditions can change significantly over relatively short periods of time. Consequently actual results may be significantly more or less favorable.
This report includes technical information, which requires subsequent calculations to derive sub- totals, totals and weighted averages. Such calculations inherently involve a degree of rounding and consequently introduce a margin of error. Where these occur, SEWC and SRK do not consider them to be material.
Neither SEWC nor SRK are an insider, associate or an affiliate of Paramount Gold & Silver Corp. and neither SEWC nor SRK nor any affiliate has acted as advisor to Paramount or its affiliates in connection with this project. The results of the technical review by SEWC and SRK are not dependent on any prior agreements concerning the conclusions to be reached, nor are there any undisclosed understandings concerning any future business dealings.
SEWC and SRK have not researched ownership information such as property title and mineral rights, however, receipts of claim payments and claim lists have been examined by SRK.
The Sleeper project is an idle, open pit gold mine with exploration potential. The mine produced gold concentrate from 1986 to 1996 under AMAX’s operation. Paramount is currently carrying out core and RC drilling campaigns to outline further resources. A portion of the open pit is currently occupied by a pit lake.
The opinions expressed in this Report have been based on the information supplied to Scott E. Wilson Consulting and SRK Consulting (Chile) S.A., (SRK) by Paramount Gold and Silver Corporation (Paramount). The opinions in this Report are provided in response to a specific request from Paramount to do so. SEWC and SRK has exercised all due care in reviewing the supplied information. SRK has compared key supplied data with expected values and conducted spot checks on data during the site visit. While some data from the period of historic operation of the Sleeper mine by AMAX (until 1998) could not be validated, such as the location of old hole collars in areas already mined out, in general the data received is of a good quality. Parallel studies by other consultants in the fields of mining and

Paramount Gold and Silver Corp. Technical Report – Sleeper Project Page 14
Scott E. Wilson Consulting, Inc. Sleeper Technical Report
metallurgy as well as environmental and hydrogeological studies have been conducted. Opinions presented in this report apply to the site conditions and features as they existed at the time of SEWC’s investigations, and those reasonably foreseeable. These opinions do not necessarily apply to conditions and features that may arise after the date of this Report, about which neither SEWC nor SRK have no prior knowledge nor have had the opportunity to evaluate.
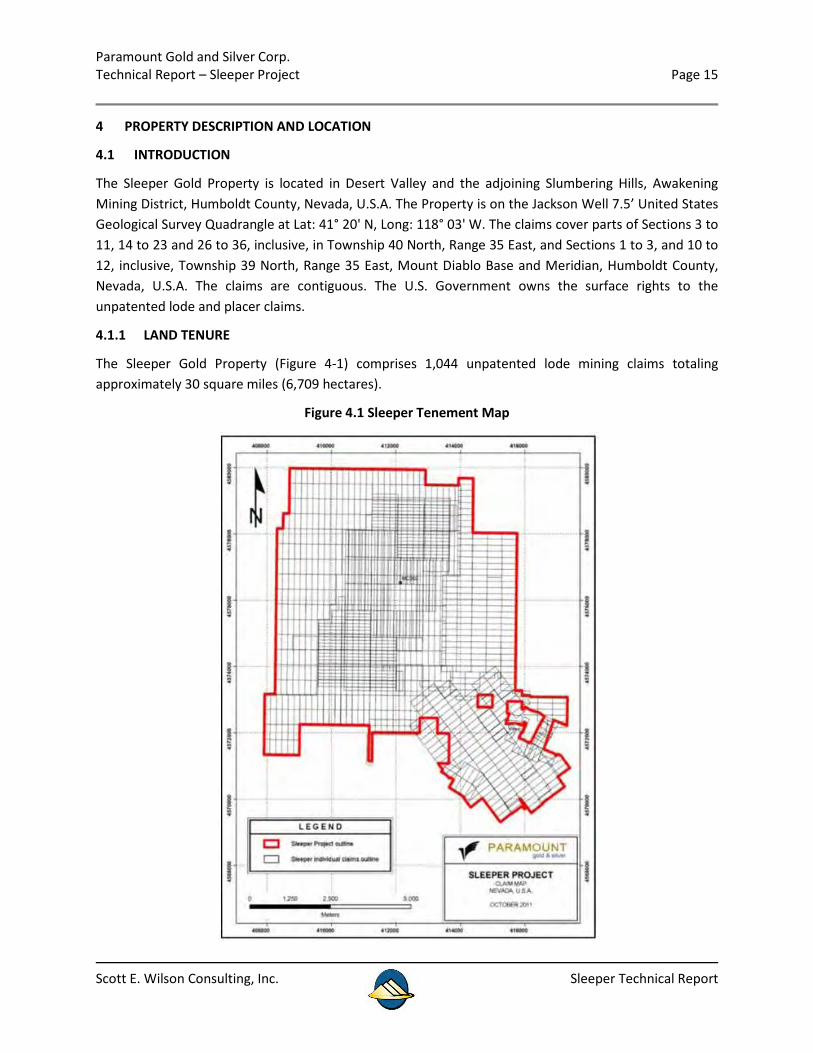
Paramount Gold and Silver Corp. Technical Report – Sleeper Project Page 15
Scott E. Wilson Consulting, Inc. Sleeper Technical Report
4 PROPERTY DESCRIPTION AND LOCATION
4.1 INTRODUCTION
The Sleeper Gold Property is located in Desert Valley and the adjoining Slumbering Hills, Awakening Mining District, Humboldt County, Nevada, U.S.A. The Property is on the Jackson Well 7.5’ United States Geological Survey Quadrangle at Lat: 41° 20' N, Long: 118° 03' W. The claims cover parts of Sections 3 to 11, 14 to 23 and 26 to 36, inclusive, in Township 40 North, Range 35 East, and Sections 1 to 3, and 10 to 12, inclusive, Township 39 North, Range 35 East, Mount Diablo Base and Meridian, Humboldt County, Nevada, U.S.A. The claims are contiguous. The U.S. Government owns the surface rights to the unpatented lode and placer claims.
4.1.1 LAND TENURE
The Sleeper Gold Property (Figure 4-1) comprises 1,044 unpatented lode mining claims totaling approximately 30 square miles (6,709 hectares).
Figure 4.1 Sleeper Tenement Map
Paramount Gold and Silver Corp. Technical Report – Sleeper Project Page 16
Scott E. Wilson Consulting, Inc. Sleeper Technical Report
See Appendix A for a list of the claims held by Paramount at Sleeper
4.2 UNDERLYING OWNERSHIP
Paramount Gold and Silver Corp., is a public company listed and trading on the NYSE- American Stock Exchange (NYSE-AMEX) and the Toronto Stock Exchange (TSX). It acquired all the issued and outstanding shares of X-Cal Resources Ltd. in August 2010 by plan of arrangement. Paramount’s head office and mailing address is 665 Anderson Street, Winnemucca, Nevada 844453657.
Paramount through its subsidiaries, X-Cal Resources Lt., X-Cal USA Inc, New Sleeper Gold LLC and Sleeper Mining Company LLC control 100% of the 1,044 unpatented lode mining claims. No one resides on the unpatented claims, which are owned by the U.S. government, and no pre-patent U.S. Mineral Survey has been conducted thereon. The authors know of no other agreements, other encumbrances or environmental liabilities that are attached to the Sleeper Gold Property. All claims registered in the name of X-Cal USA are currently assigned to the New Sleeper Gold LLC.
4.3 MINERAL RIGHTS IN NEVADA
Most Federal laws regarding mining on public land can be found in the United States Code (USC) under Title 30 “Mineral Lands and Mining” and Title 43, Chapter 35 “Federal Land Policy and Management” (FLPMA), and in the Code of Federal Regulations (CFR) under Title 43 “Public Lands.” The majority of Nevada state laws regarding mining can be found in the Nevada Revised Statutes (NRS) under Chapters 512 through 520 and several other chapters and in the Nevada Administrative Code (NAC) under Chapter 517.
Federal (30 USC and 43 CFR) and Nevada (NRS 517) laws concerning mining claims on Federal land are based on an 1872 Federal law titled “An Act to Promote the Development of Mineral Resources of the United States.”
About 85% of the land in Nevada is controlled by the Federal Government; most of this land is administered by the Bureau of Land Management, the Forest Service, the Department of Energy, or the Department of Defense. Much of the land controlled by the Bureau of Land Management and Forest Service is open to prospecting and claim location.
Bureau of Land Management regulations regarding surface disturbance and reclamation require that a notice be submitted to the appropriate Field Office of the Bureau of Land Management for exploration activities in which five acres or less are proposed for disturbance (43 CFR 3809.1-1 through 3809.1-4). A plan of operation is needed for all mining and processing activities, plus all activities exceeding five acres of proposed disturbance. A plan of operation is also needed for any bulk sampling in which 1,000 or more tons of presumed ore are proposed for removal (43 CFR
through 3802.6, 3809.1-4, 3809.1-5). The BLM also requires the posting of bonds for reclamation for any surface disturbance caused by more than casual use (43 CFR 3809.500 through 3809.560).
Bureau of Land Management regulations (43 USC 1744; 43 CFR 3833.1-2) require that the locator of a mining claim, mill site, or tunnel site file a copy of the notice or certifícate of location with the State
Paramount Gold and Silver Corp. Technical Report – Sleeper Project Page 17
Scott E. Wilson Consulting, Inc. Sleeper Technical Report
Office of the Bureau of Land Management, along with a map showing the claims location. Failure to file this information within 90 days after the claim is located voids the claim. The certifícate must include the name and current mailing address of the owner or owners, the type of claim, and the location of the claim by township, range, section(s), and quarter section(s). The map should be similar to the one required by Nevada State law.
Federal law (30 USC 28f; 43 CFR 3833.1-5) requires an annual claim maintenance fee of $140 per claim be paid at the State Office of the Bureau of Land Management on or before September 1. During the initial assessment year (the year of location), the claim maintenance fee must be paid at the time the notice of location is filed with the Bureau of Land Management. Failure to pay the claim maintenance fee will void the claim.
Nevada law (NRS 517.230) also requires that on or before November 1 of each year that the annual assessment work is not required, the claimant, or someone in his behalf, must make and have recorded with the County Recorder a notice of “intent to hold”. This is an affidavit that must include the name and mailing address of the claimant, the name of the mining claim, the Bureau of Land Management serial number if any, and a statement that the claimant intends to hold the claim. The notice of intent to hold is proof that the claimant intends to hold the claim from 12 p.m. on September 1 of the year before the affidavit was made and recorded until 11:59 a.m. on September 1 of the year the affidavit was made and recorded.
4.4 ENVIRONMENTAL STUDIES, PERMITTING AND SOCIAL OR COMMUNITY IMPACT
The Project was explored, developed (mined, milled and heap leached) in the 1980’s and 1990’s. Reclamation has occurred on the majority of the mine facilities (waste dumps, tailing impounds, heap leach pads and ancillary facilities (access and haul roads) and the open pit has been allowed to refill with water. These reclamation efforts have received awards and recognition from the regulatory agencies and the public. Current activities at the site involve exploration, permit maintenance and reclamation monitoring.
There are no known environmental issues that are adversely impacting air, water or soil resources at the site. Key environmental issues associated with current drilling activities and this NI 43-101 Report are wildlife and archaeology.
While there are no Threatened or Endangered (T&E) species of vegetation or wildlife within the project boundary, there are sensitive species (pygmy rabbit and sage grouse) that may exist and depending upon their location may warrant special mitigation.
There are also known sensitive cultural/archaeological sites within the project area. However, these sites have been effectively avoided during current operations.
Paramount Gold and Silver Corp. Technical Report – Sleeper Project Page 18
Scott E. Wilson Consulting, Inc. Sleeper Technical Report
Permits
The Project is currently operated as an advanced exploration project. Key permits associated with these activities include:
• Reclamation Permit # 0219 • Plan of Operations # N77104 • Air Permit for Surface Disturbance #AP 1041-2208
A reclamation bond in the amount of $222,081 is currently posted with Bureau of Land Management to guarantee that reclamation is performed on associated exploration activities at the site.
There are also numerous other permits in place that are maintained from previous mine operations. These are maintained for ease in updating should a decision be made to reinitiate production at the site. Maintenance of these permits includes monthly, quarterly and annual monitoring and reporting. These permits include:
• Reclamation Permit #0037 • Water Pollution Control Permit #NEV 50006 • Groundwater Appropriation Permits #’s 53228, 53231, 53236 • Radio Station (FCC) License # 11216793 • Air Quality Operating Permit # AP 1041 1322 • Hazardous Materials Permit # 1168-2326 • Solid Waste Landfill Waiver # SWMI-08-10 • Industrial Artificial Pond Permit # S28231
A reclamation bond in the amount of $3,966,373 is currently posted with Bureau of Land Management to guarantee that reclamation is performed on associated mine facilities and activities at the site. Paramount is currently in compliance with all issued permits.
Paramount Gold and Silver Corp. Technical Report – Sleeper Project Page 19
Scott E. Wilson Consulting, Inc. Sleeper Technical Report
5 ACCESSIBILITY, CLIMATE, LOCAL RESOURCES, INFRASTRUCTURE AND PHYSIOGRAPHY
The Sleeper Gold Property is located 26 miles northwest of Winnemucca, Nevada, on the west flank of the Slumbering Hills. Access to the Sleeper Gold Property is by Interstate Highway 80 to Winnemucca, north on Highway 95 for 32 miles, west on Highway 140 for 14 miles, and then south for 6 miles on the maintained gravel Sod House Road to the project site.
The Sleeper Gold Property is in variably flat to hilly, grass-shrub-covered desert, with a few trees present on the higher elevations. Elevations in the Sleeper Gold Property area are between 4,100 ft along the western, valley side of the project to 5,400 ft on a hilltop in the south-eastern portion of the project.
The climate in the Sleeper Gold Property area is favourable for year-round mining. The temperatures are cool to cold during the winter, with occasional moderate snowfalls, and are warm during the summer with cool nights. The area is fairly dry, with infrequent rains during the summer. Exploration and mining activities may be conducted year-round. The Sleeper Gold Property area is uninhabited.
An office building, heavy equipment ‘shop’ plus assorted equipment are present on the Sleeper Gold Property site and are in use for exploration offices, core logging, storage and to support drilling programs. Necessary supplies, equipment and services to carry out full sequence exploration and mining development projects are available in Winnemucca, Reno, and Elko, Nevada. A trained mining-industrial workforce is available in Winnemucca and other nearby communities. The overall subdued topography that characterizes much of the Sleeper Gold Property provides ample ground for the sitting of mine facilities, tailings, waste dumps and heap leach facilities.
Paramount Gold and Silver Corp. Technical Report – Sleeper Project Page 20
Scott E. Wilson Consulting, Inc. Sleeper Technical Report
6 HISTORY
6.1 PRE-AMAX
Significant deposits of gold were first discovered in the Sleeper Gold Property area beginning in 1935 in the Awakening District at the Jumbo and Alma Mines. Narrow quartz-adularia-gold veins within folded metasedimentary rocks were exploited at the Jumbo mine, located in the Slumbering Hills about 3.7 miles southeast of the Sleeper Mine, by open pit and underground methods (Nash et al., 1995). Estimates of the pre-AMAX gold production from the Awakening District vary; Willden (1964) tabulated a total of 26,262 ounces of gold produced from the district between 1932 and 1958.
6.2 AMAX
The modern history of the Sleeper Gold Property began in April 1982 when John Wood, an exploration geologist with AMAX, observed iron staining in a scarp east of what became the Sleeper Mine during an aerial geological reconnaissance. AMAX conducted surface geological and geochemical work over the next two years, including a drilling program that identified gold mineralization that averaged approximately 0.04 oz Au/ton. In late 1984, AMAX’s thirty-fourth drill hole stepped out to the west of the previous drilling and intersected 335 ft (102 metres) of silicified breccia with an average grade of 0.81 oz Au/ton gold, including one very high-grade quartz-electrum vein containing abundant visible gold (Nash et al., 1995). This hole led to an immediate increase in the exploration and development programs.
In February 1985, AMAX formally announced the discovery of the Sleeper gold deposit and open pit mine construction was approved in August 1985. The initial development plan called for construction of a 500 ton-per-day mill designed to produce 53,000 ounces of gold per year, with start-up scheduled for mid-1986. Mining initiated in January 1986 and mill commissioning began the following month. On March 26, 1986 AMAX poured its first gold bar from the Sleeper Gold Property three months ahead of schedule and little more than a year after the discovery had been announced. Although the mine plan called for production of about 40,000 ounces in 1986, the mine actually produced 126,000 ounces of gold during the year at an average cost of less than $60 per ounce, making it one of the lowest cost gold mines in the world at the time.
AMAX’s initial capital investment was recouped in the first six months of operation. During those first nine months the head grade was 0.75 oz Au/ton, or more than twice the expected grade, owing to bonanza grades in the Sleeper vein (Redfern and Rowe, 2003).
Mill throughput exceeded design capacity during the first full month and was running about 30% over design capacity by the end of the year. In September 1986, AMAX began processing low-grade material in a heap leach circuit. Production increased to 159,000 ounces in 1987 (the first full year of production) and to 230,000 ounces in 1988 at an average cost of $103 per ounce (Proteus, 2002). Armed guards were hired to protect the high-grade, visible gold in the pit.
Paramount Gold and Silver Corp. Technical Report – Sleeper Project Page 21
Scott E. Wilson Consulting, Inc. Sleeper Technical Report
In 1993, annual production declined to 100,000 ounces at a cash cost of $317 per ounce. Cyprus Minerals and AMAX Inc. merged to form Cyprus AMAX Minerals Co. in 1994. AMAX suspended mining operations at Sleeper in 1996.
The Sleeper operation was designed to treat oxide mineralization by both milling and heap leaching. There was no flotation circuit in the mill to recover gold bearing sulphides. The early pit mill feed was oxide material, but zones of sulphide mineralization were present in the pit. Reported gold production from the mill was 1,219,880 ounces and 438,609 ounces from heap leaching (Zoutomou, 2007). Silver production totaled approximately 2.3 million ounces.
The Sleeper Pit has filled with water since mining activities have stopped. The lake formed by the influx of ground water has filled the pit to within 110 feet (33.5 metres) from the crest of the original pit limits. The mill and crushing facilities have been removed and the mill area reclaimed.
6.3 X-CAL
In 1993, X-Cal acquired property around the Alma underground mine, which lies in the Awakening District to the southeast of the Sleeper pit, through an agreement with Leland York. X-Cal's surface mapping and sampling identified several areas of anomalous gold. X-Cal acquired additional land in 1994 and 1995, so that its holdings then extended to the limit of the AMAX Sleeper Property boundary. In April 1996, X-Cal and AMAX formed a joint venture to explore the Sleeper Gold Property, which included the land holdings of both X-Cal and AMAX.
In 1997, X-Cal entered into an option agreement with Placer Dome. During an intensive 40-day period from July 11 to August 20, 1997, Placer Dome reviewed the Sleeper Gold Property data in detail, completed a detailed aeromagnetic survey, and drilled 46 holes (30,992 ft (9,446 metres) of reverse circulation (RC) drilling; 5,509 ft (1,697m) of diamond core drilling). Revised terms to extend the agreement could not be agreed upon and the Placer Dome option expired.
X-Cal became vested as 50% owner of the Sleeper Gold Project, including the Amax Gold claims and Sleeper Mine Site Area.
In 1998, AMAX merged with Kinross. X-Cal negotiated a series of options to purchase the Kinross interest in Sleeper. From 1998 through 2003, there were several amendments to the agreements between X-Cal and Kinross (Proteus, 2002).
6.4 NEW SLEEPER GOLD
On January 9th, 2004 X-Cal and New Sleeper Gold Corp formed a 50/50 Joint Venture and acquired Kinross Gold’s 50% interest in the Sleeper Gold Property. New Sleeper assumed management of the Sleeper Gold Property. During the period February 2004 to July 2005 money contributed by New Sleeper Gold to the Sleeper Joint Venture, funded exploration at Sleeper and completed 97,704 ft (29,780 m) of drilling. The drilling consisted of 2,260 ft (688.8 m) of sonic drilling, 37,315 ft (11,373.6 m) of RC drilling and 55,869 ft (17,028.9 m) of core drilling. In addition the Sleeper Joint Venture conducted trenching, electrical geophysical surveys (both IP and MT), ground gravity surveys, ‘Quicksilver’ mercury soil gas
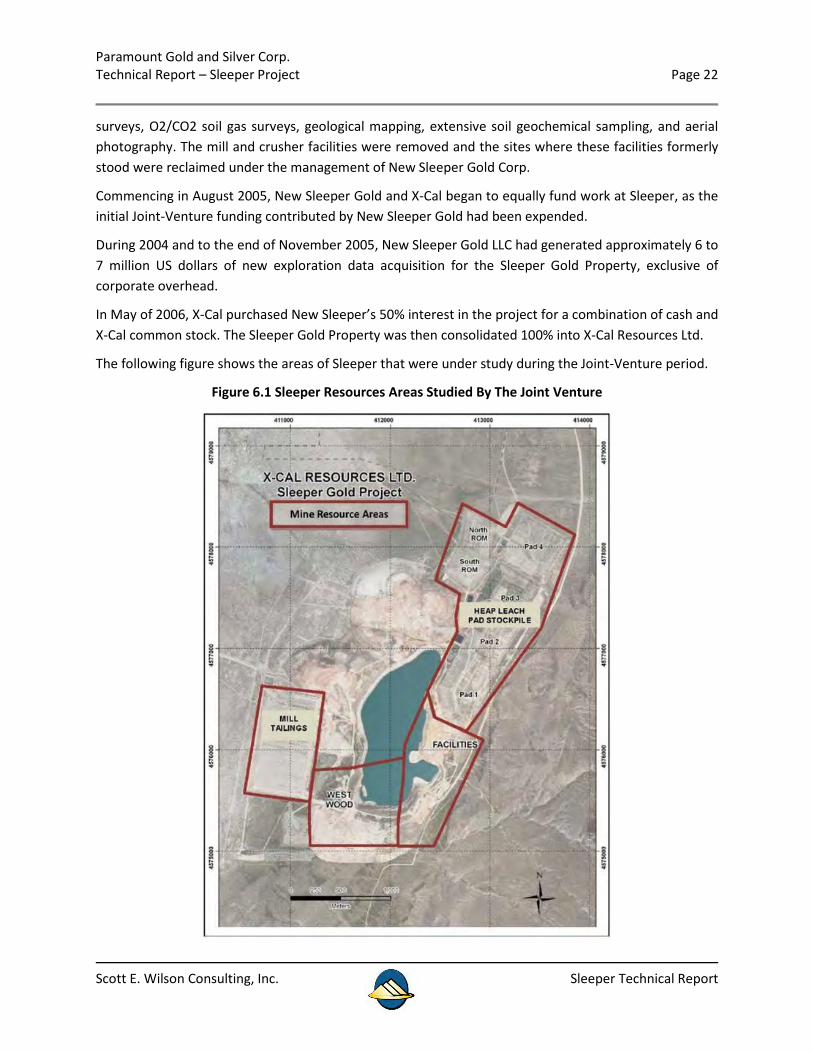
Paramount Gold and Silver Corp. Technical Report – Sleeper Project Page 22
Scott E. Wilson Consulting, Inc. Sleeper Technical Report
surveys, O2/CO2 soil gas surveys, geological mapping, extensive soil geochemical sampling, and aerial photography. The mill and crusher facilities were removed and the sites where these facilities formerly stood were reclaimed under the management of New Sleeper Gold Corp.
Commencing in August 2005, New Sleeper Gold and X-Cal began to equally fund work at Sleeper, as the initial Joint-Venture funding contributed by New Sleeper Gold had been expended.
During 2004 and to the end of November 2005, New Sleeper Gold LLC had generated approximately 6 to 7 million US dollars of new exploration data acquisition for the Sleeper Gold Property, exclusive of corporate overhead.
In May of 2006, X-Cal purchased New Sleeper’s 50% interest in the project for a combination of cash and X-Cal common stock. The Sleeper Gold Property was then consolidated 100% into X-Cal Resources Ltd.
The following figure shows the areas of Sleeper that were under study during the Joint-Venture period.
Figure 6.1 Sleeper Resources Areas Studied By The Joint Venture
Paramount Gold and Silver Corp. Technical Report – Sleeper Project Page 23
Scott E. Wilson Consulting, Inc. Sleeper Technical Report
6.5 PARAMOUNT
Paramount Gold and Silver Corporation acquired all the issued and outstanding shares of X-Cal Resources Ltd. in August 2010 by plan of arrangement.
Paramount through its subsidiaries, X-Cal Resources Lt., X-Cal USA Inc, New Sleeper Gold LLC and Sleeper Mining Company LLC control 100% of the 1,044 unpatented lode mining claims. All claims registered in the name of X-Cal USA are currently assigned to the New Sleeper Gold LLC.
Paramount drilling at Sleeper began October 11, 2010 and consisted of a diamond drill program of 19 drill holes totaling 18,065 ft (5,810 m) carried out by DeLong Drilling and Redcor Drilling, both of Winnemucca, Nevada. The Redcor core drill was mobilized to site October 26, and began drilling on October 30, 2010 and ended in February, 2011. Currently, a drilling program is underway whose results are not included in this report.
Paramount Gold and Silver Corp. Technical Report – Sleeper Project Page 24
Scott E. Wilson Consulting, Inc. Sleeper Technical Report
7 GEOLOGICAL SETTING, MINERALIZATION AND MODELING
7.1 REGIONAL GEOLOGY
The Sleeper Gold Property area is situated within the western, apparently older, part of the Northern Nevada Rift (“NNR”) geologic province of Miocene age, along the western flank of the Slumbering Hills. The regional geologic framework and generalized local geology and stratigraphy are described below and are shown in Figure 7-1 (modified from Nash et al., 1995).
The core of the Slumbering Hills consists of Mesozoic meta-sedimentary rocks of the Auld Lang Syne Group and Cretaceous granitic intrusions (Willden, 1964). Tertiary volcanic and intercalated sedimentary rocks unconformably overlie the Mesozoic units locally in the northern part of the range. Much of the Tertiary volcanic units are thought to be outflow facies of the McDermitt volcanic field and related calderas to the north, with the volcanic rocks that host the Sleeper deposit originating from a local volcanic complex (Nash et al., 1995). Quaternary pediment gravels and aeolian sands lie to the west of the Slumbering Hills and cover much of the Sleeper Gold Property area.
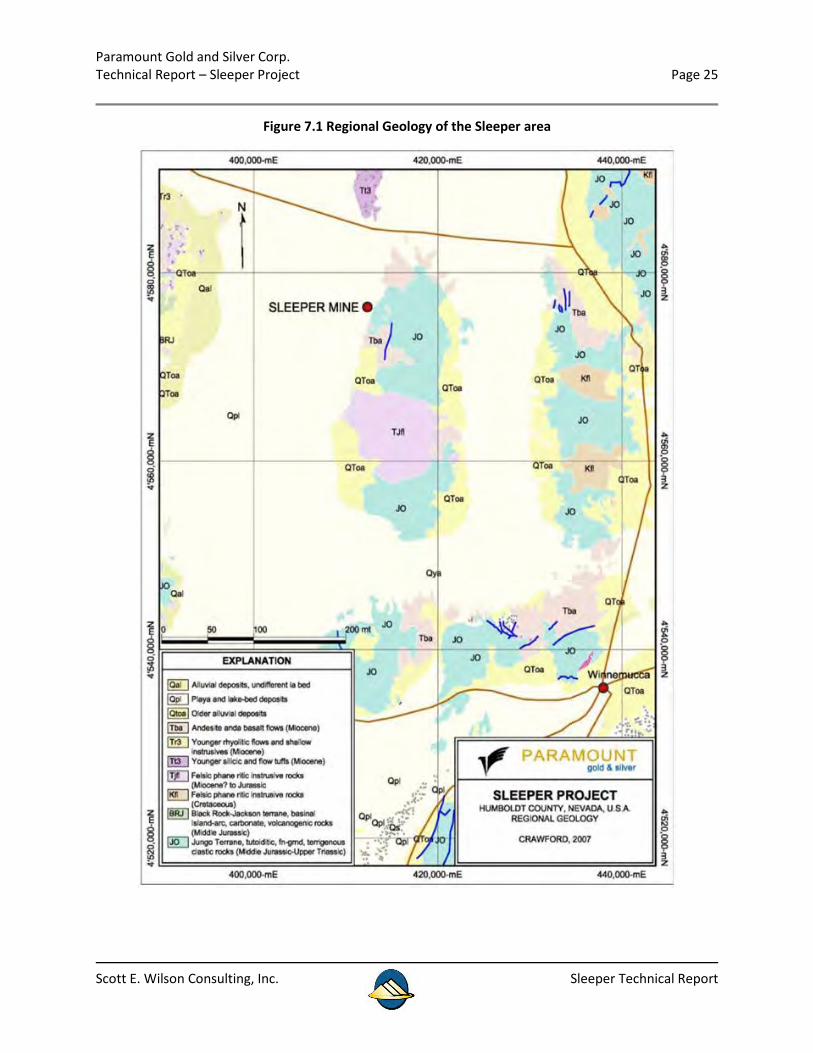
Paramount Gold and Silver Corp. Technical Report – Sleeper Project Page 25
Scott E. Wilson Consulting, Inc. Sleeper Technical Report
Figure 7.1 Regional Geology of the Sleeper area
Paramount Gold and Silver Corp. Technical Report – Sleeper Project Page 26
Scott E. Wilson Consulting, Inc. Sleeper Technical Report
7.2 PROPERTY GEOLOGY
The Sleeper Gold Property is located on the western flank of the Slumbering Hills, largely within Desert Valley. The rock units that underlie Desert Valley appear to have been down-dropped 3,000 to 3,300 ft along north-to northeast-trending normal faults along the western edge of the Slumbering Hills (Nash et al., 1985). Northwest-striking faults also are present, which may represent re-activated Battle Mountain-Eureka trend structures.
Basement rocks are exposed in the Slumbering Hills to the east of the Sleeper Mine and are comprised of the Auld Lang Syne Group of Triassic to Jurassic (?) age. The Auld Lang Syne Group is a sequence of dark, fine-grained slate, phyllite, quartzite, calcareous phyllite and local marble to granular limestone. These sedimentary units were deformed and weakly metamorphosed to greenschist facies during the Mesozoic (Willden, 1964; Burke and Silberling, 1973). The Auld Lang Syne rocks host the quartz-adularia-gold veins that were exploited at the Jumbo and Alma mines. A granodioritic to monzonitic pluton was emplaced during the Cretaceous (Willden, 1964) in the central part of the Slumbering Hills.
Tertiary volcanic rocks (Nash et al., 1985) unconformably overlie and intrude the Mesozoic rocks in the northern and eastern parts of the Slumbering Hills. The first unit deposited on basement was a sequence of volcaniclastic rocks and local volcanic flow strata of intermediate composition that is up to 650 ft thick. The age of this basal unit is uncertain; an age date of 17.3 Ma was obtained from adularia from a vein cutting this unit at the Jumbo Mine (Conrad et al., 1993).
The Intermediate lavas lie atop the basal volcaniclastic unit and are approximately 500-ft thick. This unit consists of a sequence of volcanic flows and flow breccias of dacitic to basaltic composition. A felsic, pumiceous lapilli tuff unit approximately 130-ft thick lies atop the Intermediate flows unit and is in turn overlain by the Sleeper rhyolite. The Sleeper rhyolite is the main host of gold mineralization within the Sleeper pit and consists of a sequence of flows, dikes, sills and flow domes of quartz-eye rhyolite with sanidine phenocrysts and local biotite. Similar appearing rhyolitic to quartz latite dikes and sills are found to the east and southeast of the Sleeper Mine in the Slumbering Hills. The age of the Sleeper rhyolite is approximately 17 Ma, but there are no direct age dates (Nash et al., 1995).
The Sleeper rhyolite is overlain by significant volumes of per-alkaline rhyolite ash flow tuffs, correlated with the tuff of Oregon Canyon (Nash et al., 1995). These tuffs, which are thought to post- date the gold mineralization at the Sleeper Mine, originated from calderas in the McDermitt area about 50 miles to the north at approximately 16.2 to 16.1 Ma (Conrad et al., 1993). This unit crops out in the northern Slumbering Hills, where it is up to 250-ft thick, contains soda amphiboles and is strongly welded.
Flows of the Awakening Rhyolite occur southeast of the Sleeper Mine capping a hill called ZZ Top and are up to 600 ft thick. They have been dated at 13.6 +/-0.7 Ma (Conrad et al., 1993). The Awakening Rhyolite appears to have formed several flow domes along normal faults and the rocks are generally fresh and little altered, in contrast to the strongly altered flows of the older Sleeper rhyolite (Nash et al., 1995). Some silicified but gold-poor dikes of this unit occur near the flow domes.
Paramount Gold and Silver Corp. Technical Report – Sleeper Project Page 27
Scott E. Wilson Consulting, Inc. Sleeper Technical Report
Pliocene basalt dikes occur locally southeast of the Sleeper Mine and represent the youngest igneous unit recognized in the Slumbering Hills. Older alluvium (Pliocene to Quaternary; Nash et al., 1955) occurs in the Sleeper Gold Property area; weathered clasts with quartz veins and visible gold in gravel deposits were found overlying the main deposit at the Sleeper Mine. Airfall ash tuff beds dated at 2.1 Ma (Pliocene) by Conrad et al. (1993) locally overlie the Older Alluvium. Younger Quaternary alluvium lies atop the Pliocene tuff beds, as valley fill in Desert Valley and as pediment gravels, alluvium, and colluvium along the flanks of the Slumbering Hills. A mantle of aeolian sand covers much of the surface of Desert Valley and the adjoining hills.
Basin and Range extension was first manifested in lacustrine and alluvial volcaniclastic materials that were deposited prior to 17 Ma, and in numerous high-angle normal faults with northerly to northeasterly strikes. Sets of northwest trending faults may have been initiated at or before this time, as certain faults with this orientation host quartz-adularia vein systems in the Slumbering Hills, such as at the Jumbo and Alma mines.
During late summer in 2006 an X-Cal drilling program was proposed to test several exploration targets located along the Range Front fault. RF-06-01 was located at the southern end of the iron stained scarp exposure that brought attention to the area during Amax’s exploration program. The proposed target was to drill an angle hole west to east to intersect the Range Front fault at depth and continue into the meta-sedimentary rocks of the Auld Lang Syne Group. The drill hole intersected a heterolithic breccia zone and the meta-sedimentary contact earlier than anticipated. The volcanic breccia was in contact with the meta-sediments but did not appear to be a tectonic contact. This observation was not understood until core holes and additional RCD holes were drilled in the reclaimed Facilities Area (location of the demolished Amax mill, assay lab and crushing facilities).
Two core holes were drilled in the Facilities North resource area early in 2007. Meticulous logging of the drill holes identified cobbles and occasional boulders of altered vesicular basalt supported by a matrix of cryptocrystalline volcanic ash. Further inspection identified other volcanic clasts of various lithologies supported by the ash matrix. A “block in ash” texture (McPhie, Doyle and Allen, 1993), had been identified and the wide spread occurrence of the volcanic breccia throughout the Facilities Area was referred to as a volcanic unit given the name “debris flow”. SRK is of the opinion that further work in reviewing the logging of these holes should be done in order to better describe this unit and see if this terminology is correct.
The “debris flow” is the primary host lithology for precious metals mineralization identified at the Facilities area. Thickness of the debris flow ranges from 100 feet (30 m) to 500 feet (150 m). Ash layers that are inter-bedded within the debris flow are not mineralized but do exhibit advanced argillic alteration. The ash units range in thickness from 5 feet (1.5 m) to 20 feet (6 m). The debris flow dips westerly towards the existing open pit and has been identified in core at West Wood. The banded veins with visible gold (electrum) and the higher grade sulphide breccias of West Wood are developed within the debris flow. The lower grade mineralization of West Wood favors the debris flow and is similar to mineralization found at the Facilities area.
Paramount Gold and Silver Corp. Technical Report – Sleeper Project Page 28
Scott E. Wilson Consulting, Inc. Sleeper Technical Report
Detailed cross sections developed during the geologic modeling process of Facilities (North and South) in 2007, defined a complex structural setting. The following is a summary of the structures and possible tectonic relationships presently identified.
A very prominent swarm of through going northwest structures (azimuth 325) cut through the Facilities North and South areas. Between the northwest trending structures are numerous northeast (azimuth 50) structures that are steep dipping and predominantly have downward displacement towards the southeast. A series of Range Front type structures (north northeast) down drops stratigraphic marker beds and/or contacts (volcanic sediments and meta-sedimentary rock contact) nearly 100 feet (31 m) westerly. Additional northeastern (azimuth 15-20) structures that parallel the
Sleeper vein, but have apparent up thrown movement on the western flank and an easterly dip direction, may be related to feeder structures for mineralization identified in the Facilities areas.
Five northwest trending structures were identified in Facilities North. The first of these structures projects southeast from the southeastern toe of leach pad 1. The spacing or periodicity between the remaining four structures is approximately 450 feet (137 m). The dip direction for these structures is southwest and measures approximately 75 to 80 degrees. Apparent strike slip movement for the first three and the fifth structure is right-lateral 50 to 100 feet (15 to 31 m). The fourth structure in this sequence may have an apparent left-lateral movement. Down dip offsets of the northwest trending structures were measured less than 50 feet (15 m).
The pattern of northeasterly striking structures developed between the northwest bounding structures reflect similar patterns of transverse and extensional fractures from brittle failure as had been identified by experimental ductile shear tests conducted by Borg and Handin, 1966.
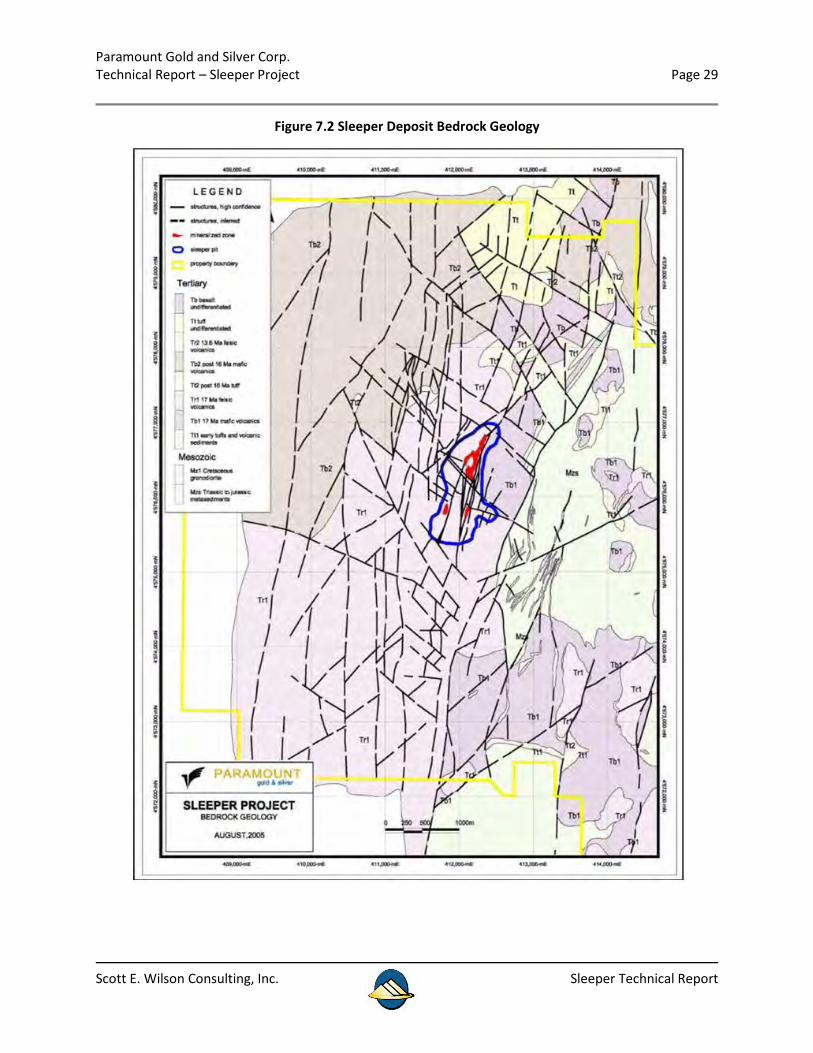
Paramount Gold and Silver Corp. Technical Report – Sleeper Project Page 29
Scott E. Wilson Consulting, Inc. Sleeper Technical Report
Figure 7.2 Sleeper Deposit Bedrock Geology
Paramount Gold and Silver Corp. Technical Report – Sleeper Project Page 30
Scott E. Wilson Consulting, Inc. Sleeper Technical Report
7.3 MINERALIZATION
7.3.1 MINERALIZATION AND ALTERATION
Four main types of gold mineralization are found within the Sleeper deposit and may represent a continuum as the system evolved from a high level, high sulphidation system dominated by intrusion related fluids and volatiles to a low sulphidation meteoric water dominant system (Corbett, 2005, Utterback, 2005, Histed, 2005). In this setting the paragenetic relationships of the differing mineralization styles are as follows:
• Early -quartz-pyrite-marcasite stockwork • Intermediate -medium-grade, silica-pyrite-marcasite cemented breccias localized on zones of
structural weakness • Late -high-grade, banded, quartz-adularia-electrum-(sericite) veins • Post -alluvial gold-silver deposits in Pliocene gravels
AMAX mined all four types of mineralization, with high-grade material (> 0.1 oz Au/ton) processed through the mill and low-grade (0.006 to 0.1 oz Au/ton) material processed by heap leaching. All were mined by open pit methods from the Sleeper, Wood, and Office pits. The deposit was mined over a north-south distance of 4,500 ft (1,372 m) and an east-west width of approximately 2,100 ft (640 m). During AMAX’s operations, the mill feed included the high-grade veins and breccias, while the heap leach feed included lower-grade breccias and stockwork zones. Alluvial gold zones were a special ore type, as they contained vein-bearing clasts with coarse-grained gold that had to be processed through the mill.
The high-grade bonanza veins are banded and composed of layers of quartz-adularia-electrum, with minor carbonate, barite, and late stibnite. Veins ranging from 1 inch to 20 feet in true width were mined in the Sleeper, East Wood, West Wood and Office vein systems. Numerous other narrower or shorter veins have been found in the course of drilling and mining, including several below the final mined pit, and some hosted within Auld Lang Syne meta-sedimentary rocks.
The mined high-grade veins showed good continuity along strike and dip, although the distribution of the highest-grade values was somewhat erratic. Detailed drilling and pit mapping show that the high- grade vein systems can be followed along strike for distances of more than 650 ft, although high- grade gold values and the veins themselves do not continue uninterrupted over these lengths. Veins locally averaged over 20 oz Au/ton within the Sleeper pit; one blast hole reported 195 oz Au/ton over
ft (6 m) and an RC drill hole intersected 162 oz Au/ton over a true width of 5 ft (1.5 m). The vein zones in the pit were localized primarily within the Sleeper rhyolite, although they are known to extend downward into the intermediate volcanic rocks and Auld Lang Syne strata. The veins did not show an appreciable nugget effect, as determined by numerous screen-fire gold assays performed by AMAX and X-Cal (Redfern and Rowe, 2003).
Paramount Gold and Silver Corp. Technical Report – Sleeper Project Page 31
Scott E. Wilson Consulting, Inc. Sleeper Technical Report
Medium-grade breccias in the mine, which were clast-supported and cemented by silica, pyrite, marcasite and adularia, typically assay between 0.1 and 1.0 oz Au/ton. The pyrite-marcasite content of the higher-grade breccias was notably higher than in the veins. The silver content in mined breccias was typically three to six times the gold grade. Much of the breccia mined by AMAX was within 20 feet (6 m) of the high-grade veins, occurring in both the footwall and hanging wall rocks, although they also occurred in discrete zones up to 10 ft (3 m) wide more that 150 ft (45 m) from known veins. Individual breccia bodies were typically 3 to 10 ft (1 to 3 m) wide and graded laterally into less brecciated wall rocks cut by stockwork veins (Nash et al., 1995). Lower-grade stockwork and breccia mineralization accounted for approximately 20 percent of the gold production. Mineralized breccias extend below the depth of the Sleeper Mine open pits, as demonstrated by X- Cal drilling west of the Wood Pit, where the breccias are particularly rich in sulphides.
Alluvial gold mineralization of Miocene or Pliocene age was found and mined in the western part of the Sleeper pit. This Older Alluvium consists of poorly sorted conglomerates derived mostly from the weathering of altered Sleeper rhyolite and partly from vein/stockwork ores. Nash et al. (1995) stated that approximately 100,000 ounces of gold were produced from this material in 1990 to 1992 at grades of approximately 0.1 oz Au/ton.
7.4 GEOLOGICAL MODELING
Leapfrog Support Chile (LSC) was retained by SRK Chile to create a 3D Geological model of Paramount’s Sleeper gold deposit in Nevada. The deliverable products of this work 3D meshes for Au and Ag mineralization and a lithological model of the study area, to be used as geological domains for resource estimation by SRK. Ernesto Jaramillo, Principal Geologist and Head of Resources at SRK Consulting in Santiago, Chile, worked together with LSC to check the models and verify the process and interpretations. This was also monitored together with Paramount personnel during several meetings held during the process of this study.
7.4.1 METHODOLOGY
Leapfrog Support Chile uses Implicit Geological Modeling Techniques in their projects, through Leapfrog Mining™ software, developed by Applied Research Associates New Zealand Limited (ARANZ). This methodology consists on using numerical data and user-defined parameters to calculate Volume Functions, from which iso-surfaces can be triangulated. This method eliminates or minimizes the need to manual digitization in 2D sections and plans.
Input data for a volume function can be any 3D georeferenced data, particularly drillhole intervals with assay, intensity or numerical property values. In the case of discrete geological data such as lithology, alteration or mineral zone, the data are converted to “volume points” in the software, through a process that incorporates compositing, dilution, time sequence and cross-cutting relationships into account. In the discrete case, each unit being modeled is represented by a separate set of volume points, which have a value of 0 in the contacts of the unit being modeled.
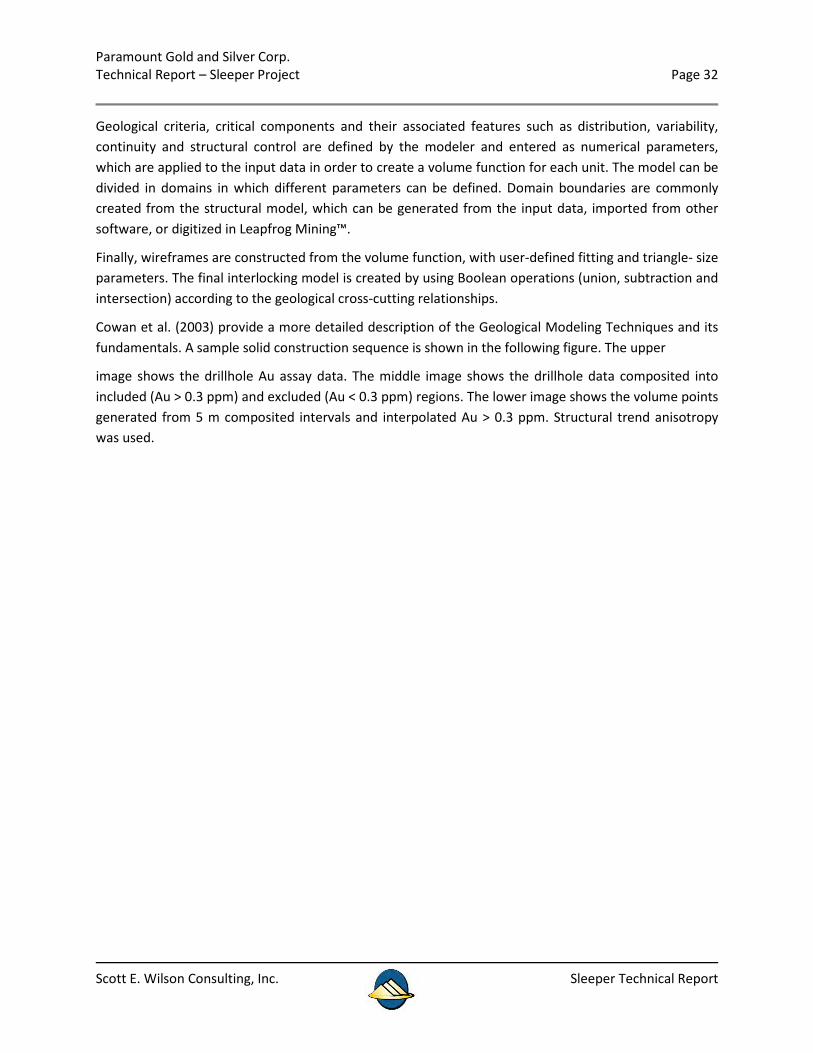
Paramount Gold and Silver Corp. Technical Report – Sleeper Project Page 32
Scott E. Wilson Consulting, Inc. Sleeper Technical Report
Geological criteria, critical components and their associated features such as distribution, variability, continuity and structural control are defined by the modeler and entered as numerical parameters, which are applied to the input data in order to create a volume function for each unit. The model can be divided in domains in which different parameters can be defined. Domain boundaries are commonly created from the structural model, which can be generated from the input data, imported from other software, or digitized in Leapfrog Mining™.
Finally, wireframes are constructed from the volume function, with user-defined fitting and triangle- size parameters. The final interlocking model is created by using Boolean operations (union, subtraction and intersection) according to the geological cross-cutting relationships.
Cowan et al. (2003) provide a more detailed description of the Geological Modeling Techniques and its fundamentals. A sample solid construction sequence is shown in the following figure. The upper
image shows the drillhole Au assay data. The middle image shows the drillhole data composited into included (Au > 0.3 ppm) and excluded (Au < 0.3 ppm) regions. The lower image shows the volume points generated from 5 m composited intervals and interpolated Au > 0.3 ppm. Structural trend anisotropy was used.
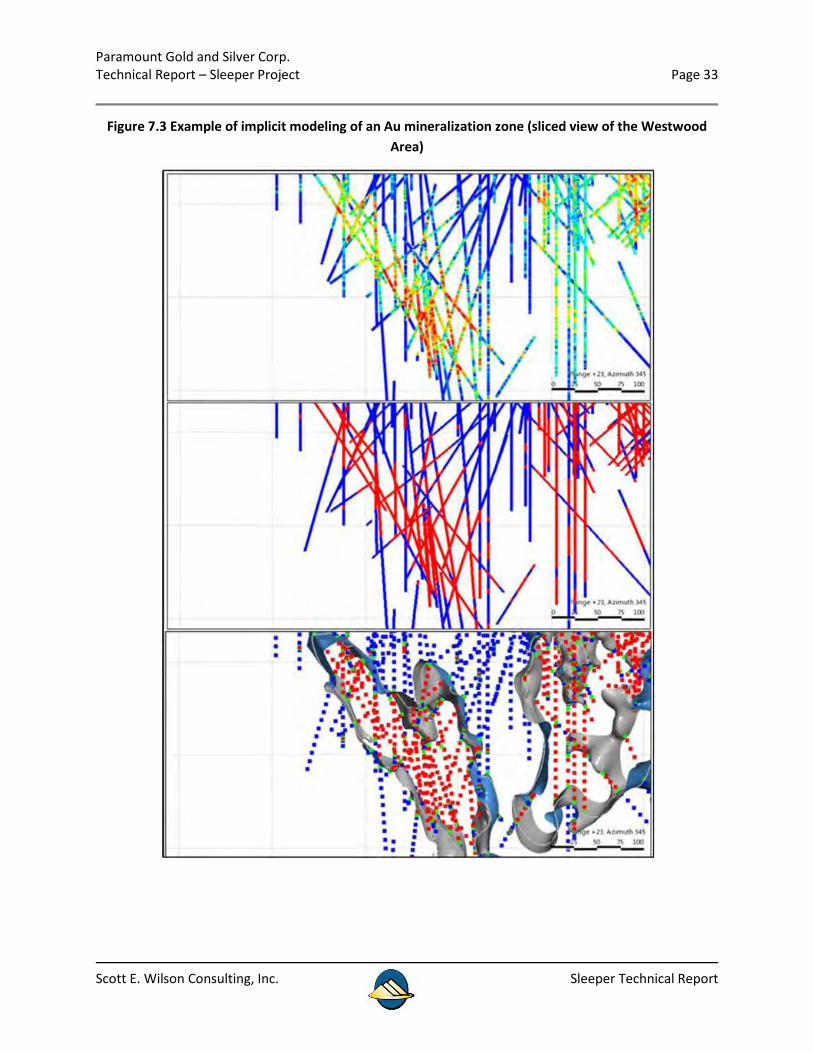
Paramount Gold and Silver Corp. Technical Report – Sleeper Project Page 33
Scott E. Wilson Consulting, Inc. Sleeper Technical Report
Figure 7.3 Example of implicit modeling of an Au mineralization zone (sliced view of the Westwood Area)
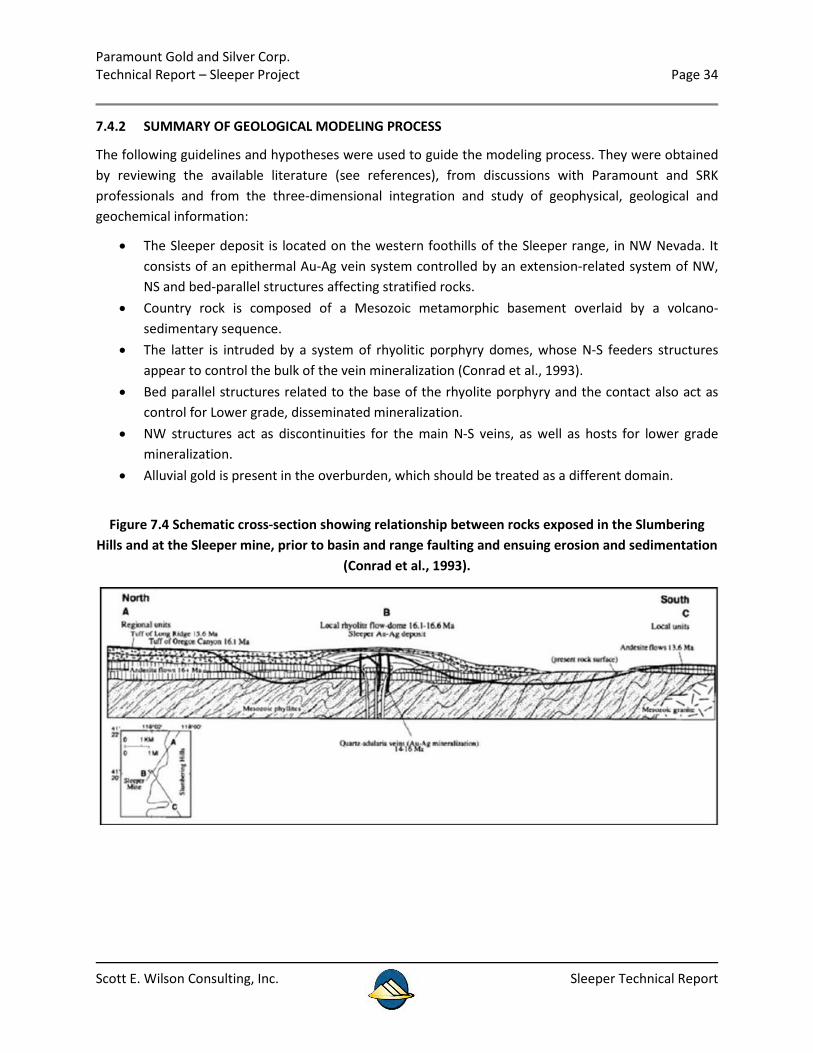
Paramount Gold and Silver Corp. Technical Report – Sleeper Project Page 34
Scott E. Wilson Consulting, Inc. Sleeper Technical Report
7.4.2 SUMMARY OF GEOLOGICAL MODELING PROCESS
The following guidelines and hypotheses were used to guide the modeling process. They were obtained by reviewing the available literature (see references), from discussions with Paramount and SRK professionals and from the three-dimensional integration and study of geophysical, geological and geochemical information:
• The Sleeper deposit is located on the western foothills of the Sleeper range, in NW Nevada. It consists of an epithermal Au-Ag vein system controlled by an extension-related system of NW, NS and bed-parallel structures affecting stratified rocks.
• Country rock is composed of a Mesozoic metamorphic basement overlaid by a volcano- sedimentary sequence.
• The latter is intruded by a system of rhyolitic porphyry domes, whose N-S feeders structures appear to control the bulk of the vein mineralization (Conrad et al., 1993).
• Bed parallel structures related to the base of the rhyolite porphyry and the contact also act as control for Lower grade, disseminated mineralization.
• NW structures act as discontinuities for the main N-S veins, as well as hosts for lower grade mineralization.
• Alluvial gold is present in the overburden, which should be treated as a different domain.
Figure 7.4 Schematic cross-section showing relationship between rocks exposed in the Slumbering Hills and at the Sleeper mine, prior to basin and range faulting and ensuing erosion and sedimentation
(Conrad et al., 1993).
Paramount Gold and Silver Corp. Technical Report – Sleeper Project Page 35
Scott E. Wilson Consulting, Inc. Sleeper Technical Report
7.4.3 STRUCTURAL MODELING
A structural model was created with the purpose of creating mineralized envelopes that properly represent the geological controls and anisotropy of the gold distribution. This is achieved by creating wireframes of the controlling structures, which are used to direct the interpolation of the Au grades by the "structural trend" feature in the Leapfrog Mining software.
All input data were integrated on a 3D scene. Blastholes and diamond and reverse circulation drillhole assay data most clearly showed which structures needed to be considered to direct the interpolation. These domains were not used as boundaries for the Au and Ag models, since mineralization appears controlled by but not limited to structures. However, some of the structures
were also observed to define hard boundaries for the lithological units, and were therefore used to define structural domains.
The figure below shows the Sleeper blasthole and drillhole data. The top figure is an inclined perspective view from the SE showing drillholes and assays as colour ranges. The middle figure displays the structural wireframes of principal vein controls (N-S) and discontinuities (NW), also in a perspective view. The bottom figure is a sliced view section (W-E) showing assays, vertical and bedding parallel structures, and local anisotropy (black ellipsoids) of the combined structural trend.
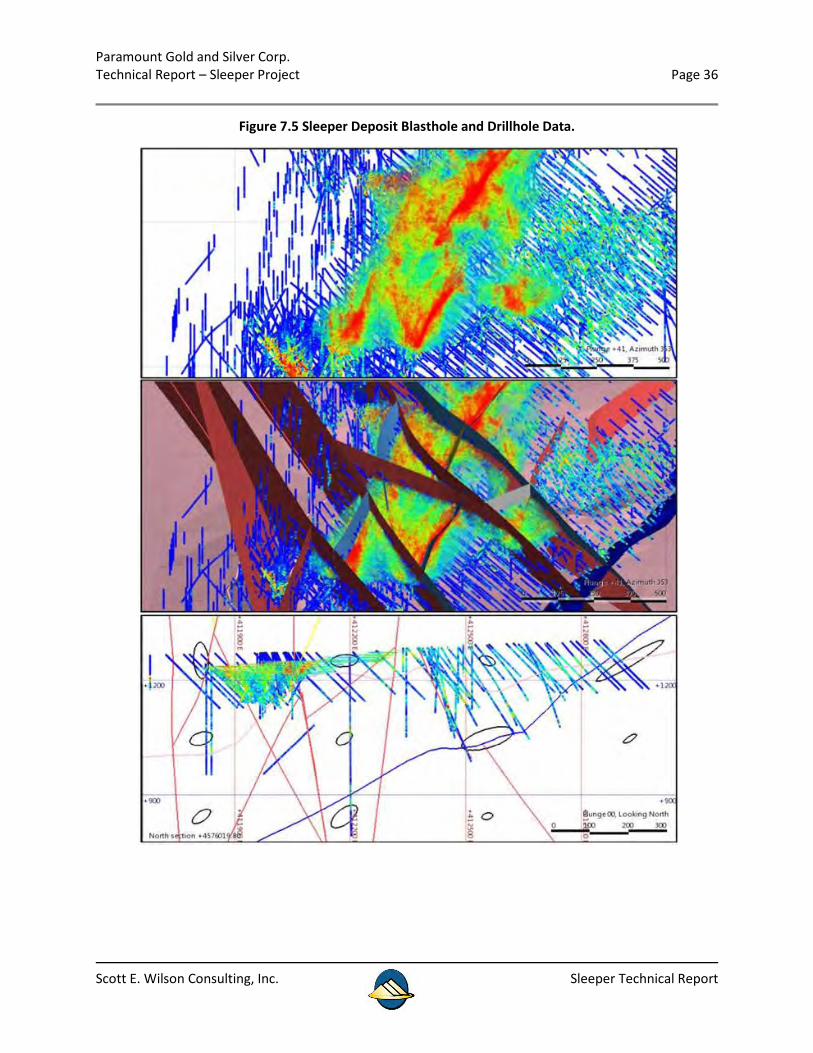
Paramount Gold and Silver Corp. Technical Report – Sleeper Project Page 36
Scott E. Wilson Consulting, Inc. Sleeper Technical Report
Figure 7.5 Sleeper Deposit Blasthole and Drillhole Data.
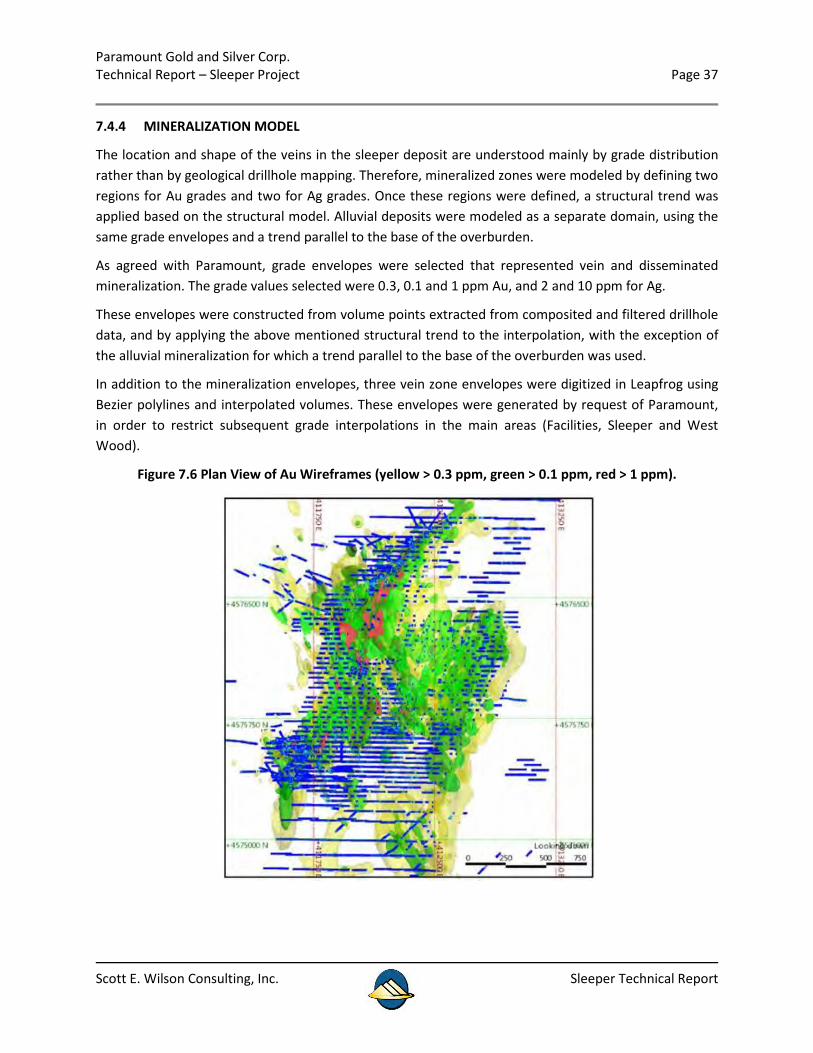
Paramount Gold and Silver Corp. Technical Report – Sleeper Project Page 37
Scott E. Wilson Consulting, Inc. Sleeper Technical Report
7.4.4 MINERALIZATION MODEL
The location and shape of the veins in the sleeper deposit are understood mainly by grade distribution rather than by geological drillhole mapping. Therefore, mineralized zones were modeled by defining two regions for Au grades and two for Ag grades. Once these regions were defined, a structural trend was applied based on the structural model. Alluvial deposits were modeled as a separate domain, using the same grade envelopes and a trend parallel to the base of the overburden.
As agreed with Paramount, grade envelopes were selected that represented vein and disseminated mineralization. The grade values selected were 0.3, 0.1 and 1 ppm Au, and 2 and 10 ppm for Ag.
These envelopes were constructed from volume points extracted from composited and filtered drillhole data, and by applying the above mentioned structural trend to the interpolation, with the exception of the alluvial mineralization for which a trend parallel to the base of the overburden was used.
In addition to the mineralization envelopes, three vein zone envelopes were digitized in Leapfrog using Bezier polylines and interpolated volumes. These envelopes were generated by request of Paramount, in order to restrict subsequent grade interpolations in the main areas (Facilities, Sleeper and West Wood).
Figure 7.6 Plan View of Au Wireframes (yellow > 0.3 ppm, green > 0.1 ppm, red > 1 ppm).
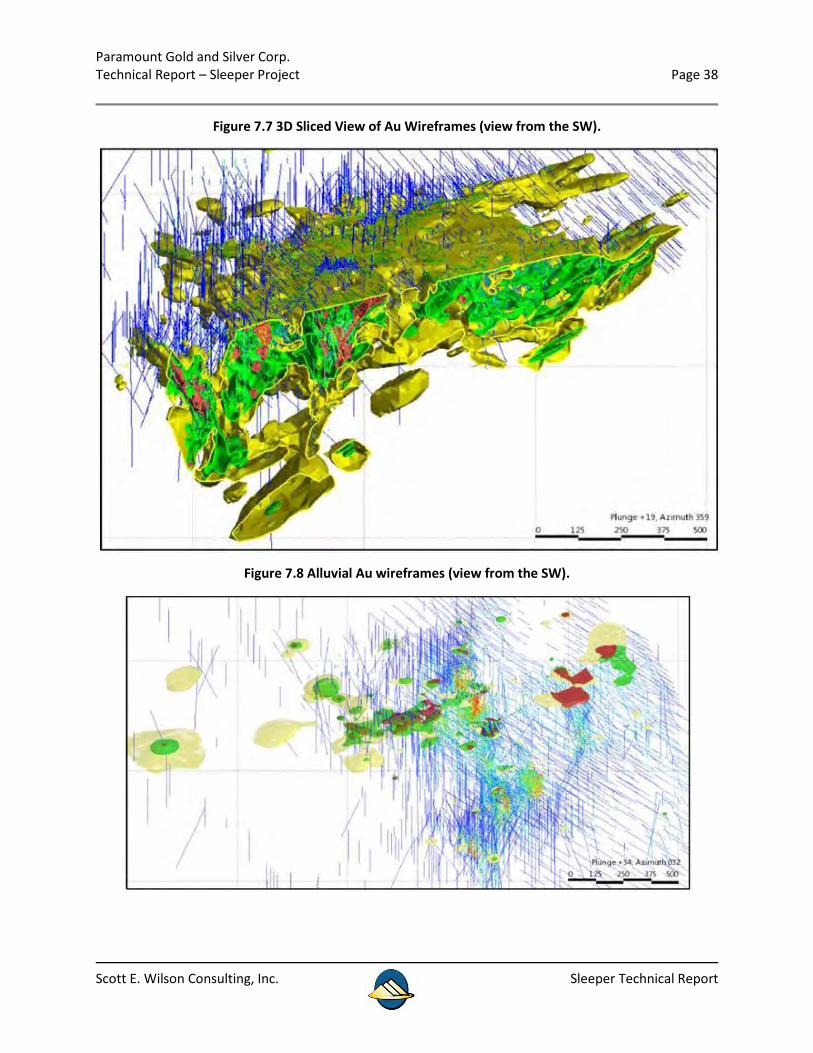
Paramount Gold and Silver Corp. Technical Report – Sleeper Project Page 38
Scott E. Wilson Consulting, Inc. Sleeper Technical Report
Figure 7.7 3D Sliced View of Au Wireframes (view from the SW).
Figure 7.8 Alluvial Au wireframes (view from the SW).
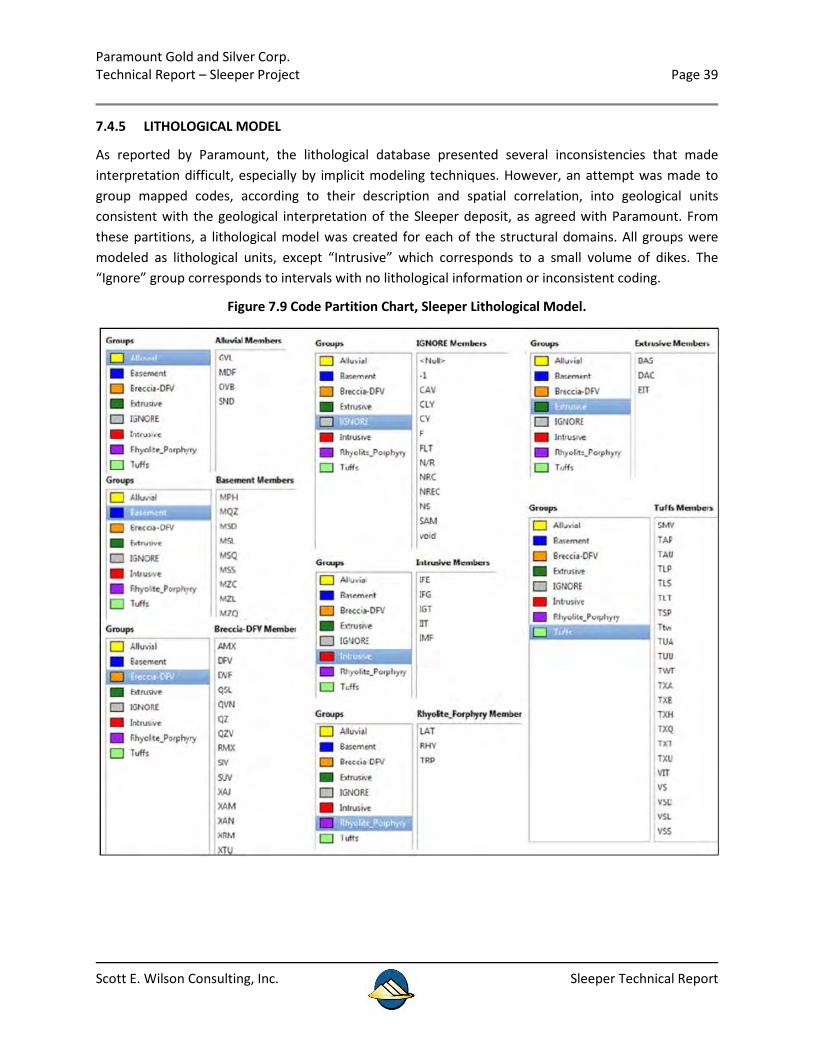
Paramount Gold and Silver Corp. Technical Report – Sleeper Project Page 39
Scott E. Wilson Consulting, Inc. Sleeper Technical Report
7.4.5 LITHOLOGICAL MODEL
As reported by Paramount, the lithological database presented several inconsistencies that made interpretation difficult, especially by implicit modeling techniques. However, an attempt was made to group mapped codes, according to their description and spatial correlation, into geological units consistent with the geological interpretation of the Sleeper deposit, as agreed with Paramount. From these partitions, a lithological model was created for each of the structural domains. All groups were modeled as lithological units, except “Intrusive” which corresponds to a small volume of dikes. The “Ignore” group corresponds to intervals with no lithological information or inconsistent coding.
Figure 7.9 Code Partition Chart, Sleeper Lithological Model.
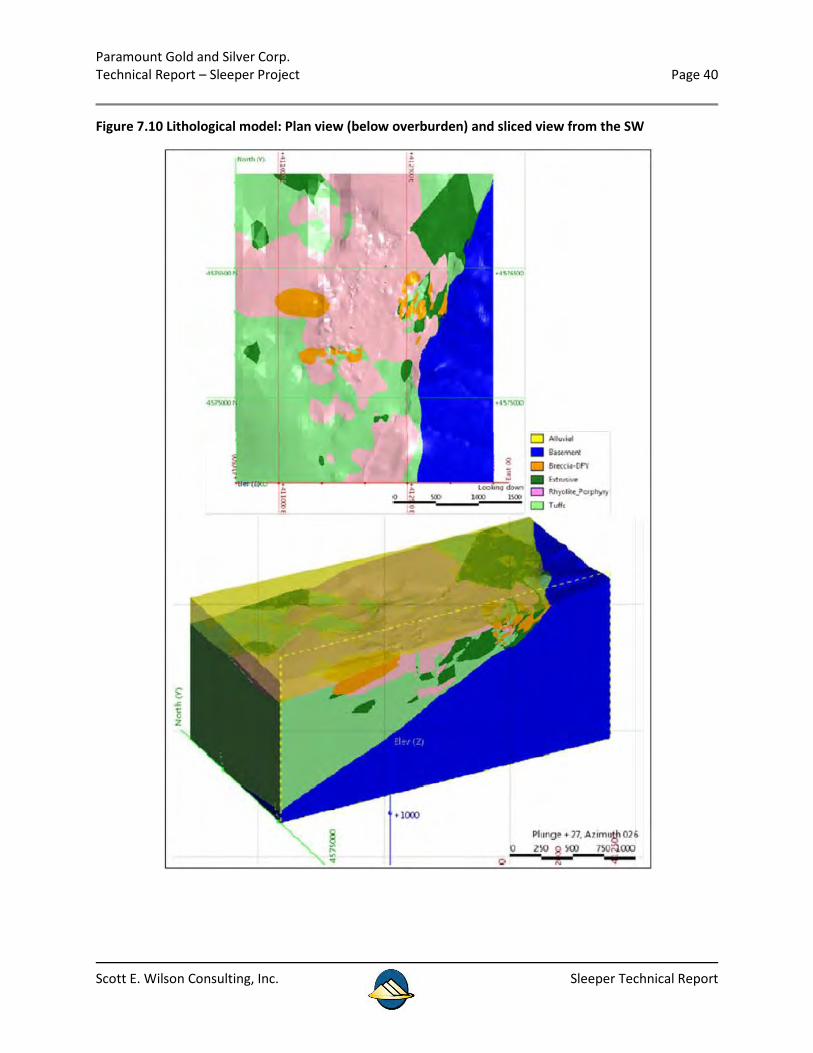
Paramount Gold and Silver Corp. Technical Report – Sleeper Project Page 40
Scott E. Wilson Consulting, Inc. Sleeper Technical Report
Figure 7.10 Lithological model: Plan view (below overburden) and sliced view from the SW
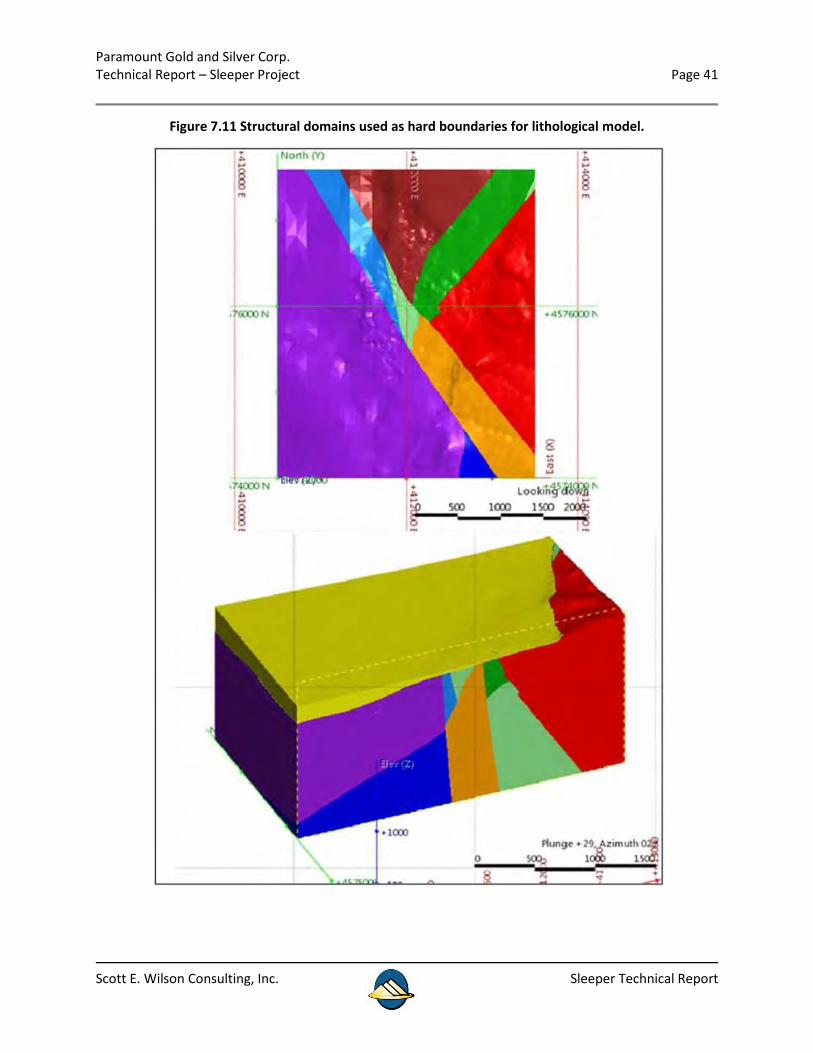
Paramount Gold and Silver Corp. Technical Report – Sleeper Project Page 41
Scott E. Wilson Consulting, Inc. Sleeper Technical Report
Figure 7.11 Structural domains used as hard boundaries for lithological model.
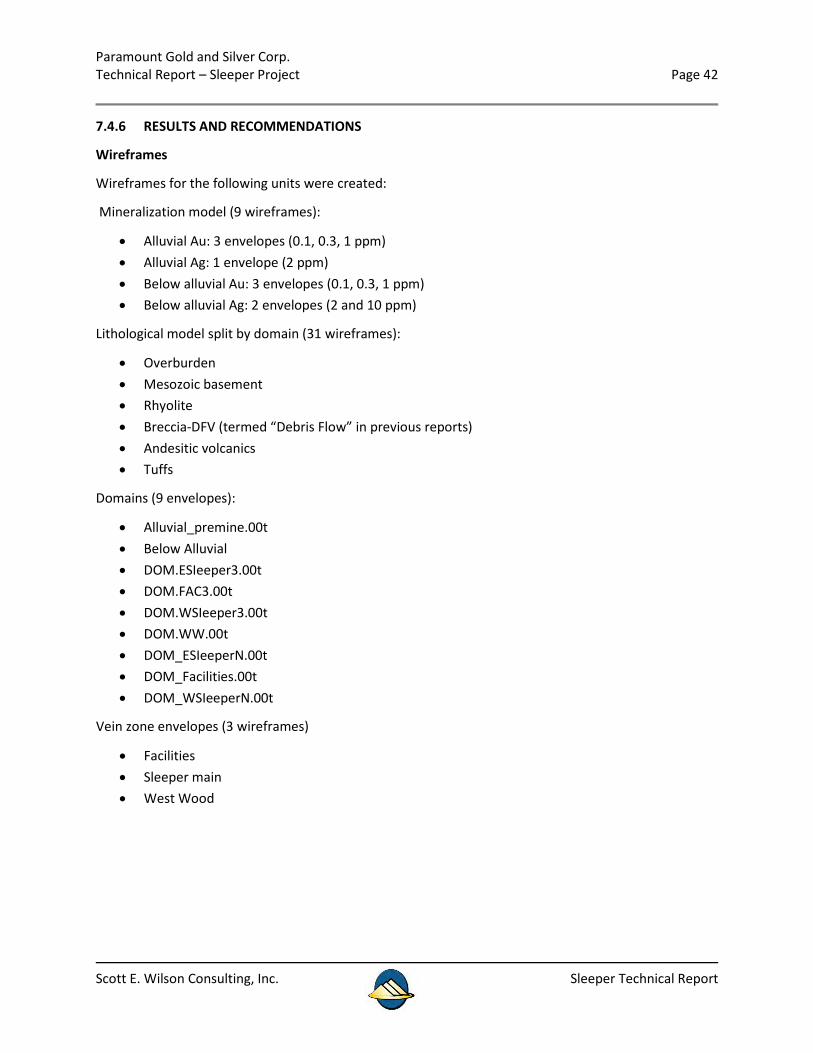
Paramount Gold and Silver Corp. Technical Report – Sleeper Project Page 42
Scott E. Wilson Consulting, Inc. Sleeper Technical Report
7.4.6 RESULTS AND RECOMMENDATIONS
Wireframes
Wireframes for the following units were created:
Mineralization model (9 wireframes):
• Alluvial Au: 3 envelopes (0.1, 0.3, 1 ppm) • Alluvial Ag: 1 envelope (2 ppm) • Below alluvial Au: 3 envelopes (0.1, 0.3, 1 ppm) • Below alluvial Ag: 2 envelopes (2 and 10 ppm)
Lithological model split by domain (31 wireframes):
• Overburden • Mesozoic basement • Rhyolite • Breccia-DFV (termed “Debris Flow” in previous reports) • Andesitic volcanics • Tuffs
Domains (9 envelopes):
• Alluvial_premine.00t • Below Alluvial • DOM.ESIeeper3.00t • DOM.FAC3.00t • DOM.WSIeeper3.00t • DOM.WW.00t • DOM_ESIeeperN.00t • DOM_Facilities.00t • DOM_WSIeeperN.00t
Vein zone envelopes (3 wireframes)
• Facilities • Sleeper main • West Wood
Paramount Gold and Silver Corp. Technical Report – Sleeper Project Page 43
Scott E. Wilson Consulting, Inc. Sleeper Technical Report
7.4.7 RECOMMENDATIONS
• Au and Ag mineralization display bedding-parallel control particularly at Facility, related to what has been interpreted in the model presented here, as the base of the rhyolite, and the contact with the underlying Mesozoic basement. These mineralization trends, especially the latter, have not been extensively drilled, and present strong potential for continuity.
• Grades were used as a proxy for mineralization style (vein, stockwork and dissemination). Identifying mineralization style consistently in the database would allow modeling these features directly in a more geologically consistent fashion.
• The lithological units presented here are preliminary, based on the grouping of codes mapped by different companies over a long period of time. It is recommended that the partition suggested here be used as a basis for future drillhole logging review campaigns, in order to produce a lithological coding system applicable to the whole deposit.
• The structures used were determined primarily on the bases of Au grade distribution and previous interpretations and conceptual models. It is recommended that field and drillhole structural information be carefully reviewed and entered into a newly compiled and integrated database as a more detailed structural model will be necessary at a more advanced project stage.
Paramount Gold and Silver Corp. Technical Report – Sleeper Project Page 44
Scott E. Wilson Consulting, Inc. Sleeper Technical Report
8 DEPOSIT TYPE
The Sleeper Mine mineralization consist of both high grade bonanza gold veins low in iron sulphides with silver: gold ratios <1 and low-grade stockwork gold mineralization associated with abundant iron sulphides that is characterized by silver : gold ratios of 3 to 10 (Nash et al., 1995). Nash et al. (1995) believe that the lower grade Sleeper Gold Property mineralization does not fit well in current geochemical classification schemes. They believe, however, that the widespread potassic (sericite and adularia) and silicic alteration indicate that this low-grade mineralization could be considered as a variant of the quartz-adularia class of deposit.
The spectrum of mineralization styles and the spatial relationships of those styles may suggest that the Sleeper Gold system demonstrates a continuum in mineralization from a modified high level, high sulphidation, intrusion related system dominated by magnetic derived fluids to a low sulphidation, meteoric water dominant system with a diluted magnetic fluid component (Corbett, 2005, Utterback, 2005, Histed, 2005).
The broad zones of silica sulphide breccias with elevated silver contents may represent a volatile rich event located above and peripheral to volcanic dome like features (Martin, 2005). The silica sulphide breccias identified in West Wood specifically core hole WW-14 -04 report gold and silver values up to 1.300 opt (44.585 g/t) Au and 74.768 opt (2,563.47 g/t) Ag. Crackle breccias and stockwork textures are part of this event. Extensive zones of clay alteration seen at Sleeper most likely formed at this time as the pH of the water was depressed after the exsolution of the volatiles from the fluid. ASD (analytical spectral data) studies indicate an abundance of kaolin species of clay, confirming the acidic environment of this event. Broad zones of silicification accompanied this event.
Subsequent to this early, elevated thermal energy event, waning of the intrusive activity and re- establishment of the hydrologic setting gradually evolved the system to a meteoric water dominant, low sulphidation system. Chemical buffering with wallrock allowed for the saturation of the near neutral evolved fluids with respect to silica. Dilution and buffering would have also inhibited the ability of the fluids to transport silver in the concentrations seen previously leading to the decreased silver content evident in the later vein style mineralization. Bonanza grade gold deposition appears to have resulted from the boiling of gold rich solution during these explosive events and as fluids mixed with the oxidized, low pH meteoric waters that resulted from the exsolution of volatiles after boiling (Corbett, 2005).
In addition to the Sleeper Mine style of mineralization, future exploration programs may target and expect more traditional low sulphfidation style mineralization, such as the Midas Style of precious metal occurrences (Goldstrand, 2000). Midas Style mineralization is also hosted in bimodal volcanic rocks and related to mid Miocene mineralizing events. Selenium minerals are an important part of the Midas system and manifest as silver selenides in banded quartz veins with bonanza grades. Trace element studies in 2004 and 2005 of various targets of the Sleeper Gold Property have demonstrated highly elevated levels of selenium as well. As mentioned by Goldstrand, “boiling textures” as bladed carbonate replaced by quartz are found in relation to bonanza grades of the Midas veins.
Paramount Gold and Silver Corp. Technical Report – Sleeper Project Page 45
Scott E. Wilson Consulting, Inc. Sleeper Technical Report
9 EXPLORATION
9.1 2004 AND 2005 EXPLORATION PROGRAMS
The Sleeper Joint Venture under the management of New Sleeper Gold Corporation conducted the
and 2005 exploration programs. The exploration program in 2004 included a total of 65 drill holes for 84,346 feet (25,715 m) of core, RC, RC pre-collar, and sonic drilling were completed during the year. During early 2005, drilling continued but at a reduced rate accomplishing 34 holes for 22,524 feet (6,867m) of mostly RC and lesser core drilling. The majority of 2004 and 2005 drill holes were located in West Wood, and Facilities drill targets. Six holes were also drilled under the pit. The drill program ended on August 7, 2005 and the focus shifted to gathering of data through a variety of surveys, data compilation and drill hole targeting.
Detailed surface studies and data collection surveys in 2005 included ASD mineralogical studies, soil geochemistry surveys, additional rock chip geochemistry, IP geophysics, additional Gravity geophysics, MT geophysics, Hg and CO2 soil gas studies, trenching, and multi-element ICP geochemistry and 3-dimensional studies of drill holes, and detailed GIS and 3-dimensional studies to better define future drill targets. Details of these studies are presented in the comprehensive report by Thomason, Kornze and Rowe, 2006.
The majority of the Joint Venture targeting studies came in after completion of the drilling program of
by the Sleeper Joint Venture. X-Cal initiated a comprehensive program to review and compile all data following the buy-out using a team of professionals with a variety of geologic disciplines. The compiled 3-D geochemical, geological, geophysical model and all related data continue to evolve incorporating ongoing input from X-Cal’s exploration.
9.2 2006 AND 2007 EXPLORATION PROGRAMS
During 2006, following consolidation of the Property 100% into X-Cal Resources Ltd., the X-Cal individual exploration team members provided their personal recommendations. Initial individual submissions for the Sleeper District totaled 227 drill holes or approximately 300,000 feet (91,440 m) of drilling. The exploration team reviewed the individual recommendations and 107 drill holes were designed to test the “priority mine scale targets”. Vic Chevillon reviewed and summarized these target areas. Much of the following discussion is drawn from his in-house memo (Chevillon, 2006).
The Facilities area has been covered by domestic or processing attributes for over 24 years. The decision to define a mineralized resource in this area was placed into the 2007 exploration program. The mill and the crushing facilities had been removed allowing access to areas and targeted specific areas that had not been accessible since 1986.
The objective of the drilling program was to test the targets for Sleeper type gold deposits and alteration signatures (and variants) with the objective of making discoveries that can be mined by open pit or underground methods. The targeting process involved compilation and integration of all project data to date. New geologic controls on past ore bodies in the Sleeper pit have been recognized. Known historic
Paramount Gold and Silver Corp. Technical Report – Sleeper Project Page 46
Scott E. Wilson Consulting, Inc. Sleeper Technical Report
gold ore bodies appear to have been deposited parallel to graben bounding normal faults within a Miocene, asymmetric, range-front graben succession. The better known ore bodies are west dipping on the eastern margin of normal fault-bounded, composite grabens. These horst and graben features are well defined by geologic cross sections and computer generated 3-D models. The higher gold grades within the ore bodies may have been influenced by intersecting north-west, north-east and east-west faults and fracture zones.
9.3 DRILL TARGETS DETERMINED IS 2006 AND 2007
In the immediate open pit area, the emerging geologic deposit model correlates very well with multiple, interpreted geophysical surveys (inverted detailed air magnetic, inverted pre-mine IP, CSAMT data). The mineralized and altered Sleeper graben correlates with distinctive magnetic, gravity and resistivity lows. Up thrown horst blocks east and west of the pit correlate with respective geophysical highs. The geophysical correlations for the open pit host geology and alteration are aids to targeting. The correlations allow geophysical patterns in covered pediment areas surrounding the pit to be interpreted as indicators of the structural configuration of covered bedrock. Covered, potentially mineralized grabens are interpreted from the geophysics and these interpretations are supported by recent geochemical data.
Geochemical models in the open pit area depict geochemical and alteration zoning around the deposit (drill hole ICP, ASD alteration clay determinations including ammonia bearing clays proximal to ore). The zoning tends to indicate Sleeper is contained within a large hydrothermal alteration cell. An interstitial soil gas orientation survey documents high CO2, NH3 and locally SO2 anomalies and low O2 anomalies near the ore bodies at each end of the open pit and over the covered West Wood Breccia. In outlying covered areas (SW Target orientation area) soil gas anomalies correlate well with geophysical patterns of projected, covered grabens. Coincident soil gas anomalies, particularly CO2 in combination with NH3 are interpreted as remote surface evidence of covered mineralized and altered faults and veins in bedrock.
9.4 GEOPHYSICAL SURVEYS
Geophysical work completed at Sleeper includes: magnetic, gravity, induced polarization (IP) and magnetic-telluric (MT) surveys. Both the historical work and the current work have been incorporated into a MapInfo GIS database to facilitate interpretations based on the entire data set. Consulting geophysicist James Wright, of J. L. Wright Geophysics Inc. is retained by X-Cal to advise on the selection and design of geophysical surveys at Sleeper, and to interpret the results from these surveys. Details of geophysical surveys are given in Thomason, Kornze and Rowe, 2006.
In the Sleeper open pit area there are excellent correlations of air magnetic, pre mine IP and gravity results with the modeled pit geology and alteration. The modeled grabens (and attendant horsts) correlate with the map and 3-D patterns in the inverted geophysical data. Therefore the geophysical information was interpreted and geology was projected into outlying covered areas of the targets.
Paramount Gold and Silver Corp. Technical Report – Sleeper Project Page 47
Scott E. Wilson Consulting, Inc. Sleeper Technical Report
9.5 AIR MAGNETIC SURVEY
A 1997 Placer Dome detailed air magnetic survey (draped north-south and east-west lines at 75 m intervals) was inverted in 2005. It shows the Sleeper ore bodies are within a distinctive magnetic low which is part of a north-south to north-north-east trending magnetic low surrounded by magnetic highs. In the open pit area the magnetic low correlates very well with the map and cross section pattern of the interpreted mineralized Sleeper graben and the highs, with surrounding horsts.
9.6 GEOCHEMICAL SURVEYS
For the purposes of surface exploration geochemistry, the Sleeper Gold Property can be divided into 4 general domains:
• Pediment-covered basin • Hills, where regolith is present • Hills with exotic cover, including aeolian sands • Disturbed mine areas
Geochemical surveys in the pediment-covered basin have included Hg vapor surveys, orientation CO2 soil gas surveys, and orientation pH surveys. Work in the hills has included more conventional soil and rock sampling, and limited ant hill sampling. Great care has been taken to avoid disturbed mine areas in all of these surveys. Details of the geochemical surveys are given in Thomason, Kornze and Rowe, 2006.
9.7 SURVEYING
On site, SRK checked survey reports of drill hole collar surveys for a selection of holes dating from September, 1986, which are the first records that Paramount has in their Winnemucca office. Specifically, several drill hole collar surveys were checked for programs drilled during 1986, 1990, 1994, 1997, 2004, 2005, 2006, 2007 and the current Paramount 2010-2011 drill program.
In addition, downhole surveys were checked for a selection of holes drilled from 2004 - 2007. Paramount is currently surveying downhole deviation on their holes as well. Deviation surveys from pre-2004 holes were not found and it is not clear if holes were surveyed when the mine was in operation until 1998. The majority of the holes drilled during mine operation, however, were relatively short and little deviation would be expected from those holes. SRK considers the survey data to be adequate for use in the modeling and estimation activities.
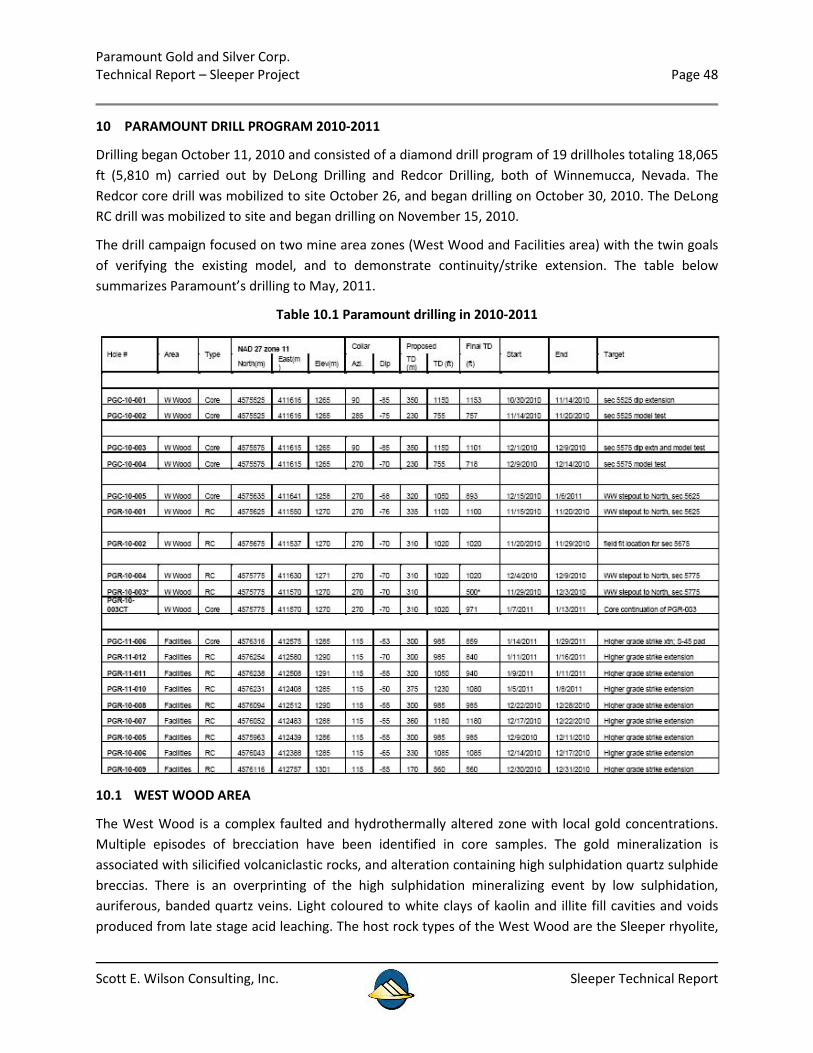
Paramount Gold and Silver Corp. Technical Report – Sleeper Project Page 48
Scott E. Wilson Consulting, Inc. Sleeper Technical Report
10 PARAMOUNT DRILL PROGRAM 2010-2011
Drilling began October 11, 2010 and consisted of a diamond drill program of 19 drillholes totaling 18,065 ft (5,810 m) carried out by DeLong Drilling and Redcor Drilling, both of Winnemucca, Nevada. The Redcor core drill was mobilized to site October 26, and began drilling on October 30, 2010. The DeLong RC drill was mobilized to site and began drilling on November 15, 2010.
The drill campaign focused on two mine area zones (West Wood and Facilities area) with the twin goals of verifying the existing model, and to demonstrate continuity/strike extension. The table below summarizes Paramount’s drilling to May, 2011.
Table 10.1 Paramount drilling in 2010-2011
10.1 WEST WOOD AREA
The West Wood is a complex faulted and hydrothermally altered zone with local gold concentrations. Multiple episodes of brecciation have been identified in core samples. The gold mineralization is associated with silicified volcaniclastic rocks, and alteration containing high sulphidation quartz sulphide breccias. There is an overprinting of the high sulphidation mineralizing event by low sulphidation, auriferous, banded quartz veins. Light coloured to white clays of kaolin and illite fill cavities and voids produced from late stage acid leaching. The host rock types of the West Wood are the Sleeper rhyolite,
Paramount Gold and Silver Corp. Technical Report – Sleeper Project Page 49
Scott E. Wilson Consulting, Inc. Sleeper Technical Report
a lapilli tuff and a volcanic breccia. Within the more altered and mineralized zones, silicification and quartz sulphide alteration have replaced and masked many of the original
volcanic textures. Gold mineralization is associated with marcasite and occurs as electrum and as visible particles within banded quartz veins. Antimony minerals including stibnite and kermesite are commonly identified proximal to and within more anomalous gold zones. Auriferous, banded quartz veins occur and are predominantly easterly dipping and crosscut quartz sulphide altered volcanic strata. The banding texture is derived from multiple stages of fluid transport saturated with silica and sulphides. Commonly, bands of dark sulphides and framboidal marcasite are parallel to the microcrystalline quartz bands.
Six core holes and four RC drill holes were completed at West Wood for a total of 9,520 ft (2,819 m). Mineralization, and to a lesser extent downhole geology, matched closely with the existing model. Step-out drilling to the north (PGR-10-003, 004) indicates a substantial narrowing of the West Wood zone, but the structure continues without significant structural offsetting.
10.2 FACILITIES AREA
The main feature of the revised geologic interpretation of the Facilities area is the existence of a shallowly west-dipping, Miocene volcano-sedimentary sequence, apparently unconformable on and sub-parallel to the underlying Permo-Triassic meta-sedimentary basement. Within the Miocene package, a specific geologic unit of variable thickness is inferred by Larry Martin to host much of the gold mineralization, thereby accounting for its approximately tabular form. This unit, dominated by partly amygdaloidal basaltic andesite and volcaniclastic breccias, was interpreted as a debris flow.
10.3 GEOLOGIC GOLD CONTROLS RECOGNIZED
The Sleeper ore bodies that were mined by Amax were interpreted at that time to be hosted by the Sleeper Rhyolite, stratigraphically above a distinctive basalt marker unit. The contact defines a north and northeast trending complex of grabens and associated gold ore bodies. The host grabens contain second and third order basins (and small, “in-graben” horsts) within the main, mineralized Sleeper zone.
The largest and highest grade ore bodies (Main Sleeper Vein and Wood Vein) are west dipping on the east bounding faults of the Sleeper graben. The West Wood and X-Cal Discovery Breccia are smaller, lower grade and dip vertically or east on interior and west graben bounding faults respectively. In 3-D, gold grades appear to be best along structural intersections of north-west, east- west and north-south faults.
Paramount Gold and Silver Corp. Technical Report – Sleeper Project Page 50
Scott E. Wilson Consulting, Inc. Sleeper Technical Report
11 SAMPLE PREPARATION, ANALYSES AND SECURITY
11.1 SAMPLE METHOD
Only limited descriptions of the sampling and quality-assurance/quality-control (“QA/QC”) procedures followed by AMAX and Placer Dome are available. However, the authors have no reason to believe that these large mining companies did not follow good practice.
The sampling methods and approaches used by X-Cal and New Sleeper on behalf of the Sleeper Joint Venture for surface geochemical samples and drill samples were professionally undertaken and consistent with accepted industry standards. Details of the sampling procedures are included in Thomason, Kornze and Rowe, 2006. The sampling methods and procedures used by Paramount in their 2010 and 2010 drilling campaigns are also considered to be in keeping with industry best practices.
SRK found only limited documentation for sampling method, bagging, security, and transportation practices used by AMAX and Placer Dome. However, summary data sheets and summary reports prepared by these companies, their employees and geological consultants, and the analytical laboratories are available. Review of the summary reports, the sampling done prior to X-Cal appears to have been handled by analytical, geological and engineering employees, and professional mining consultants. It is not unreasonable to expect that these persons used sampling techniques in accordance with industry-accepted protocols. These organizations used accredited commercial laboratories in addition to in-house laboratories.
During the time period of 1994 to early 1997, Barry Smee PhD. headed X-Cal’s exploration programs. Prior to its involvement in the actual Sleeper site, X-Cal had land holdings within near proximity to the Sleeper mine. Multiple exploration campaigns were conducted and quality control and quality assurance appear to have maintained a protocol of procedures in the handling, bagging, transportation, security, preparation, and analysis of exploration samples. Additional exploration programs after 1997 used that early foundation and further developed the procedures into the present quality control and quality assurance programs implemented at the present Sleeper Gold Property.
The sampling and assaying procedures utilized by X-Cal and New Sleeper on behalf of the Sleeper Joint Venture at the Sleeper Gold Project appear to have been professional and consistent with industry practice. Details of the sample preparation, assaying procedures and security are included in Thomason, Kornze and Rowe, 2006. Paramount has, in general, followed the same procedures since 2010.
11.2 PROCEDURES FOR DRILLING AND SAMPLING
The following descriptions of QA/QC procedures were generally adopted beginning with the 2006 drilling program. The procedures as follows were further developed and refined during the 2007 exploration program. The following procedures can be considered as the norm for all drilling conducted since 2006.
Paramount Gold and Silver Corp. Technical Report – Sleeper Project Page 51
Scott E. Wilson Consulting, Inc. Sleeper Technical Report
11.3 POSITIONING DRILL EQUIPMENT
Prior to the drilling programs of 2006, Desert Mountain Surveying of Winnemucca, Nevada, positioned two points located North/South relative to each other. A magnetic correction of 15 % degrees East was found to be the correct magnetic declination for the Sleeper Project during 2006 and 2007.
All drill sites, including core and RCD locations, were positioned and constructed by personnel employed by X-Cal Resources.
All proposed drill sites were located by using hand held GPS positioning devices. Drill hole collars were then surveyed once each hole was completed.
11.4 COLLECTING CORE
Core was collected by a truck mounted Atlas Copco CS3001 core rig capable of drill depths in excess of 2000 feet (610 m). The drill equipment was owned and operated by EMM Core Drilling of Winnemucca, Nevada. Corrugated waxed cardboard core boxes were provided by the core contractor. Wooden blocks or plastic depth indicators were labeled and placed by the core contractors at the appropriate measured drill depths.
Preferred core size was HQ. Adverse drilling conditions preventing advancement of the HQ tools was remedied by casing the hole down to the problem zone. Occasionally a reduction to NQ tools was needed to continue the drill hole to targeted depth.
Core holes drilled in the West Wood target were pre-collared and cased to bedrock (approximately 160-210 feet (49-64 m)) using the RCD rig. Angle and vertical drill hole collar sites were pre- surveyed using a portable GPS positioning device.
Completion of each core hole was preceded by down-hole surveys conducted by International Directional Services of Battle Mountain, Nevada. After the completion of the drill hole and down hole survey the hole was abandoned by pumping a bentonite slurry from the bottom of the drill hole to within 10 feet (3 m) of the surface. The remaining surface plug was ten feet of Portland cement. Desert Mountain Surveying of Winnemucca, Nevada, conducted surface collar surveys for each core hole.
Core boxes filled with core were neatly stacked upon pallets and covered with a tarp at the drill site until the full pallet was transported to the core processing facility. The core was washed, geologically logged and sample intervals selected and labeled by the core geologist.
Drill core were then digitally photographed utilizing scale bars to easily position the exact down hole location within each individual core box. The core boxes were then positioned next to the sheds that contain self-feeding core saws.
Each piece of silicified or hard core was placed in a confinement jig. The maximum length was one foot. The jig positions the core’s central axis producing two nearly exact volumetric halves after the core was cut. One core half was returned to its origin box and the remaining half was placed into a pre-marked
Paramount Gold and Silver Corp. Technical Report – Sleeper Project Page 52
Scott E. Wilson Consulting, Inc. Sleeper Technical Report
16”X19” (40X48 cm) sample bag. The more clay rich core intervals were hand chiseled into halves by the core technician or by a geologist.
The sampling technician independently logged the core sample intervals. Copies of the sample intervals were submitted to the assay lab and a copy was archived into individual core hole folders.
In addition, the folders contain copies of the geologic log, down hole survey, assays, hole abandonment sheets and surface collar surveys.
11.5 REVERSE CIRCULATION DRILLING
The reverse circulation drilling (RC) programs for both late 2006 and 2007 utilized a Schramm 685, capable of drill depths in excess of 2,500 feet (762 m). The Schramm rig was owned and operated by DeLong Drilling and Construction of Winnemucca, Nevada. The crew consisted of one driller and two driller’s helpers. The driller’s helpers had multiple tasks in addition to their mechanical drilling duties which included sample bag numbering (including duplicates), chip tray numbering, sample and chip collection and sample storage at the drill site. All drill hands were responsible for a safe, clean and organized drill site.
The preferred RC drill hole diameter was 5% inches (14.6 cm) produced by a pneumatic hammer and carbide button bit. If water volumes exceeded capacities that prevented the advancement of the hammer tool or adverse conditions warranted the use of a tricone tool the hammer tool was tripped out of the hole and the appropriate tri-cone diameter was returned to the bottom of the hole. Occasionally a reduction to a smaller diameter of tri-cone was needed to complete the proposed drill hole.
RC samples were collected from the surface every 5 feet (1.5 m). Duplicate samples were collected from the rotary splitter every 150 feet (45.7 m).
The rotary wet splitter (splitter) was attached to the rear passenger side of the Schramm. The splitter was washed down after each completed drill hole. Once surface casing was completed, water and on demand drilling mud and hole conditioners were injected to suppress silica dust exposure and maintain the integrity of the drill hole.
The splitter had removable pie shaped platelets that are removed or added to maintain a consistent 20:1 volumetric split product at the exit end of the sample collection port. The sample exited the port straight downward into a 5 gallon (20 lt) plastic bucket. Once the 5 feet (1.5 m) drill interval was completed, another clean bucket was placed under the exit port. The sample bucket was poured into a pre-labeled 15”X17” (38X43 cm) sample bag. The sample bucket was rinsed once with fresh water and contents poured into the sample bag. The bag was tied and placed into a collection crib or crate that was provided to the project by American Assay. The crib provided an additional assurance against contamination by ground exposure. The duplicates, taken every 150 feet,(45.7 m) were collected by similar procedure and placed upon a black plastic sheet for drill site storage.
Drill rod changes have long been suspect for down-the hole-contamination during RCD drilling on other projects. At Sleeper, the end of the 20 feet (6 m) drill rod cycle was used to ream, clean and dress the
Paramount Gold and Silver Corp. Technical Report – Sleeper Project Page 53
Scott E. Wilson Consulting, Inc. Sleeper Technical Report
walls of the last 20 feet drilled. The process was considered vital in maintaining a clean drill hole. Once the new rod for the next 20 feet was positioned, the rotation was started and down the hole pressures and water levels were allowed to stabilize. A screen was placed at the exit of the splitter and checked for debris that may have its origin from up hole. The sample bucket was re- positioned under the sample port only after the driller observed a clean return in the screen. This method took additional time, has proven to be a very effective method in minimizing down the hole contamination.
Completion of each RCD hole was preceded by down hole surveys conducted by International Directional Services of Battle Mountain, Nevada. After the completion of the drill hole and down hole survey, the hole was abandoned by pumping a bentonite slurry from the bottom of the drill hole to within 10 feet (3 m) of the surface. The remaining surface plug was ten feet of Portland cement. Desert Mountain Surveying of Winnemucca, Nevada, conducted surface collar surveys for each RCD and core hole.
Compartmental chip trays (20 compartments) were used to archive drilled material from each 5 feet (1.5 m) of drill advancement. Each compartment’s content was prewashed prior to filling the compartment with the aid of a fitted funnel. The process minimizes any contamination from other 5 foot (1.5 m) samples.
All chip tray intervals were reviewed by at least one geologist and logged for geologic attributes. The chip trays were archived by drill hole number and placed upon steel shelves located in closed buildings for later additional reviewing.
11.6 PARAMOUNT 2010-2011 DRILL PROGRAMME
The drilling tubes provided by both drill contractors were in imperial measurements (feet). The sampling procedure of previous drill campaigns under New Sleeper Gold LLC was the template for the completed Paramount drilling campaign.
Drill samples generated at the drill rigs were transported to the onsite logging facility and stored inside a locked building. At no time, prior to surrendering control of the samples to representatives of the assaying company, were the samples handled by anyone other than the drilling contractors or the geologists onsite.
Because the program included both an RVC and core rig, there are some differences in sampling protocol.
Core Sample Length
The 2010-2011 drill core were sawn in half longitudinally into primarily 5-foot-long (1.5 m) samples, which were then shipped off site where they were assayed for gold, silver, and other metals. The range of sample length was generally capped at five feet, with a minimum sample length of 2.5 feet (0.75 m). In the West Wood area minor amounts of core were drilled which represent overburden above the bedrock; these intervals are not representative of the mineralization and geology of the host rock, and
Paramount Gold and Silver Corp. Technical Report – Sleeper Project Page 54
Scott E. Wilson Consulting, Inc. Sleeper Technical Report
therefore, were not shipped for assay. Approximately 96% of the drill holes used HQ drilling tools and the remainder, NQ tools.
RVC Sample Length
The RVC campaign utilized 10-foot and 20-foot (3m and 6 m) sections of drill steel. All assayed samples from the RVC drill were in 5 foot (1.5 m) intervals. Flagging and paint marks were set on the drilling derrick to help with accuracy.
Drilling Conditions
Drilling conditions vary widely throughout the property. While generally absent in the Facilities area, overburden in the West Wood area is composed of up to 200 feet (61 m) of unconsolidated sand and gravel. Care was exercised when drilling the overburden section of the West Wood area, although no sections of overburden were included in material to be assayed.
Sample Quality and Procedure
To ensure the quality and reproducibility of assay results, check samples were inserted into the assay stream. For the core program, a random duplicate sample was inserted every 40 samples. Every 20 samples either a blank or a standard sample was inserted in the sample stream.
The RVC drill rig was working on a 24-hour, round the clock basis. To ensure that there were no problems inserting blanks and standard assay samples into the sample stream while no geologist was present, it was decided to only have duplicate samples associated with the RVC sample stream. As with the core program, duplicate samples were inserted randomly into every 40 contiguous samples of the RVC sample stream. This program was based upon the check sample protocol developed during the drilling campaigns completed under previous owners of the project.
11.7 SAMPLE CONTROL PROCEDURES
SRK found only limited documentation for sample preparation, bagging, security, and transportation practices used by AMAX and Placer Dome. However, summary data sheets and summary reports prepared by these companies, their employees and geological consultants and the analytical laboratories are available. Review of the summary reports indicates that the sampling done prior to X-Cal appears to have been handled by analytical, geological and engineering employees and professional mining consultants. It is not unreasonable to expect that these persons used sampling techniques in accordance with industry-accepted protocols. These organizations used accredited commercial laboratories in addition to in-house laboratories.
During the time period of 1994 to early 1997, Barry Smee PhD., headed X-Cal’s exploration programs and was responsible for the sample security, preparation and chemical analyses procedures. Prior to its involvement in the actual Sleeper site, X-Cal had land holdings within near proximity to the Sleeper mine. Multiple exploration campaigns were conducted and quality control and quality assurance appear to have maintained a protocol of procedures in the handling, bagging, transportation, security, preparation, and analysis of exploration samples. Additional exploration programs after 1997 used the
Paramount Gold and Silver Corp. Technical Report – Sleeper Project Page 55
Scott E. Wilson Consulting, Inc. Sleeper Technical Report
early foundation procedures of 1994 - 1997 and further developed them into the quality control and quality assurance programs implemented at the Sleeper Gold Property since that period.
The sampling and assaying procedures utilized by X-Cal, New Sleeper Gold and now Paramount, appear to have been professional and consistent with industry practice. Details of the sample preparation, assaying procedures and security are included in Thomason, Kornze and Rowe, 2006.
The following descriptions of QA/QC procedures were generally adopted from the 2006 drilling program. The procedures as follows were further developed and refined during the 2007 exploration program.
11.8 ASSAY SUBMITTAL FOR CORE AND RCD
American Assay Laboratories picked up the sample shipments near the end of a 10-day drilling shift. Predominantly, one drill hole was placed in the shipping container. If additional room was needed to ship a few samples from another drill hole, a plastic liner separated the two sample sets. This procedure helped the lab personnel sort the core or RCD samples according to drill hole.
Duplicate RCD samples were collected from every drill hole on 150 foot (45.7 m) increments. The duplicate RCD samples were temporarily stored on plastic liners near the geology office. The duplicate samples for each individual drill hole once air-dried were placed in larger shipping bags labeled with drill hole numbers and intervals. The duplicate samples were stored at the Sleeper mine site until a shipment quantity “batch” would be ready for transport. The samples were hand delivered by Sleeper personnel to the ALS Chemex’s preparation facilities located in Winnemucca, Nevada. Assay submittal sheets and standards accompanied the samples and copies of the submittals were retained by X-Cal for archive.
11.9 DUPLICATE SAMPLES AND REFERENCE MATERIALS
Duplicate samples were collected at the RCD rig every 150 feet (45.7 m).Duplicate samples of specific core intervals were selected from sample rejects after the principle lab preparation and assays were completed. Commercial standards of various gold concentrations (pre-packaged pulps) were introduced into the analytical lab’s sample stream at the pulp stage.
11.10 SECURITY
Prior to completion of an RCD hole, the chip trays were stored and secured by the drillers at the rig site after drilling hours. All chip trays were collected after completion of each specific RCD hole. Note: The fenced compound was locked after day shift ends and remained locked until day shift resumed the following day. During the day period the electric gate was unlocked and accessible to entry only through Sleeper personnel.
Core boxes filled with core were neatly stacked upon pallets and tarped at the drill site until the full pallet was transported to the core processing facility. The core was washed, geologically logged and sample intervals selected and labeled by the core geologist. All core boxes were then stored on shelves in the locked core storage facility on site. Paramount is following this same procedure for securing RCD and core samples.
Paramount Gold and Silver Corp. Technical Report – Sleeper Project Page 56
Scott E. Wilson Consulting, Inc. Sleeper Technical Report
11.11 SPECIFIC GRAVITY DATA
The densities used in the SRK block model are average values of units grouped by lithology and mineral zone, beginning with a default value of 2.4 gm/cc. These densities are based on analyses done on diamond drill core. This distribution of density by group is shown as follows:
• Lithology 1 = 2.23 • Lithology 2 = 2.62 • Mineral Zone 1 and Lithology 3 = 2.19 • Mineral Zone 3 and Lithology 3 = 2.33 • Mineral Zone 1 and Lithology 4 = 2.31 • Mineral Zone 3 and Lithology 4 = 2.42 • Lithology 6 = 2.32 • Lithology 7 = 2.30 • Lithology 3 without Mineral Zone = 2.30 • Lithology 4 without Mineral Zone = 2.35
For the density sampling and testing program carried out by X-Cal, samples of cut core (HQ) were measured for specific gravity by using ASTM International Designation: C97-02 as a guide to methodology. Testing was carried out at the American Assay Laboratory in Reno, Nevada.
Specific samples were pre-selected to test the various rock types and alteration identified in the Facilities Area and West Wood Area. The samples were obtained from intact core that had been sawed in half (lengthwise) for analytical analysis. The rock types varied from debris flow, crystal tuff, lithic tuff, volcanic sediments to meta-sedimentary rocks. Alteration phases included silicified breccias, whole rock silicification, potassic alteration (bleached silicic alteration) and partially clay- altered specimens. The sample sets of half core measured at the Sleeper site did not include samples of advanced argillic alteration (whole rock to clay alteration) due to procedural protocol that required soaking of the test sample in distilled water. The test samples of advanced argillic alteration fell apart and were compromised.
The half core specimens selected for specific gravity measurements were described by specific geologic attributes including alteration, lithology and oxidation state. Each individual sample was labeled with its origin on a smooth surface using indelible ink. The label identifying each sample included specific drill hole number and drill depth interval. The labeled samples were placed in plastic core boxes for storage and archive purposes. Prior to measurement sample sets each containing twenty specimens were place in a portable drying oven for 12 hours set at 105 degrees F. Note that the samples were half core and had been air-drying for a minimum of 30 days prior to oven drying process. A longer oven time interval was tested and 12 hours was found adequate for the minimum drying time that produced successive weight readings with the same weight. The dried specimens were returned to their appropriate core box and stored in a closed room until scheduled for testing.
Paramount Gold and Silver Corp. Technical Report – Sleeper Project Page 57
Scott E. Wilson Consulting, Inc. Sleeper Technical Report
The dried samples were weighed using an electronic digital scale specifically purchased and dedicated to the specific gravity testing task. The dry weight (measured in grams to nearest tenth of a gram) for each specific sample was recorded and the scale’s calibration reset entered after each measurement. The sample sets were measured in lots containing 20 samples. After ten samples of a lot were measured the first sample of that lot was weighed again to confirm the weight measurement. After the last sample of the lot (number 20) was weighed and recorded, the number 10 sample was re-selected and weighed again to assure consistency.
The samples were then carefully immersed in distilled water contained in clean five gallon buckets for 30 minutes. A longer immersion time was tested (up to two hours) and weight measurements collected at 30 minutes, 90 minutes and 120 minutes were the same. It was concluded that 30 minutes was found to be the minimum time to allow the sample to adsorb the distilled water.
After 30 minutes in distilled water the samples were carefully removed and placed on towels for damp dry and surface dried by paper towels. Each specific sample in the twenty (20) sample lot was weighed and its wet weight (measured in grams to nearest tenth of a gram) recorded as per the same procedure as dry weight were collected.
Each sample is fully immersed in the distilled water and air bubbles removed from the basket and specimen. The basket is allowed to stabilize to a static state and the specimen’s submerged weight (measured in grams to nearest tenth of a gram) is recorded. The same QA/QC procedure for the dry weight lot measurement is used weighing submerged samples. Sample numbers 1 and 10 of the
submerged lots are weighed again and the calibration reset after each specimen’s weight procedure is completed.
Paramount Gold and Silver Corp. Technical Report – Sleeper Project Page 58
Scott E. Wilson Consulting, Inc. Sleeper Technical Report
12 DATA VERIFICATION
12.1 AMAX DATA
In mid-May 1997, Mineral Resources development Inc. (MRDI) was retained by X-Cal to assist in the evaluation of in-situ resources of the Sleeper deposit, monitor a program to obtain samples of material from the existing leach heaps and Mill Tailings from the impoundment area, establish and supervise laboratory metallurgical testing programs on samples of heap leach material and mill tailings and to evaluate the condition of the existing process plant facilities. The results of MRDI ‘s work was presented in three separate and standalone reports. The titles of these three reports are as follows: “Modeling and Resource Estimation of the Facility, Saddle, West Wood and Silica Cap Areas”, “Sampling and Metallurgical Evaluation of Existing Leach Heaps and Mill Tailings”, and “Evaluation of Existing Process Plant Facilities”. The resource model was completed in mid-August, 1997 (MRDI, 1997, Sampling and Metallurgical Evaluation of Existing Leach Heaps and Mill Tailings, Sleeper Gold Property).
During the 1997 study, MRDI selected 2,725 drill holes from a database of 3,732 drill holes. Using the project database MRDI selected five percent of the drill holes to verify collar coordinates down- hole surveys, geological logs and assay data.
The following is a summary of conclusions by MRDI:
Collar coordinates for early drill holes by Amax were difficult to verify and many of the original survey sheets were filed by date and not by specific drill hole. Later drilling by Amax and drilling by Placer Dome and X-Cal, the collar information (including azimuth and dip) was found to be reasonable.
The bulk of the reverse circulation drill holes by Amax were not surveyed down hole. All core holes were surveyed down-hole. MRDI checked all drill holes that were surveyed down-hole and found that there was no entry or data transfer errors from the original survey records.
Overall, MRDI found that the error rate in the assay database is very low at 0.1 percent (10 errors out of 15,588 records), which is well within industry standards (MRDI, 1997 Modeling and Resource Estimation of the Facility, Saddle, West Wood and Silica Cap Areas).
Larry G. Martin, CPG, who logged many of the X-Cal drill holes, provided MRDI with a detailed description of the protocol used by both X-Cal and New Sleeper Gold prior to and during the Sleeper Joint Venture for sample handling, sample preparation, assaying, check assaying and umpire assaying. These procedures and the chain of custody used were found to be satisfactory and SRK is in agreement with this conclusion.
SRK is of the opinion that the pre-2007 data available can be used in the continuing evaluation of the property. A large digital database is available for the Sleeper Gold Property.
Paramount Gold and Silver Corp. Technical Report – Sleeper Project Page 59
Scott E. Wilson Consulting, Inc. Sleeper Technical Report
12.2 2007 ASSAY QUALITY CONTROL PROGRAMME
The assay quality control program used during 2007 called for the inclusion of duplicate samples, insertion of reference samples (standards), and regular submission of samples to a second laboratory for check analyses. The principal laboratory was American Assay Laboratories (AAL) in Reno, Nevada and the check laboratory was ALS-Chemex (ALS) in Reno, Nevada.
Prior to submitting samples to AAL, X-Cal had a stipulation protocol that drill samples submitted for assay would require an automatic check assay by AAL if gold values reported were greater than 3 grams and or silver values were greater than 60 grams. In addition, drill intervals that were inspected by the supervisory geologist and visually contained geologic features that accompany higher-grade mineralization, including but not limited to banded veins, dark sulphide bearing breccias, antimony sulphides or visible gold were reported to the lab prior to assay analysis. The principle lab preps the indicated higher-grade zone. Between each of the individual samples that have been highlighted by the supervisory geologist, 5 feet (1.5 m) for RCD and 2 % feet for core, a barren silica sand flush was used to clean the grinding equipment.
A total of 565 samples were assayed as check samples (565 samples to AAL and 565 duplicates to ALS). The standards inserted into the sample stream totaled 359. Results of the assay quality control program show generally acceptable gold assaying. For future drilling programs, additional check assaying is recommended.
12.3 FIELD DUPLICATES
For the 2007 program, field duplicates were collected while drilling for the reverse circulation drill holes. Core duplicates were collected from processed core rejects that were returned to the Sleeper mine site by the principle laboratory (AAL) and then the same reject was sent to the secondary lab (ALS) for check analysis.
Although there are relatively few of these duplicate samples, the results show good agreement with no obvious bias.
12.4 REFERENCE SAMPLES
All reference samples used during 2007 were from Rocklabs of New Zealand. A total of nine reference samples were used during the period: seven are/were commercially available from Rocklabs. Standards Pa4 and Pa5 appear to be a special custom order from Rocklabs and were not characterized as their commercially available standards. Given that only five samples were assayed at one lab for characterization of these two standards, the accepted limits were set at +/- 10% of the expected values.
The gold results for the reference samples are generally acceptable with the calculated means within the acceptance limits. The most used reference samples show a slight low (-3% to -7%) bias for grades between 0.5 and 5 ppm Au. Below and above this range the results show a slight high bias. Many anomalous reports have had check analyses at a second laboratory (see below). Additional check assaying is recommended for reports with significant mineralization and anomalous standard results.
Paramount Gold and Silver Corp. Technical Report – Sleeper Project Page 60
Scott E. Wilson Consulting, Inc. Sleeper Technical Report
12.5 ASSAY SUBMITTAL FOR CORE AND RCD
American Assay Laboratories were scheduled to pick up the sample containers near the end of a 10- day drilling shift. Predominantly one drill hole was placed in the shipping crib. If additional crib room was needed to ship a few samples from another drill hole, a plastic liner separates the two sample sets. This procedure helps the lab personnel sort the core or RCD samples after delivery to the Sparks, Nevada preparation facilities and prevents co-mingling of drill holes located in different target areas. Duplicate RCD samples were collected from every drill hole on 150 feet increments. The duplicate RCD samples were temporarily stored on plastic liners near at the geology office. The duplicate samples for each individual drill hole once air-dried were placed in larger shipping bags labeled with drill hole numbers and intervals. The duplicate samples were stored at the Sleeper mine site until a shipment quantity.
The samples in each batch were delivered by Sleeper personnel to the ALS Chemex’s preparation facilities located in Winnemucca, Nevada. Assay submittal sheets and standards accompanied the samples and copies of the submittals were retained by X-Cal for archive.
12.6 SRK DATA VERIFICATION
While on site during May, 2011, SRK personnel from the SRK Reno, Nevada office and from the Santiago, Chile SRK office, conducted a review of on-site available data. The mine office from the AMAX and X-Cal period is kept locked and secured. All original data such as drill hole logs, plans and sections, lab analyses certificates and records of drill hole collar surveys and down the hole surveys is kept in this office. Certain records such as lab certificates and collar surveys have been copied by Paramount personnel and those copies are in Paramount’s office in Winnemucca, Nevada.
SRK searched through the data at the mine office and found that most original information appears to be intact. SRK would recommend, however, that Paramount take the time to inventory this information as it is a wealth of data for not only the history of the project during its operation, but also information of other exploration targets on the Sleeper property are carefully detailed and may add significant value to the project as a whole.
SRK also reviewed the QA/QC program used by X-Cal starting in 2003. The following are the observations on the X-Cal and Paramount QA/QC program from 2003 through May, 2011.
In the 2003 drill program, American Assay Laboratory (AAL) check assay results are systematically higher than original assays from ALS Chemex. A roasting procedure dramatically increases Au-FA results from both labs. Overall, control sample results are high quality.
In the 2004 drill program, all control samples, except one, have results in the acceptable ranges.
In the 2005 program, no X-Cal QA/QC results report is included for this data set. SRK took the original data and made plots of Au and Ag results for all the control samples. There are 94 SRM samples and 12 blanks with data, in the set of 1834 RC and 743 drill core samples. Of the 2684 unique drill or SRM samples, 106 of them (3.9%) are SRM. This ratio is within the industry standard of 1 SRM per 20 to 30 drilling samples, 3.3-5%.
Paramount Gold and Silver Corp. Technical Report – Sleeper Project Page 61
Scott E. Wilson Consulting, Inc. Sleeper Technical Report
Each standard has a certified value and associated standard deviation for gold. Only Standard 8 has a certified silver value. For the rest of the silver results, mean and standard deviation were calculated from the data set for all samples, and with outliers excluded if they were very different from the rest of the data set. In these cases, the mean and standard deviation of the data set without outliers was plotted and the results analyzed.
In the SRM results, there is a lot of variance, but a high or low bias is not apparent. Of the 94 certified SRM samples, 8 had masses greater than 3kg when checked in at the lab. Most of these samples have anomalous gold values. These samples may actually be drillhole samples that were labeled incorrectly, which would explain why most of the SRM outside of the acceptable range are much lower than the certified value. Three blanks and 8 SRM have values greater than the mean plus 2 standard deviations. More samples than that have gold values less than the mean minus 2 standard deviations, so a low bias in gold results is possible, even if the anomalously low gold values are not considered.
Silver values are considered qualitatively, because there is a lot of variation, and only one SRM of five has a certified silver value.
Two RC holes have 8 field duplicates - 6 from SD-02-05 and 2 from BCP-08-05. Duplicate samples are designated in the Type field, but do not have “from” or “to” values to pair them with the original. It appears that check assays were not done at a second lab.
In the 2007 program, the X-Cal report for this program is unfinished. However, it was noted that results for Standard Reference Material (SRM) samples are often biased high or low. A procedure for field and drilling QA/QC is included in the X-Cal report.
In the 2010 program, control sample results are within acceptable ranges, with few exceptions. All industry standards were followed and met, except it appears that no check assays were submitted to an outside lab.
While the overall sample and analysis QA/QC program between 2003 and 2010 is generally acceptable, there are some exceptions as noted above. In particular, it seems that in many cases duplicate coarse reject samples were not analyzed, and check assays were not consistently performed at another lab. SRK strongly recommends that Paramount review its current QA/QC follow up procedures to ensure that industry best practices are consistently followed in regard to controls on analysis so that corrections can be made before the program is completed.
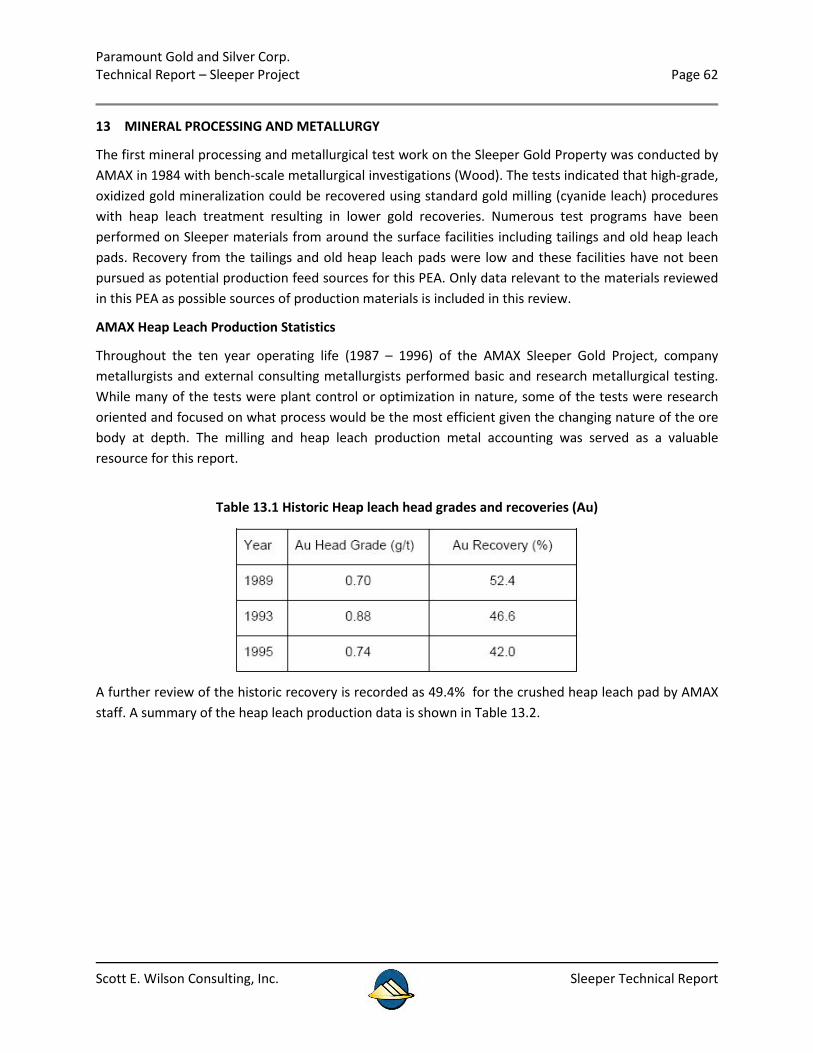
Paramount Gold and Silver Corp. Technical Report – Sleeper Project Page 62
Scott E. Wilson Consulting, Inc. Sleeper Technical Report
13 MINERAL PROCESSING AND METALLURGY
The first mineral processing and metallurgical test work on the Sleeper Gold Property was conducted by AMAX in 1984 with bench-scale metallurgical investigations (Wood). The tests indicated that high-grade, oxidized gold mineralization could be recovered using standard gold milling (cyanide leach) procedures with heap leach treatment resulting in lower gold recoveries. Numerous test programs have been performed on Sleeper materials from around the surface facilities including tailings and old heap leach pads. Recovery from the tailings and old heap leach pads were low and these facilities have not been pursued as potential production feed sources for this PEA. Only data relevant to the materials reviewed in this PEA as possible sources of production materials is included in this review.
AMAX Heap Leach Production Statistics
Throughout the ten year operating life (1987 – 1996) of the AMAX Sleeper Gold Project, company metallurgists and external consulting metallurgists performed basic and research metallurgical testing. While many of the tests were plant control or optimization in nature, some of the tests were research oriented and focused on what process would be the most efficient given the changing nature of the ore body at depth. The milling and heap leach production metal accounting was served as a valuable resource for this report.
Table 13.1 Historic Heap leach head grades and recoveries (Au)
A further review of the historic recovery is recorded as 49.4% for the crushed heap leach pad by AMAX staff. A summary of the heap leach production data is shown in Table 13.2.
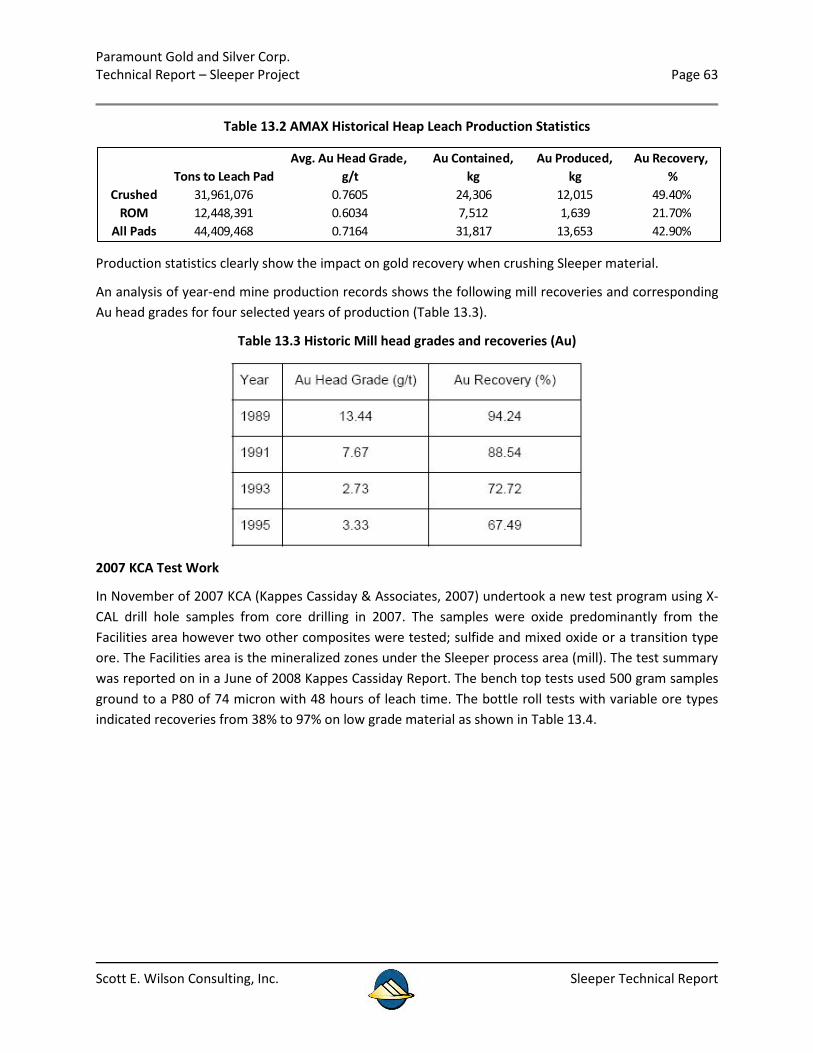
Paramount Gold and Silver Corp. Technical Report – Sleeper Project Page 63
Scott E. Wilson Consulting, Inc. Sleeper Technical Report
Table 13.2 AMAX Historical Heap Leach Production Statistics
Production statistics clearly show the impact on gold recovery when crushing Sleeper material.
An analysis of year-end mine production records shows the following mill recoveries and corresponding Au head grades for four selected years of production (Table 13.3).
Table 13.3 Historic Mill head grades and recoveries (Au)
2007 KCA Test Work
In November of 2007 KCA (Kappes Cassiday & Associates, 2007) undertook a new test program using X-CAL drill hole samples from core drilling in 2007. The samples were oxide predominantly from the Facilities area however two other composites were tested; sulfide and mixed oxide or a transition type ore. The Facilities area is the mineralized zones under the Sleeper process area (mill). The test summary was reported on in a June of 2008 Kappes Cassiday Report. The bench top tests used 500 gram samples ground to a P80 of 74 micron with 48 hours of leach time. The bottle roll tests with variable ore types indicated recoveries from 38% to 97% on low grade material as shown in Table 13.4.
Tons to Leach PadAvg. Au Head Grade,
g/tAu Contained,
kgAu Produced,
kgAu Recovery,
%Crushed 31,961,076 0.7605 24,306 12,015 49.40%
ROM 12,448,391 0.6034 7,512 1,639 21.70%All Pads 44,409,468 0.7164 31,817 13,653 42.90%
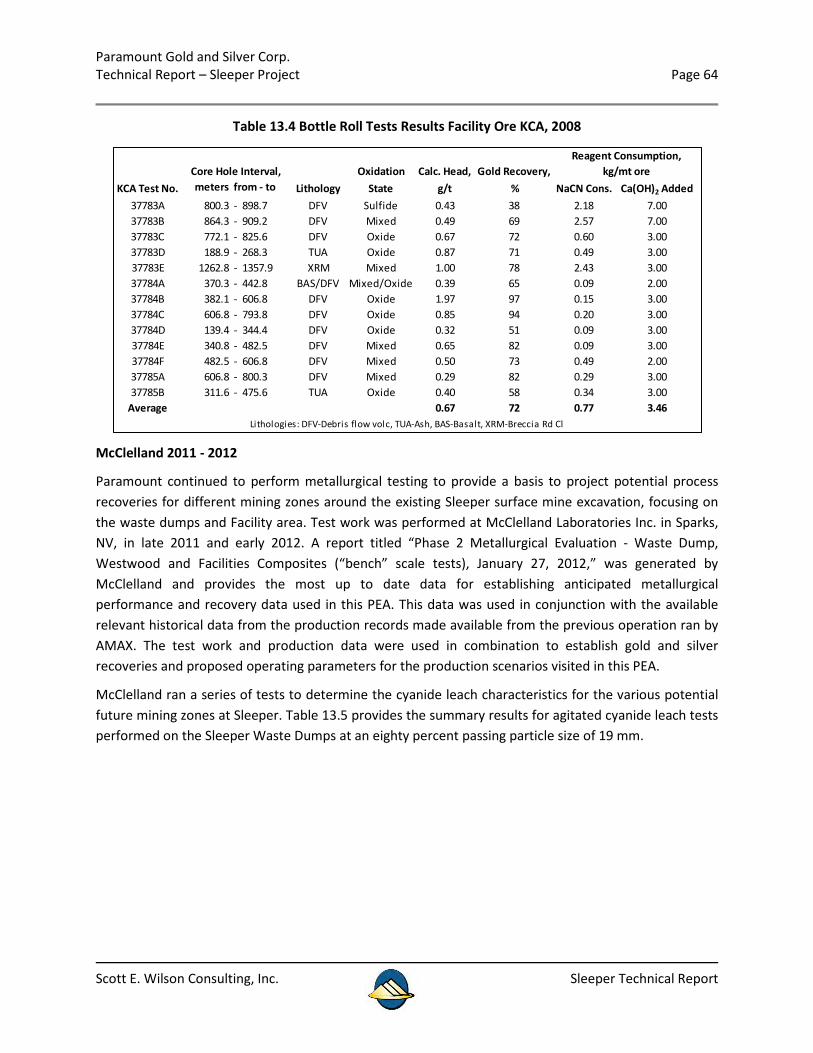
Paramount Gold and Silver Corp. Technical Report – Sleeper Project Page 64
Scott E. Wilson Consulting, Inc. Sleeper Technical Report
Table 13.4 Bottle Roll Tests Results Facility Ore KCA, 2008
McClelland 2011 - 2012
Paramount continued to perform metallurgical testing to provide a basis to project potential process recoveries for different mining zones around the existing Sleeper surface mine excavation, focusing on the waste dumps and Facility area. Test work was performed at McClelland Laboratories Inc. in Sparks, NV, in late 2011 and early 2012. A report titled “Phase 2 Metallurgical Evaluation - Waste Dump, Westwood and Facilities Composites (“bench” scale tests), January 27, 2012,” was generated by McClelland and provides the most up to date data for establishing anticipated metallurgical performance and recovery data used in this PEA. This data was used in conjunction with the available relevant historical data from the production records made available from the previous operation ran by AMAX. The test work and production data were used in combination to establish gold and silver recoveries and proposed operating parameters for the production scenarios visited in this PEA.
McClelland ran a series of tests to determine the cyanide leach characteristics for the various potential future mining zones at Sleeper. Table 13.5 provides the summary results for agitated cyanide leach tests performed on the Sleeper Waste Dumps at an eighty percent passing particle size of 19 mm.
Core Hole Interval, Oxidation Calc. Head, Gold Recovery,KCA Test No. meters from - to Lithology State g/t % NaCN Cons. Ca(OH)2 Added
37783A 800.3 - 898.7 DFV Sulfide 0.43 38 2.18 7.0037783B 864.3 - 909.2 DFV Mixed 0.49 69 2.57 7.0037783C 772.1 - 825.6 DFV Oxide 0.67 72 0.60 3.0037783D 188.9 - 268.3 TUA Oxide 0.87 71 0.49 3.0037783E 1262.8 - 1357.9 XRM Mixed 1.00 78 2.43 3.0037784A 370.3 - 442.8 BAS/DFV Mixed/Oxide 0.39 65 0.09 2.0037784B 382.1 - 606.8 DFV Oxide 1.97 97 0.15 3.0037784C 606.8 - 793.8 DFV Oxide 0.85 94 0.20 3.0037784D 139.4 - 344.4 DFV Oxide 0.32 51 0.09 3.0037784E 340.8 - 482.5 DFV Mixed 0.65 82 0.09 3.0037784F 482.5 - 606.8 DFV Mixed 0.50 73 0.49 2.0037785A 606.8 - 800.3 DFV Mixed 0.29 82 0.29 3.0037785B 311.6 - 475.6 TUA Oxide 0.40 58 0.34 3.00
Average 0.67 72 0.77 3.46
kg/mt oreReagent Consumption,
Lithologies: DFV-Debris flow volc, TUA-Ash, BAS-Basalt, XRM-Breccia Rd Cl
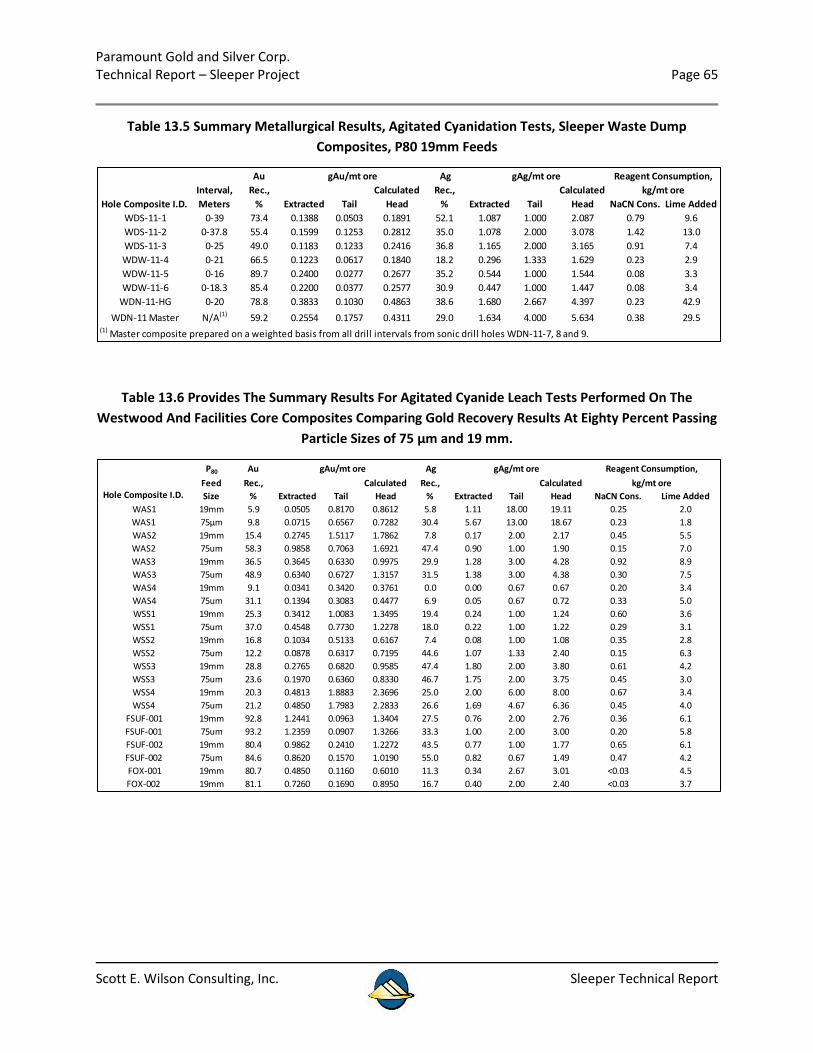
Paramount Gold and Silver Corp. Technical Report – Sleeper Project Page 65
Scott E. Wilson Consulting, Inc. Sleeper Technical Report
Table 13.5 Summary Metallurgical Results, Agitated Cyanidation Tests, Sleeper Waste Dump Composites, P80 19mm Feeds
Table 13.6 Provides The Summary Results For Agitated Cyanide Leach Tests Performed On The Westwood And Facilities Core Composites Comparing Gold Recovery Results At Eighty Percent Passing
Particle Sizes of 75 µm and 19 mm.
Au AgInterval, Rec., Calculated Rec., CalculatedMeters % Extracted Tail Head % Extracted Tail Head NaCN Cons. Lime Added
WDS-11-1 0-39 73.4 0.1388 0.0503 0.1891 52.1 1.087 1.000 2.087 0.79 9.6WDS-11-2 0-37.8 55.4 0.1599 0.1253 0.2812 35.0 1.078 2.000 3.078 1.42 13.0WDS-11-3 0-25 49.0 0.1183 0.1233 0.2416 36.8 1.165 2.000 3.165 0.91 7.4WDW-11-4 0-21 66.5 0.1223 0.0617 0.1840 18.2 0.296 1.333 1.629 0.23 2.9WDW-11-5 0-16 89.7 0.2400 0.0277 0.2677 35.2 0.544 1.000 1.544 0.08 3.3WDW-11-6 0-18.3 85.4 0.2200 0.0377 0.2577 30.9 0.447 1.000 1.447 0.08 3.4
WDN-11-HG 0-20 78.8 0.3833 0.1030 0.4863 38.6 1.680 2.667 4.397 0.23 42.9WDN-11 Master N/A(1) 59.2 0.2554 0.1757 0.4311 29.0 1.634 4.000 5.634 0.38 29.5
(1) Master composite prepared on a weighted basis from all drill intervals from sonic drill holes WDN-11-7, 8 and 9.
Reagent Consumption,gAg/mt ore gAu/mt orekg/mt ore
Hole Composite I.D.
P80 Au AgFeed Rec., Calculated Rec., CalculatedSize % Extracted Tail Head % Extracted Tail Head NaCN Cons. Lime Added
WAS1 19mm 5.9 0.0505 0.8170 0.8612 5.8 1.11 18.00 19.11 0.25 2.0WAS1 75µm 9.8 0.0715 0.6567 0.7282 30.4 5.67 13.00 18.67 0.23 1.8WAS2 19mm 15.4 0.2745 1.5117 1.7862 7.8 0.17 2.00 2.17 0.45 5.5WAS2 75um 58.3 0.9858 0.7063 1.6921 47.4 0.90 1.00 1.90 0.15 7.0WAS3 19mm 36.5 0.3645 0.6330 0.9975 29.9 1.28 3.00 4.28 0.92 8.9WAS3 75um 48.9 0.6340 0.6727 1.3157 31.5 1.38 3.00 4.38 0.30 7.5WAS4 19mm 9.1 0.0341 0.3420 0.3761 0.0 0.00 0.67 0.67 0.20 3.4WAS4 75um 31.1 0.1394 0.3083 0.4477 6.9 0.05 0.67 0.72 0.33 5.0WSS1 19mm 25.3 0.3412 1.0083 1.3495 19.4 0.24 1.00 1.24 0.60 3.6WSS1 75um 37.0 0.4548 0.7730 1.2278 18.0 0.22 1.00 1.22 0.29 3.1WSS2 19mm 16.8 0.1034 0.5133 0.6167 7.4 0.08 1.00 1.08 0.35 2.8WSS2 75um 12.2 0.0878 0.6317 0.7195 44.6 1.07 1.33 2.40 0.15 6.3WSS3 19mm 28.8 0.2765 0.6820 0.9585 47.4 1.80 2.00 3.80 0.61 4.2WSS3 75um 23.6 0.1970 0.6360 0.8330 46.7 1.75 2.00 3.75 0.45 3.0WSS4 19mm 20.3 0.4813 1.8883 2.3696 25.0 2.00 6.00 8.00 0.67 3.4WSS4 75um 21.2 0.4850 1.7983 2.2833 26.6 1.69 4.67 6.36 0.45 4.0
FSUF-001 19mm 92.8 1.2441 0.0963 1.3404 27.5 0.76 2.00 2.76 0.36 6.1FSUF-001 75um 93.2 1.2359 0.0907 1.3266 33.3 1.00 2.00 3.00 0.20 5.8FSUF-002 19mm 80.4 0.9862 0.2410 1.2272 43.5 0.77 1.00 1.77 0.65 6.1FSUF-002 75um 84.6 0.8620 0.1570 1.0190 55.0 0.82 0.67 1.49 0.47 4.2FOX-001 19mm 80.7 0.4850 0.1160 0.6010 11.3 0.34 2.67 3.01 <0.03 4.5FOX-002 19mm 81.1 0.7260 0.1690 0.8950 16.7 0.40 2.00 2.40 <0.03 3.7
Hole Composite I.D.
gAu/mt ore gAg/mt ore Reagent Consumption,kg/mt ore
80 80
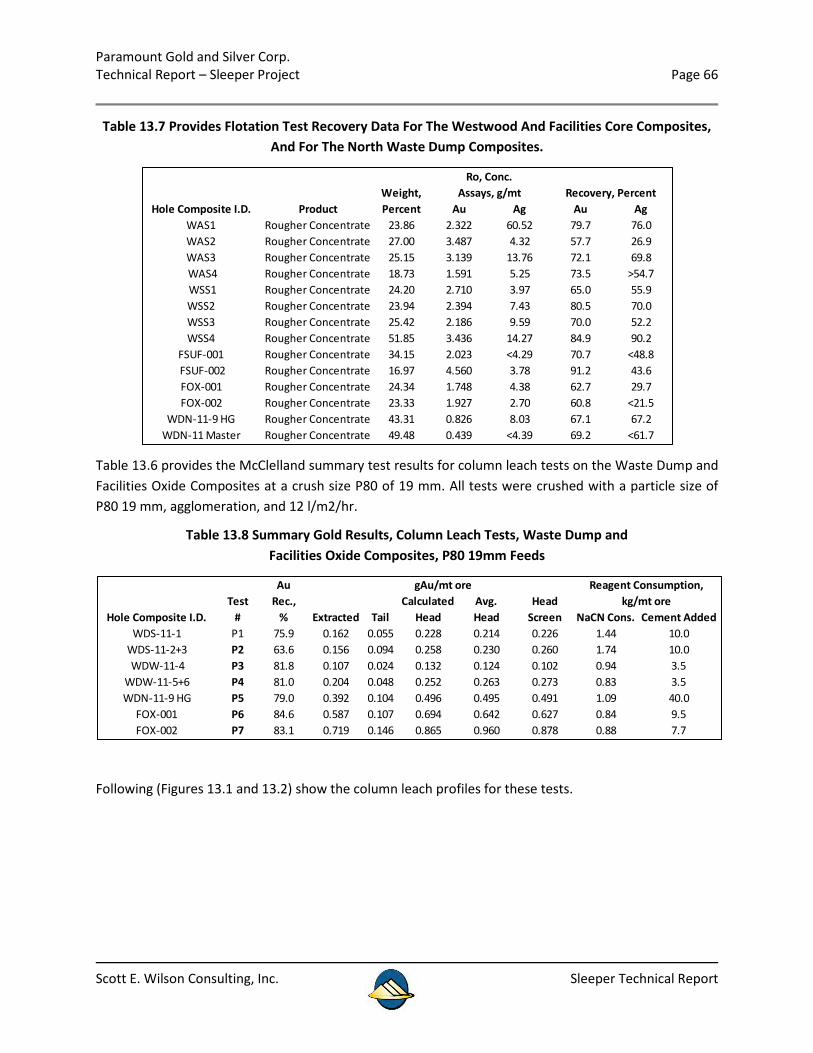
Paramount Gold and Silver Corp. Technical Report – Sleeper Project Page 66
Scott E. Wilson Consulting, Inc. Sleeper Technical Report
Table 13.7 Provides Flotation Test Recovery Data For The Westwood And Facilities Core Composites, And For The North Waste Dump Composites.
Table 13.6 provides the McClelland summary test results for column leach tests on the Waste Dump and Facilities Oxide Composites at a crush size P80 of 19 mm. All tests were crushed with a particle size of P80 19 mm, agglomeration, and 12 l/m2/hr.
Table 13.8 Summary Gold Results, Column Leach Tests, Waste Dump and Facilities Oxide Composites, P80 19mm Feeds
Following (Figures 13.1 and 13.2) show the column leach profiles for these tests.
Weight,Product Percent Au Ag Au Ag
WAS1 Rougher Concentrate 23.86 2.322 60.52 79.7 76.0WAS2 Rougher Concentrate 27.00 3.487 4.32 57.7 26.9WAS3 Rougher Concentrate 25.15 3.139 13.76 72.1 69.8WAS4 Rougher Concentrate 18.73 1.591 5.25 73.5 >54.7WSS1 Rougher Concentrate 24.20 2.710 3.97 65.0 55.9WSS2 Rougher Concentrate 23.94 2.394 7.43 80.5 70.0WSS3 Rougher Concentrate 25.42 2.186 9.59 70.0 52.2WSS4 Rougher Concentrate 51.85 3.436 14.27 84.9 90.2
FSUF-001 Rougher Concentrate 34.15 2.023 <4.29 70.7 <48.8FSUF-002 Rougher Concentrate 16.97 4.560 3.78 91.2 43.6FOX-001 Rougher Concentrate 24.34 1.748 4.38 62.7 29.7FOX-002 Rougher Concentrate 23.33 1.927 2.70 60.8 <21.5
WDN-11-9 HG Rougher Concentrate 43.31 0.826 8.03 67.1 67.2WDN-11 Master Rougher Concentrate 49.48 0.439 <4.39 69.2 <61.7
Hole Composite I.D.
Ro, Conc.Assays, g/mt Recovery, Percent
AuTest Rec., Calculated Avg. Head
# % Extracted Tail Head Head Screen NaCN Cons. Cement AddedWDS-11-1 P1 75.9 0.162 0.055 0.228 0.214 0.226 1.44 10.0
WDS-11-2+3 P2 63.6 0.156 0.094 0.258 0.230 0.260 1.74 10.0WDW-11-4 P3 81.8 0.107 0.024 0.132 0.124 0.102 0.94 3.5
WDW-11-5+6 P4 81.0 0.204 0.048 0.252 0.263 0.273 0.83 3.5WDN-11-9 HG P5 79.0 0.392 0.104 0.496 0.495 0.491 1.09 40.0
FOX-001 P6 84.6 0.587 0.107 0.694 0.642 0.627 0.84 9.5FOX-002 P7 83.1 0.719 0.146 0.865 0.960 0.878 0.88 7.7
Hole Composite I.D.
Reagent Consumption,kg/mt ore
gAu/mt ore
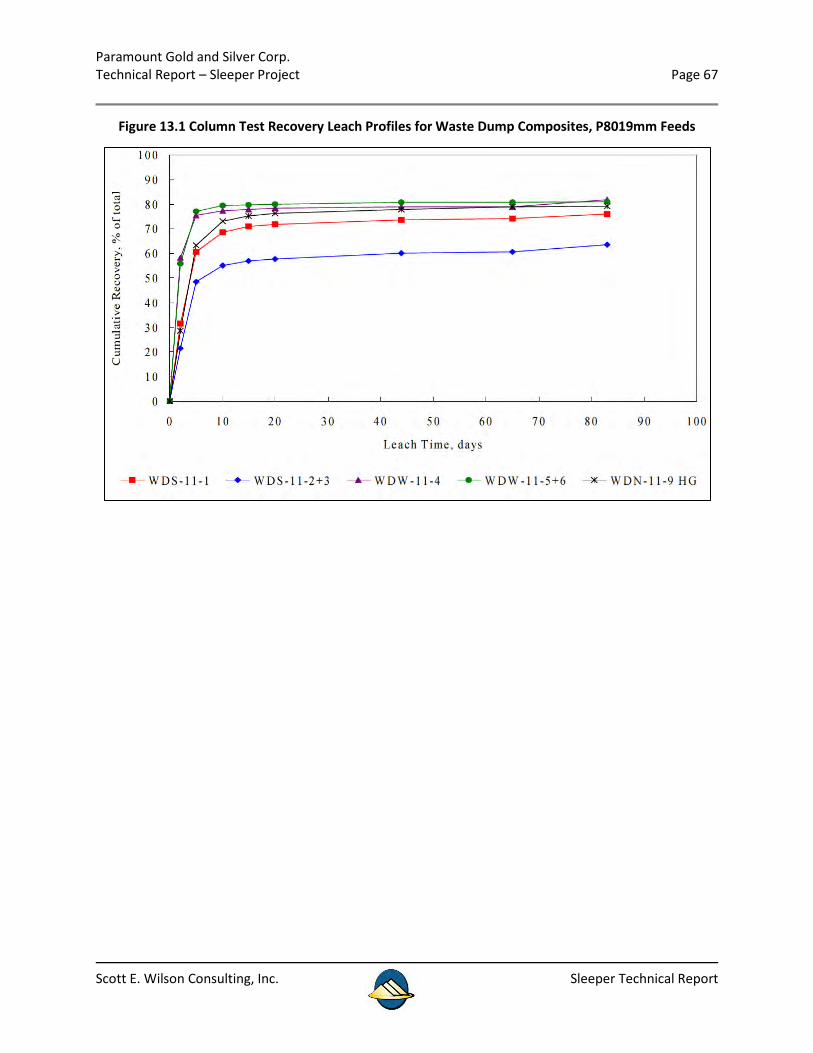
Paramount Gold and Silver Corp. Technical Report – Sleeper Project Page 67
Scott E. Wilson Consulting, Inc. Sleeper Technical Report
Figure 13.1 Column Test Recovery Leach Profiles for Waste Dump Composites, P8019mm Feeds
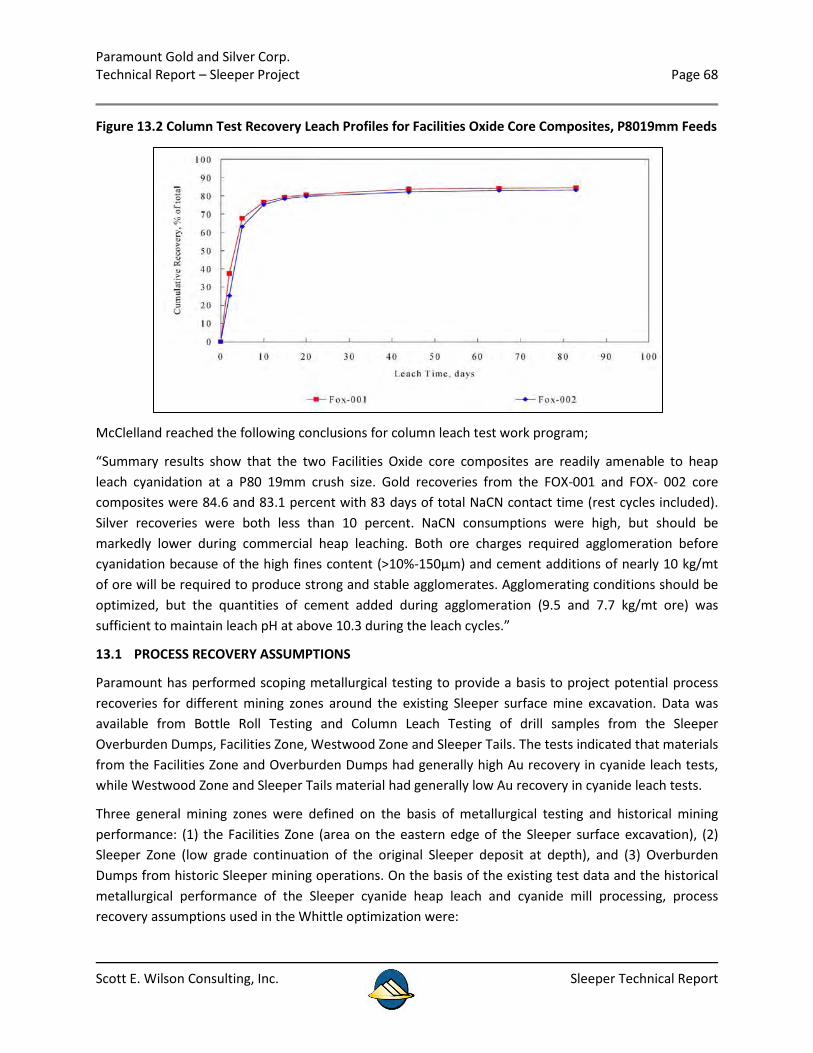
Paramount Gold and Silver Corp. Technical Report – Sleeper Project Page 68
Scott E. Wilson Consulting, Inc. Sleeper Technical Report
Figure 13.2 Column Test Recovery Leach Profiles for Facilities Oxide Core Composites, P8019mm Feeds
McClelland reached the following conclusions for column leach test work program;
“Summary results show that the two Facilities Oxide core composites are readily amenable to heap leach cyanidation at a P80 19mm crush size. Gold recoveries from the FOX-001 and FOX- 002 core composites were 84.6 and 83.1 percent with 83 days of total NaCN contact time (rest cycles included). Silver recoveries were both less than 10 percent. NaCN consumptions were high, but should be markedly lower during commercial heap leaching. Both ore charges required agglomeration before cyanidation because of the high fines content (>10%-150μm) and cement additions of nearly 10 kg/mt of ore will be required to produce strong and stable agglomerates. Agglomerating conditions should be optimized, but the quantities of cement added during agglomeration (9.5 and 7.7 kg/mt ore) was sufficient to maintain leach pH at above 10.3 during the leach cycles.”
13.1 PROCESS RECOVERY ASSUMPTIONS
Paramount has performed scoping metallurgical testing to provide a basis to project potential process recoveries for different mining zones around the existing Sleeper surface mine excavation. Data was available from Bottle Roll Testing and Column Leach Testing of drill samples from the Sleeper Overburden Dumps, Facilities Zone, Westwood Zone and Sleeper Tails. The tests indicated that materials from the Facilities Zone and Overburden Dumps had generally high Au recovery in cyanide leach tests, while Westwood Zone and Sleeper Tails material had generally low Au recovery in cyanide leach tests.
Three general mining zones were defined on the basis of metallurgical testing and historical mining performance: (1) the Facilities Zone (area on the eastern edge of the Sleeper surface excavation), (2) Sleeper Zone (low grade continuation of the original Sleeper deposit at depth), and (3) Overburden Dumps from historic Sleeper mining operations. On the basis of the existing test data and the historical metallurgical performance of the Sleeper cyanide heap leach and cyanide mill processing, process recovery assumptions used in the Whittle optimization were:

Paramount Gold and Silver Corp. Technical Report – Sleeper Project Page 69
Scott E. Wilson Consulting, Inc. Sleeper Technical Report
• Facilities Zone Oxide and Sulphide mineralization – 78% for gold and 10% for silver • Sleeper Zone Oxide mineralization – 78% for gold and 10% for silver • Sleeper Zone Sulphide mineralization – 55% for gold and 10% for silver • Mine dumps mineralization – 78% for gold and 10% for silver
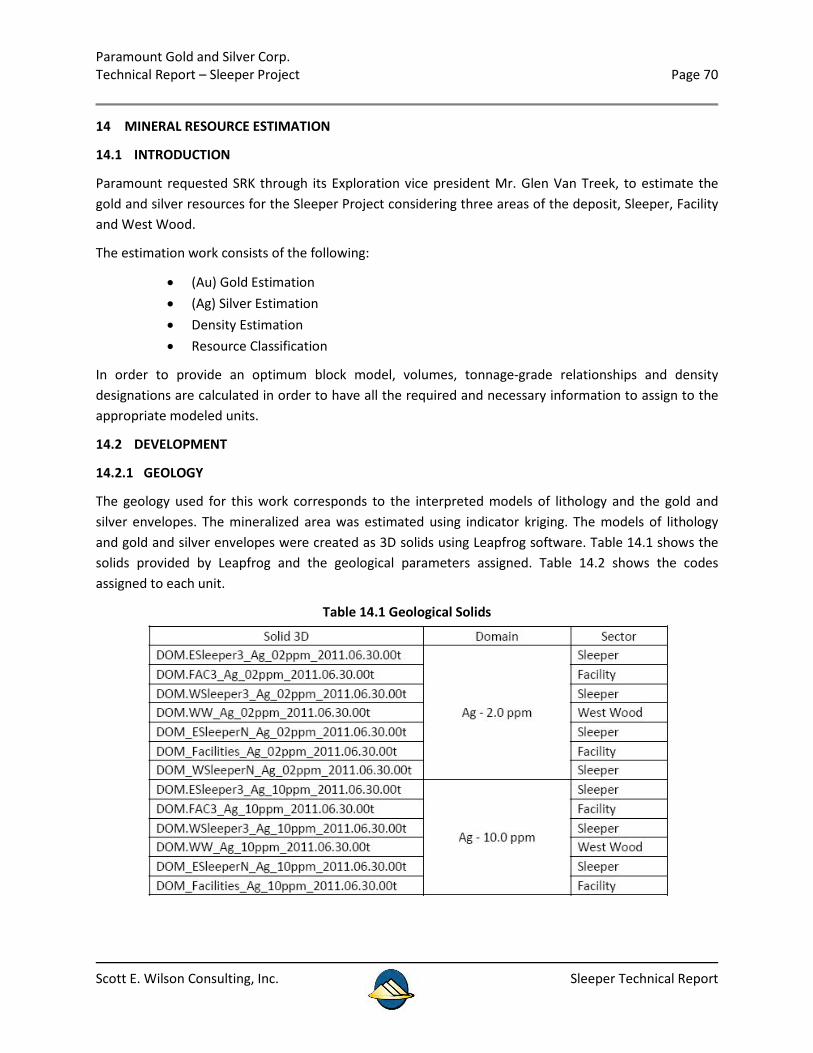
Paramount Gold and Silver Corp. Technical Report – Sleeper Project Page 70
Scott E. Wilson Consulting, Inc. Sleeper Technical Report
14 MINERAL RESOURCE ESTIMATION
14.1 INTRODUCTION
Paramount requested SRK through its Exploration vice president Mr. Glen Van Treek, to estimate the gold and silver resources for the Sleeper Project considering three areas of the deposit, Sleeper, Facility and West Wood.
The estimation work consists of the following:
• (Au) Gold Estimation • (Ag) Silver Estimation • Density Estimation • Resource Classification
In order to provide an optimum block model, volumes, tonnage-grade relationships and density designations are calculated in order to have all the required and necessary information to assign to the appropriate modeled units.
14.2 DEVELOPMENT
14.2.1 GEOLOGY
The geology used for this work corresponds to the interpreted models of lithology and the gold and silver envelopes. The mineralized area was estimated using indicator kriging. The models of lithology and gold and silver envelopes were created as 3D solids using Leapfrog software. Table 14.1 shows the solids provided by Leapfrog and the geological parameters assigned. Table 14.2 shows the codes assigned to each unit.
Table 14.1 Geological Solids
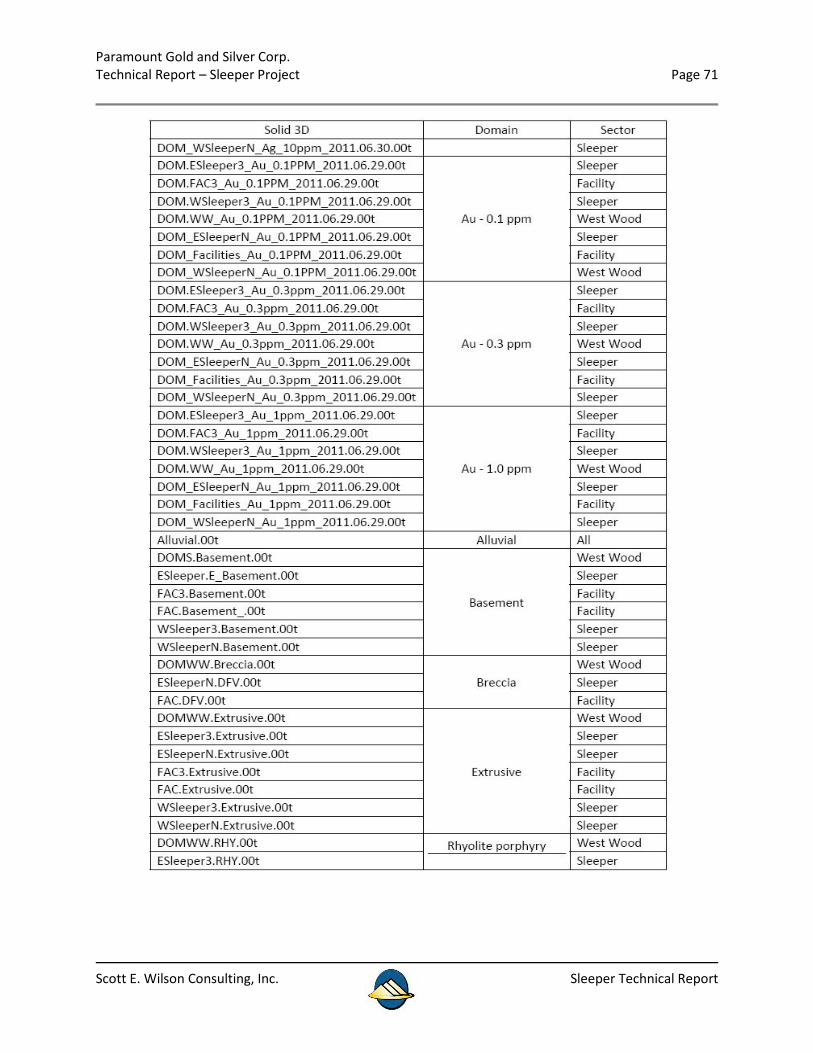
Paramount Gold and Silver Corp. Technical Report – Sleeper Project Page 71
Scott E. Wilson Consulting, Inc. Sleeper Technical Report
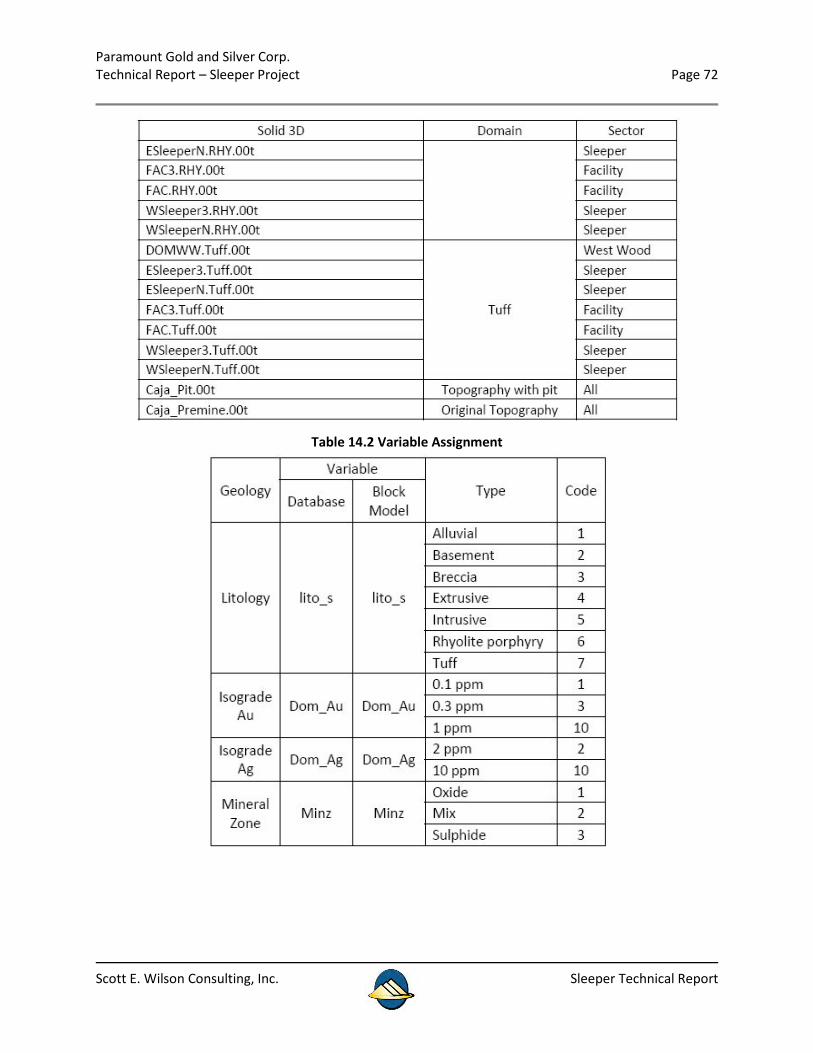
Paramount Gold and Silver Corp. Technical Report – Sleeper Project Page 72
Scott E. Wilson Consulting, Inc. Sleeper Technical Report
Table 14.2 Variable Assignment
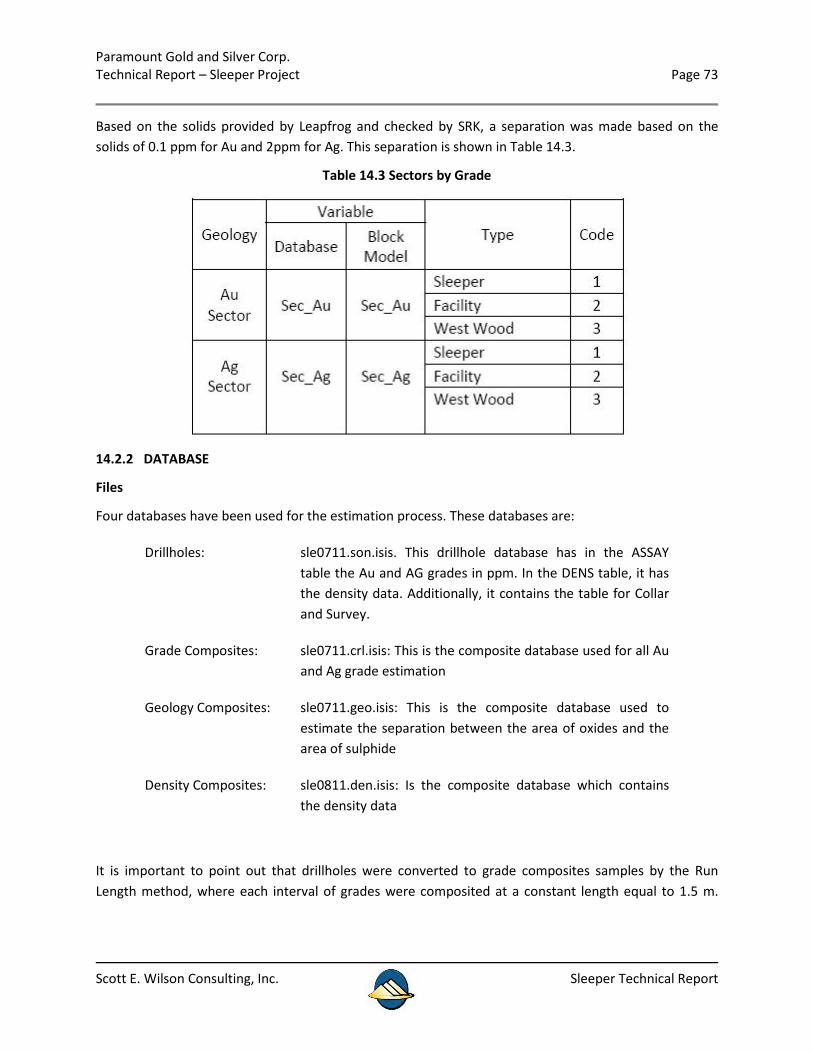
Paramount Gold and Silver Corp. Technical Report – Sleeper Project Page 73
Scott E. Wilson Consulting, Inc. Sleeper Technical Report
Based on the solids provided by Leapfrog and checked by SRK, a separation was made based on the solids of 0.1 ppm for Au and 2ppm for Ag. This separation is shown in Table 14.3.
Table 14.3 Sectors by Grade
14.2.2 DATABASE
Files
Four databases have been used for the estimation process. These databases are:
Drillholes: sle0711.son.isis. This drillhole database has in the ASSAY table the Au and AG grades in ppm. In the DENS table, it has the density data. Additionally, it contains the table for Collar and Survey.
Grade Composites: sle0711.crl.isis: This is the composite database used for all Au and Ag grade estimation
Geology Composites: sle0711.geo.isis: This is the composite database used to estimate the separation between the area of oxides and the area of sulphide
Density Composites: sle0811.den.isis: Is the composite database which contains the density data
It is important to point out that drillholes were converted to grade composites samples by the Run Length method, where each interval of grades were composited at a constant length equal to 1.5 m.
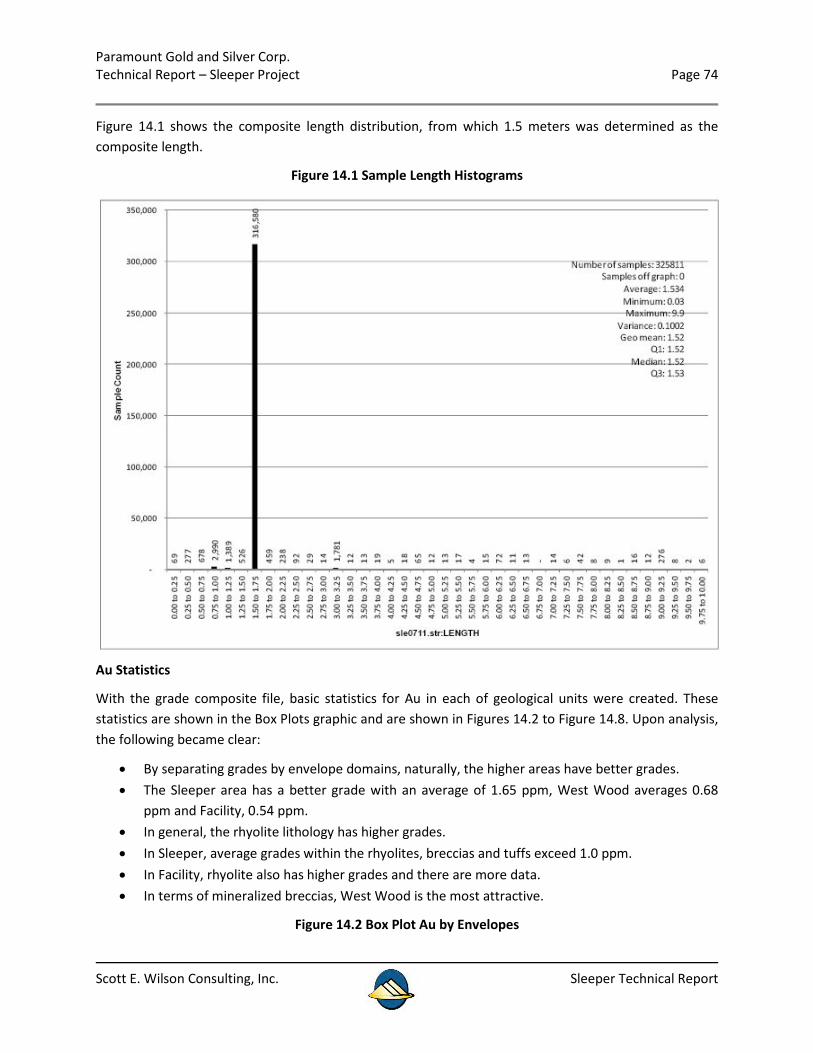
Paramount Gold and Silver Corp. Technical Report – Sleeper Project Page 74
Scott E. Wilson Consulting, Inc. Sleeper Technical Report
Figure 14.1 shows the composite length distribution, from which 1.5 meters was determined as the composite length.
Figure 14.1 Sample Length Histograms
Au Statistics
With the grade composite file, basic statistics for Au in each of geological units were created. These statistics are shown in the Box Plots graphic and are shown in Figures 14.2 to Figure 14.8. Upon analysis, the following became clear:
• By separating grades by envelope domains, naturally, the higher areas have better grades. • The Sleeper area has a better grade with an average of 1.65 ppm, West Wood averages 0.68
ppm and Facility, 0.54 ppm. • In general, the rhyolite lithology has higher grades. • In Sleeper, average grades within the rhyolites, breccias and tuffs exceed 1.0 ppm. • In Facility, rhyolite also has higher grades and there are more data. • In terms of mineralized breccias, West Wood is the most attractive.
Figure 14.2 Box Plot Au by Envelopes
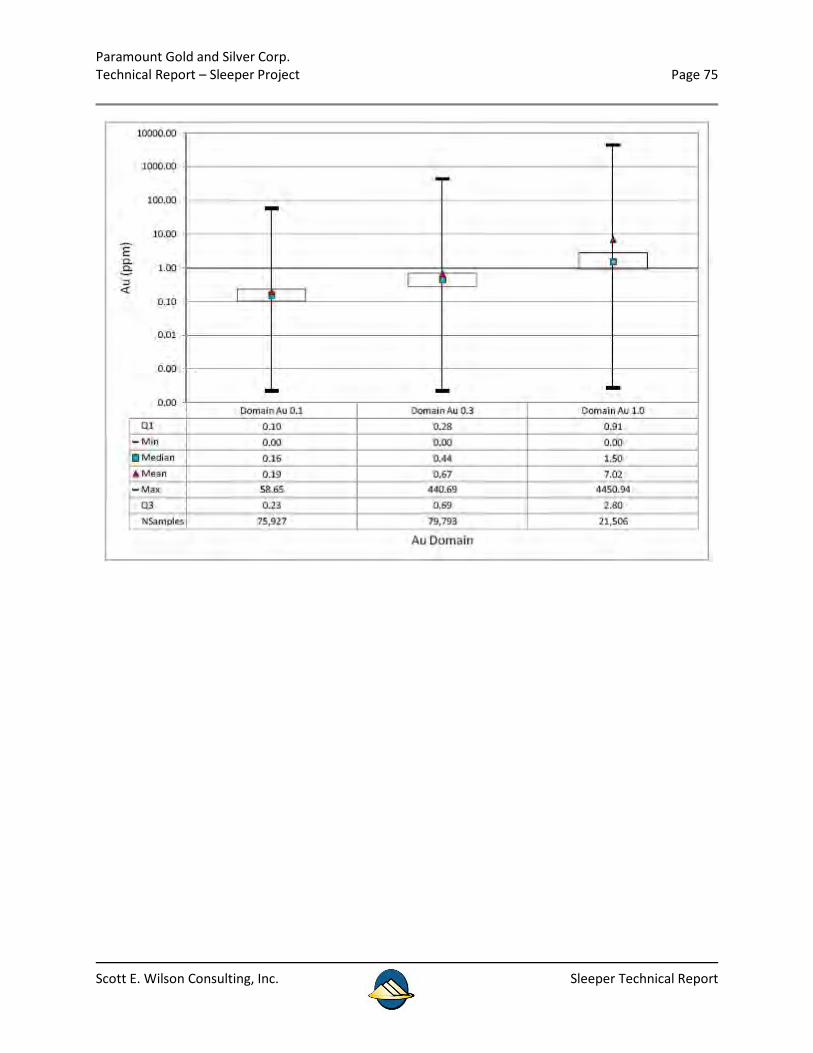
Paramount Gold and Silver Corp. Technical Report – Sleeper Project Page 75
Scott E. Wilson Consulting, Inc. Sleeper Technical Report
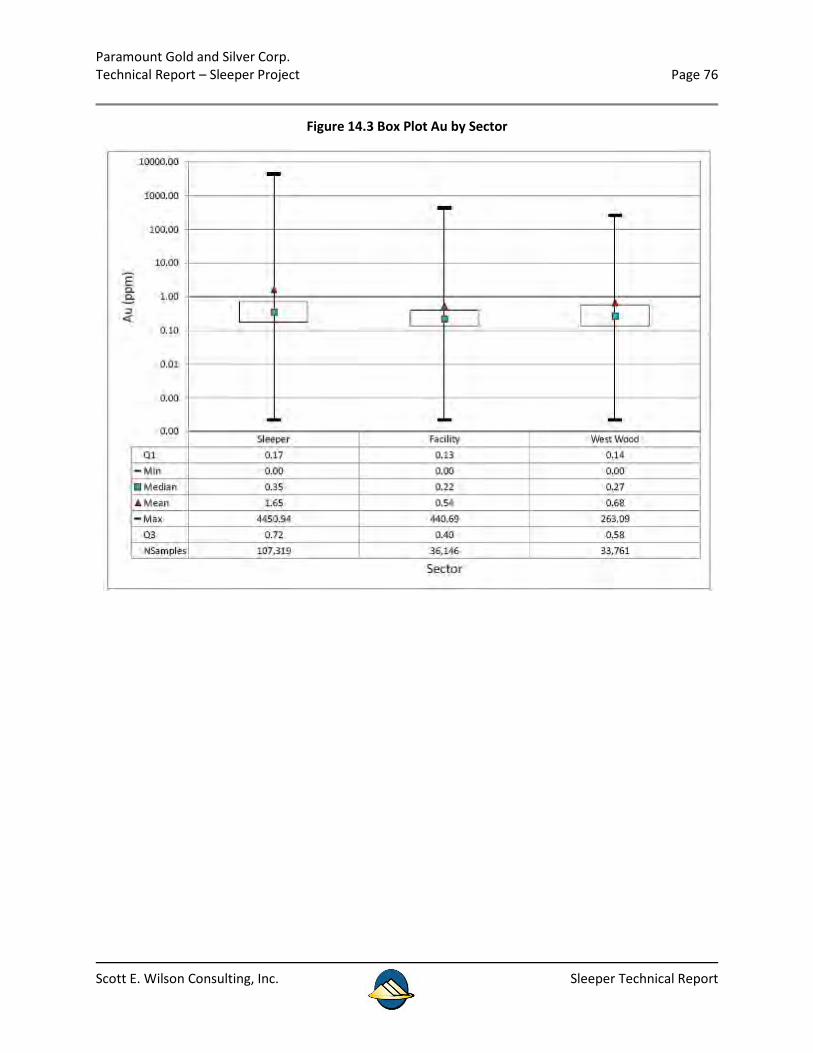
Paramount Gold and Silver Corp. Technical Report – Sleeper Project Page 76
Scott E. Wilson Consulting, Inc. Sleeper Technical Report
Figure 14.3 Box Plot Au by Sector
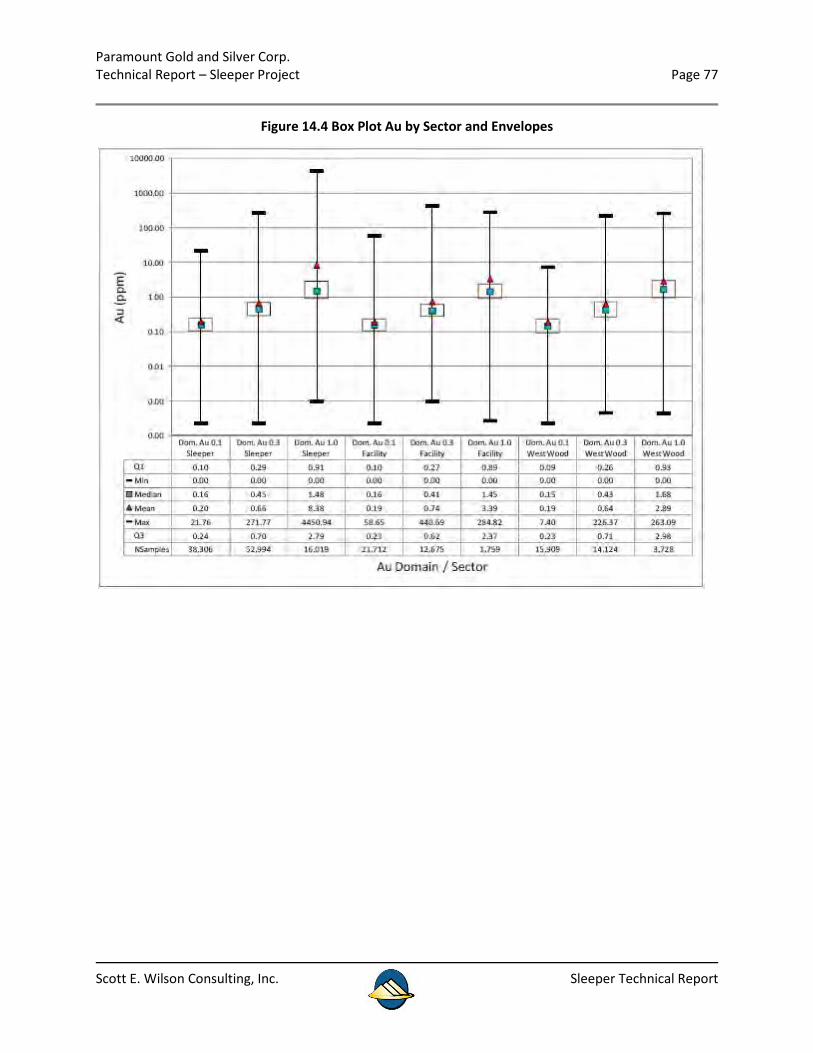
Paramount Gold and Silver Corp. Technical Report – Sleeper Project Page 77
Scott E. Wilson Consulting, Inc. Sleeper Technical Report
Figure 14.4 Box Plot Au by Sector and Envelopes
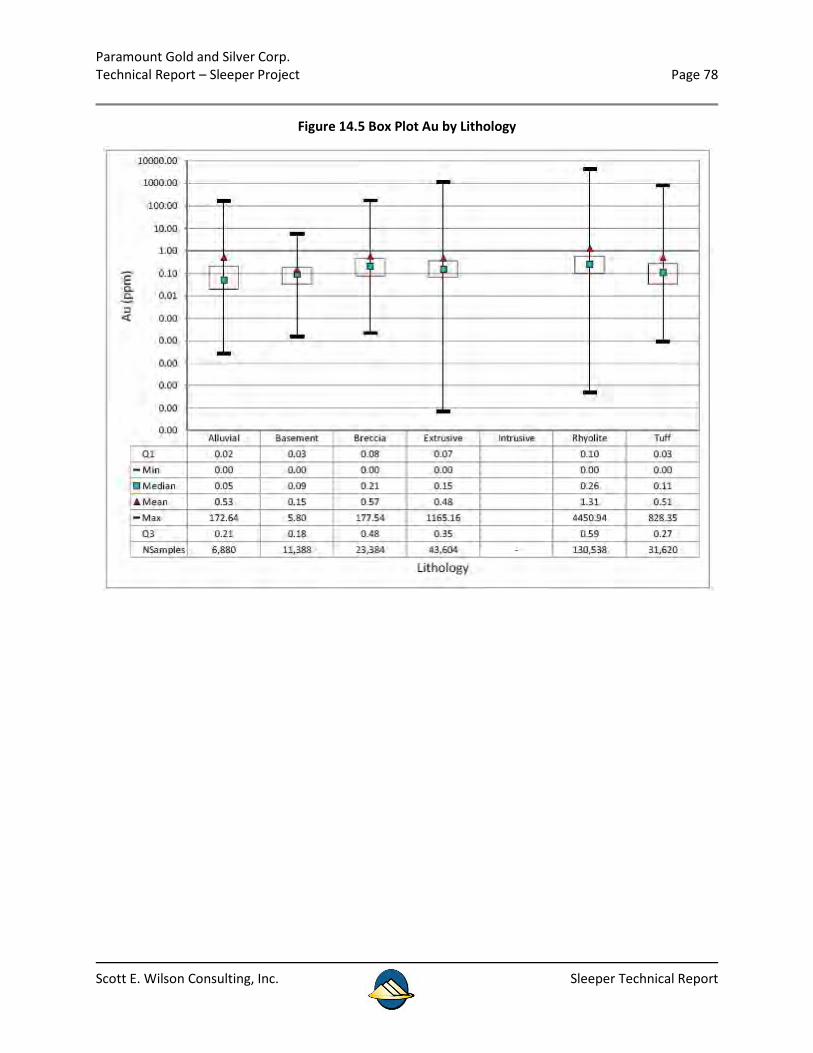
Paramount Gold and Silver Corp. Technical Report – Sleeper Project Page 78
Scott E. Wilson Consulting, Inc. Sleeper Technical Report
Figure 14.5 Box Plot Au by Lithology

Paramount Gold and Silver Corp. Technical Report – Sleeper Project Page 79
Scott E. Wilson Consulting, Inc. Sleeper Technical Report
Figure 14.6 Box Plot Au by Lithology in Sleeper
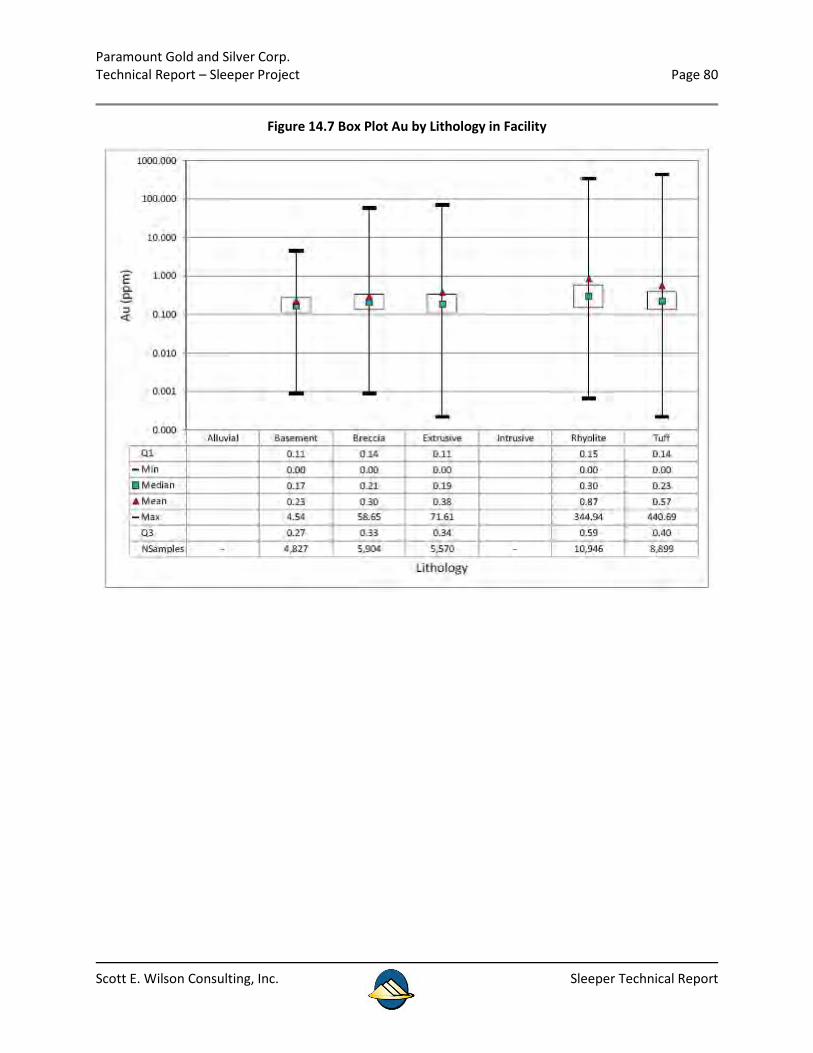
Paramount Gold and Silver Corp. Technical Report – Sleeper Project Page 80
Scott E. Wilson Consulting, Inc. Sleeper Technical Report
Figure 14.7 Box Plot Au by Lithology in Facility
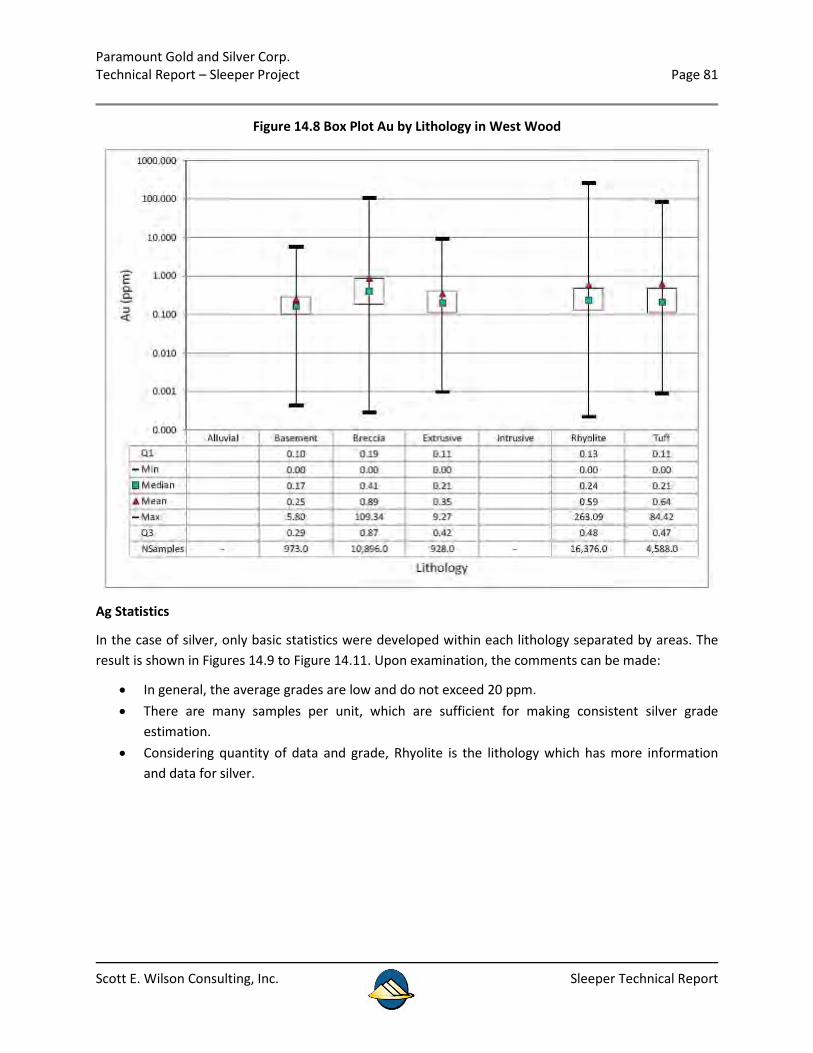
Paramount Gold and Silver Corp. Technical Report – Sleeper Project Page 81
Scott E. Wilson Consulting, Inc. Sleeper Technical Report
Figure 14.8 Box Plot Au by Lithology in West Wood
Ag Statistics
In the case of silver, only basic statistics were developed within each lithology separated by areas. The result is shown in Figures 14.9 to Figure 14.11. Upon examination, the comments can be made:
• In general, the average grades are low and do not exceed 20 ppm. • There are many samples per unit, which are sufficient for making consistent silver grade
estimation. • Considering quantity of data and grade, Rhyolite is the lithology which has more information
and data for silver.
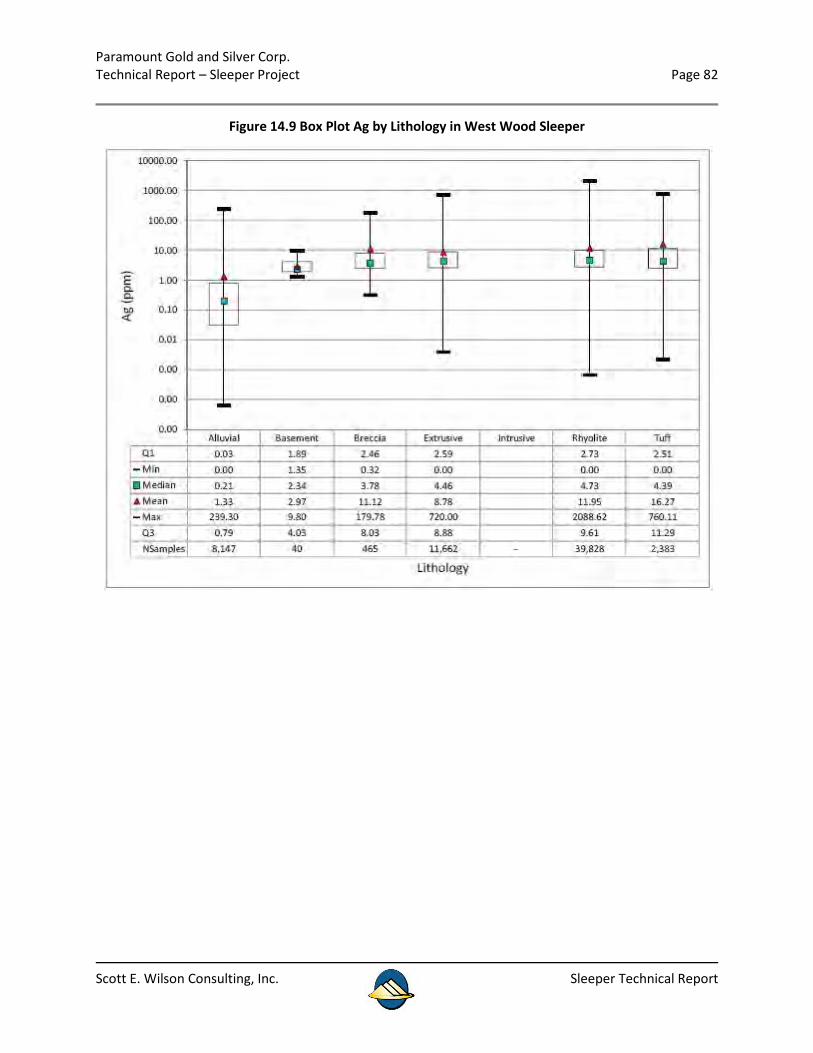
Paramount Gold and Silver Corp. Technical Report – Sleeper Project Page 82
Scott E. Wilson Consulting, Inc. Sleeper Technical Report
Figure 14.9 Box Plot Ag by Lithology in West Wood Sleeper
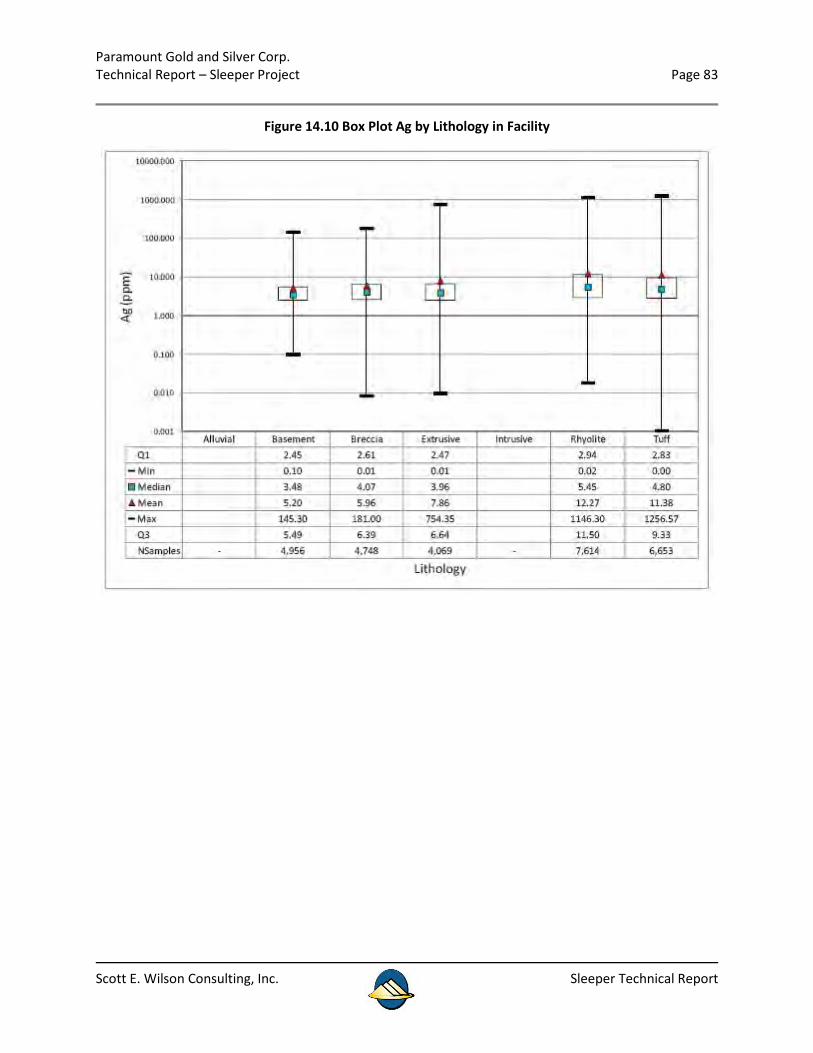
Paramount Gold and Silver Corp. Technical Report – Sleeper Project Page 83
Scott E. Wilson Consulting, Inc. Sleeper Technical Report
Figure 14.10 Box Plot Ag by Lithology in Facility
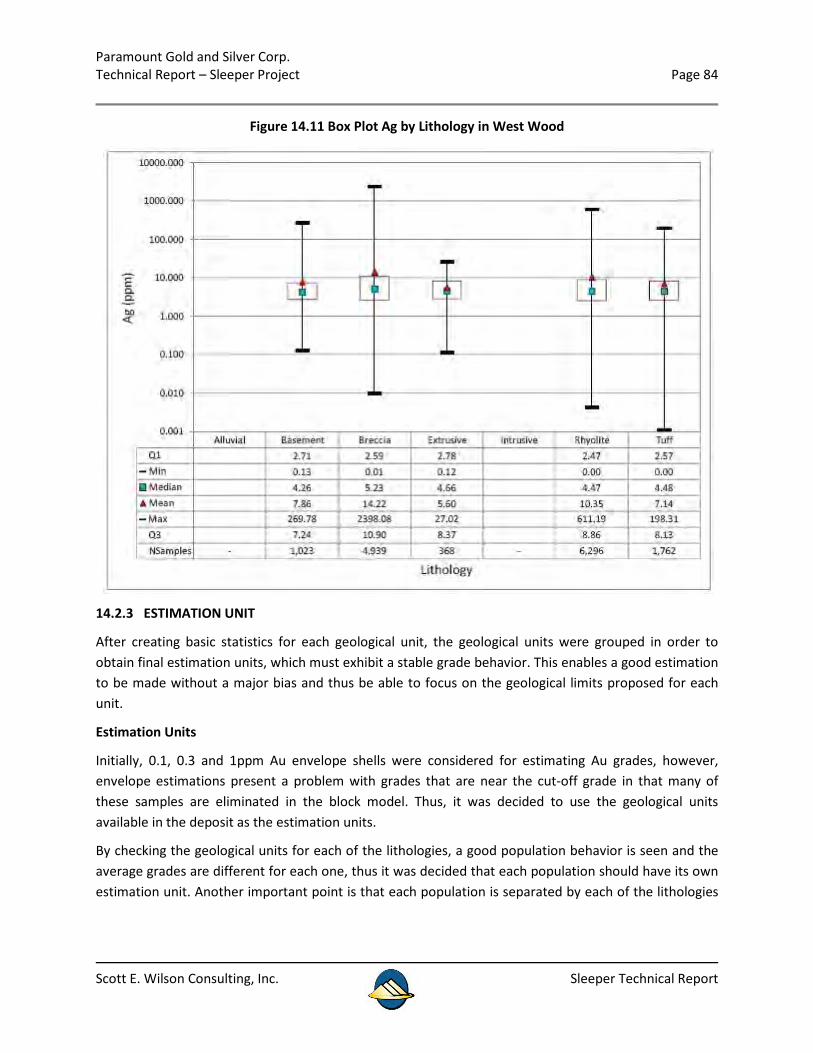
Paramount Gold and Silver Corp. Technical Report – Sleeper Project Page 84
Scott E. Wilson Consulting, Inc. Sleeper Technical Report
Figure 14.11 Box Plot Ag by Lithology in West Wood
14.2.3 ESTIMATION UNIT
After creating basic statistics for each geological unit, the geological units were grouped in order to obtain final estimation units, which must exhibit a stable grade behavior. This enables a good estimation to be made without a major bias and thus be able to focus on the geological limits proposed for each unit.
Estimation Units
Initially, 0.1, 0.3 and 1ppm Au envelope shells were considered for estimating Au grades, however, envelope estimations present a problem with grades that are near the cut-off grade in that many of these samples are eliminated in the block model. Thus, it was decided to use the geological units available in the deposit as the estimation units.
By checking the geological units for each of the lithologies, a good population behavior is seen and the average grades are different for each one, thus it was decided that each population should have its own estimation unit. Another important point is that each population is separated by each of the lithologies
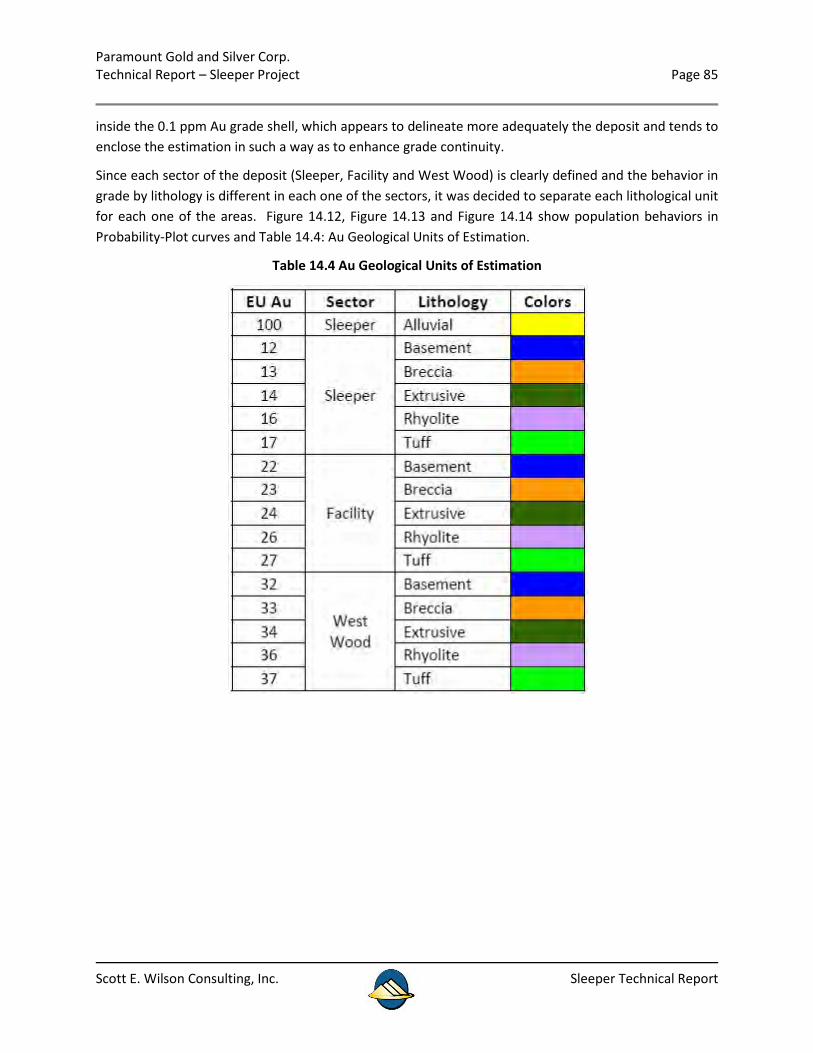
Paramount Gold and Silver Corp. Technical Report – Sleeper Project Page 85
Scott E. Wilson Consulting, Inc. Sleeper Technical Report
inside the 0.1 ppm Au grade shell, which appears to delineate more adequately the deposit and tends to enclose the estimation in such a way as to enhance grade continuity.
Since each sector of the deposit (Sleeper, Facility and West Wood) is clearly defined and the behavior in grade by lithology is different in each one of the sectors, it was decided to separate each lithological unit for each one of the areas. Figure 14.12, Figure 14.13 and Figure 14.14 show population behaviors in Probability-Plot curves and Table 14.4: Au Geological Units of Estimation.
Table 14.4 Au Geological Units of Estimation
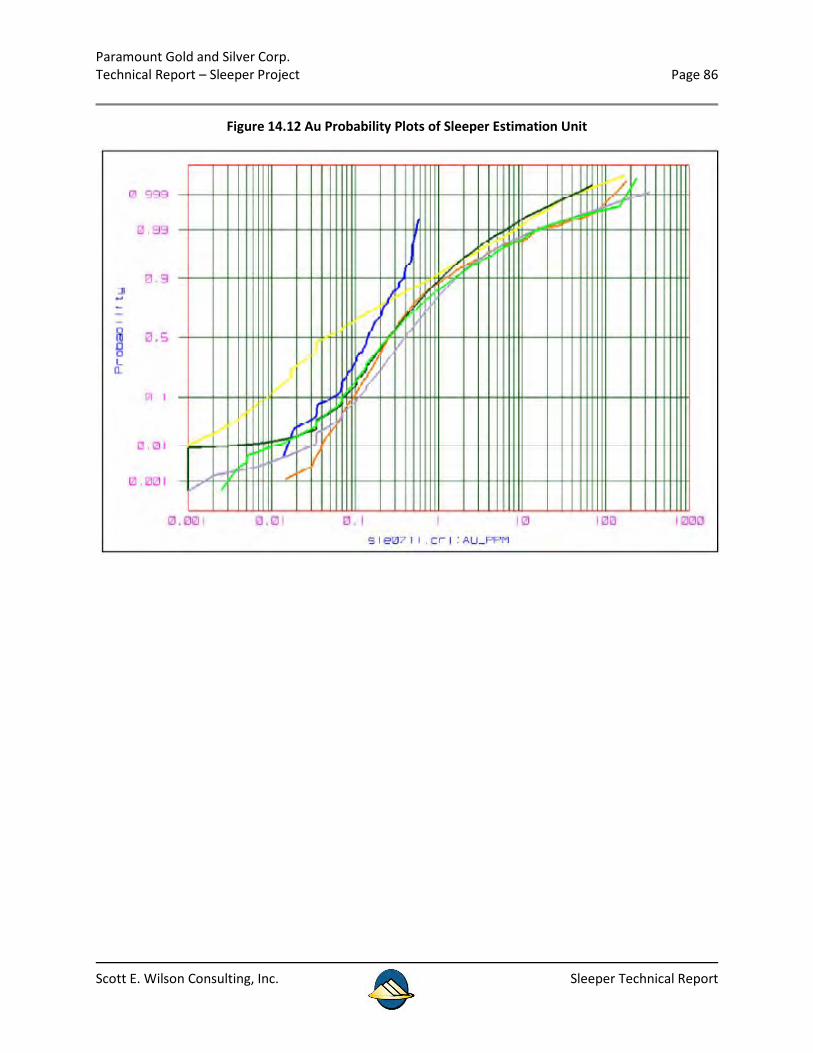
Paramount Gold and Silver Corp. Technical Report – Sleeper Project Page 86
Scott E. Wilson Consulting, Inc. Sleeper Technical Report
Figure 14.12 Au Probability Plots of Sleeper Estimation Unit
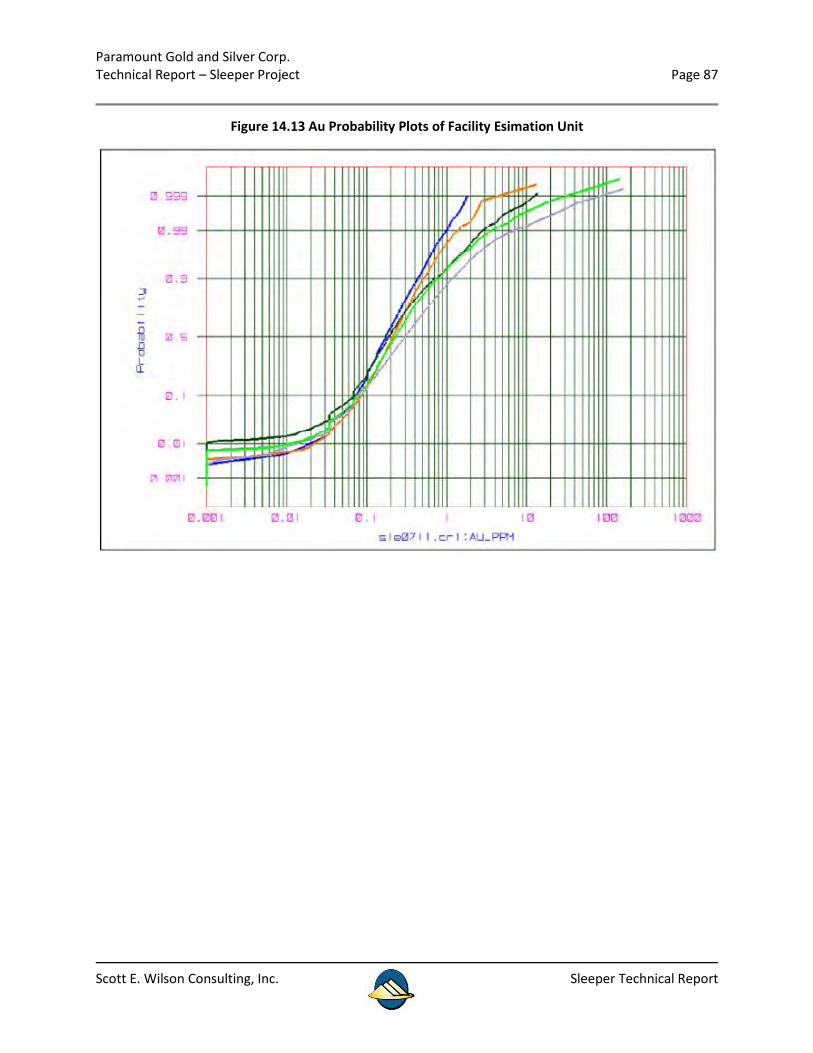
Paramount Gold and Silver Corp. Technical Report – Sleeper Project Page 87
Scott E. Wilson Consulting, Inc. Sleeper Technical Report
Figure 14.13 Au Probability Plots of Facility Esimation Unit
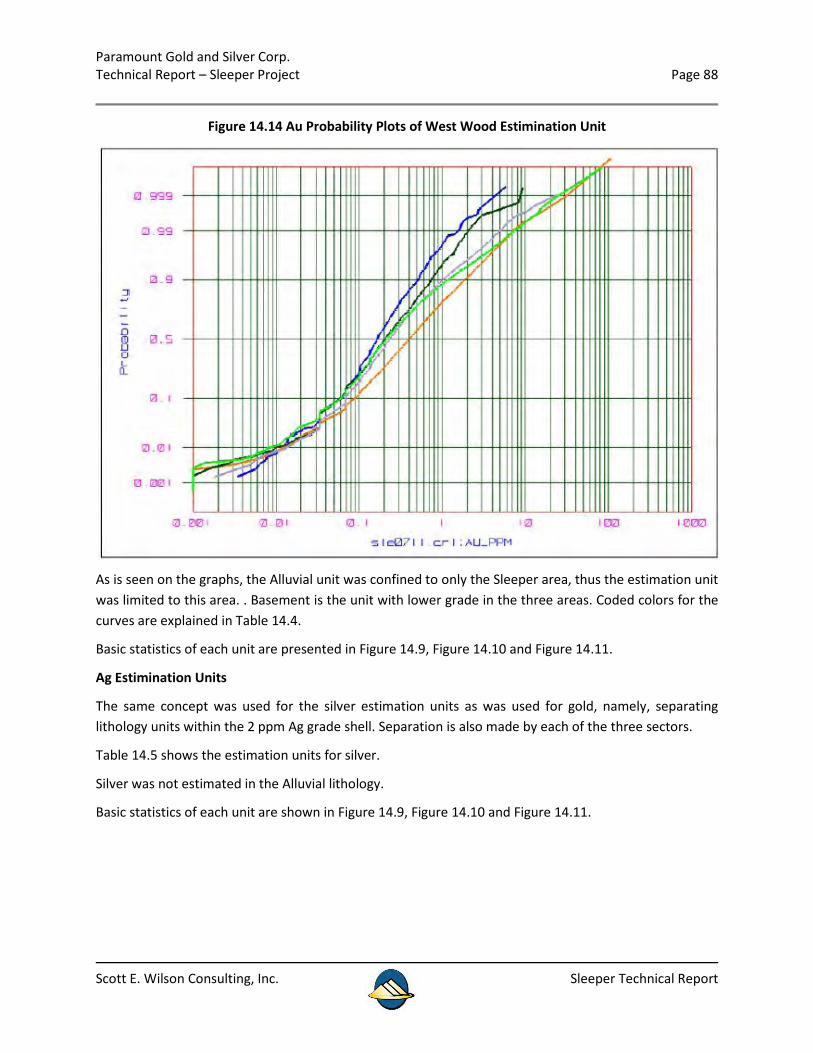
Paramount Gold and Silver Corp. Technical Report – Sleeper Project Page 88
Scott E. Wilson Consulting, Inc. Sleeper Technical Report
Figure 14.14 Au Probability Plots of West Wood Estimination Unit
As is seen on the graphs, the Alluvial unit was confined to only the Sleeper area, thus the estimation unit was limited to this area. . Basement is the unit with lower grade in the three areas. Coded colors for the curves are explained in Table 14.4.
Basic statistics of each unit are presented in Figure 14.9, Figure 14.10 and Figure 14.11.
Ag Estimination Units
The same concept was used for the silver estimation units as was used for gold, namely, separating lithology units within the 2 ppm Ag grade shell. Separation is also made by each of the three sectors.
Table 14.5 shows the estimation units for silver.
Silver was not estimated in the Alluvial lithology.
Basic statistics of each unit are shown in Figure 14.9, Figure 14.10 and Figure 14.11.
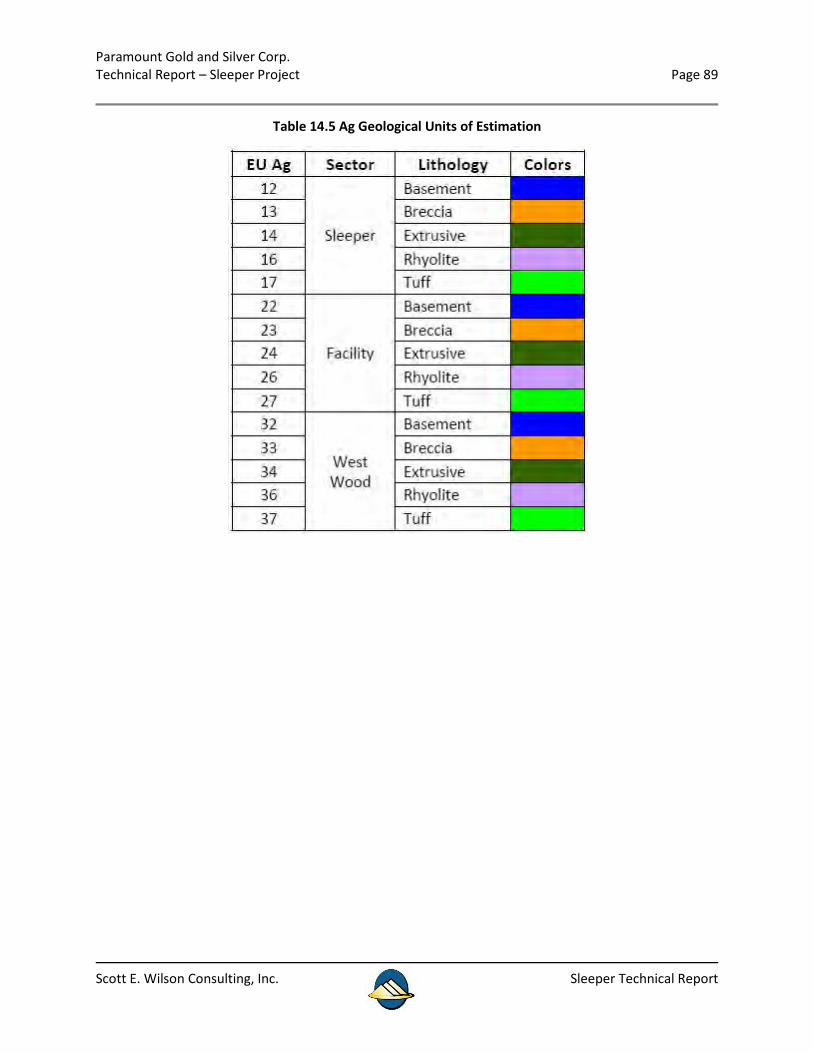
Paramount Gold and Silver Corp. Technical Report – Sleeper Project Page 89
Scott E. Wilson Consulting, Inc. Sleeper Technical Report
Table 14.5 Ag Geological Units of Estimation
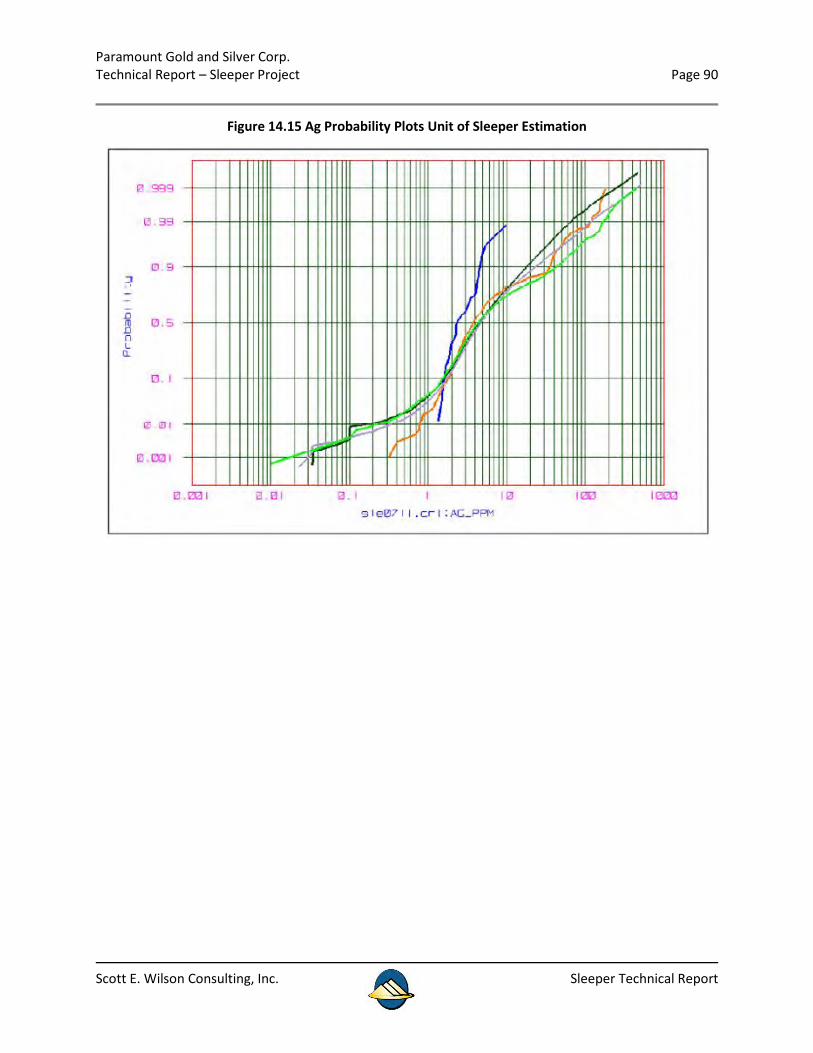
Paramount Gold and Silver Corp. Technical Report – Sleeper Project Page 90
Scott E. Wilson Consulting, Inc. Sleeper Technical Report
Figure 14.15 Ag Probability Plots Unit of Sleeper Estimation
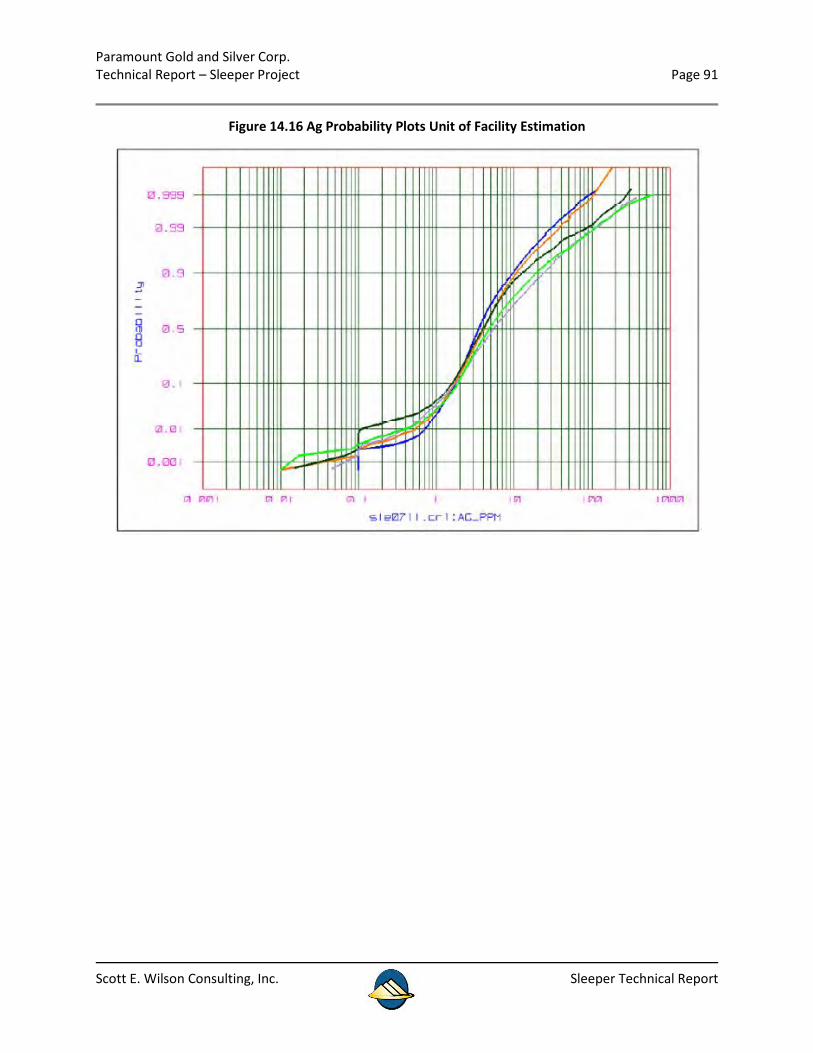
Paramount Gold and Silver Corp. Technical Report – Sleeper Project Page 91
Scott E. Wilson Consulting, Inc. Sleeper Technical Report
Figure 14.16 Ag Probability Plots Unit of Facility Estimation
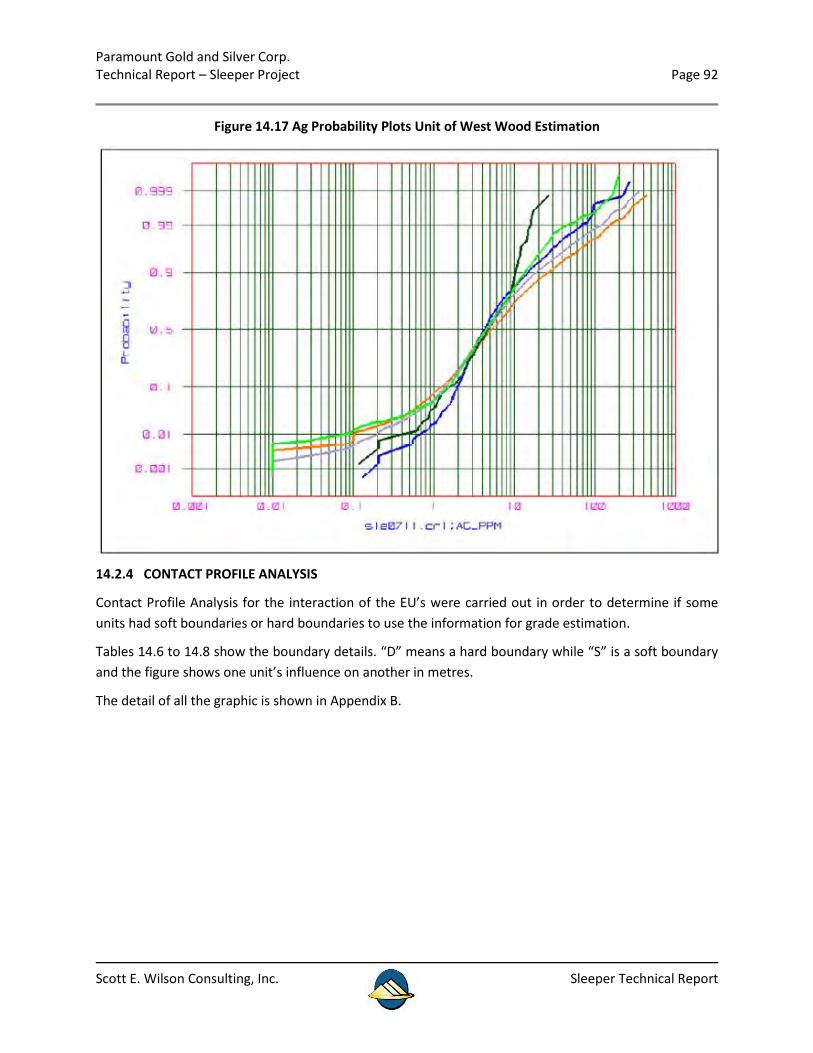
Paramount Gold and Silver Corp. Technical Report – Sleeper Project Page 92
Scott E. Wilson Consulting, Inc. Sleeper Technical Report
Figure 14.17 Ag Probability Plots Unit of West Wood Estimation
14.2.4 CONTACT PROFILE ANALYSIS
Contact Profile Analysis for the interaction of the EU’s were carried out in order to determine if some units had soft boundaries or hard boundaries to use the information for grade estimation.
Tables 14.6 to 14.8 show the boundary details. “D” means a hard boundary while “S” is a soft boundary and the figure shows one unit’s influence on another in metres.
The detail of all the graphic is shown in Appendix B.
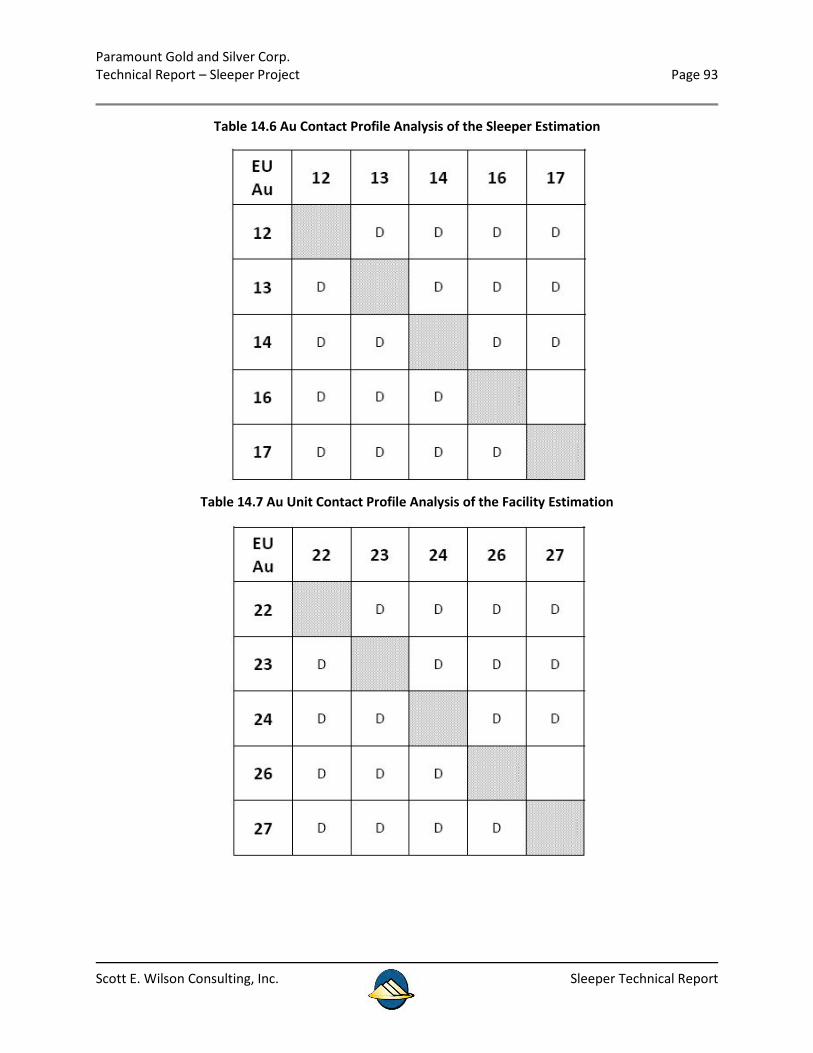
Paramount Gold and Silver Corp. Technical Report – Sleeper Project Page 93
Scott E. Wilson Consulting, Inc. Sleeper Technical Report
Table 14.6 Au Contact Profile Analysis of the Sleeper Estimation
Table 14.7 Au Unit Contact Profile Analysis of the Facility Estimation
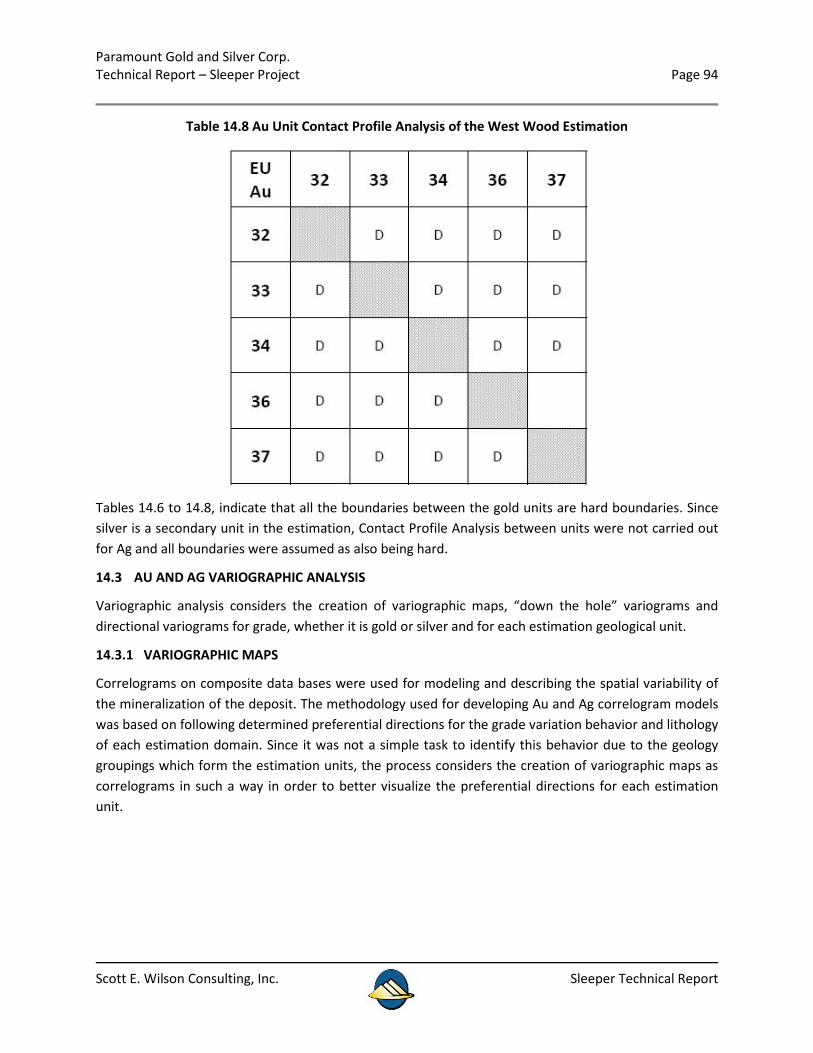
Paramount Gold and Silver Corp. Technical Report – Sleeper Project Page 94
Scott E. Wilson Consulting, Inc. Sleeper Technical Report
Table 14.8 Au Unit Contact Profile Analysis of the West Wood Estimation
Tables 14.6 to 14.8, indicate that all the boundaries between the gold units are hard boundaries. Since silver is a secondary unit in the estimation, Contact Profile Analysis between units were not carried out for Ag and all boundaries were assumed as also being hard.
14.3 AU AND AG VARIOGRAPHIC ANALYSIS
Variographic analysis considers the creation of variographic maps, “down the hole” variograms and directional variograms for grade, whether it is gold or silver and for each estimation geological unit.
14.3.1 VARIOGRAPHIC MAPS
Correlograms on composite data bases were used for modeling and describing the spatial variability of the mineralization of the deposit. The methodology used for developing Au and Ag correlogram models was based on following determined preferential directions for the grade variation behavior and lithology of each estimation domain. Since it was not a simple task to identify this behavior due to the geology groupings which form the estimation units, the process considers the creation of variographic maps as correlograms in such a way in order to better visualize the preferential directions for each estimation unit.

Paramount Gold and Silver Corp. Technical Report – Sleeper Project Page 95
Scott E. Wilson Consulting, Inc. Sleeper Technical Report
Table 14.9 shows angles found from gold variographic maps, which are shown in Appendix C. It should be pointed out that sign convention is according to Vulcan® software. Table 14.10 shows preferential angles for silver.
Table 14.9 Au Search Angles
Gold estimation unit (EU) 12 does not have information regarding the search angles because this unit does not have sufficient information for performing a variographic analysis.
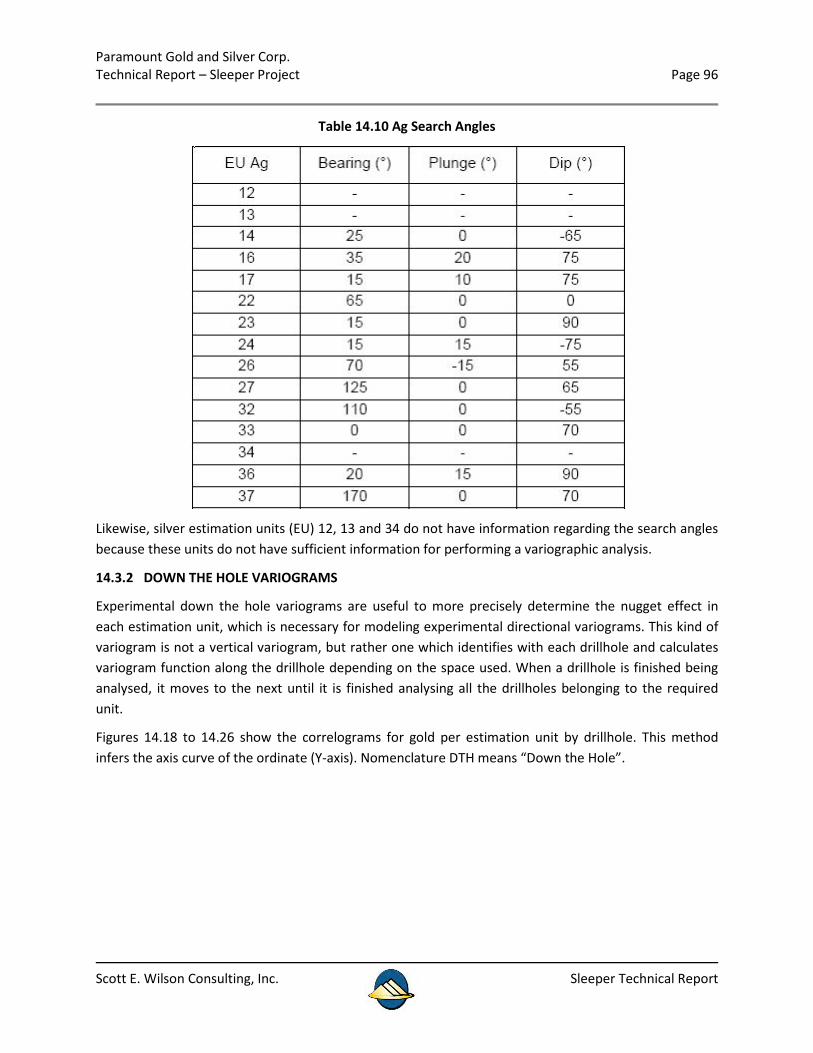
Paramount Gold and Silver Corp. Technical Report – Sleeper Project Page 96
Scott E. Wilson Consulting, Inc. Sleeper Technical Report
Table 14.10 Ag Search Angles
Likewise, silver estimation units (EU) 12, 13 and 34 do not have information regarding the search angles because these units do not have sufficient information for performing a variographic analysis.
14.3.2 DOWN THE HOLE VARIOGRAMS
Experimental down the hole variograms are useful to more precisely determine the nugget effect in each estimation unit, which is necessary for modeling experimental directional variograms. This kind of variogram is not a vertical variogram, but rather one which identifies with each drillhole and calculates variogram function along the drillhole depending on the space used. When a drillhole is finished being analysed, it moves to the next until it is finished analysing all the drillholes belonging to the required unit.
Figures 14.18 to 14.26 show the correlograms for gold per estimation unit by drillhole. This method infers the axis curve of the ordinate (Y-axis). Nomenclature DTH means “Down the Hole”.
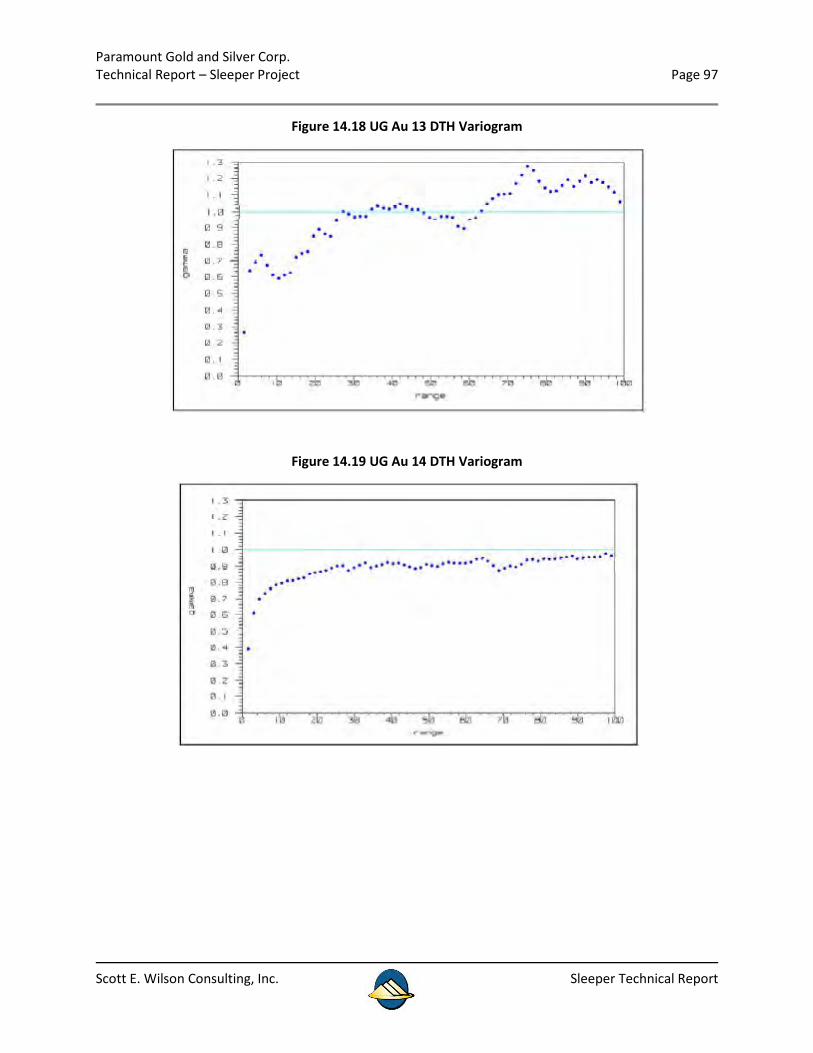
Paramount Gold and Silver Corp. Technical Report – Sleeper Project Page 97
Scott E. Wilson Consulting, Inc. Sleeper Technical Report
Figure 14.18 UG Au 13 DTH Variogram
Figure 14.19 UG Au 14 DTH Variogram

Paramount Gold and Silver Corp. Technical Report – Sleeper Project Page 98
Scott E. Wilson Consulting, Inc. Sleeper Technical Report
Figure 14.20 UG Au 16 DTH Variogram
Figure 14.21 UG Au 17 DTH Variogram
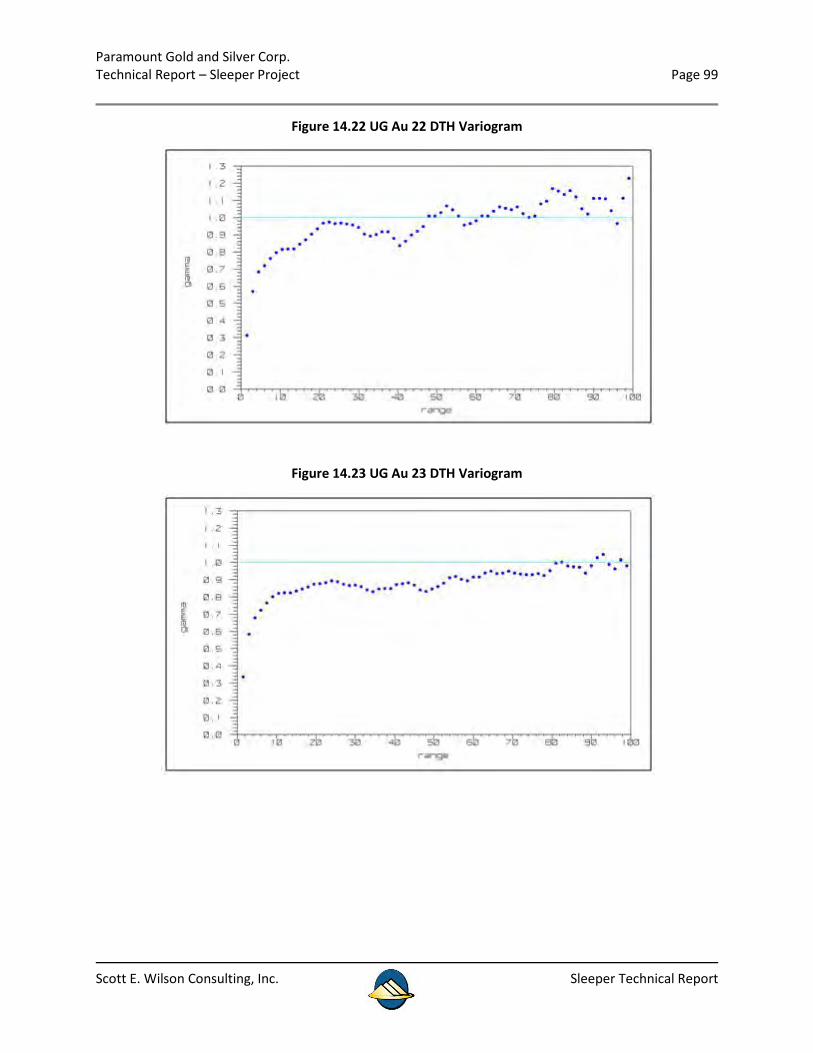
Paramount Gold and Silver Corp. Technical Report – Sleeper Project Page 99
Scott E. Wilson Consulting, Inc. Sleeper Technical Report
Figure 14.22 UG Au 22 DTH Variogram
Figure 14.23 UG Au 23 DTH Variogram

Paramount Gold and Silver Corp. Technical Report – Sleeper Project Page 100
Scott E. Wilson Consulting, Inc. Sleeper Technical Report
Figure 14.24 UG Au 24 DTH Variogram
Figure 14.25 UG Au 26 DTH Variogram
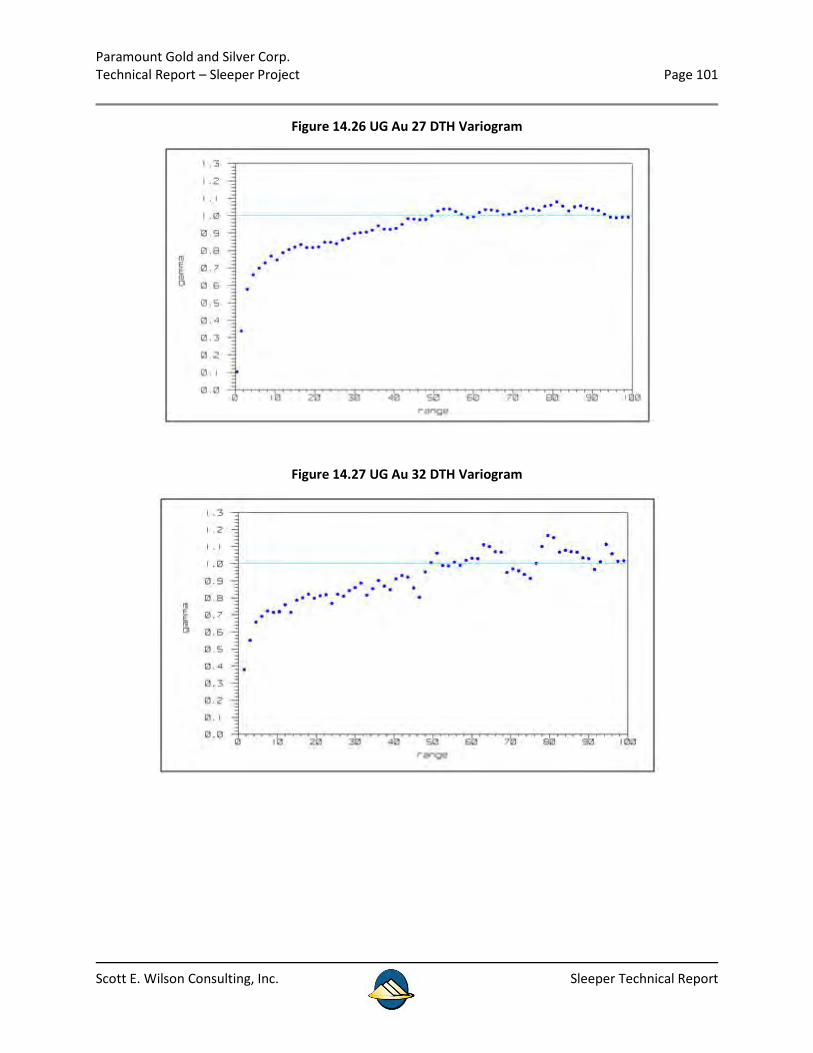
Paramount Gold and Silver Corp. Technical Report – Sleeper Project Page 101
Scott E. Wilson Consulting, Inc. Sleeper Technical Report
Figure 14.26 UG Au 27 DTH Variogram
Figure 14.27 UG Au 32 DTH Variogram
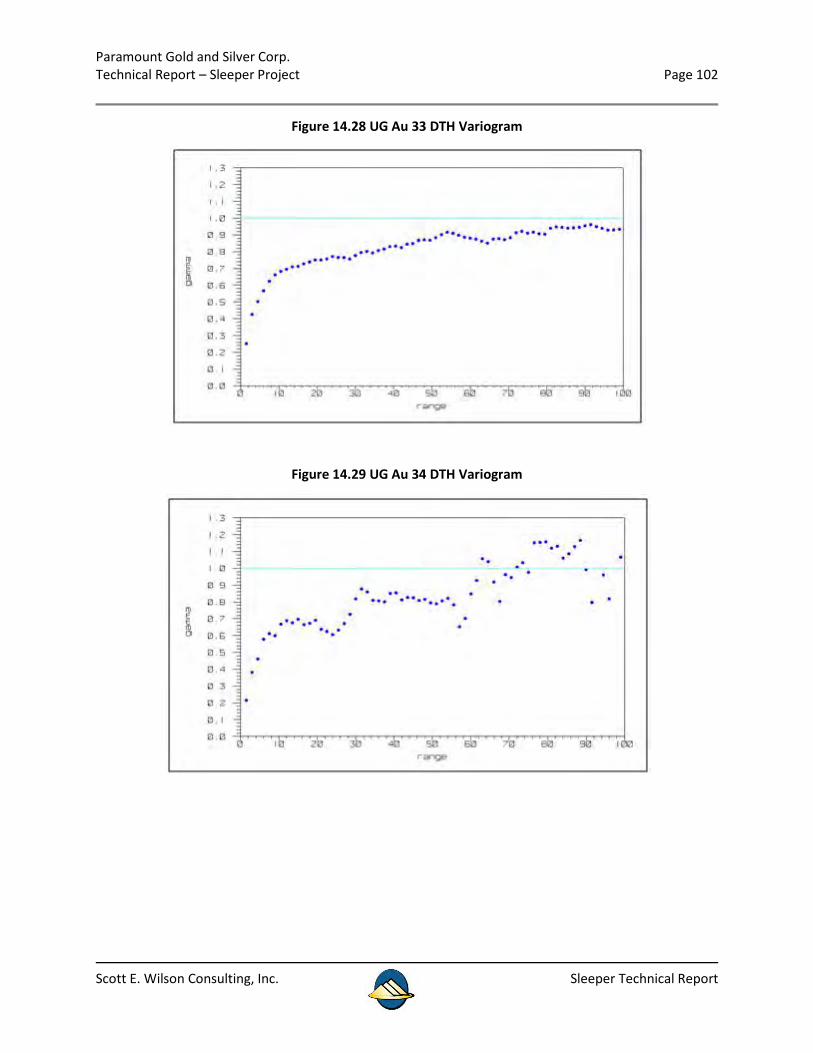
Paramount Gold and Silver Corp. Technical Report – Sleeper Project Page 102
Scott E. Wilson Consulting, Inc. Sleeper Technical Report
Figure 14.28 UG Au 33 DTH Variogram
Figure 14.29 UG Au 34 DTH Variogram
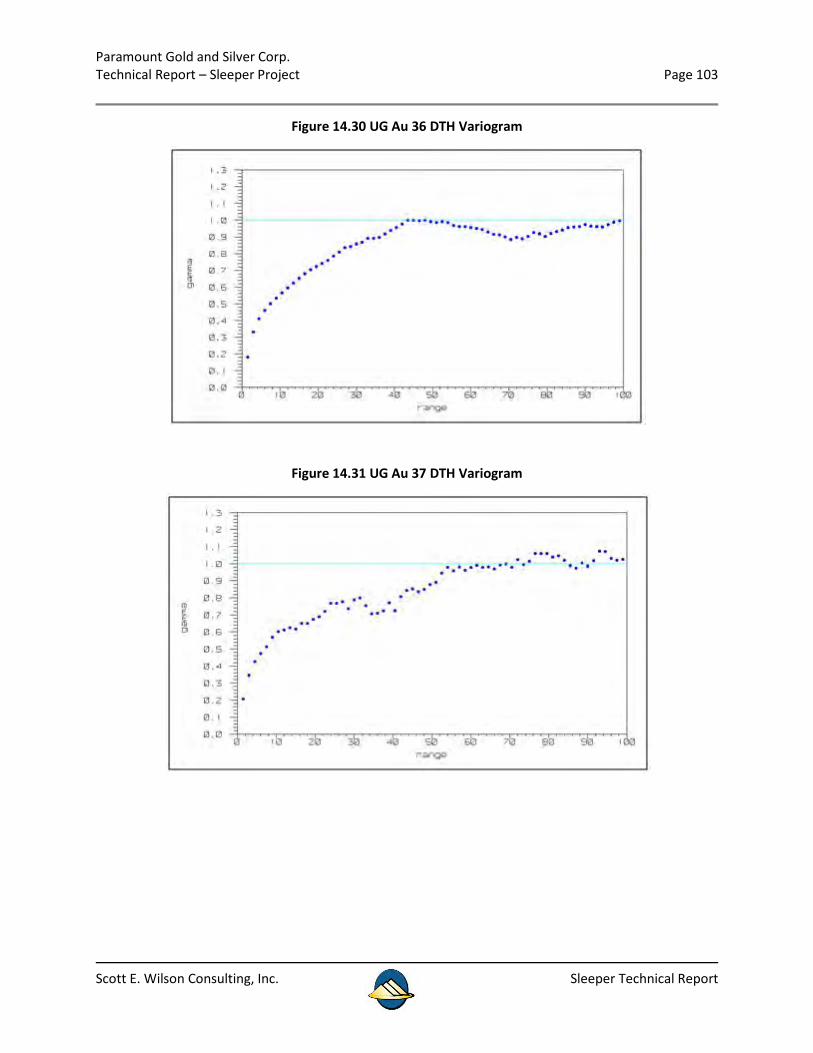
Paramount Gold and Silver Corp. Technical Report – Sleeper Project Page 103
Scott E. Wilson Consulting, Inc. Sleeper Technical Report
Figure 14.30 UG Au 36 DTH Variogram
Figure 14.31 UG Au 37 DTH Variogram
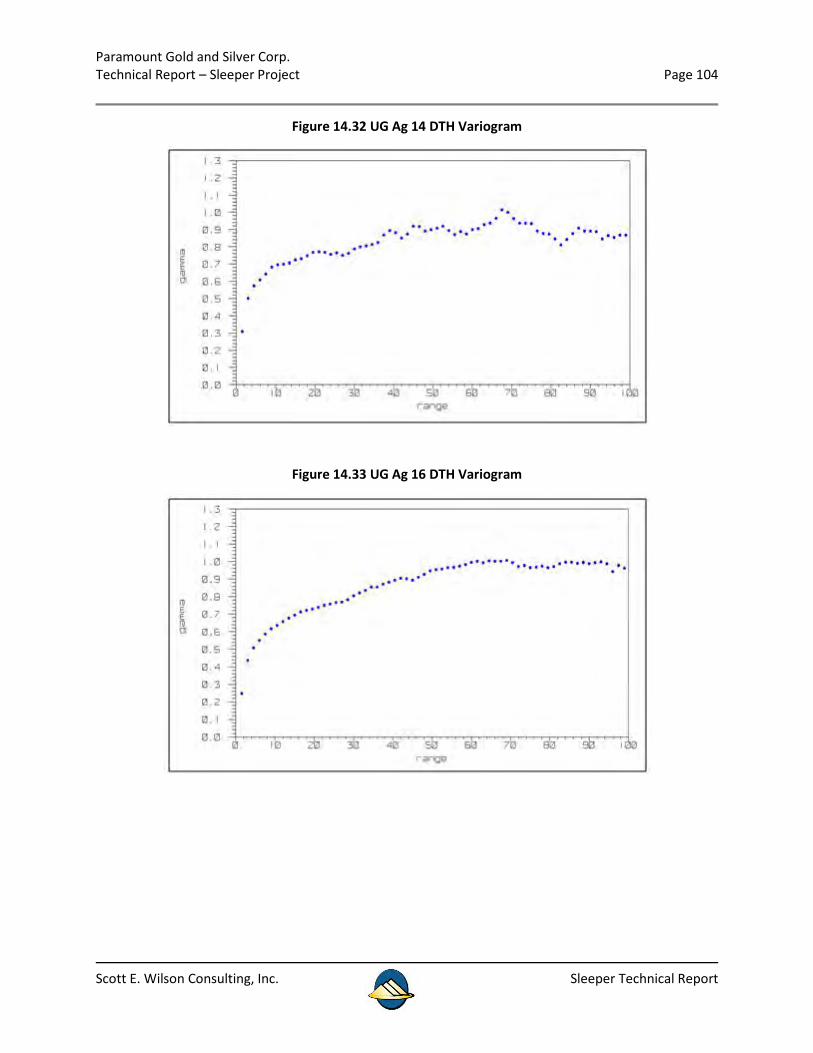
Paramount Gold and Silver Corp. Technical Report – Sleeper Project Page 104
Scott E. Wilson Consulting, Inc. Sleeper Technical Report
Figure 14.32 UG Ag 14 DTH Variogram
Figure 14.33 UG Ag 16 DTH Variogram
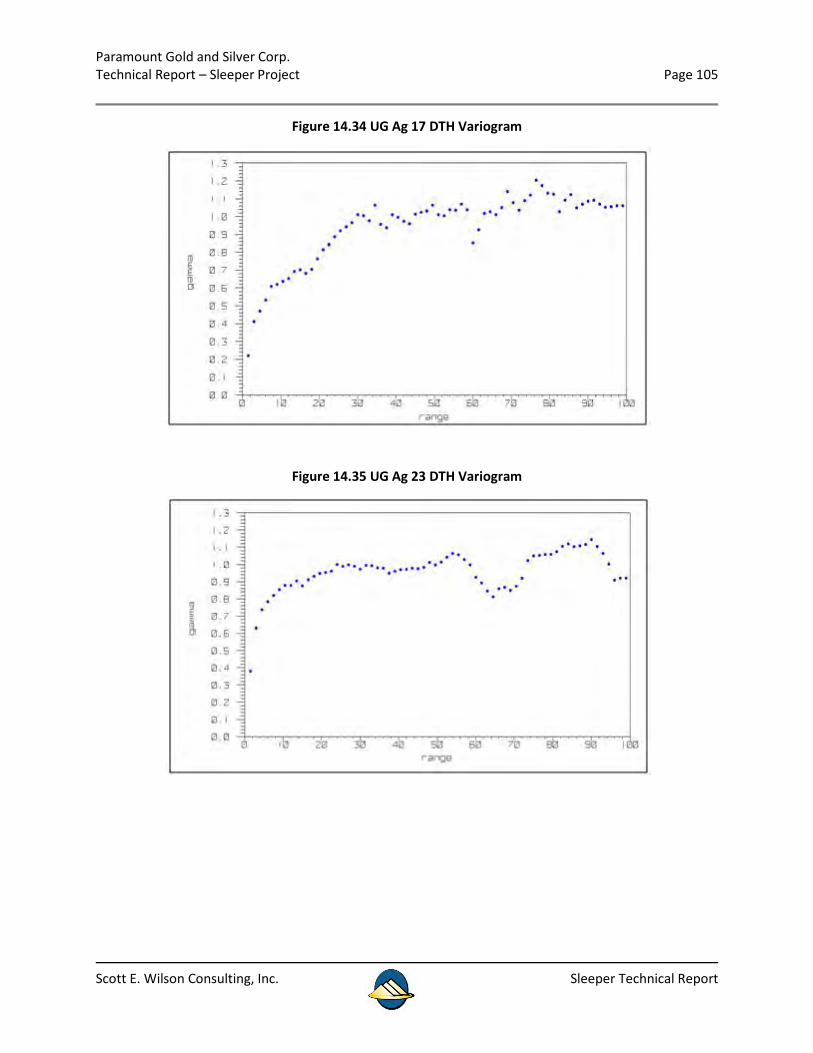
Paramount Gold and Silver Corp. Technical Report – Sleeper Project Page 105
Scott E. Wilson Consulting, Inc. Sleeper Technical Report
Figure 14.34 UG Ag 17 DTH Variogram
Figure 14.35 UG Ag 23 DTH Variogram
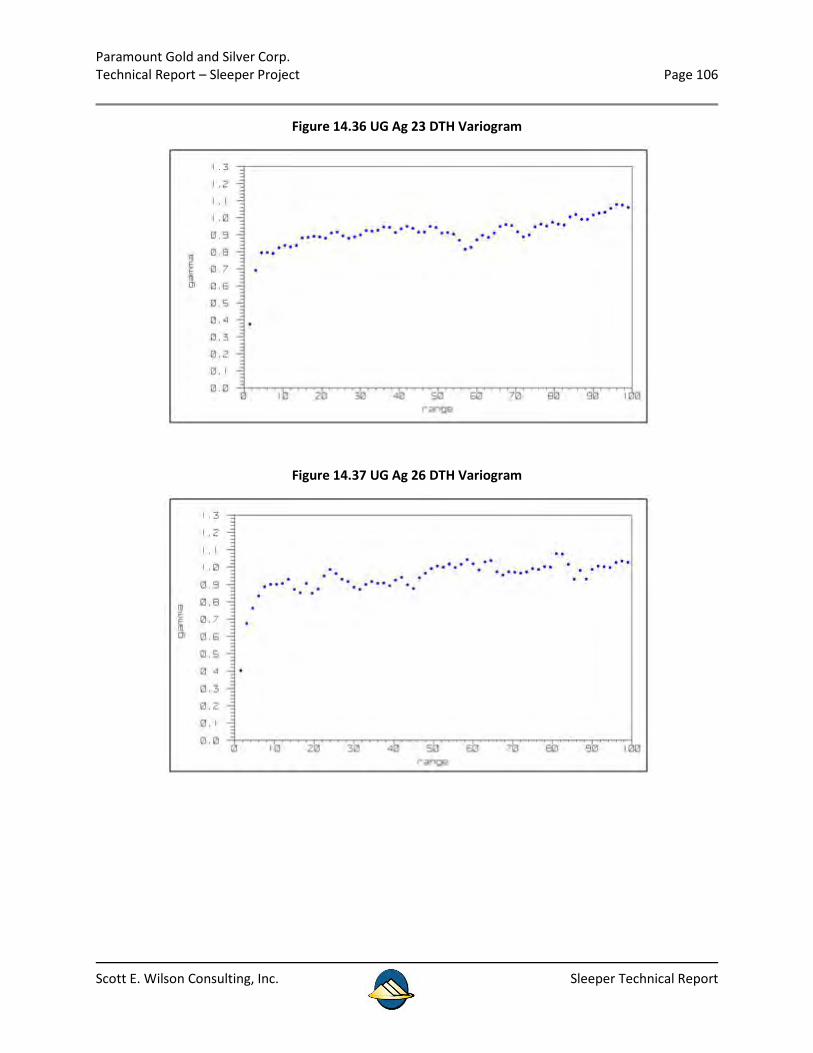
Paramount Gold and Silver Corp. Technical Report – Sleeper Project Page 106
Scott E. Wilson Consulting, Inc. Sleeper Technical Report
Figure 14.36 UG Ag 23 DTH Variogram
Figure 14.37 UG Ag 26 DTH Variogram
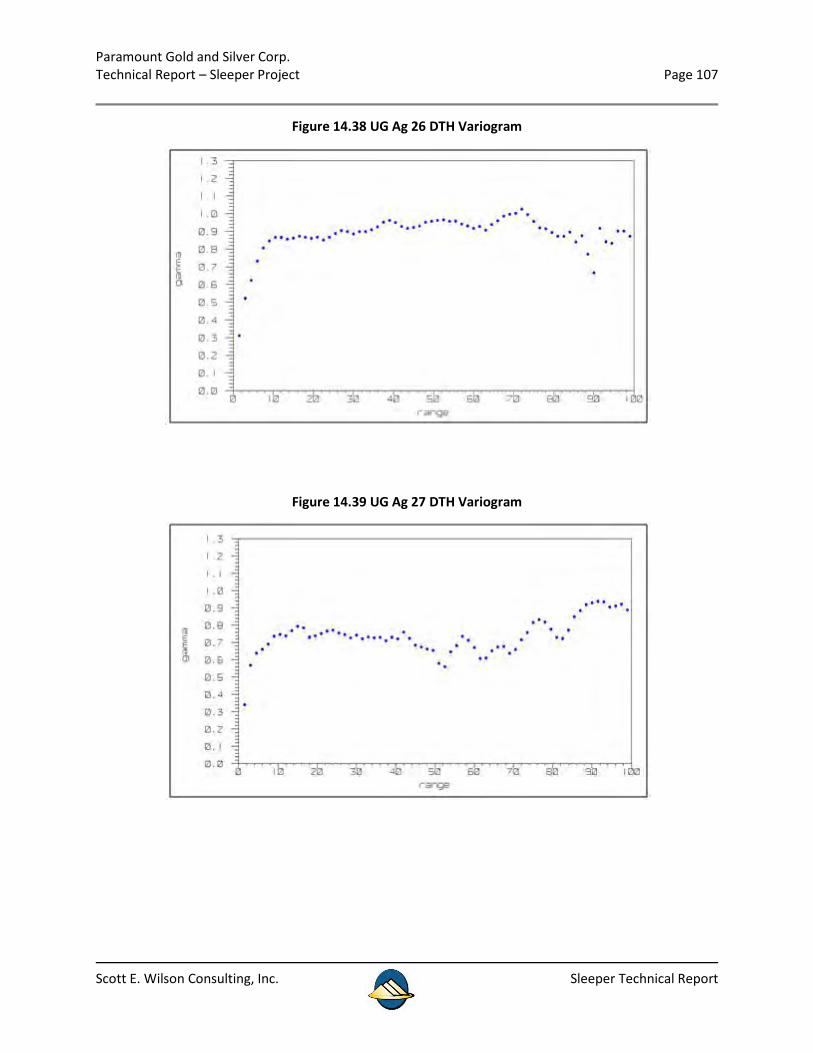
Paramount Gold and Silver Corp. Technical Report – Sleeper Project Page 107
Scott E. Wilson Consulting, Inc. Sleeper Technical Report
Figure 14.38 UG Ag 26 DTH Variogram
Figure 14.39 UG Ag 27 DTH Variogram
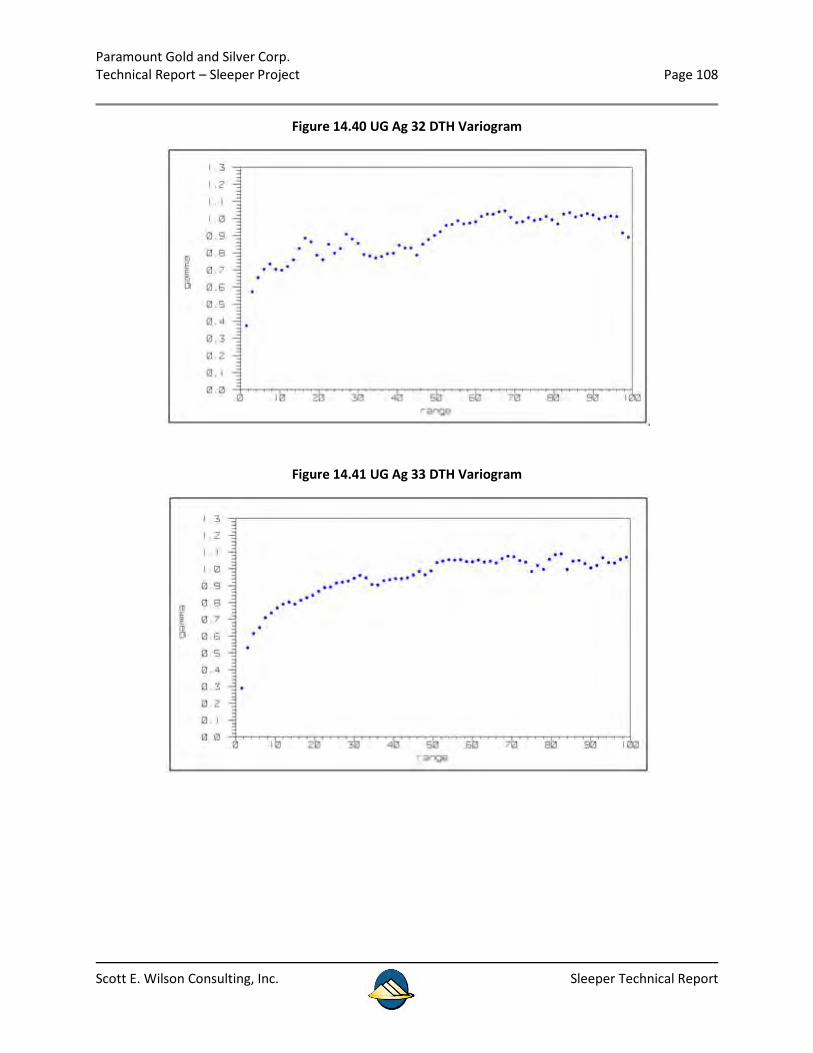
Paramount Gold and Silver Corp. Technical Report – Sleeper Project Page 108
Scott E. Wilson Consulting, Inc. Sleeper Technical Report
Figure 14.40 UG Ag 32 DTH Variogram
Figure 14.41 UG Ag 33 DTH Variogram
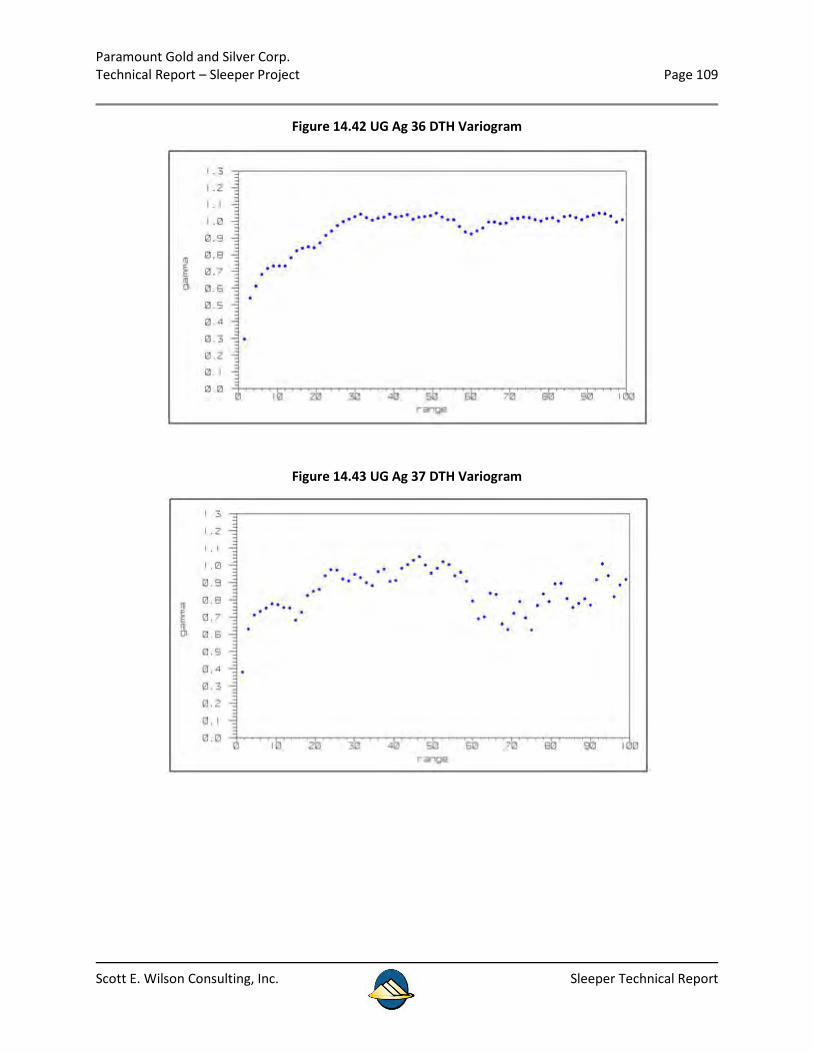
Paramount Gold and Silver Corp. Technical Report – Sleeper Project Page 109
Scott E. Wilson Consulting, Inc. Sleeper Technical Report
Figure 14.42 UG Ag 36 DTH Variogram
Figure 14.43 UG Ag 37 DTH Variogram
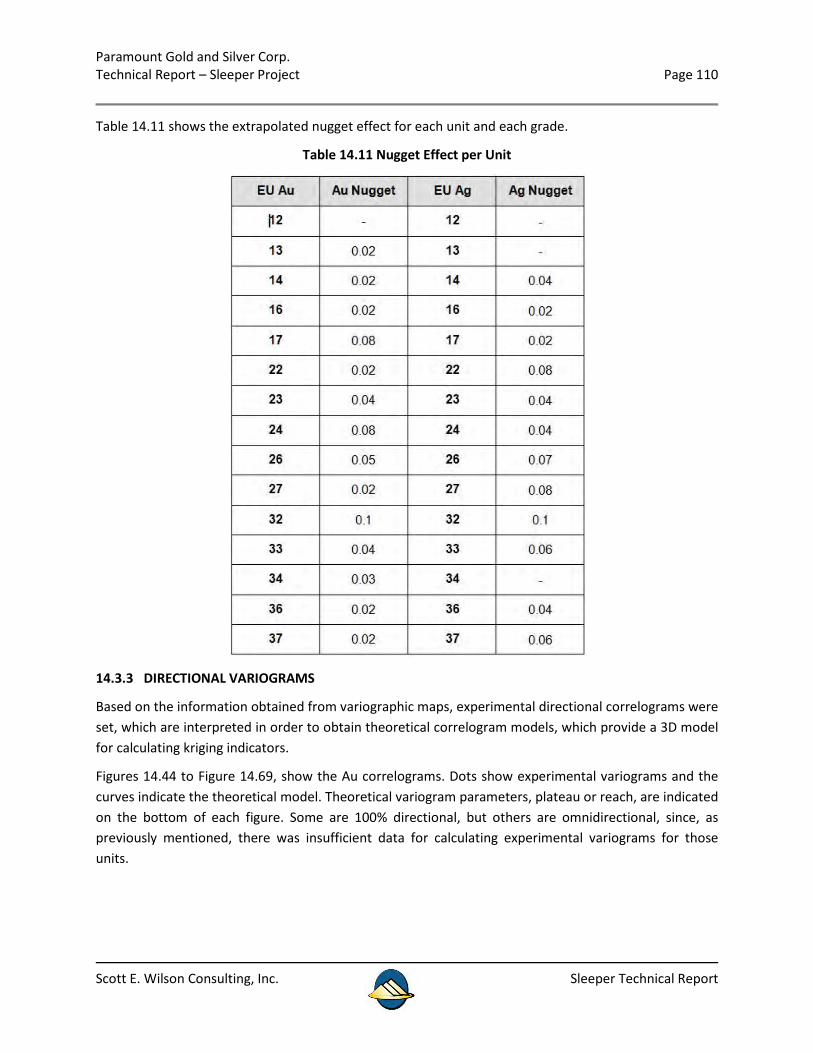
Paramount Gold and Silver Corp. Technical Report – Sleeper Project Page 110
Scott E. Wilson Consulting, Inc. Sleeper Technical Report
Table 14.11 shows the extrapolated nugget effect for each unit and each grade.
Table 14.11 Nugget Effect per Unit
14.3.3 DIRECTIONAL VARIOGRAMS
Based on the information obtained from variographic maps, experimental directional correlograms were set, which are interpreted in order to obtain theoretical correlogram models, which provide a 3D model for calculating kriging indicators.
Figures 14.44 to Figure 14.69, show the Au correlograms. Dots show experimental variograms and the curves indicate the theoretical model. Theoretical variogram parameters, plateau or reach, are indicated on the bottom of each figure. Some are 100% directional, but others are omnidirectional, since, as previously mentioned, there was insufficient data for calculating experimental variograms for those units.
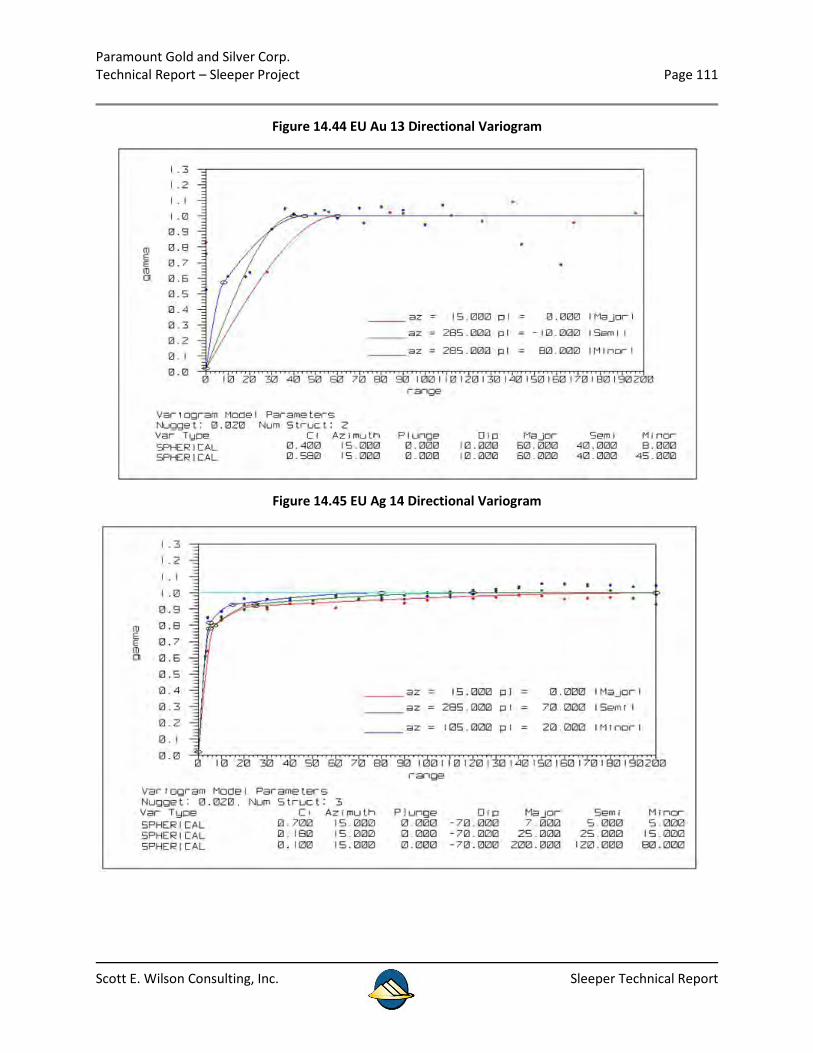
Paramount Gold and Silver Corp. Technical Report – Sleeper Project Page 111
Scott E. Wilson Consulting, Inc. Sleeper Technical Report
Figure 14.44 EU Au 13 Directional Variogram
Figure 14.45 EU Ag 14 Directional Variogram
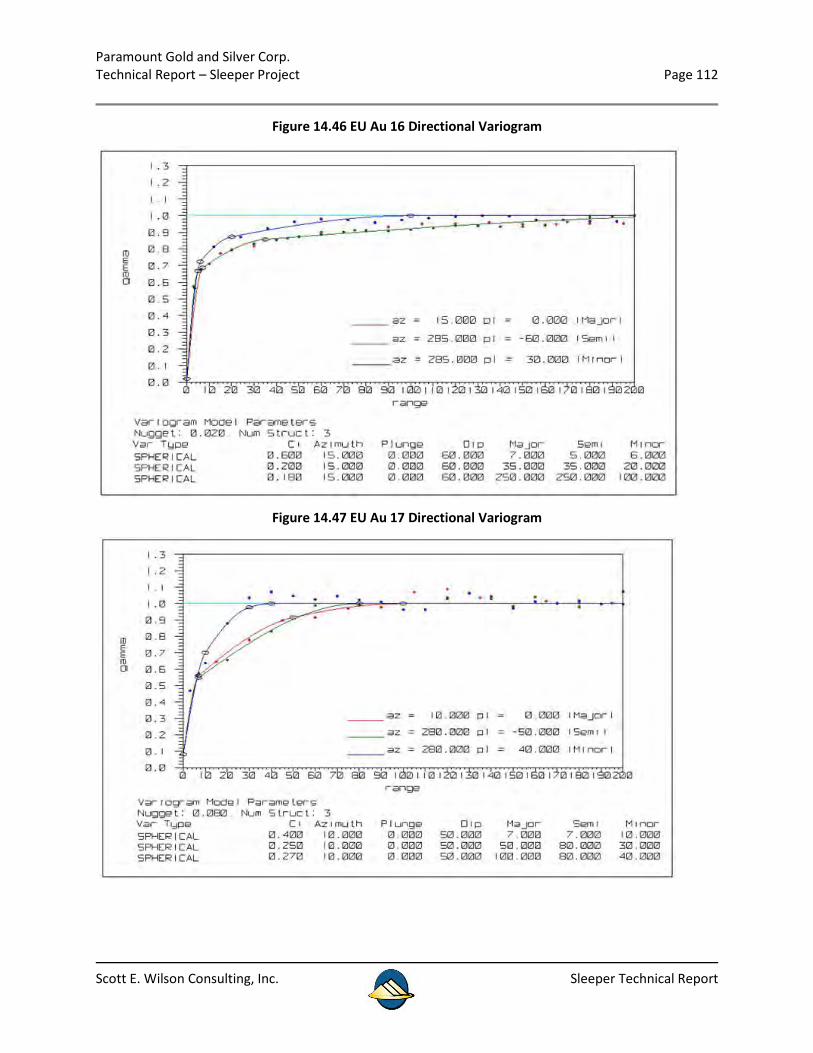
Paramount Gold and Silver Corp. Technical Report – Sleeper Project Page 112
Scott E. Wilson Consulting, Inc. Sleeper Technical Report
Figure 14.46 EU Au 16 Directional Variogram
Figure 14.47 EU Au 17 Directional Variogram
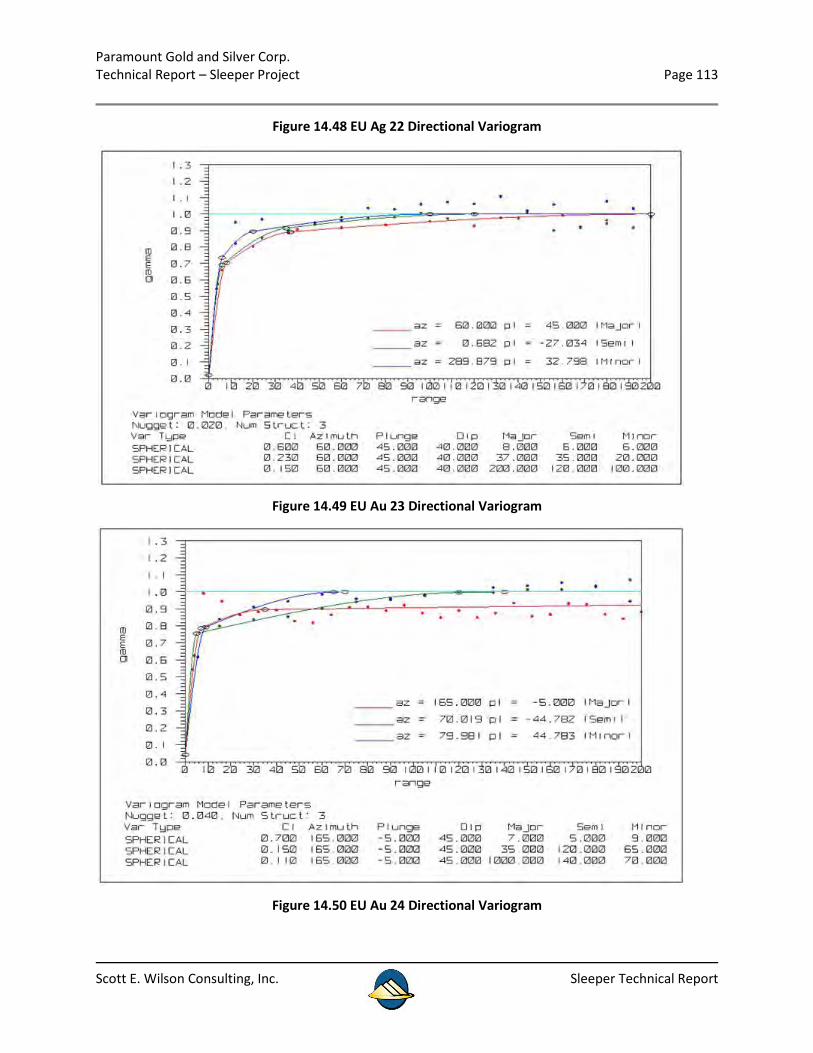
Paramount Gold and Silver Corp. Technical Report – Sleeper Project Page 113
Scott E. Wilson Consulting, Inc. Sleeper Technical Report
Figure 14.48 EU Ag 22 Directional Variogram
Figure 14.49 EU Au 23 Directional Variogram
Figure 14.50 EU Au 24 Directional Variogram
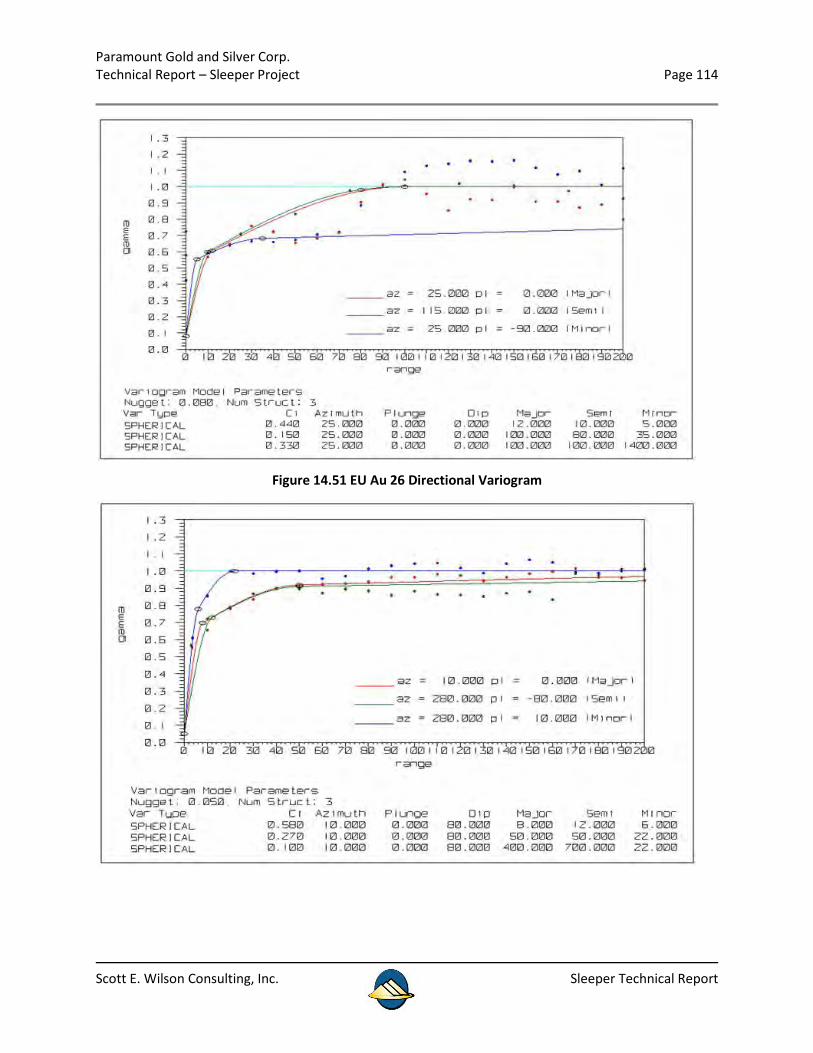
Paramount Gold and Silver Corp. Technical Report – Sleeper Project Page 114
Scott E. Wilson Consulting, Inc. Sleeper Technical Report
Figure 14.51 EU Au 26 Directional Variogram
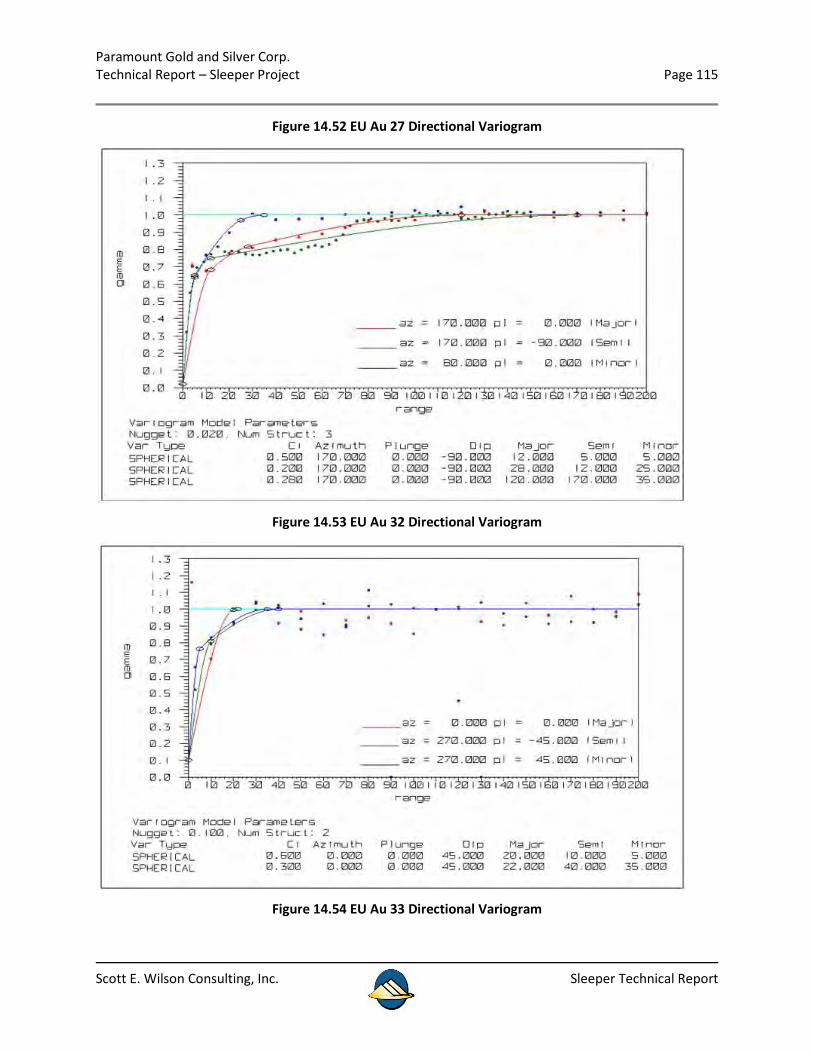
Paramount Gold and Silver Corp. Technical Report – Sleeper Project Page 115
Scott E. Wilson Consulting, Inc. Sleeper Technical Report
Figure 14.52 EU Au 27 Directional Variogram
Figure 14.53 EU Au 32 Directional Variogram
Figure 14.54 EU Au 33 Directional Variogram
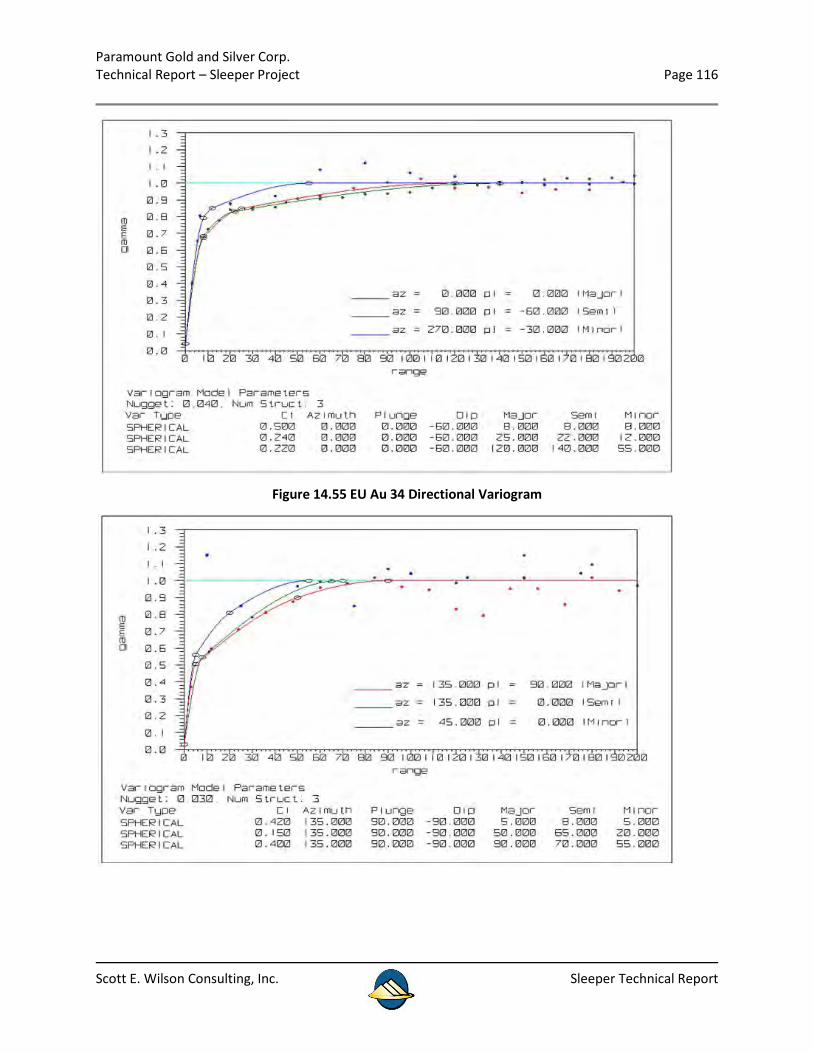
Paramount Gold and Silver Corp. Technical Report – Sleeper Project Page 116
Scott E. Wilson Consulting, Inc. Sleeper Technical Report
Figure 14.55 EU Au 34 Directional Variogram
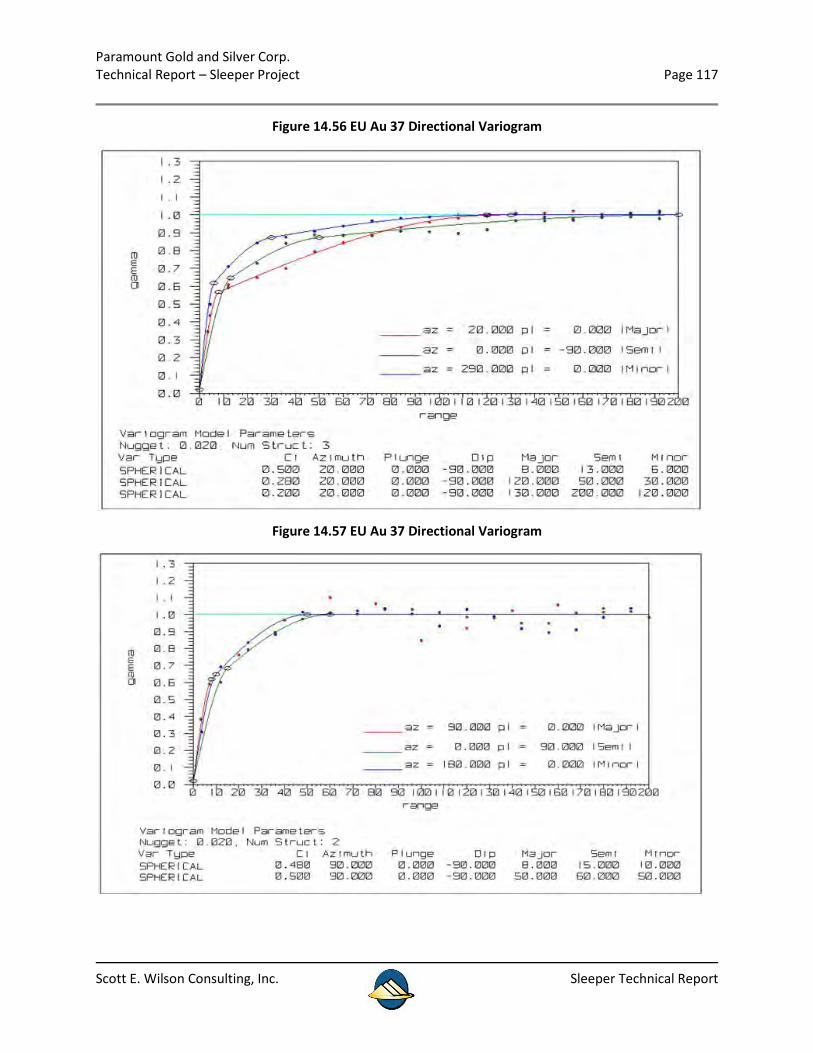
Paramount Gold and Silver Corp. Technical Report – Sleeper Project Page 117
Scott E. Wilson Consulting, Inc. Sleeper Technical Report
Figure 14.56 EU Au 37 Directional Variogram
Figure 14.57 EU Au 37 Directional Variogram
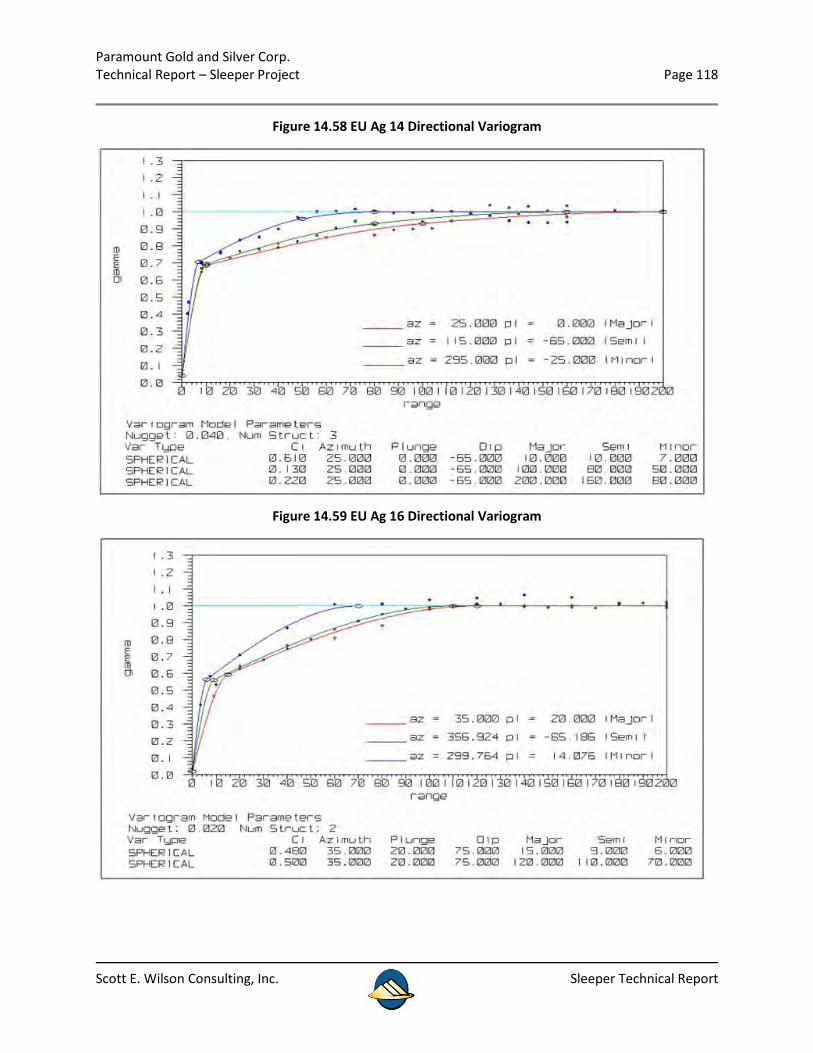
Paramount Gold and Silver Corp. Technical Report – Sleeper Project Page 118
Scott E. Wilson Consulting, Inc. Sleeper Technical Report
Figure 14.58 EU Ag 14 Directional Variogram
Figure 14.59 EU Ag 16 Directional Variogram
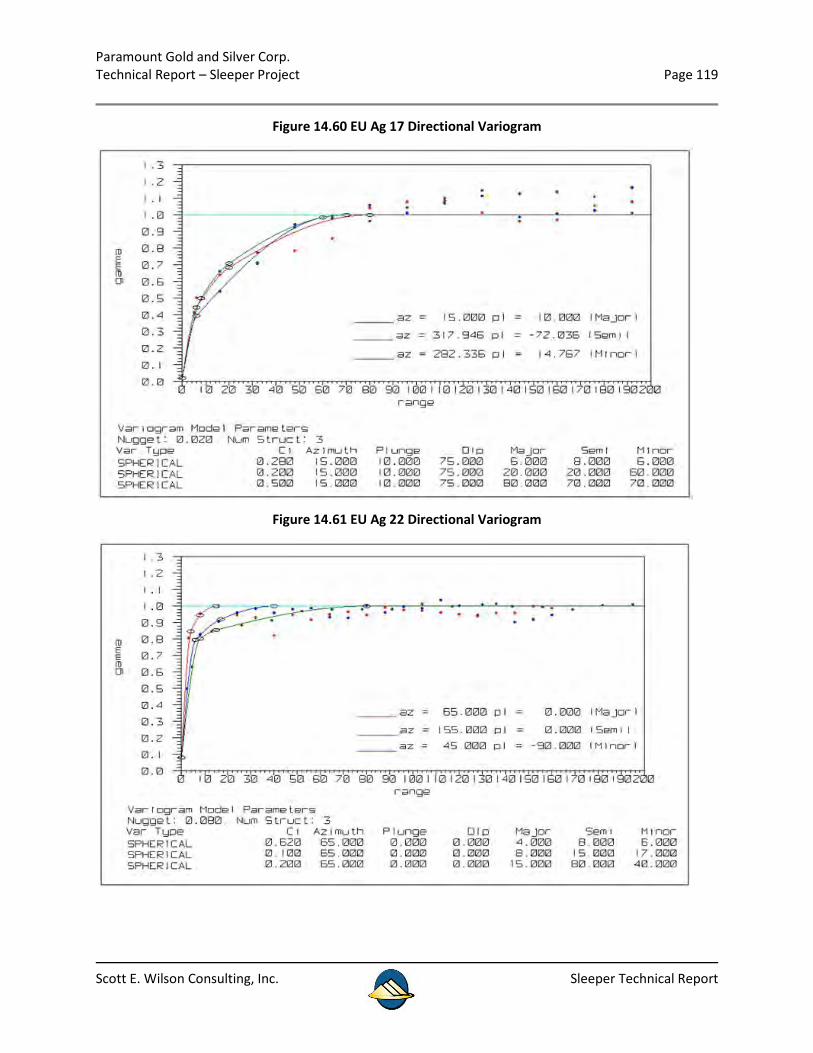
Paramount Gold and Silver Corp. Technical Report – Sleeper Project Page 119
Scott E. Wilson Consulting, Inc. Sleeper Technical Report
Figure 14.60 EU Ag 17 Directional Variogram
Figure 14.61 EU Ag 22 Directional Variogram
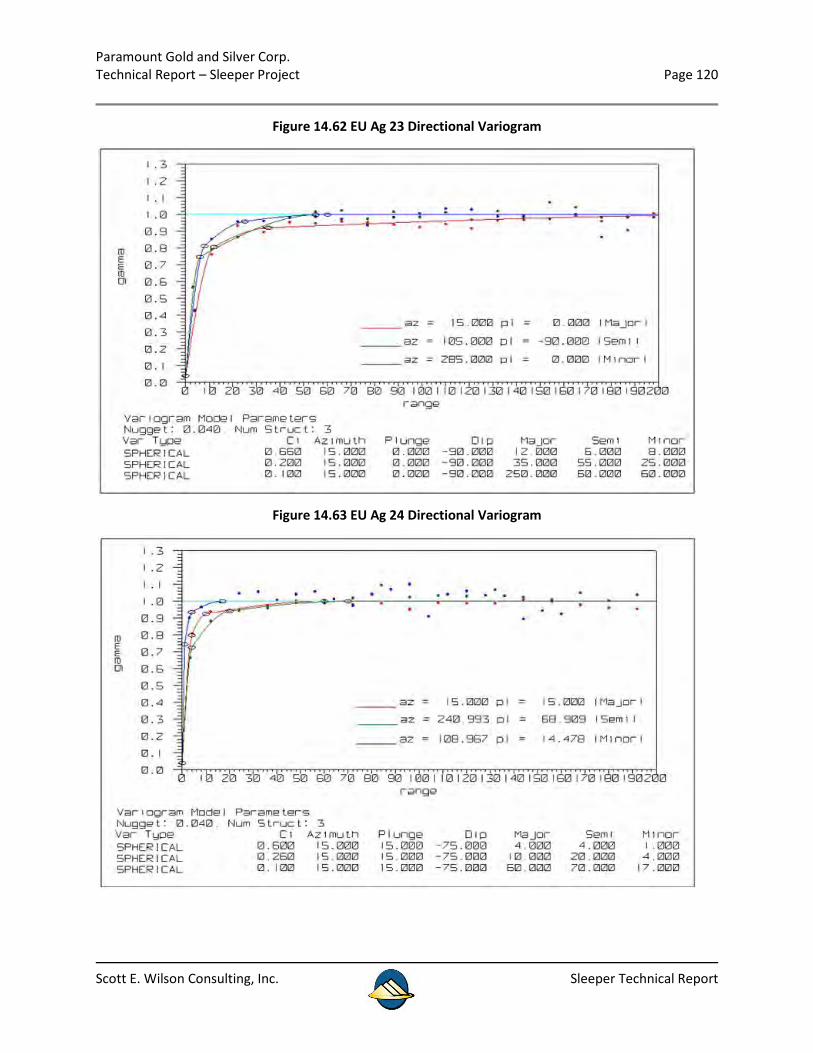
Paramount Gold and Silver Corp. Technical Report – Sleeper Project Page 120
Scott E. Wilson Consulting, Inc. Sleeper Technical Report
Figure 14.62 EU Ag 23 Directional Variogram
Figure 14.63 EU Ag 24 Directional Variogram
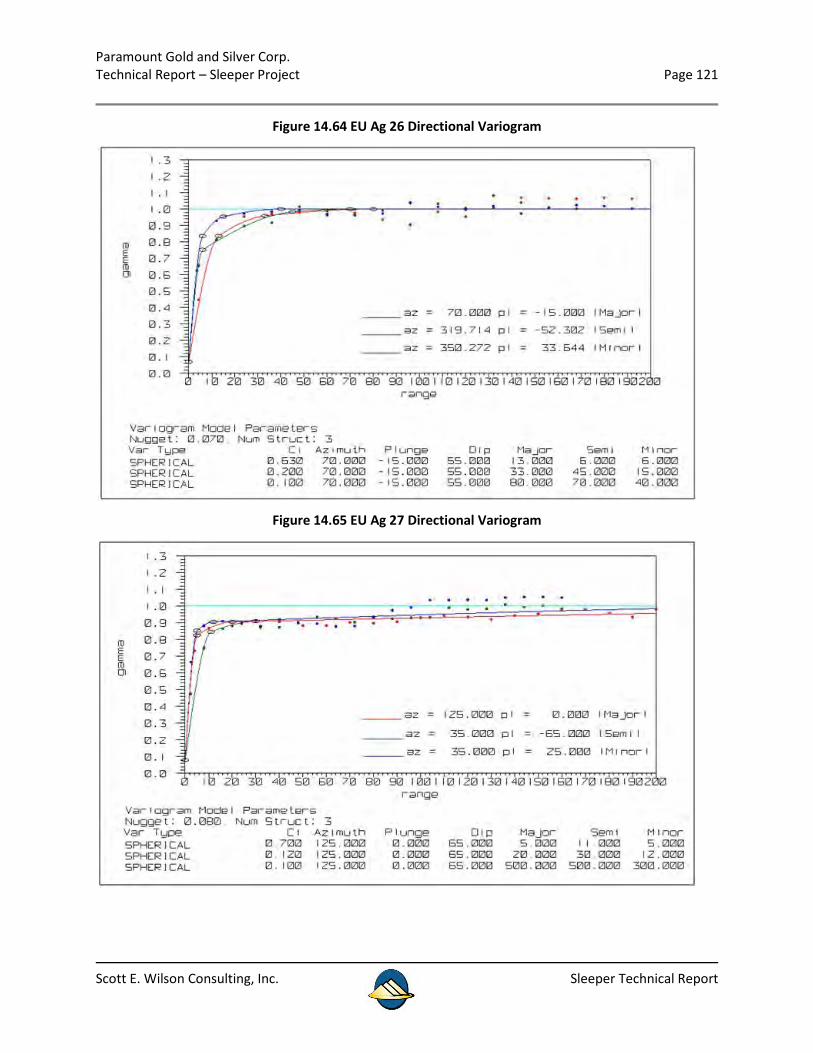
Paramount Gold and Silver Corp. Technical Report – Sleeper Project Page 121
Scott E. Wilson Consulting, Inc. Sleeper Technical Report
Figure 14.64 EU Ag 26 Directional Variogram
Figure 14.65 EU Ag 27 Directional Variogram
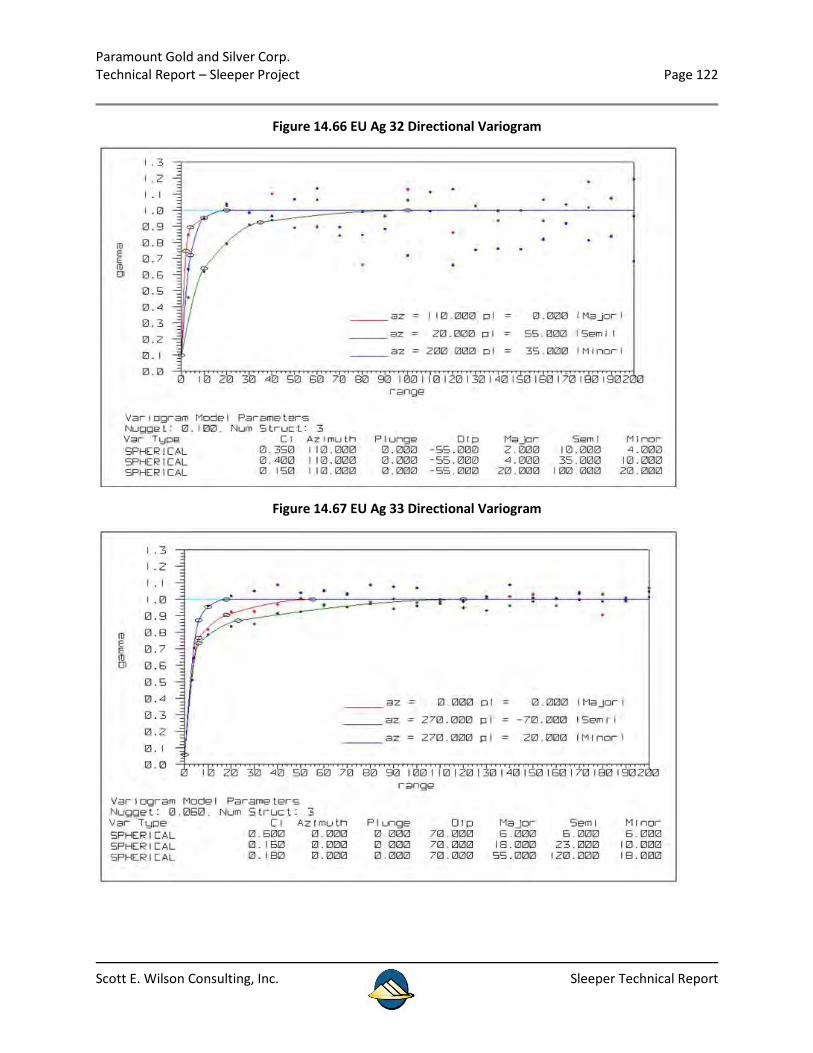
Paramount Gold and Silver Corp. Technical Report – Sleeper Project Page 122
Scott E. Wilson Consulting, Inc. Sleeper Technical Report
Figure 14.66 EU Ag 32 Directional Variogram
Figure 14.67 EU Ag 33 Directional Variogram
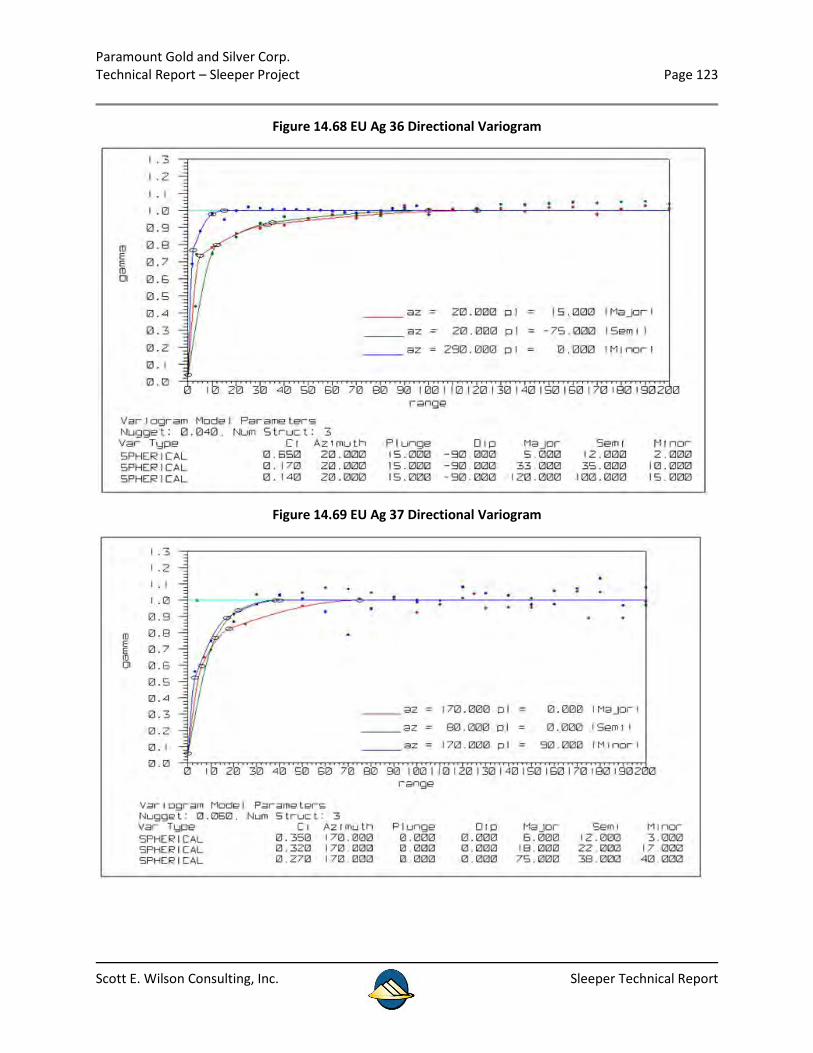
Paramount Gold and Silver Corp. Technical Report – Sleeper Project Page 123
Scott E. Wilson Consulting, Inc. Sleeper Technical Report
Figure 14.68 EU Ag 36 Directional Variogram
Figure 14.69 EU Ag 37 Directional Variogram
Paramount Gold and Silver Corp. Technical Report – Sleeper Project Page 124
Scott E. Wilson Consulting, Inc. Sleeper Technical Report
14.4 AU AND AG RESOURCE ESTIMATION
A block model with sub-cells was constructed in order to perform the resource estimation using ordinary kriging. Each unit was estimated separately because hard boundaries were used in all cases. Validations were conducted to review the information of the nearest neighbor for global bias and drift, whereas for the general neighborhood review (where blocks around drillholes are also included), composited samples of 1.5 m were used. In order to limit the influence of very high grades, capping was performed on each estimation unit.
14.4.1 BLOCK MODEL
The block model with sub-cells was used for storing Au and Ag grades, named “MB_Sleeper_0711_Au_SC_placer.bmf”. Coordinates and data for construction are the following:
• X origin: 411,150 meters • Y origin: 4,574,350 meters • Z origin: 500 meters • Bearing: 90° • Plunge: 0° • Dip: 0° • Block size: 2.5x2.5x2.5 meters (minimum)* • Block size: 50x50x50 meters (maximum) • X distance: 1,950 meters • Y distance: 3,200 meters • Z distance: 900 meters
* = máximum size of block when it is inside a gold vein of 10x10x10 meters.
The most important model characteristics are:
• Au: gold grades in ppm • Ag: silver grades in ppm • Sec_au: Indicates the sector that is associated with the block for gold
o 1: Sleeper o 2: Facility o 3: West Wood
Paramount Gold and Silver Corp. Technical Report – Sleeper Project Page 125
Scott E. Wilson Consulting, Inc. Sleeper Technical Report
• Sec_ag: Indicates the sector that is associated with the block for silver o 1: Sleeper o 2: Facility o 3: West Wood
• Dom_au: Indicates the domain that is associated with the block for gold o 1: shell gold 0.1 ppm o 3: shell gold 0.3 ppm o 10: shell gold 1 ppm
• Dom_ag: Indicates the domain that is associated with the block for silver o 2: shell silver 2 ppm o 10: shell silver 10 ppm
• Ug_Au: Indicates geology unit for estimation gold • Ug_Ag: Indicates geology unit for estimation silver • Categ: Indicates the categorization
o 1: measured o 2: indicated o 3: inferred
• Topo: Indicates the proportion of insitu rock of the block (1=rock, 0=air) • Lito_s: Indicates the rock type • Minz: Indicates the mineral zone type • Densidad: Indicates the density (tonnes/m3)
14.4.2 HIGH GRADE VALUES
In order to avoid over estimation produced by high grade values, a restricted search radius was used for those high gold and silver values. Table 14.12, lists the threshold for those values while the restricted search radius used is detailed in the estimation plan in Appendix D. Additionally, maximum values for gold and silver were set and a cap was applied, as shown in Table 14.12.
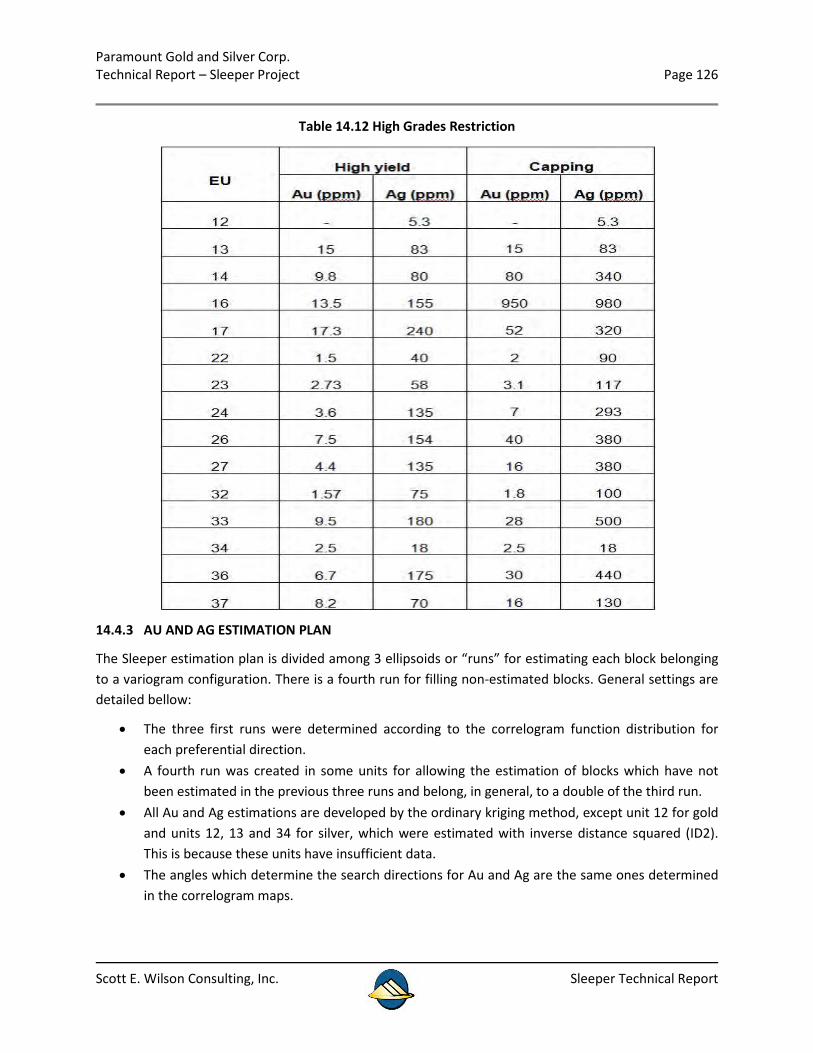
Paramount Gold and Silver Corp. Technical Report – Sleeper Project Page 126
Scott E. Wilson Consulting, Inc. Sleeper Technical Report
Table 14.12 High Grades Restriction
14.4.3 AU AND AG ESTIMATION PLAN
The Sleeper estimation plan is divided among 3 ellipsoids or “runs” for estimating each block belonging to a variogram configuration. There is a fourth run for filling non-estimated blocks. General settings are detailed bellow:
• The three first runs were determined according to the correlogram function distribution for each preferential direction.
• A fourth run was created in some units for allowing the estimation of blocks which have not been estimated in the previous three runs and belong, in general, to a double of the third run.
• All Au and Ag estimations are developed by the ordinary kriging method, except unit 12 for gold and units 12, 13 and 34 for silver, which were estimated with inverse distance squared (ID2). This is because these units have insufficient data.
• The angles which determine the search directions for Au and Ag are the same ones determined in the correlogram maps.

Paramount Gold and Silver Corp. Technical Report – Sleeper Project Page 127
Scott E. Wilson Consulting, Inc. Sleeper Technical Report
• Since the deposit has disseminated mineralization as well as in structures, it was decided to use capping for very high grades and erratic values.
• The estimation file denomination has the following configuration: Project Name> + <ko_ugau> + <value of EU> .bef For example: sleko_ugau12.bef
• Each BEF has 3 or 4 ID’s which belong to each estimation run. • In order to estimate, a small ellipsoid and non-grade restriction were used.
The estimation plan for Au grades is shown in Table 14-13 and the estimation plan for silver grades is shown in Table 14-14.
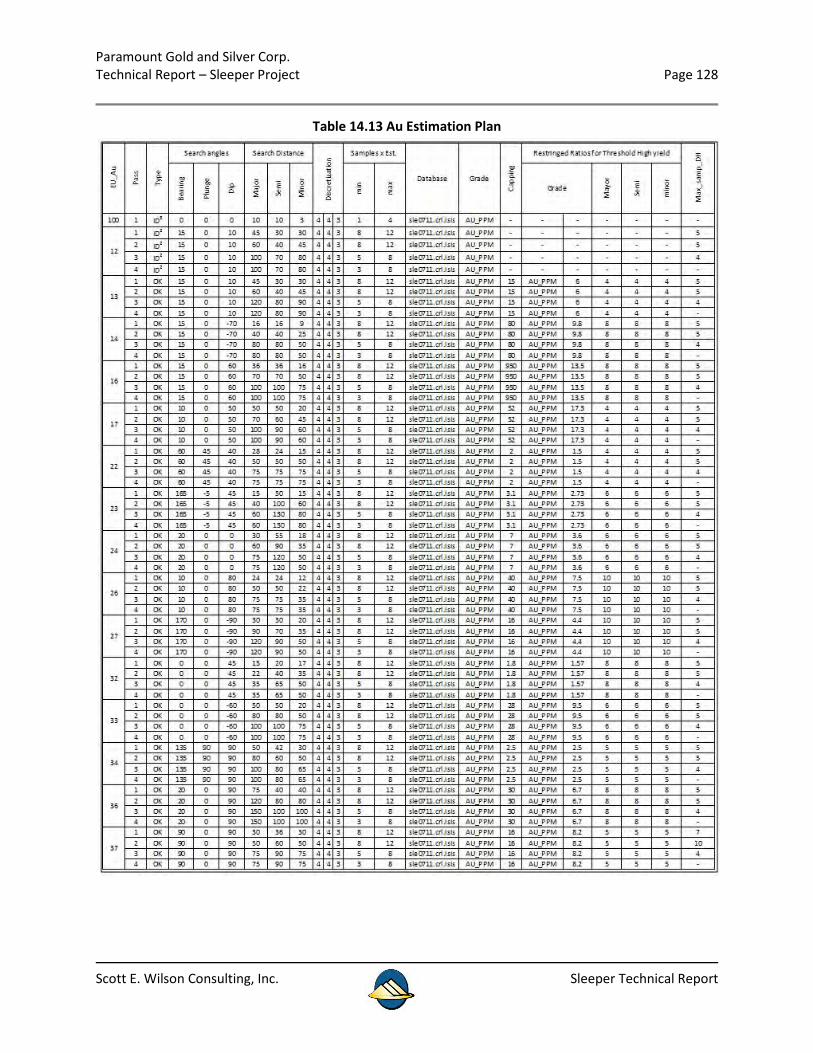
Paramount Gold and Silver Corp. Technical Report – Sleeper Project Page 128
Scott E. Wilson Consulting, Inc. Sleeper Technical Report
Table 14.13 Au Estimation Plan
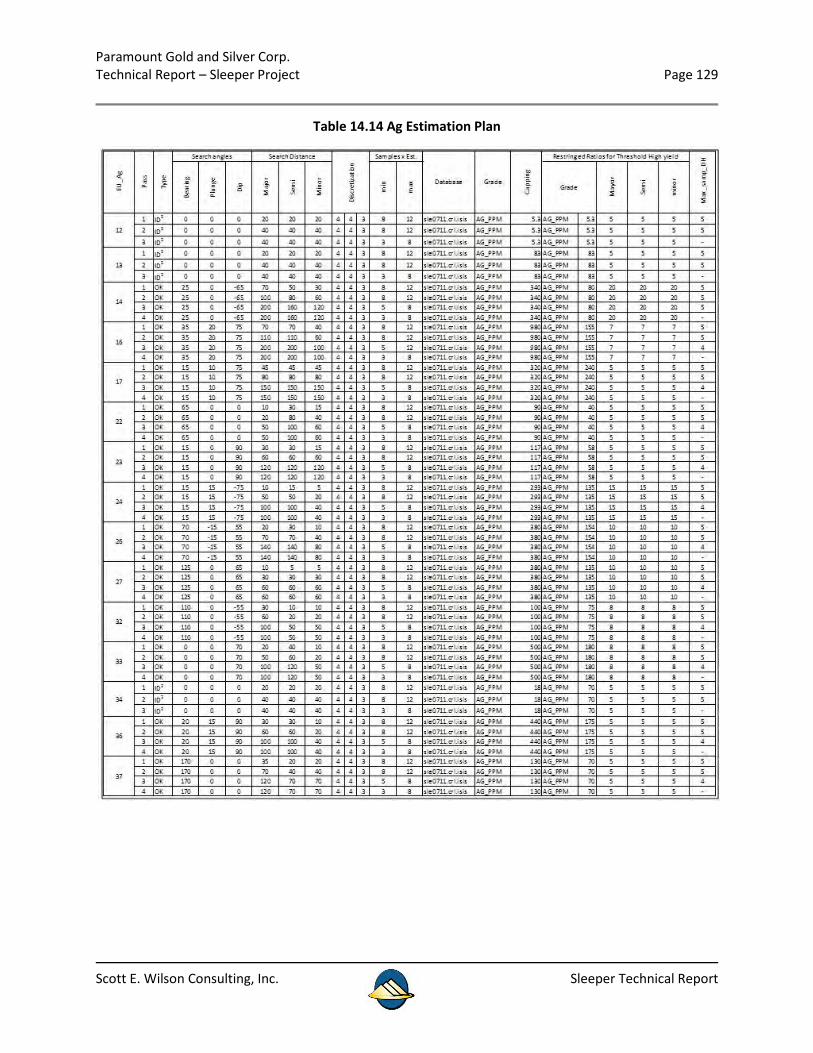
Paramount Gold and Silver Corp. Technical Report – Sleeper Project Page 129
Scott E. Wilson Consulting, Inc. Sleeper Technical Report
Table 14.14 Ag Estimation Plan
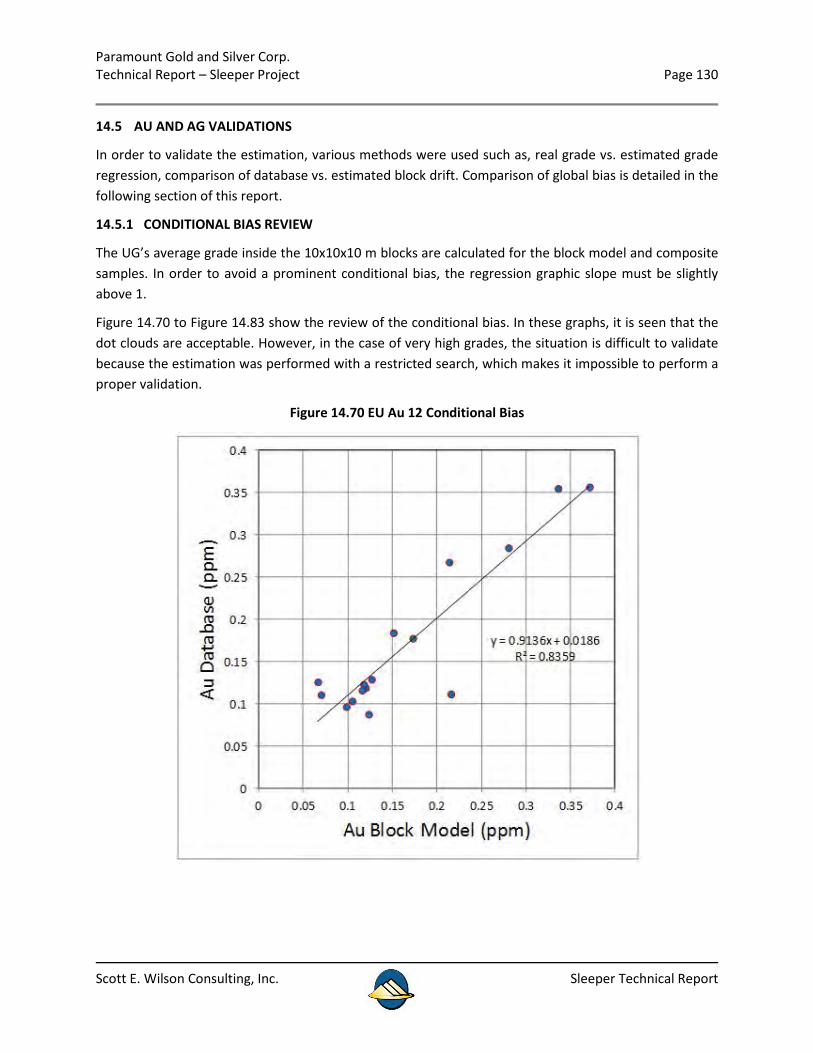
Paramount Gold and Silver Corp. Technical Report – Sleeper Project Page 130
Scott E. Wilson Consulting, Inc. Sleeper Technical Report
14.5 AU AND AG VALIDATIONS
In order to validate the estimation, various methods were used such as, real grade vs. estimated grade regression, comparison of database vs. estimated block drift. Comparison of global bias is detailed in the following section of this report.
14.5.1 CONDITIONAL BIAS REVIEW
The UG’s average grade inside the 10x10x10 m blocks are calculated for the block model and composite samples. In order to avoid a prominent conditional bias, the regression graphic slope must be slightly above 1.
Figure 14.70 to Figure 14.83 show the review of the conditional bias. In these graphs, it is seen that the dot clouds are acceptable. However, in the case of very high grades, the situation is difficult to validate because the estimation was performed with a restricted search, which makes it impossible to perform a proper validation.
Figure 14.70 EU Au 12 Conditional Bias
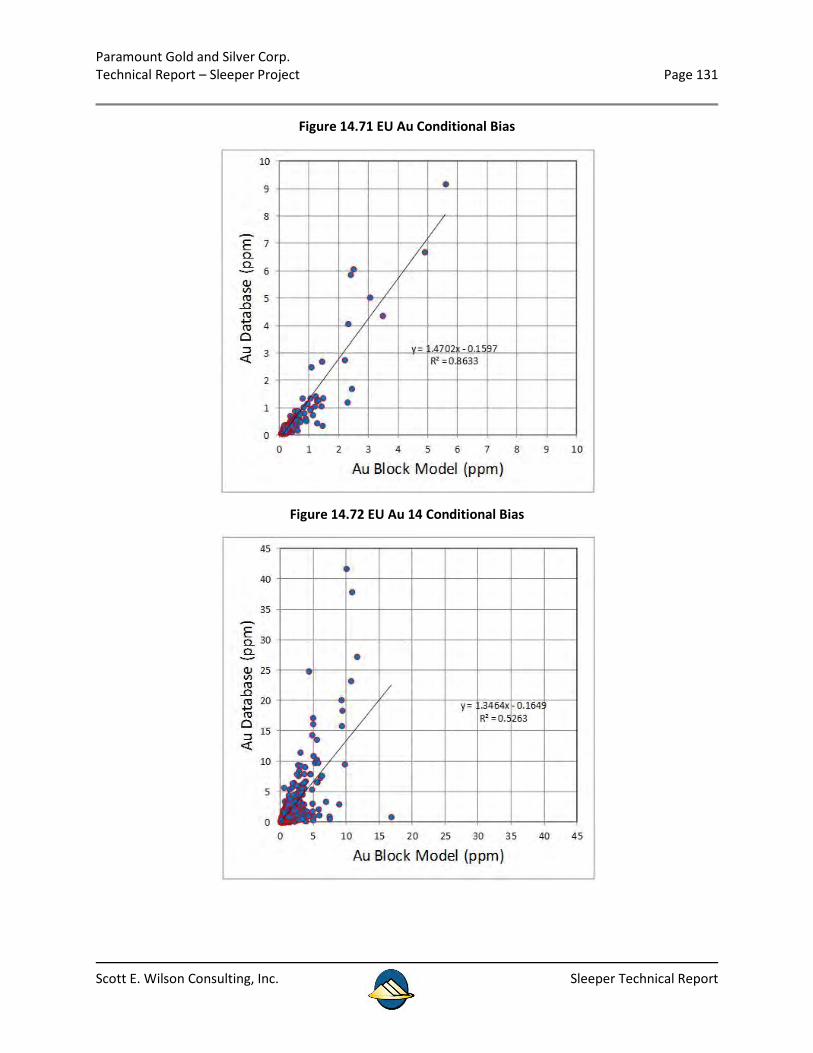
Paramount Gold and Silver Corp. Technical Report – Sleeper Project Page 131
Scott E. Wilson Consulting, Inc. Sleeper Technical Report
Figure 14.71 EU Au Conditional Bias
Figure 14.72 EU Au 14 Conditional Bias
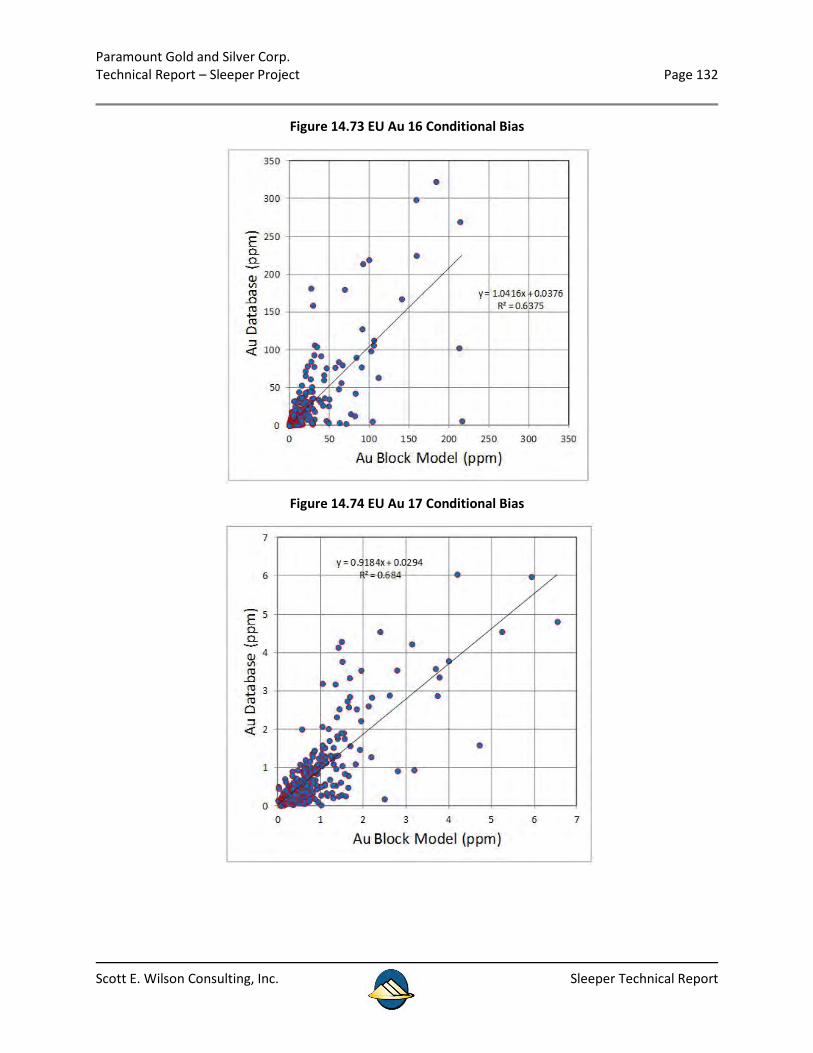
Paramount Gold and Silver Corp. Technical Report – Sleeper Project Page 132
Scott E. Wilson Consulting, Inc. Sleeper Technical Report
Figure 14.73 EU Au 16 Conditional Bias
Figure 14.74 EU Au 17 Conditional Bias
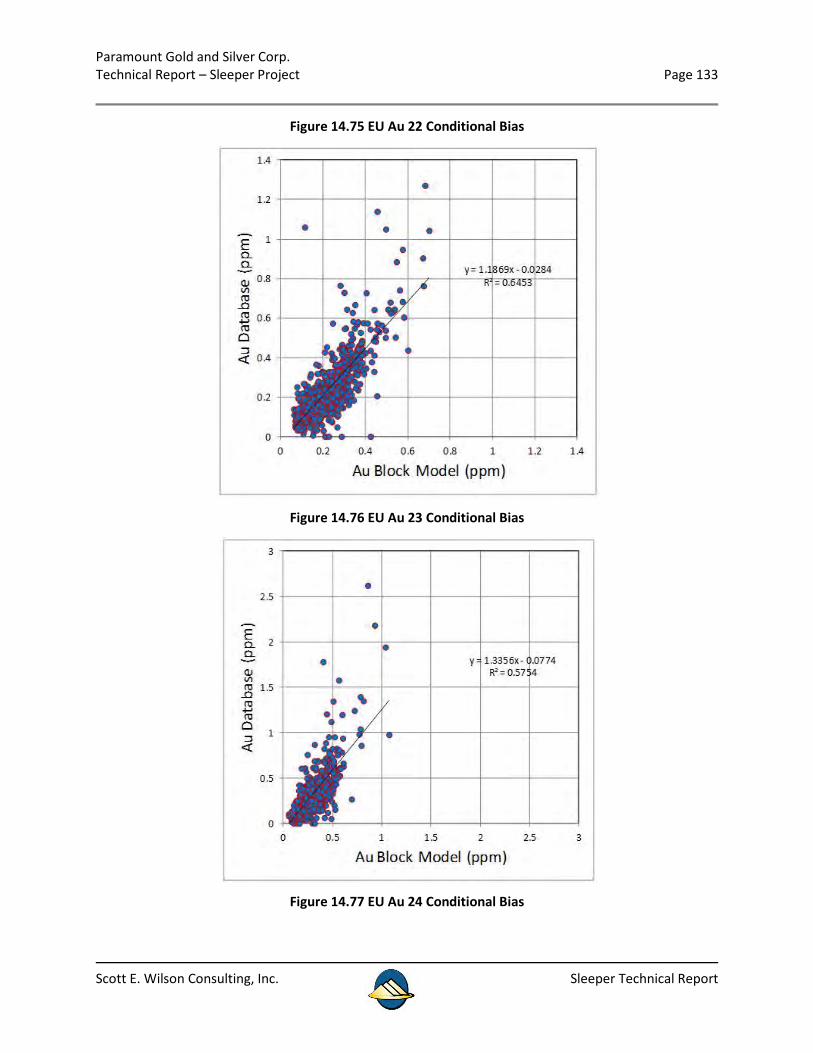
Paramount Gold and Silver Corp. Technical Report – Sleeper Project Page 133
Scott E. Wilson Consulting, Inc. Sleeper Technical Report
Figure 14.75 EU Au 22 Conditional Bias
Figure 14.76 EU Au 23 Conditional Bias
Figure 14.77 EU Au 24 Conditional Bias
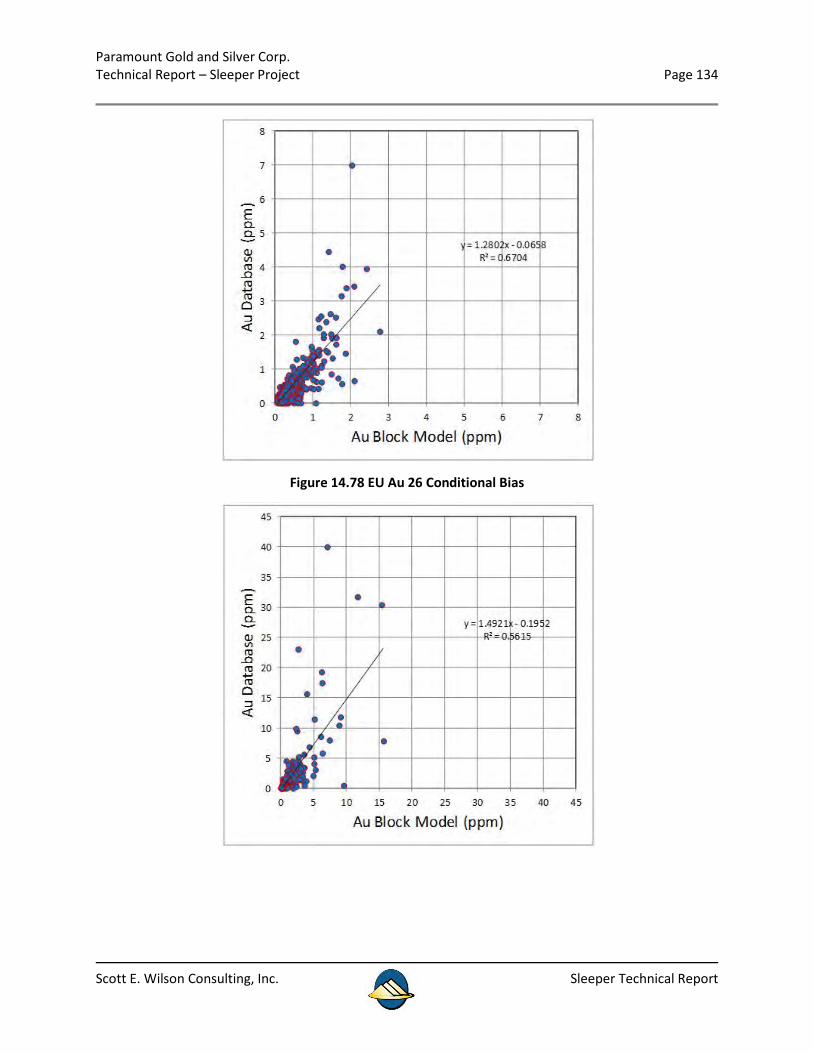
Paramount Gold and Silver Corp. Technical Report – Sleeper Project Page 134
Scott E. Wilson Consulting, Inc. Sleeper Technical Report
Figure 14.78 EU Au 26 Conditional Bias
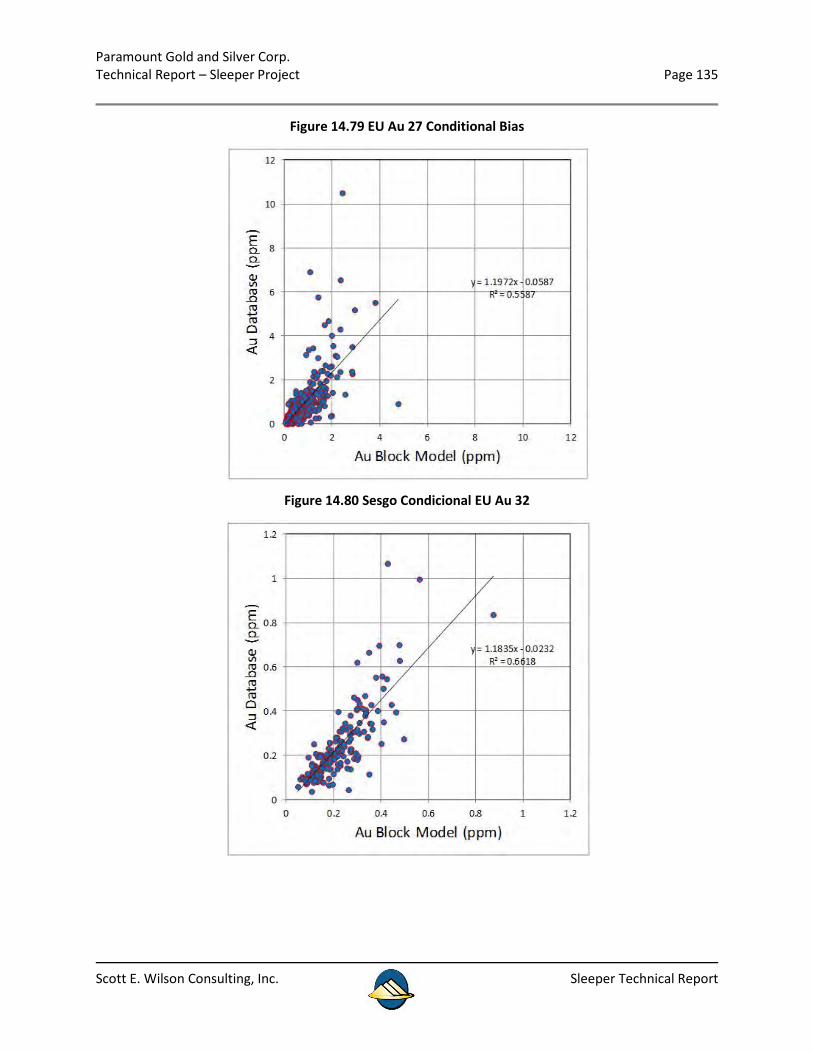
Paramount Gold and Silver Corp. Technical Report – Sleeper Project Page 135
Scott E. Wilson Consulting, Inc. Sleeper Technical Report
Figure 14.79 EU Au 27 Conditional Bias
Figure 14.80 Sesgo Condicional EU Au 32
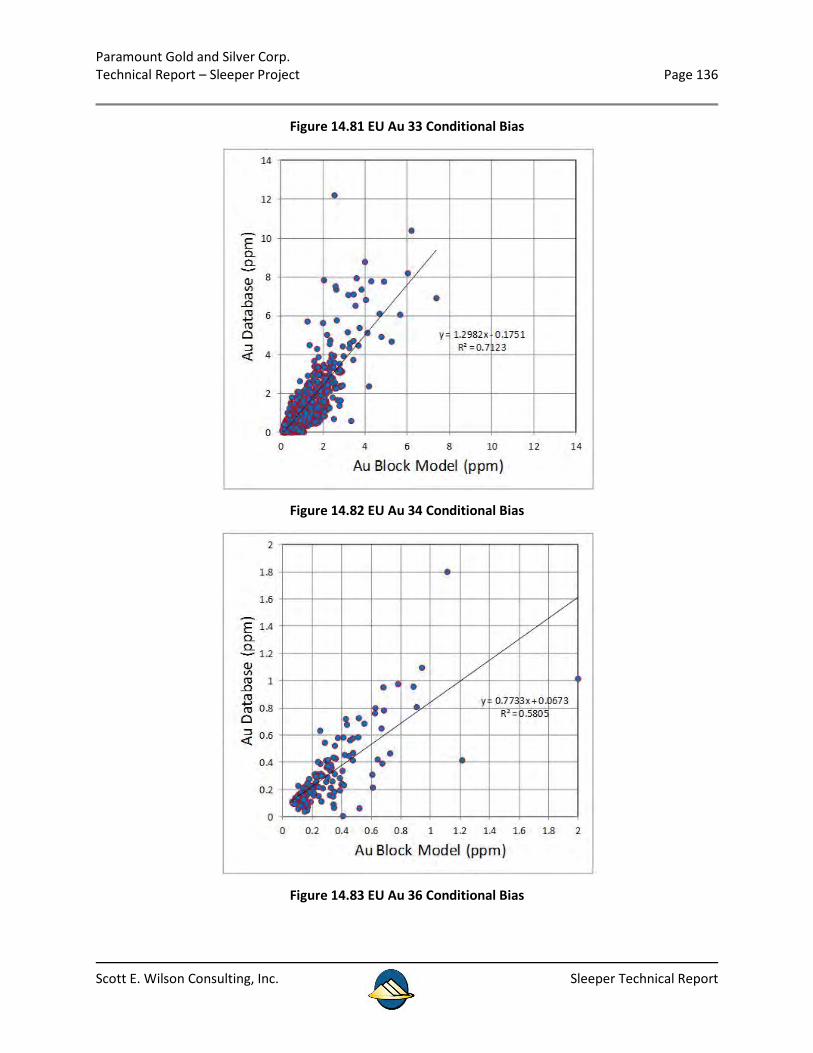
Paramount Gold and Silver Corp. Technical Report – Sleeper Project Page 136
Scott E. Wilson Consulting, Inc. Sleeper Technical Report
Figure 14.81 EU Au 33 Conditional Bias
Figure 14.82 EU Au 34 Conditional Bias
Figure 14.83 EU Au 36 Conditional Bias
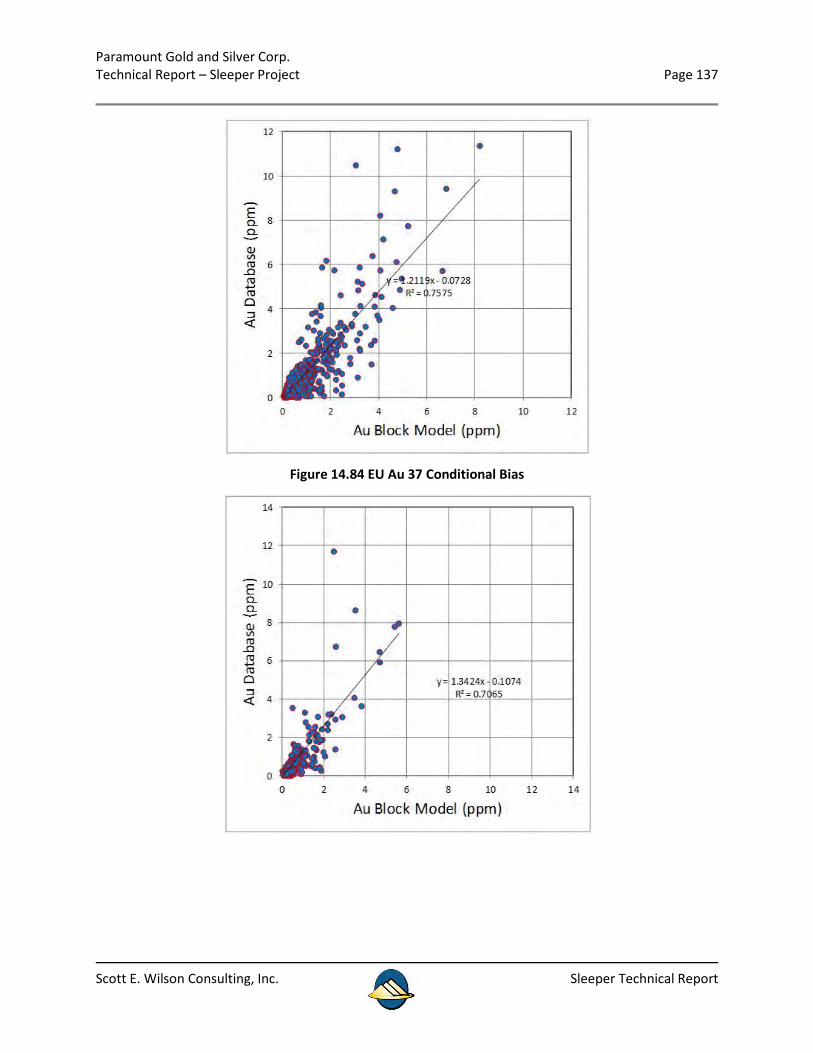
Paramount Gold and Silver Corp. Technical Report – Sleeper Project Page 137
Scott E. Wilson Consulting, Inc. Sleeper Technical Report
Figure 14.84 EU Au 37 Conditional Bias
Paramount Gold and Silver Corp. Technical Report – Sleeper Project Page 138
Scott E. Wilson Consulting, Inc. Sleeper Technical Report
14.6 RESOURCE CLASSIFICATION
Gold correlograms were used to classify resources and the following conditions were used:
• In order for blocks to be considered as a measured resource, the average estimation distance must be less than or equal to 28 metres. This data is taken from correlograms where at least 90% of the plateau value is appropriate. Furthermore, the block should be estimated using at least two drillholes.
• In order for blocks to be considered as an indicated resource, the average estimation distance must be less than or equal to 40 metres and greater than 28 metres. This data is taken from correlograms, where at least 100% of the plateau value is appropriate. Furthermore, the block should be estimated using at least two drillholes.
• In order for blocks to be considered as an inferred resource, the block must only be estimated for gold and may not be considered as either measured or indicated resources.
Table 14.15 shows the resource category values set in the block model for characterization.
Table 14.15 Resource Characterization Values CATEG Value
Measured 1 Indicated 2 Inferred 3
14.7 MINERAL ZONE
Indicator kriging was performed in order to differentiate the mineral zones and data from the mineral zones in the data base were used, namely, oxide, mixed and sulphide. After a data analysis, the decision was made to combine oxides and mixed and use the combined term, “oxides”.
Two indicator variograms were created, one for oxides and the other for sulphides. This is shown in the two figures below.
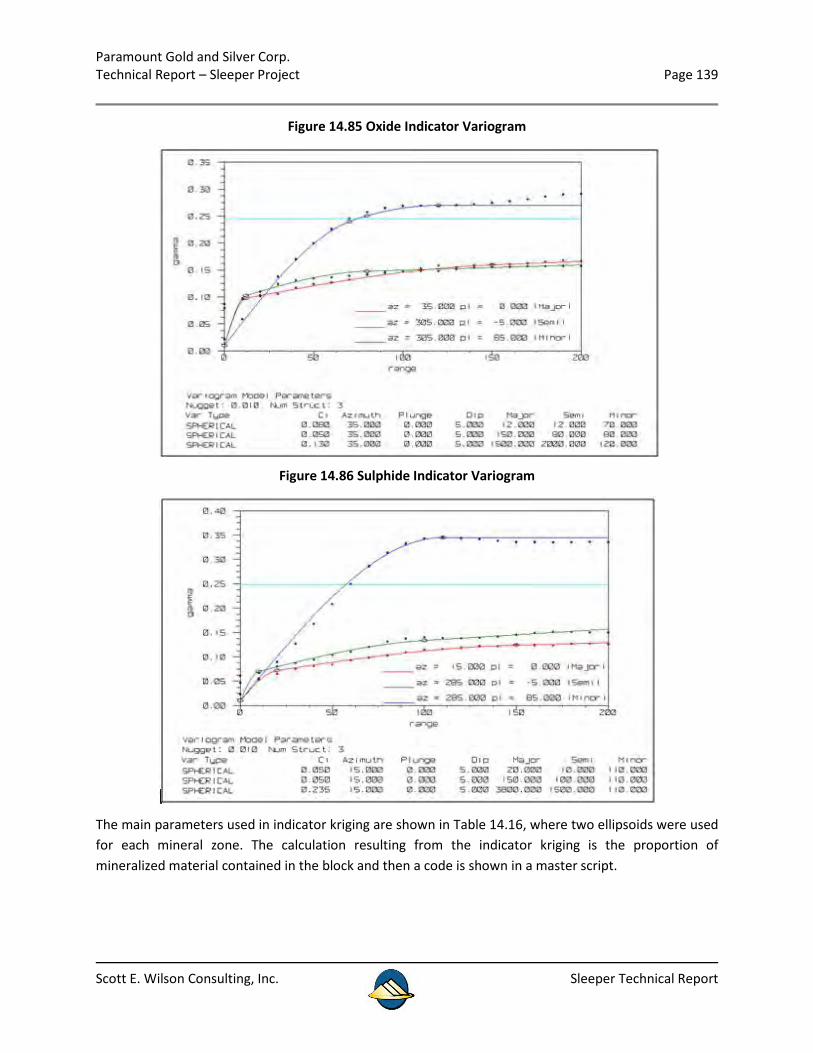
Paramount Gold and Silver Corp. Technical Report – Sleeper Project Page 139
Scott E. Wilson Consulting, Inc. Sleeper Technical Report
Figure 14.85 Oxide Indicator Variogram
Figure 14.86 Sulphide Indicator Variogram
The main parameters used in indicator kriging are shown in Table 14.16, where two ellipsoids were used for each mineral zone. The calculation resulting from the indicator kriging is the proportion of mineralized material contained in the block and then a code is shown in a master script.
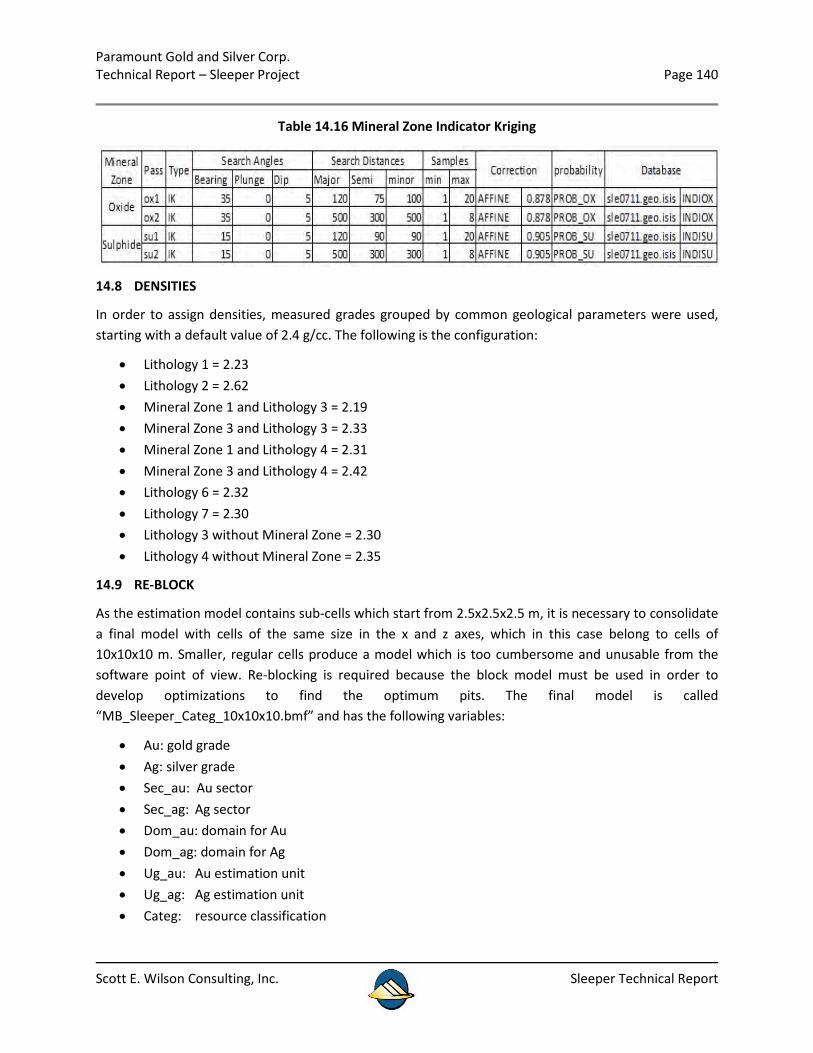
Paramount Gold and Silver Corp. Technical Report – Sleeper Project Page 140
Scott E. Wilson Consulting, Inc. Sleeper Technical Report
Table 14.16 Mineral Zone Indicator Kriging
14.8 DENSITIES
In order to assign densities, measured grades grouped by common geological parameters were used, starting with a default value of 2.4 g/cc. The following is the configuration:
• Lithology 1 = 2.23 • Lithology 2 = 2.62 • Mineral Zone 1 and Lithology 3 = 2.19 • Mineral Zone 3 and Lithology 3 = 2.33 • Mineral Zone 1 and Lithology 4 = 2.31 • Mineral Zone 3 and Lithology 4 = 2.42 • Lithology 6 = 2.32 • Lithology 7 = 2.30 • Lithology 3 without Mineral Zone = 2.30 • Lithology 4 without Mineral Zone = 2.35
14.9 RE-BLOCK
As the estimation model contains sub-cells which start from 2.5x2.5x2.5 m, it is necessary to consolidate a final model with cells of the same size in the x and z axes, which in this case belong to cells of 10x10x10 m. Smaller, regular cells produce a model which is too cumbersome and unusable from the software point of view. Re-blocking is required because the block model must be used in order to develop optimizations to find the optimum pits. The final model is called “MB_Sleeper_Categ_10x10x10.bmf” and has the following variables:
• Au: gold grade • Ag: silver grade • Sec_au: Au sector • Sec_ag: Ag sector • Dom_au: domain for Au • Dom_ag: domain for Ag • Ug_au: Au estimation unit • Ug_ag: Ag estimation unit • Categ: resource classification
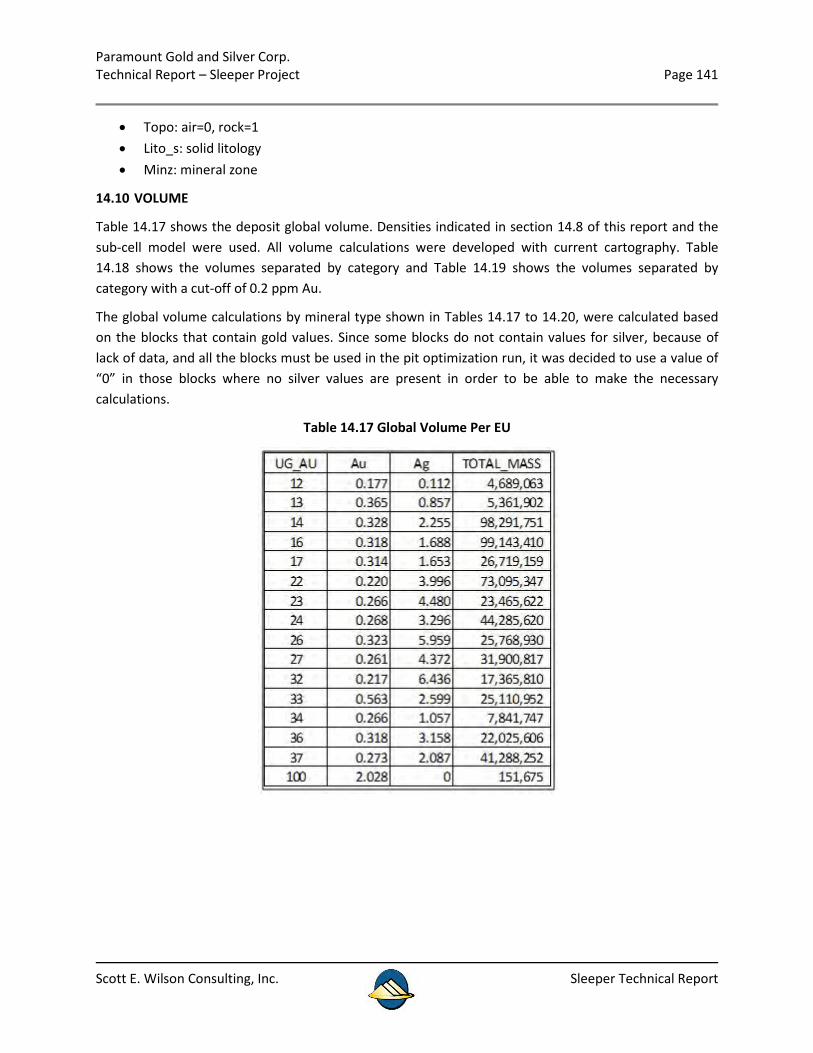
Paramount Gold and Silver Corp. Technical Report – Sleeper Project Page 141
Scott E. Wilson Consulting, Inc. Sleeper Technical Report
• Topo: air=0, rock=1 • Lito_s: solid litology • Minz: mineral zone
14.10 VOLUME
Table 14.17 shows the deposit global volume. Densities indicated in section 14.8 of this report and the sub-cell model were used. All volume calculations were developed with current cartography. Table 14.18 shows the volumes separated by category and Table 14.19 shows the volumes separated by category with a cut-off of 0.2 ppm Au.
The global volume calculations by mineral type shown in Tables 14.17 to 14.20, were calculated based on the blocks that contain gold values. Since some blocks do not contain values for silver, because of lack of data, and all the blocks must be used in the pit optimization run, it was decided to use a value of “0” in those blocks where no silver values are present in order to be able to make the necessary calculations.
Table 14.17 Global Volume Per EU
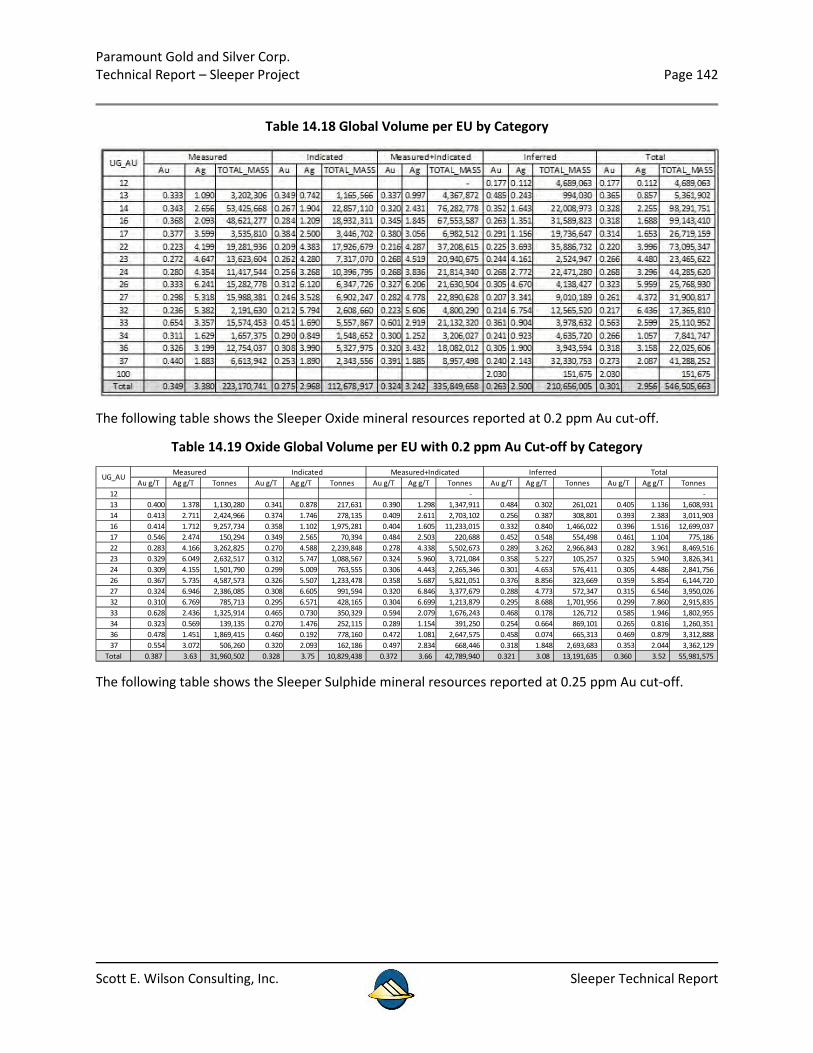
Paramount Gold and Silver Corp. Technical Report – Sleeper Project Page 142
Scott E. Wilson Consulting, Inc. Sleeper Technical Report
Table 14.18 Global Volume per EU by Category
The following table shows the Sleeper Oxide mineral resources reported at 0.2 ppm Au cut-off.
Table 14.19 Oxide Global Volume per EU with 0.2 ppm Au Cut-off by Category
The following table shows the Sleeper Sulphide mineral resources reported at 0.25 ppm Au cut-off.
Au g/T Ag g/T Tonnes Au g/T Ag g/T Tonnes Au g/T Ag g/T Tonnes Au g/T Ag g/T Tonnes Au g/T Ag g/T Tonnes12 - - 13 0.400 1.378 1,130,280 0.341 0.878 217,631 0.390 1.298 1,347,911 0.484 0.302 261,021 0.405 1.136 1,608,931 14 0.413 2.711 2,424,966 0.374 1.746 278,135 0.409 2.611 2,703,102 0.256 0.387 308,801 0.393 2.383 3,011,903 16 0.414 1.712 9,257,734 0.358 1.102 1,975,281 0.404 1.605 11,233,015 0.332 0.840 1,466,022 0.396 1.516 12,699,037 17 0.546 2.474 150,294 0.349 2.565 70,394 0.484 2.503 220,688 0.452 0.548 554,498 0.461 1.104 775,186 22 0.283 4.166 3,262,825 0.270 4.588 2,239,848 0.278 4.338 5,502,673 0.289 3.262 2,966,843 0.282 3.961 8,469,516 23 0.329 6.049 2,632,517 0.312 5.747 1,088,567 0.324 5.960 3,721,084 0.358 5.227 105,257 0.325 5.940 3,826,341 24 0.309 4.155 1,501,790 0.299 5.009 763,555 0.306 4.443 2,265,346 0.301 4.653 576,411 0.305 4.486 2,841,756 26 0.367 5.735 4,587,573 0.326 5.507 1,233,478 0.358 5.687 5,821,051 0.376 8.856 323,669 0.359 5.854 6,144,720 27 0.324 6.946 2,386,085 0.308 6.605 991,594 0.320 6.846 3,377,679 0.288 4.773 572,347 0.315 6.546 3,950,026 32 0.310 6.769 785,713 0.295 6.571 428,165 0.304 6.699 1,213,879 0.295 8.688 1,701,956 0.299 7.860 2,915,835 33 0.628 2.436 1,325,914 0.465 0.730 350,329 0.594 2.079 1,676,243 0.468 0.178 126,712 0.585 1.946 1,802,955 34 0.323 0.569 139,135 0.270 1.476 252,115 0.289 1.154 391,250 0.254 0.664 869,101 0.265 0.816 1,260,351 36 0.478 1.451 1,869,415 0.460 0.192 778,160 0.472 1.081 2,647,575 0.458 0.074 665,313 0.469 0.879 3,312,888 37 0.554 3.072 506,260 0.320 2.093 162,186 0.497 2.834 668,446 0.318 1.848 2,693,683 0.353 2.044 3,362,129
Total 0.387 3.63 31,960,502 0.328 3.75 10,829,438 0.372 3.66 42,789,940 0.321 3.08 13,191,635 0.360 3.52 55,981,575
TotalUG_AU Measured Indicated Measured+Indicated Inferred
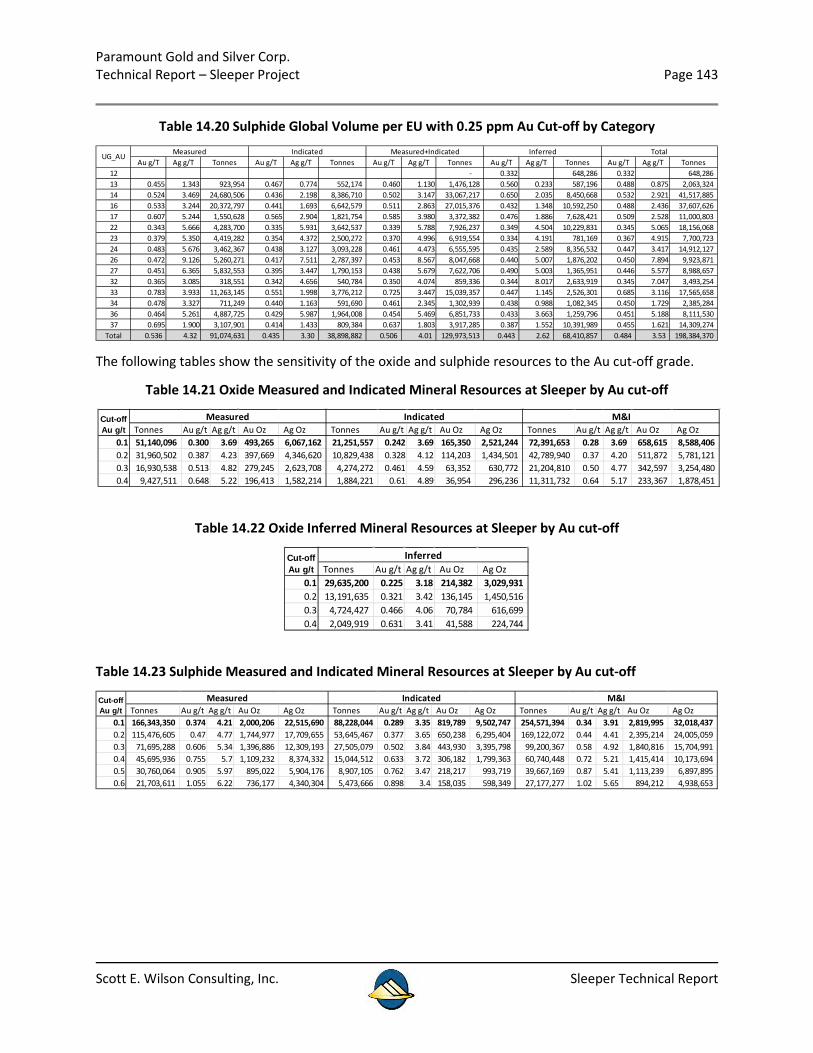
Paramount Gold and Silver Corp. Technical Report – Sleeper Project Page 143
Scott E. Wilson Consulting, Inc. Sleeper Technical Report
Table 14.20 Sulphide Global Volume per EU with 0.25 ppm Au Cut-off by Category
The following tables show the sensitivity of the oxide and sulphide resources to the Au cut-off grade.
Table 14.21 Oxide Measured and Indicated Mineral Resources at Sleeper by Au cut-off
Table 14.22 Oxide Inferred Mineral Resources at Sleeper by Au cut-off
Table 14.23 Sulphide Measured and Indicated Mineral Resources at Sleeper by Au cut-off
Au g/T Ag g/T Tonnes Au g/T Ag g/T Tonnes Au g/T Ag g/T Tonnes Au g/T Ag g/T Tonnes Au g/T Ag g/T Tonnes12 - 0.332 648,286 0.332 648,286 13 0.455 1.343 923,954 0.467 0.774 552,174 0.460 1.130 1,476,128 0.560 0.233 587,196 0.488 0.875 2,063,324 14 0.524 3.469 24,680,506 0.436 2.198 8,386,710 0.502 3.147 33,067,217 0.650 2.035 8,450,668 0.532 2.921 41,517,885 16 0.533 3.244 20,372,797 0.441 1.693 6,642,579 0.511 2.863 27,015,376 0.432 1.348 10,592,250 0.488 2.436 37,607,626 17 0.607 5.244 1,550,628 0.565 2.904 1,821,754 0.585 3.980 3,372,382 0.476 1.886 7,628,421 0.509 2.528 11,000,803 22 0.343 5.666 4,283,700 0.335 5.931 3,642,537 0.339 5.788 7,926,237 0.349 4.504 10,229,831 0.345 5.065 18,156,068 23 0.379 5.350 4,419,282 0.354 4.372 2,500,272 0.370 4.996 6,919,554 0.334 4.191 781,169 0.367 4.915 7,700,723 24 0.483 5.676 3,462,367 0.438 3.127 3,093,228 0.461 4.473 6,555,595 0.435 2.589 8,356,532 0.447 3.417 14,912,127 26 0.472 9.126 5,260,271 0.417 7.511 2,787,397 0.453 8.567 8,047,668 0.440 5.007 1,876,202 0.450 7.894 9,923,871 27 0.451 6.365 5,832,553 0.395 3.447 1,790,153 0.438 5.679 7,622,706 0.490 5.003 1,365,951 0.446 5.577 8,988,657 32 0.365 3.085 318,551 0.342 4.656 540,784 0.350 4.074 859,336 0.344 8.017 2,633,919 0.345 7.047 3,493,254 33 0.783 3.933 11,263,145 0.551 1.998 3,776,212 0.725 3.447 15,039,357 0.447 1.145 2,526,301 0.685 3.116 17,565,658 34 0.478 3.327 711,249 0.440 1.163 591,690 0.461 2.345 1,302,939 0.438 0.988 1,082,345 0.450 1.729 2,385,284 36 0.464 5.261 4,887,725 0.429 5.987 1,964,008 0.454 5.469 6,851,733 0.433 3.663 1,259,796 0.451 5.188 8,111,530 37 0.695 1.900 3,107,901 0.414 1.433 809,384 0.637 1.803 3,917,285 0.387 1.552 10,391,989 0.455 1.621 14,309,274
Total 0.536 4.32 91,074,631 0.435 3.30 38,898,882 0.506 4.01 129,973,513 0.443 2.62 68,410,857 0.484 3.53 198,384,370
UG_AU Measured Indicated Measured+Indicated Inferred Total
Tonnes Au g/t Ag g/t Au Oz Ag Oz Tonnes Au g/t Ag g/t Au Oz Ag Oz Tonnes Au g/t Ag g/t Au Oz Ag Oz0.1 51,140,096 0.300 3.69 493,265 6,067,162 21,251,557 0.242 3.69 165,350 2,521,244 72,391,653 0.28 3.69 658,615 8,588,406 0.2 31,960,502 0.387 4.23 397,669 4,346,620 10,829,438 0.328 4.12 114,203 1,434,501 42,789,940 0.37 4.20 511,872 5,781,121 0.3 16,930,538 0.513 4.82 279,245 2,623,708 4,274,272 0.461 4.59 63,352 630,772 21,204,810 0.50 4.77 342,597 3,254,480 0.4 9,427,511 0.648 5.22 196,413 1,582,214 1,884,221 0.61 4.89 36,954 296,236 11,311,732 0.64 5.17 233,367 1,878,451
Cut-off Au g/t
Measured Indicated M&I
Tonnes Au g/t Ag g/t Au Oz Ag Oz0.1 29,635,200 0.225 3.18 214,382 3,029,931 0.2 13,191,635 0.321 3.42 136,145 1,450,516 0.3 4,724,427 0.466 4.06 70,784 616,699 0.4 2,049,919 0.631 3.41 41,588 224,744
Cut-off Au g/t
Inferred
Tonnes Au g/t Ag g/t Au Oz Ag Oz Tonnes Au g/t Ag g/t Au Oz Ag Oz Tonnes Au g/t Ag g/t Au Oz Ag Oz0.1 166,343,350 0.374 4.21 2,000,206 22,515,690 88,228,044 0.289 3.35 819,789 9,502,747 254,571,394 0.34 3.91 2,819,995 32,018,437 0.2 115,476,605 0.47 4.77 1,744,977 17,709,655 53,645,467 0.377 3.65 650,238 6,295,404 169,122,072 0.44 4.41 2,395,214 24,005,059 0.3 71,695,288 0.606 5.34 1,396,886 12,309,193 27,505,079 0.502 3.84 443,930 3,395,798 99,200,367 0.58 4.92 1,840,816 15,704,991 0.4 45,695,936 0.755 5.7 1,109,232 8,374,332 15,044,512 0.633 3.72 306,182 1,799,363 60,740,448 0.72 5.21 1,415,414 10,173,694 0.5 30,760,064 0.905 5.97 895,022 5,904,176 8,907,105 0.762 3.47 218,217 993,719 39,667,169 0.87 5.41 1,113,239 6,897,895 0.6 21,703,611 1.055 6.22 736,177 4,340,304 5,473,666 0.898 3.4 158,035 598,349 27,177,277 1.02 5.65 894,212 4,938,653
Cut-off Au g/t
Indicated M&IMeasured
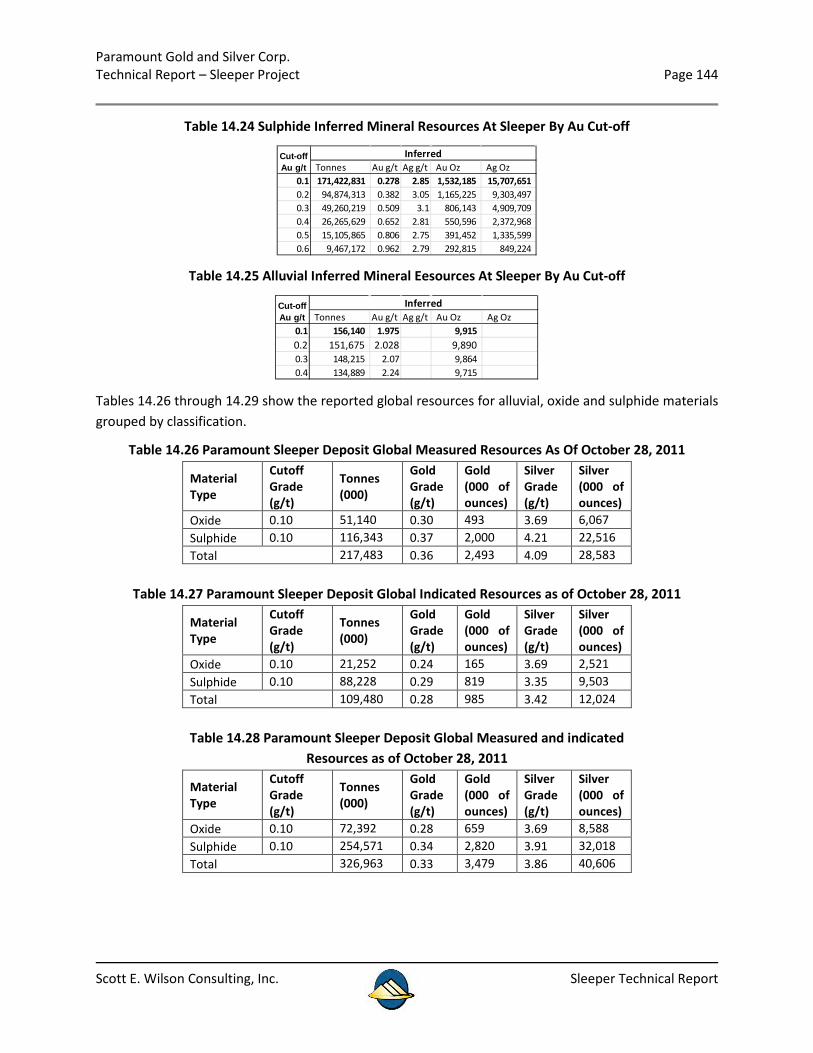
Paramount Gold and Silver Corp. Technical Report – Sleeper Project Page 144
Scott E. Wilson Consulting, Inc. Sleeper Technical Report
Table 14.24 Sulphide Inferred Mineral Resources At Sleeper By Au Cut-off
Table 14.25 Alluvial Inferred Mineral Eesources At Sleeper By Au Cut-off
Tables 14.26 through 14.29 show the reported global resources for alluvial, oxide and sulphide materials grouped by classification.
Table 14.26 Paramount Sleeper Deposit Global Measured Resources As Of October 28, 2011
Material Type
Cutoff Grade (g/t)
Tonnes (000)
Gold Grade (g/t)
Gold (000 of ounces)
Silver Grade (g/t)
Silver (000 of ounces)
Oxide 0.10 51,140 0.30 493 3.69 6,067 Sulphide 0.10 116,343 0.37 2,000 4.21 22,516 Total 217,483 0.36 2,493 4.09 28,583
Table 14.27 Paramount Sleeper Deposit Global Indicated Resources as of October 28, 2011
Material Type
Cutoff Grade (g/t)
Tonnes (000)
Gold Grade (g/t)
Gold (000 of ounces)
Silver Grade (g/t)
Silver (000 of ounces)
Oxide 0.10 21,252 0.24 165 3.69 2,521 Sulphide 0.10 88,228 0.29 819 3.35 9,503 Total 109,480 0.28 985 3.42 12,024
Table 14.28 Paramount Sleeper Deposit Global Measured and indicated
Resources as of October 28, 2011
Material Type
Cutoff Grade (g/t)
Tonnes (000)
Gold Grade (g/t)
Gold (000 of ounces)
Silver Grade (g/t)
Silver (000 of ounces)
Oxide 0.10 72,392 0.28 659 3.69 8,588 Sulphide 0.10 254,571 0.34 2,820 3.91 32,018 Total 326,963 0.33 3,479 3.86 40,606
Tonnes Au g/t Ag g/t Au Oz Ag Oz0.1 171,422,831 0.278 2.85 1,532,185 15,707,651 0.2 94,874,313 0.382 3.05 1,165,225 9,303,497 0.3 49,260,219 0.509 3.1 806,143 4,909,709 0.4 26,265,629 0.652 2.81 550,596 2,372,968 0.5 15,105,865 0.806 2.75 391,452 1,335,599 0.6 9,467,172 0.962 2.79 292,815 849,224
Cut-off Au g/t
Inferred
Tonnes Au g/t Ag g/t Au Oz Ag Oz0.1 156,140 1.975 9,915 0.2 151,675 2.028 9,890 0.3 148,215 2.07 9,864 0.4 134,889 2.24 9,715
InferredCut-off Au g/t
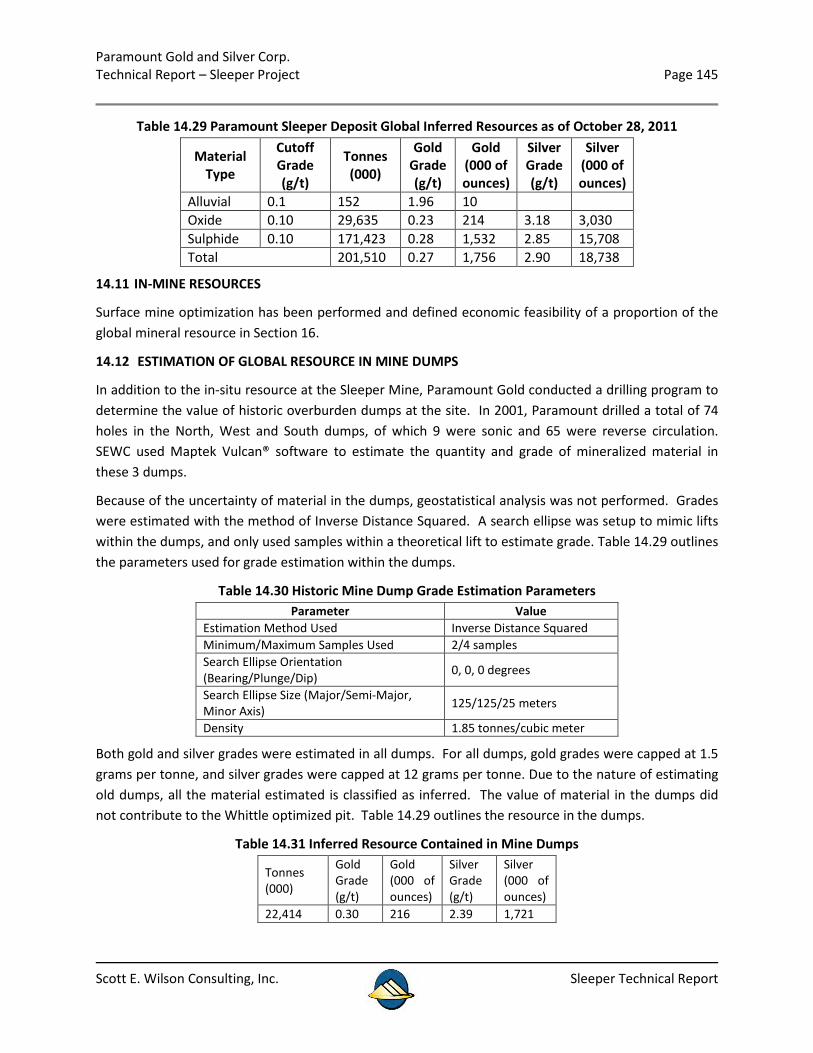
Paramount Gold and Silver Corp. Technical Report – Sleeper Project Page 145
Scott E. Wilson Consulting, Inc. Sleeper Technical Report
Table 14.29 Paramount Sleeper Deposit Global Inferred Resources as of October 28, 2011
Material Type
Cutoff Grade (g/t)
Tonnes (000)
Gold Grade (g/t)
Gold (000 of ounces)
Silver Grade (g/t)
Silver (000 of ounces)
Alluvial 0.1 152 1.96 10 Oxide 0.10 29,635 0.23 214 3.18 3,030 Sulphide 0.10 171,423 0.28 1,532 2.85 15,708 Total 201,510 0.27 1,756 2.90 18,738
14.11 IN-MINE RESOURCES
Surface mine optimization has been performed and defined economic feasibility of a proportion of the global mineral resource in Section 16.
14.12 ESTIMATION OF GLOBAL RESOURCE IN MINE DUMPS
In addition to the in-situ resource at the Sleeper Mine, Paramount Gold conducted a drilling program to determine the value of historic overburden dumps at the site. In 2001, Paramount drilled a total of 74 holes in the North, West and South dumps, of which 9 were sonic and 65 were reverse circulation. SEWC used Maptek Vulcan® software to estimate the quantity and grade of mineralized material in these 3 dumps.
Because of the uncertainty of material in the dumps, geostatistical analysis was not performed. Grades were estimated with the method of Inverse Distance Squared. A search ellipse was setup to mimic lifts within the dumps, and only used samples within a theoretical lift to estimate grade. Table 14.29 outlines the parameters used for grade estimation within the dumps.
Table 14.30 Historic Mine Dump Grade Estimation Parameters Parameter Value
Estimation Method Used Inverse Distance Squared Minimum/Maximum Samples Used 2/4 samples Search Ellipse Orientation (Bearing/Plunge/Dip) 0, 0, 0 degrees
Search Ellipse Size (Major/Semi-Major, Minor Axis) 125/125/25 meters
Density 1.85 tonnes/cubic meter
Both gold and silver grades were estimated in all dumps. For all dumps, gold grades were capped at 1.5 grams per tonne, and silver grades were capped at 12 grams per tonne. Due to the nature of estimating old dumps, all the material estimated is classified as inferred. The value of material in the dumps did not contribute to the Whittle optimized pit. Table 14.29 outlines the resource in the dumps.
Table 14.31 Inferred Resource Contained in Mine Dumps
Tonnes (000)
Gold Grade (g/t)
Gold (000 of ounces)
Silver Grade (g/t)
Silver (000 of ounces)
22,414 0.30 216 2.39 1,721

Paramount Gold and Silver Corp. Technical Report – Sleeper Project Page 146
Scott E. Wilson Consulting, Inc. Sleeper Technical Report
15 MINERAL RESERVE ESTIMATES
This section is not applicable because the Sleeper Property is an advanced stage exploration project and there are no mineral reserves at this time.

Paramount Gold and Silver Corp. Technical Report – Sleeper Project Page 147
Scott E. Wilson Consulting, Inc. Sleeper Technical Report
16 MINING METHODS
This section of the report describes the mining assumptions used in the PEA. The mining operation was assumed to employ conventional surface mining methods, with drill and blast rock breakage and truck and shovel materials handling. The global resource model described in Section 14 was used to develop a surface mine shell using Lerch-Grossman optimization in the Gemcom Whittle software package. A production schedule was then developed using the MineMax Scheduler software package to schedule mineralized material to process facilities for treatment and overburden material to storage facilities. The production schedule was constrained to produce a constant feed of mineralized material to a crushing/agglomeration plant followed by placement on a heap leach pad. Some stockpiling of mineralized material was required to balance the plant feed rate over the life of mine (LOM). The TALPACTM software was used with the production schedule and with average haul distances to the crusher and overburden storage areas to estimate the required truck fleet. The equipment fleet was assumed to be truck constrained.
16.1 MINE OPTIMAZTION
The global resource model was re-blocked to produce a small mining unit of 7.5 m x 7.5 m x 7.5 m. This was considered a reasonable basis for selection at the anticipated large mining rates. The average grade of each block was considered to have captured mining dilution. For the mining selection process, blocks were labeled for 3 material types; (1) Facilities Zone material (an area on the eastern edge of the Sleeper surface mine excavation) , (2) Sleeper Zone material (low grade continuation of the original Sleeper deposit at depth) and (3) Mine Dumps material from historic Sleeper mining operations. Within each of the Facilities Zone and Sleeper Zone, each block was labeled as either oxide or sulphide.
The Whittle software performed an evaluation of each block based on projected costs, grade and metallurgical recovery. The parameters used in the optimization process are listed in Table 16.1. Other cost account for dewatering, and were applied to blocks below the current water elevation of 1248 meters. A preliminary geotechnical evaluation has been performed for Sleeper surface mining to provide a basis for pit slope recommendations (Kinakin, 2012). A range of preliminary inter-ramp slope angle recommendations was developed based on mining surfaces projected for expansion of the mine excavation, and classified as “conservative”, “base” and “aggressive”. The “base” recommendation of 45 degrees was used in the PEA Whittle analysis. Further refinement of the pit slope recommendations would be performed for more advanced engineering studies, after the mining surface has been defined.
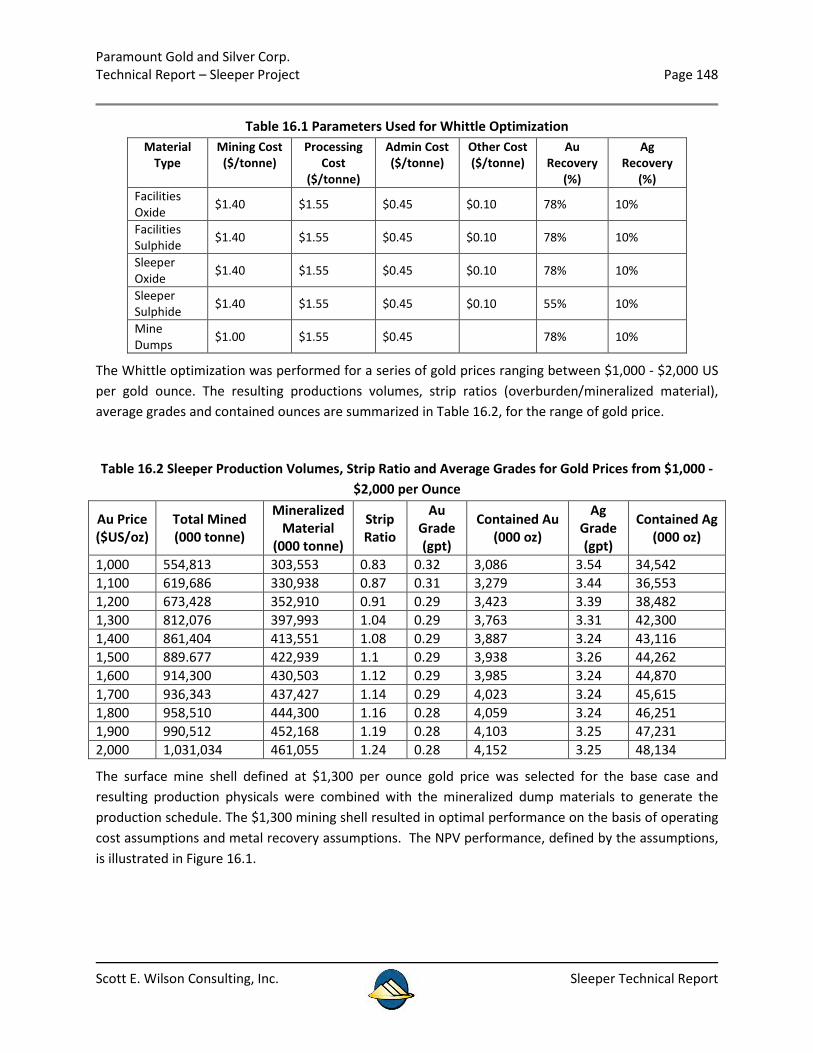
Paramount Gold and Silver Corp. Technical Report – Sleeper Project Page 148
Scott E. Wilson Consulting, Inc. Sleeper Technical Report
Table 16.1 Parameters Used for Whittle Optimization Material
Type Mining Cost
($/tonne) Processing
Cost ($/tonne)
Admin Cost ($/tonne)
Other Cost ($/tonne)
Au Recovery
(%)
Ag Recovery
(%) Facilities Oxide $1.40 $1.55 $0.45 $0.10 78% 10%
Facilities Sulphide $1.40 $1.55 $0.45 $0.10 78% 10%
Sleeper Oxide $1.40 $1.55 $0.45 $0.10 78% 10%
Sleeper Sulphide $1.40 $1.55 $0.45 $0.10 55% 10%
Mine Dumps $1.00 $1.55 $0.45 78% 10%
The Whittle optimization was performed for a series of gold prices ranging between $1,000 - $2,000 US per gold ounce. The resulting productions volumes, strip ratios (overburden/mineralized material), average grades and contained ounces are summarized in Table 16.2, for the range of gold price.
Table 16.2 Sleeper Production Volumes, Strip Ratio and Average Grades for Gold Prices from $1,000 - $2,000 per Ounce
Au Price ($US/oz)
Total Mined (000 tonne)
Mineralized Material
(000 tonne)
Strip Ratio
Au Grade (gpt)
Contained Au (000 oz)
Ag Grade (gpt)
Contained Ag (000 oz)
1,000 554,813 303,553 0.83 0.32 3,086 3.54 34,542 1,100 619,686 330,938 0.87 0.31 3,279 3.44 36,553 1,200 673,428 352,910 0.91 0.29 3,423 3.39 38,482 1,300 812,076 397,993 1.04 0.29 3,763 3.31 42,300 1,400 861,404 413,551 1.08 0.29 3,887 3.24 43,116 1,500 889.677 422,939 1.1 0.29 3,938 3.26 44,262 1,600 914,300 430,503 1.12 0.29 3,985 3.24 44,870 1,700 936,343 437,427 1.14 0.29 4,023 3.24 45,615 1,800 958,510 444,300 1.16 0.28 4,059 3.24 46,251 1,900 990,512 452,168 1.19 0.28 4,103 3.25 47,231 2,000 1,031,034 461,055 1.24 0.28 4,152 3.25 48,134
The surface mine shell defined at $1,300 per ounce gold price was selected for the base case and resulting production physicals were combined with the mineralized dump materials to generate the production schedule. The $1,300 mining shell resulted in optimal performance on the basis of operating cost assumptions and metal recovery assumptions. The NPV performance, defined by the assumptions, is illustrated in Figure 16.1.
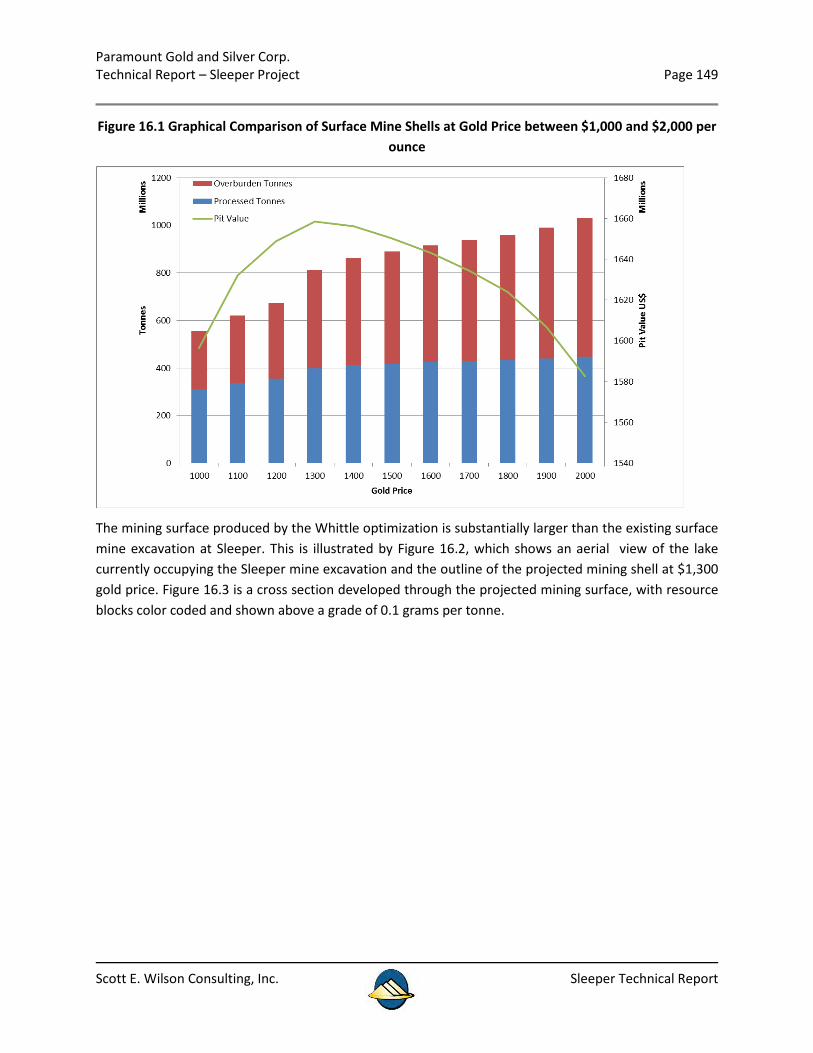
Paramount Gold and Silver Corp. Technical Report – Sleeper Project Page 149
Scott E. Wilson Consulting, Inc. Sleeper Technical Report
Figure 16.1 Graphical Comparison of Surface Mine Shells at Gold Price between $1,000 and $2,000 per ounce
The mining surface produced by the Whittle optimization is substantially larger than the existing surface mine excavation at Sleeper. This is illustrated by Figure 16.2, which shows an aerial view of the lake currently occupying the Sleeper mine excavation and the outline of the projected mining shell at $1,300 gold price. Figure 16.3 is a cross section developed through the projected mining surface, with resource blocks color coded and shown above a grade of 0.1 grams per tonne.
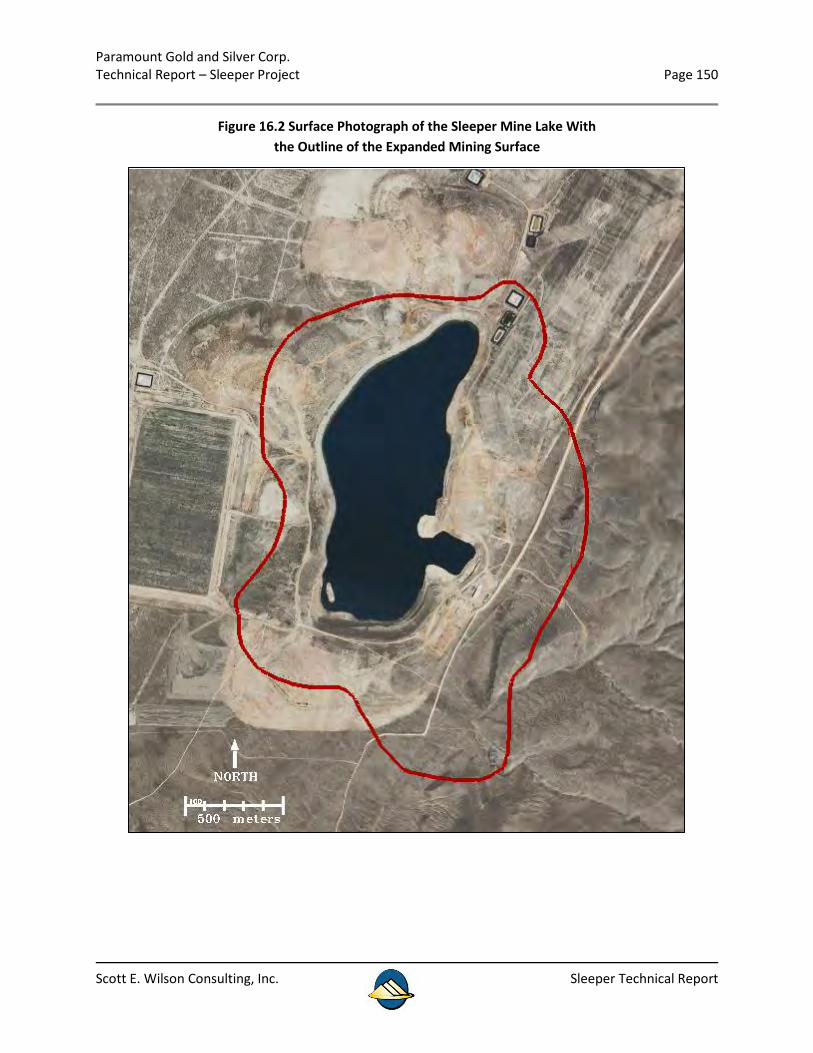
Paramount Gold and Silver Corp. Technical Report – Sleeper Project Page 150
Scott E. Wilson Consulting, Inc. Sleeper Technical Report
Figure 16.2 Surface Photograph of the Sleeper Mine Lake With the Outline of the Expanded Mining Surface
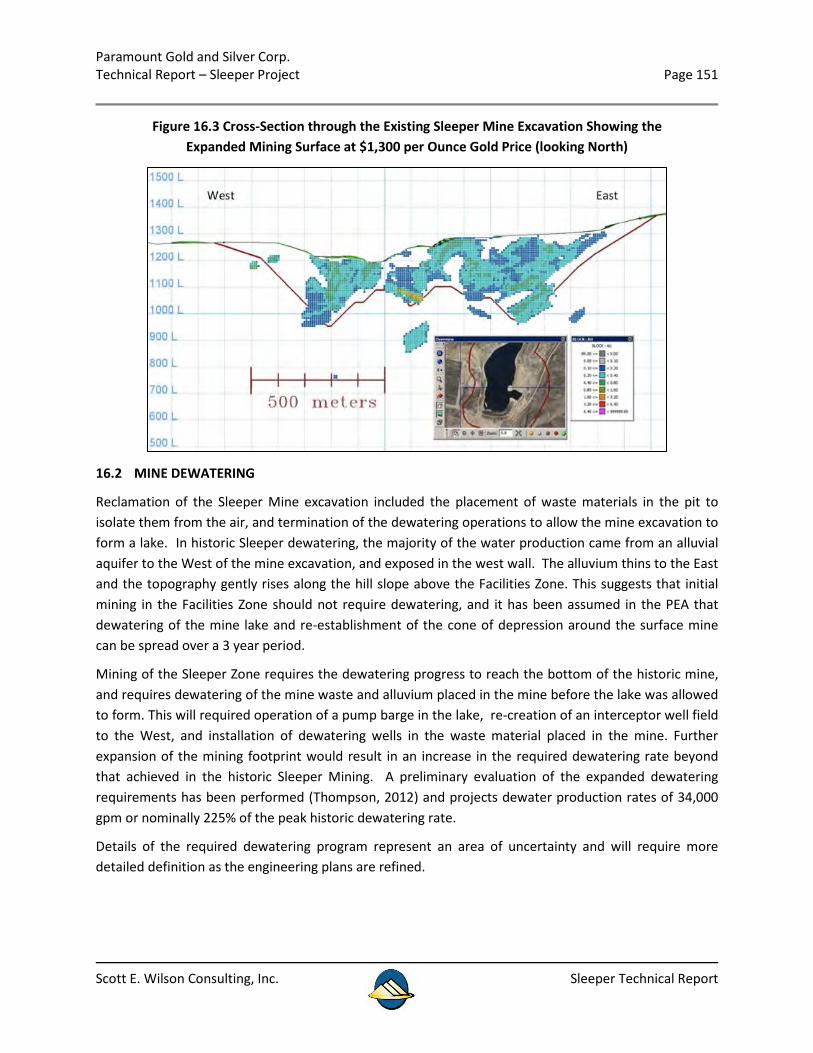
Paramount Gold and Silver Corp. Technical Report – Sleeper Project Page 151
Scott E. Wilson Consulting, Inc. Sleeper Technical Report
Figure 16.3 Cross-Section through the Existing Sleeper Mine Excavation Showing the Expanded Mining Surface at $1,300 per Ounce Gold Price (looking North)
16.2 MINE DEWATERING
Reclamation of the Sleeper Mine excavation included the placement of waste materials in the pit to isolate them from the air, and termination of the dewatering operations to allow the mine excavation to form a lake. In historic Sleeper dewatering, the majority of the water production came from an alluvial aquifer to the West of the mine excavation, and exposed in the west wall. The alluvium thins to the East and the topography gently rises along the hill slope above the Facilities Zone. This suggests that initial mining in the Facilities Zone should not require dewatering, and it has been assumed in the PEA that dewatering of the mine lake and re-establishment of the cone of depression around the surface mine can be spread over a 3 year period.
Mining of the Sleeper Zone requires the dewatering progress to reach the bottom of the historic mine, and requires dewatering of the mine waste and alluvium placed in the mine before the lake was allowed to form. This will required operation of a pump barge in the lake, re-creation of an interceptor well field to the West, and installation of dewatering wells in the waste material placed in the mine. Further expansion of the mining footprint would result in an increase in the required dewatering rate beyond that achieved in the historic Sleeper Mining. A preliminary evaluation of the expanded dewatering requirements has been performed (Thompson, 2012) and projects dewater production rates of 34,000 gpm or nominally 225% of the peak historic dewatering rate.
Details of the required dewatering program represent an area of uncertainty and will require more detailed definition as the engineering plans are refined.
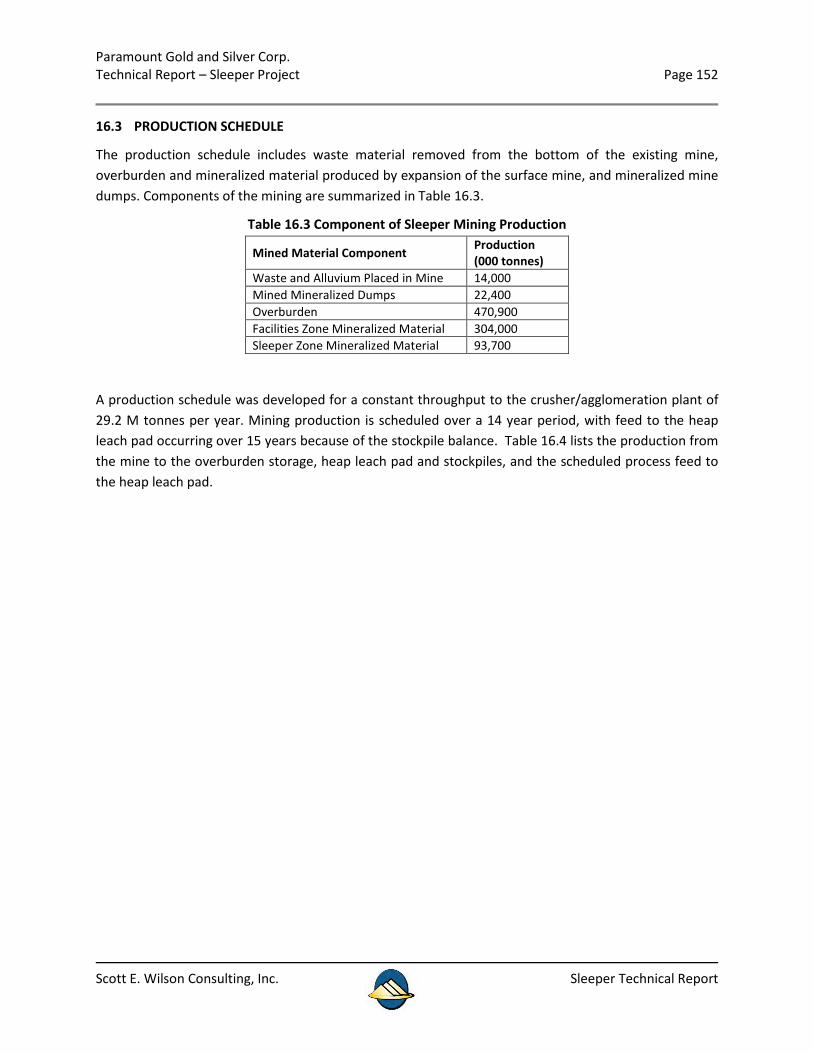
Paramount Gold and Silver Corp. Technical Report – Sleeper Project Page 152
Scott E. Wilson Consulting, Inc. Sleeper Technical Report
16.3 PRODUCTION SCHEDULE
The production schedule includes waste material removed from the bottom of the existing mine, overburden and mineralized material produced by expansion of the surface mine, and mineralized mine dumps. Components of the mining are summarized in Table 16.3.
Table 16.3 Component of Sleeper Mining Production
Mined Material Component Production (000 tonnes)
Waste and Alluvium Placed in Mine 14,000 Mined Mineralized Dumps 22,400 Overburden 470,900 Facilities Zone Mineralized Material 304,000 Sleeper Zone Mineralized Material 93,700
A production schedule was developed for a constant throughput to the crusher/agglomeration plant of 29.2 M tonnes per year. Mining production is scheduled over a 14 year period, with feed to the heap leach pad occurring over 15 years because of the stockpile balance. Table 16.4 lists the production from the mine to the overburden storage, heap leach pad and stockpiles, and the scheduled process feed to the heap leach pad.
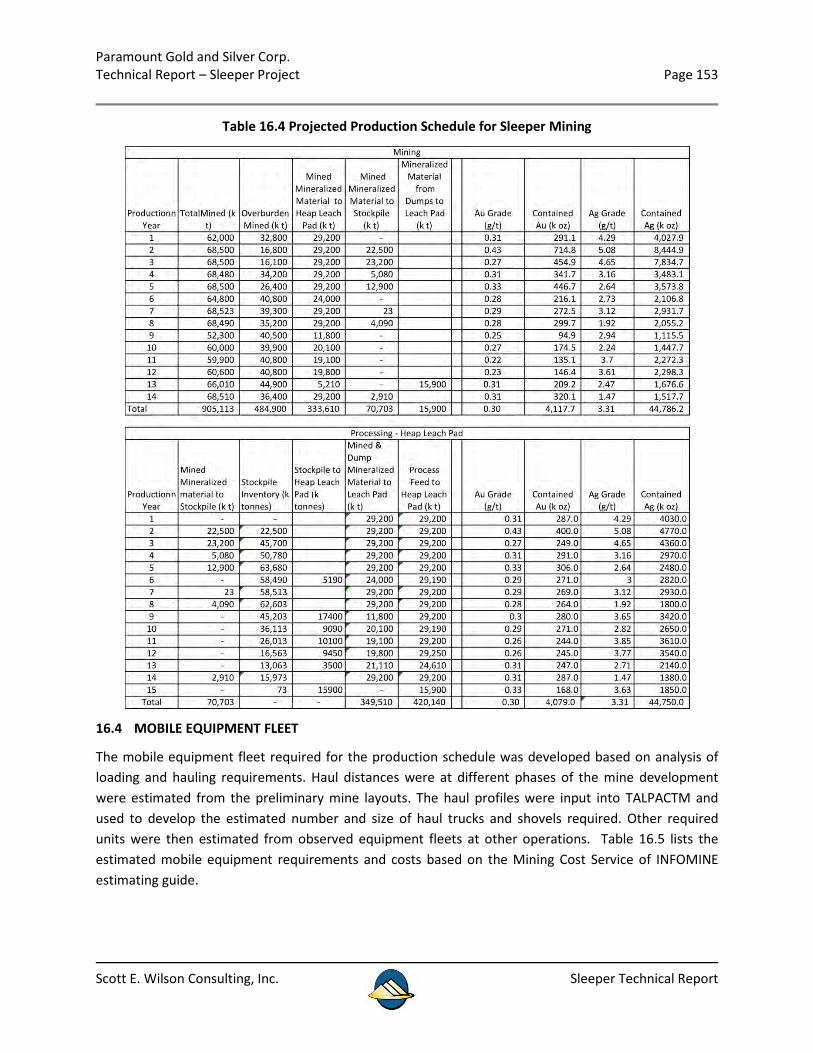
Paramount Gold and Silver Corp. Technical Report – Sleeper Project Page 153
Scott E. Wilson Consulting, Inc. Sleeper Technical Report
Table 16.4 Projected Production Schedule for Sleeper Mining
16.4 MOBILE EQUIPMENT FLEET
The mobile equipment fleet required for the production schedule was developed based on analysis of loading and hauling requirements. Haul distances were at different phases of the mine development were estimated from the preliminary mine layouts. The haul profiles were input into TALPACTM and used to develop the estimated number and size of haul trucks and shovels required. Other required units were then estimated from observed equipment fleets at other operations. Table 16.5 lists the estimated mobile equipment requirements and costs based on the Mining Cost Service of INFOMINE estimating guide.
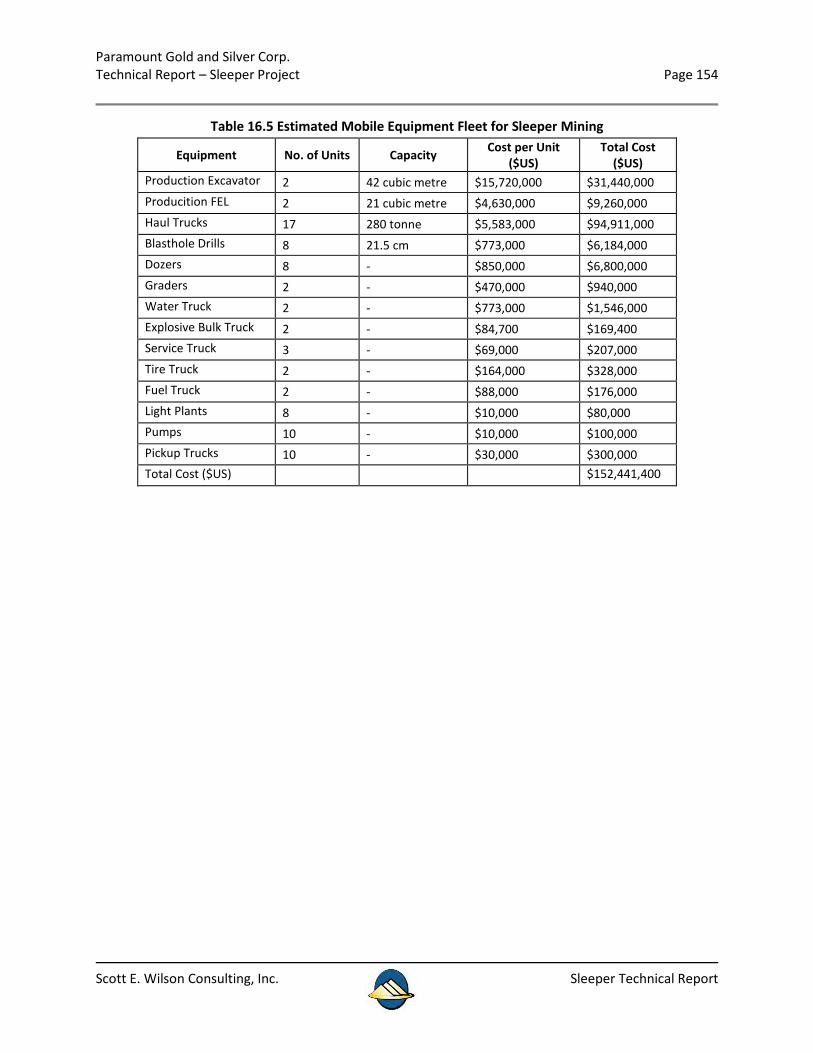
Paramount Gold and Silver Corp. Technical Report – Sleeper Project Page 154
Scott E. Wilson Consulting, Inc. Sleeper Technical Report
Table 16.5 Estimated Mobile Equipment Fleet for Sleeper Mining
Equipment No. of Units Capacity Cost per Unit ($US)
Total Cost ($US)
Production Excavator 2 42 cubic metre $15,720,000 $31,440,000 Producition FEL 2 21 cubic metre $4,630,000 $9,260,000 Haul Trucks 17 280 tonne $5,583,000 $94,911,000 Blasthole Drills 8 21.5 cm $773,000 $6,184,000 Dozers 8 - $850,000 $6,800,000 Graders 2 - $470,000 $940,000 Water Truck 2 - $773,000 $1,546,000 Explosive Bulk Truck 2 - $84,700 $169,400 Service Truck 3 - $69,000 $207,000 Tire Truck 2 - $164,000 $328,000 Fuel Truck 2 - $88,000 $176,000 Light Plants 8 - $10,000 $80,000 Pumps 10 - $10,000 $100,000 Pickup Trucks 10 - $30,000 $300,000 Total Cost ($US) $152,441,400
Paramount Gold and Silver Corp. Technical Report – Sleeper Project Page 155
Scott E. Wilson Consulting, Inc. Sleeper Technical Report
17 RECOVERY METHODS
The process facilities in the PEA were assumed to be standard cyanide heap leaching with carbon-in-column and ADR recovery plant, and whole ore milling with cyanide leaching. Heap leach material would be crushed to P80 -3/4 inch (19 mm) using a primary and secondary crushing circuit. It was assumed that agglomeration would be required for the heap leach. For the heap leach only system, the crushing circuit would be sized for 81 ktpd throughput, with a stockpile of mineralized material developed to level the process rate. The combination mill and heap leach would have a crushing system sized to handle nominally 50 ktpd, with both a mill stockpile and a heap leach stockpile required to level the production rate.
The process facilities would produce a dore’ for direct sale to a regional refinery. It was assumed that produced metal would be sold at spot prices for gold and silver. Limited data was available from Bottle Roll Testing and Column Leach Testing of drill samples from the Sleeper Overburden Dumps, Facilities Zone, Westwood Zone and Sleeper Tails. The tests indicated that materials from the Facilities Zone and Overburden Dumps had generally high Au recovery in cyanide leach tests, while Westwood Zone and Sleeper Tails material had generally low Au recovery in cyanide leach tests.
Three general mining zones were defined on the basis of metallurgical testing and historical mining performance: (1) the Facilities Zone (area on the eastern edge of the Sleeper surface excavation), (2) Sleeper Zone (low grade continuation of the original Sleeper deposit at depth), and (3) Overburden Dumps from historic Sleeper mining operations. On the basis of the existing test data and the historical metallurgical performance of the Sleeper cyanide heap leach and cyanide mill processing, process recovery assumptions used in the Whittle optimization were:
• Facilities Zone Oxide and Sulphide mineralization – 78% for gold and 10% for silver • Sleeper Zone Oxide mineralization – 78% for gold and 10% for silver • Sleeper Zone Sulphide mineralization – 55% for gold and 10% for silver • Mine dumps mineralization – 78% for gold and 10% for silver
The process facilities would produce a dore’ for direct sale to a regional refinery. It was assumed that produced metal would be sold at spot prices for gold and silver.
Paramount Gold and Silver Corp. Technical Report – Sleeper Project Page 156
Scott E. Wilson Consulting, Inc. Sleeper Technical Report
18 INFRASTRUCTURE
Infrastructure required to re-establish mining operations at Sleeper are primarily in place due to the historic mining. That primary infrastructure consists of access to the mine site, human resources, electrical power and water. Each of these components is discussed in the following sections.
18.1 LOCATION AND ACCESS
The Sleeper Property is located 26 miles to the Northwest of Winnemucca NV, which is on Interstate 80 and connects the major cities of Reno, NV and Salt Lake City, Utah. Access is to the north via State Highway 95 approximately 32 miles and the west on State Highway 140 approximately 14 miles. The property is connected to the paved highways by a maintained gravel road, Sod House Road, which enters the project site.
Interstate 80 is a major commercial artery across northern Nevada, and with the parallel railroad transport corridor allows delivery of bulk consumables required by large mining operations directly to Winnemucca. Numerous gold mining operations are scattered along this transportation corridor assuring a well-developed service basis for equipment and supplies.
18.2 HUMAN RESOURCES
The community of Winnemucca NV has a population of 7,400 and is the county seat of Humbolt Co. Nevada. The surrounding mining operations are substantial employers in the Winnemucca community, and personnel also commute to mining operations from the surrounding area. The extensive scope of mining along the I-80 corridor assures that the necessary skills and support services will be available to any future operation.
18.3 ELECTRICAL POWER
An existing high-tension electrical power line services Sleeper from the north. This 120 kV line is operated by Haney Rural Electric Company of Burns, Oregon. The capacity of this line may require upgrading for the increased processing envisioned for the re-establishment of Sleeper mining. No planning has been completed at this stage, and future engineering studies will need to establish the required line capacity and enter into negotiations with the power supplier.
18.4 WATER
Historical Sleeper operations had water rights which allowed supply to the process facilities and heap leach pad, which were the primary consumers. Re-establishing mining operations at Sleeper will require dewatering operations similar in scale to historical requirements, with the final dewatering rates estimated to be at 225% of the historical capacity. Paramount currently holds water rights for future operations. Establishing the water balance for the project will be a priority for advanced engineering studies.
Paramount Gold and Silver Corp. Technical Report – Sleeper Project Page 157
Scott E. Wilson Consulting, Inc. Sleeper Technical Report
18.5 FACILITIES
Much of the Sleeper mining infrastructure has been reclaimed, so re-establishing mining operations will require construction of new facilities. Existing shops and offices are located on top of the Facilities Zone, so will require removal and relocation. Figure 18.1 illustrates the site layout when the mine was closed in 1996. The equipment required for the large scale mining needed to deliver the economies of scale for the indicated low grades of mineralized material are too large for the current equipment shops, so new construction will likely be required, with potential for recycling some of the existing components. Facilities which require construction are the dewatering and water supply system, wet land or rapid infiltration basin, crusher and agglomeration plant, ADR facility, reagent tanks, warehouse, mobile equipment shops, fuel depot, operations and administration building, assay laboratory, bulk materials storage and electrical systems.
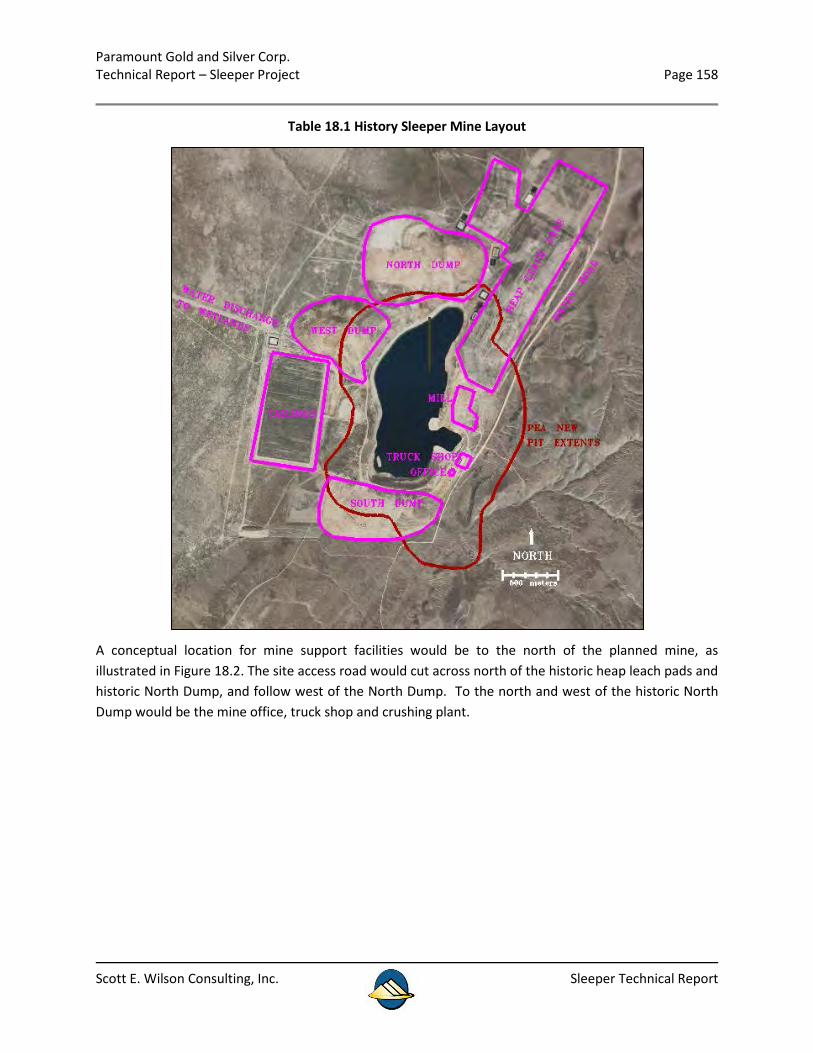
Paramount Gold and Silver Corp. Technical Report – Sleeper Project Page 158
Scott E. Wilson Consulting, Inc. Sleeper Technical Report
Table 18.1 History Sleeper Mine Layout
A conceptual location for mine support facilities would be to the north of the planned mine, as illustrated in Figure 18.2. The site access road would cut across north of the historic heap leach pads and historic North Dump, and follow west of the North Dump. To the north and west of the historic North Dump would be the mine office, truck shop and crushing plant.
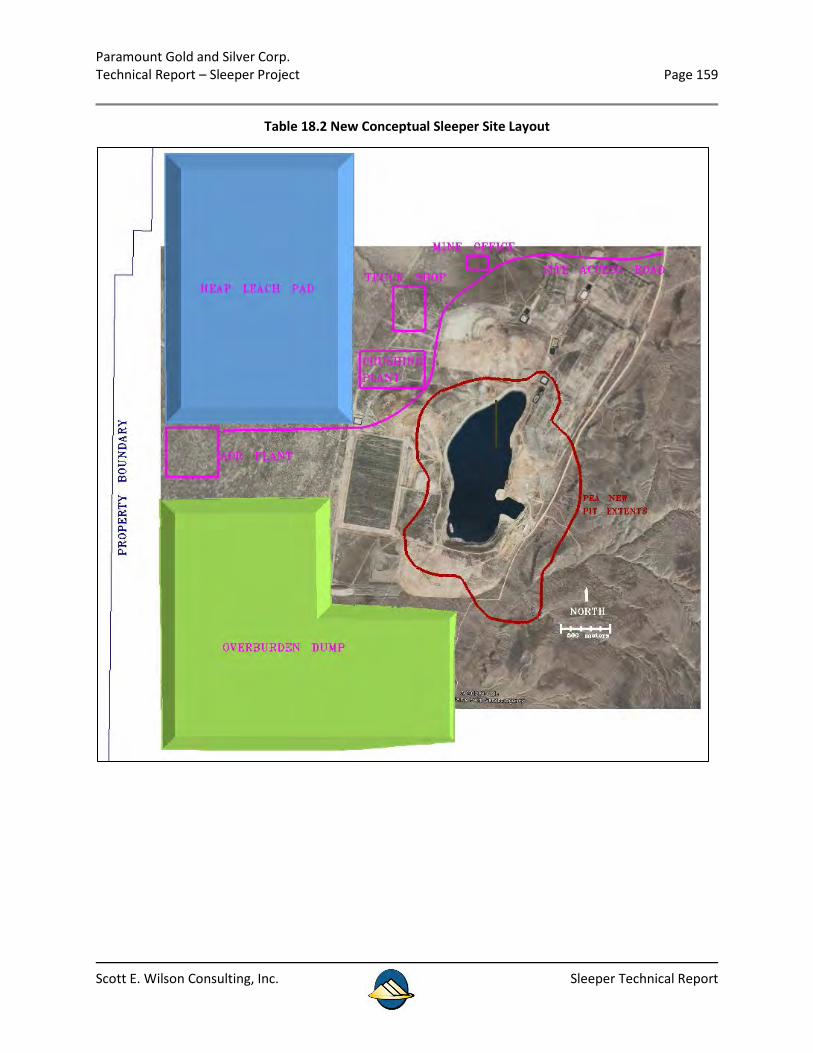
Paramount Gold and Silver Corp. Technical Report – Sleeper Project Page 159
Scott E. Wilson Consulting, Inc. Sleeper Technical Report
Table 18.2 New Conceptual Sleeper Site Layout
Paramount Gold and Silver Corp. Technical Report – Sleeper Project Page 160
Scott E. Wilson Consulting, Inc. Sleeper Technical Report
18.6 HEAP LEACH PAD AND ADR PLANT
The heap leach pad has been placed northwest of the planned mine area in the conceptual layout. This area is fairly flat and drains to the south-west. The ADR plant could be located at the southwest corner of the leach pad as illustrated in Figure 18.2. The leach pad was assumed to be approximately 70 meters high based on historic pad heights at Sleeper and the assumed need to agglomerate.
18.7 OVERBURDEN DUMP
A single overburden dump area was assumed for the project, and was assumed to be located to the southwest of the mine area as illustrated in Figure 18.2. The height of the dump was assumed to be 60 meters; or 100 meters below the elevation of nearby mountains. This location would allow for easy access from ramps exiting the mine in the southern most extent and along the eastern extent of the mine.
Paramount Gold and Silver Corp. Technical Report – Sleeper Project Page 161
Scott E. Wilson Consulting, Inc. Sleeper Technical Report
19 MARKET STUDIES AND CONTRACTS
The study assumes that a gold dore’ will be produced at an ADR facility located at Sleeper, and sold on to a gold refiner offsite. No transport and refining charges have been considered in the analysis, and no contracts for delivery of gold dore’ have been established due to the preliminary nature of the evaluation.
It has been assumed that gold would be sold on the spot market, which has historically been able to absorb the entire world production.
No contracts for materials delivery, electrical supply or maintenance have been established.
Paramount Gold and Silver Corp. Technical Report – Sleeper Project Page 162
Scott E. Wilson Consulting, Inc. Sleeper Technical Report
20 ENVIRONMENTAL STUDIES, PERMITTING AND SOCIAL OR COMMUNITY IMPACT
20.1 HISTORICAL STATUS OF THE SLEEPER MINE
The Sleeper Project was explored and developed (mining, milling and heap leaching) in the 1980s and 1990s. Reclamation has occurred on the majority of the mine facilities (waste dumps, tailing storage facility, heap leach pads and ancillary facilities (access and haul roads) and the open pit has been allowed to refill with water. These reclamation efforts have received awards and recognition from the regulatory agencies and the public. Final closure of the heap leach pads has not been completed. Current activities at the site involve exploration, permit maintenance and reclamation monitoring.
There are no known environmental issues that are adversely impacting air, water or soil resources at the site. Key environmental issues associated with current drilling activities and this NI 43-101 Report are wildlife and archaeology.
While there are no wildlife or plants Threatened or Endangered (T&E) species within the project boundary, there are sensitive wildlife species (pygmy rabbit and greater sage-grouse) or habitat that may exist and depending upon their location may warrant special mitigation.
There are also known sensitive cultural/archaeological sites within the project area. However, these sites have been effectively avoided during current exploration operations.
20.2 EXISTING PERMITS
The Project is currently operated as an advanced exploration project. Key permits associated with these activities include:
• Reclamation Permit # 0219 • Plan of Operations # N77104 • Air Permit for Surface Disturbance #AP 1041-2208
A reclamation bond in the amount of $222,081 is currently posted with the Bureau of Land Management (BLM) to guarantee that reclamation is performed on associated exploration activities at the site.
There are also numerous other permits in place that are maintained for the previous mine operation. These are maintained for the potential to amend them should a decision be made to reinitiate mining and processing at the site. Maintenance of these permits includes monthly, quarterly and annual monitoring and reporting. These permits include:
• Reclamation Permit #0037 • Water Pollution Control Permit #NEV 50006 • Groundwater Appropriation Permits #’s 53228, 53231, 53236 • Radio Station (FCC) License # 11216793 • Air Quality Operating Permit # AP 1041 1322 • Hazardous Materials Permit # 1168-2326 • Solid Waste Landfill Waiver # SWMI-08-10

Paramount Gold and Silver Corp. Technical Report – Sleeper Project Page 163
Scott E. Wilson Consulting, Inc. Sleeper Technical Report
• Industrial Artificial Pond Permit # S28231
A reclamation bond in the amount of $3,966,373 is currently posted with the BLM to guarantee that reclamation is performed on associated mine facilities and activities at the site.
Paramount is currently in compliance with all issued permits. However, the majority of the current permits address closure of the facilities.
20.3 PERMIT REQUIREMENTS FOR NEW MINING OPERATIONS
This section of the technical report summarizes the permits that will likely be required to conduct new mining activities at the Sleeper Project. In order to conduct mining and processing activities, the Project will need specific permits from the State of Nevada Division of Environmental Protection (NDEP) Bureau of Mining Regulation and Reclamation (BMRR) and Bureau of Air Pollution Control (BAPC) and the BLM. As part of the Sleeper Project resumption of mining and processing activities will require the BLM to comply with the National Environmental Policy Act (NEPA). NEPA Compliance will likely be through the development of an Environmental Impact Statement (EIS) based on an amended or new Plan of Operations. The following is a list of the major permits that will be required followed by a brief discussion of each.
• Plan of Operations/Nevada Reclamation Permit; • Water Pollution Control Permit; • Air Quality Operating Permit; • Water Rights; and • Industrial Artificial Pond Permit.
20.3.1 PLANS OF OPERATIONS/NEVADA RECLAMATION PERMIT
A Plan of Operations/Nevada Reclamation Permit (Plan) is a joint application that is submitted to the BLM and NDEP BMRR that utilizes a format accepted by the BLM and BMRR. The application will describe the operational procedures for the construction, operation, and closure of the Project. As required by the BLM and BMRR, the Plan will include a waste rock management plan, quality assurance plan, a storm water spill contingency plan, reclamation plan, a monitoring plan, and an interim management plan. In addition, the Plan includes a Reclamation Cost Estimate for the reclamation and closure of the Project. The mine design must be completed prior to submittal of the Plan.
20.3.2 WATER POLLUTION CONTROL PERMIT APPLICATION
The Water Pollution Control Permit (WPCP) application must address the open pit, waste rock dump, heap leach pad, mining activities, mill tailings and the water management system, as well as the potential for these facilities to degrade waters of the state. The application includes an engineering design for the waste rock dump, a waste characterization report and a modeling report for the closure of the waste rock dump, heap leach pads and tailings storage facility, as well as an engineering design for the water management system.
Paramount Gold and Silver Corp. Technical Report – Sleeper Project Page 164
Scott E. Wilson Consulting, Inc. Sleeper Technical Report
A Tentative Plan for Permanent Closure must also be completed and submitted to the NDEP BMRR in conjunction with the WPCP. A Final Permanent Closure Plan will need to be developed two years prior to Project closure.
20.3.3 AIR QUALITY OPERATING PERMIT
A Title V Permit Application for those portions of the stationary sources that have the potential to emit pollutants, including mercury, must be prepared using BAPC forms. The Application includes a description of the facility and a detailed emission inventory. The Application also includes locations, plot plans, and process flow diagrams. The Application must also include a fugitive dust control plan to be used during construction and operation of the Project. The processing facility will treat loaded carbon and electrowinning precipitate; therefore, a Mercury Air Quality Permit application will also be necessary, which is required to address the necessary federal and state mercury controls.
20.3.4 WATER RIGHTS
Water rights are needed from the Nevada Division of Water Resources (NDWR) to remove and utilize the water from the mining operation and to provide water for the public water system. Water management is likely to be a major issue due to the dewatering requirements and will involve the NDEP, Nevada State Engineer and Nevada Department of Wildlife (NDOW) the current administer of the Sleeper Pit Lake).
Historically, dewatering operations at the Sleeper Project directed the water into an artificial wetland, which allowed reinfiltration into the alluvial aquifer system; however, this activity also resulted in losses due to evaporation. Current, the industry practice is to develop a rapid infiltration basin to reduce the amount of evaporation losses. It is likely that any new dewatering system at Sleeper will require a rapid infiltration basin to minimize evaporative loss because the dewatering water right does not include consumption by the mine.
20.3.5 INDUSTRIAL ARTIFICIAL POND PERMIT
The development of the water storage pond(s), which is part of the water management system, will require an Industrial Artificial Pond Permit (IAPP) from the NDOW.
20.3.6 MINOR PERMITES AND APPLICATIONS
In addition to the above noted permits, Table 20.1 lists potential other notifications or ministerial permits that will likely be necessary to conduct the new mining operations.
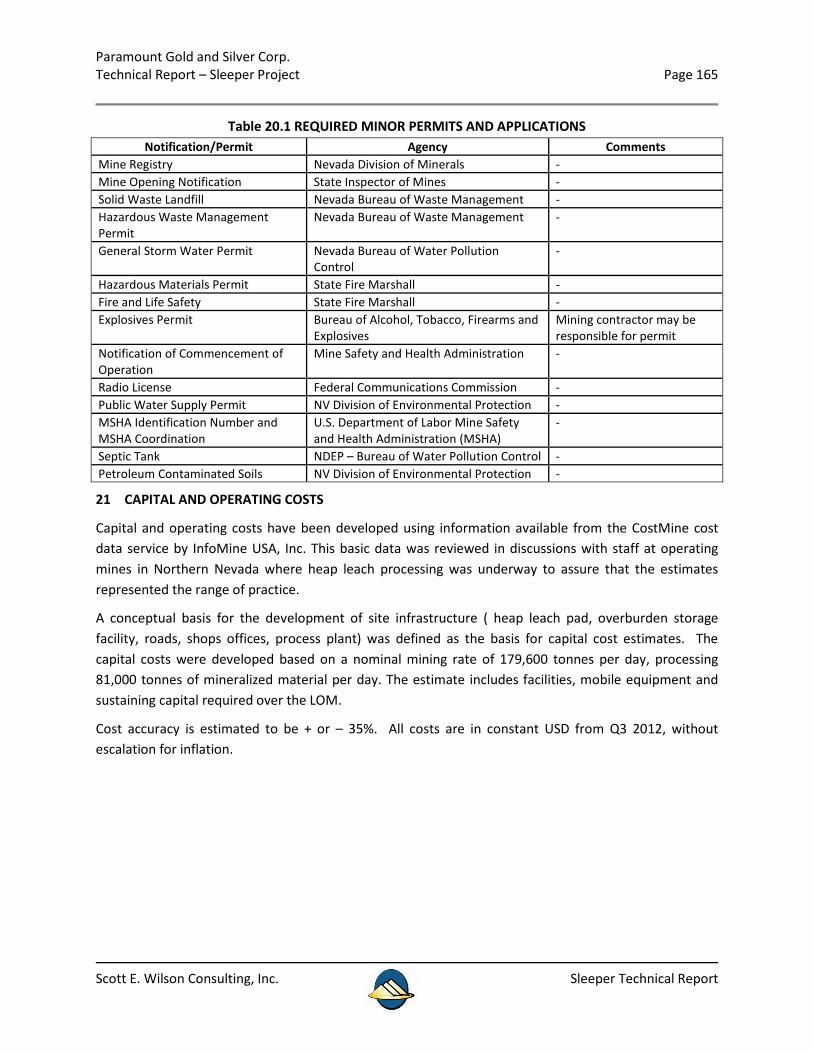
Paramount Gold and Silver Corp. Technical Report – Sleeper Project Page 165
Scott E. Wilson Consulting, Inc. Sleeper Technical Report
Table 20.1 REQUIRED MINOR PERMITS AND APPLICATIONS Notification/Permit Agency Comments
Mine Registry Nevada Division of Minerals - Mine Opening Notification State Inspector of Mines - Solid Waste Landfill Nevada Bureau of Waste Management - Hazardous Waste Management Permit
Nevada Bureau of Waste Management -
General Storm Water Permit Nevada Bureau of Water Pollution Control
-
Hazardous Materials Permit State Fire Marshall - Fire and Life Safety State Fire Marshall - Explosives Permit Bureau of Alcohol, Tobacco, Firearms and
Explosives Mining contractor may be responsible for permit
Notification of Commencement of Operation
Mine Safety and Health Administration -
Radio License Federal Communications Commission - Public Water Supply Permit NV Division of Environmental Protection - MSHA Identification Number and MSHA Coordination
U.S. Department of Labor Mine Safety and Health Administration (MSHA)
-
Septic Tank NDEP – Bureau of Water Pollution Control - Petroleum Contaminated Soils NV Division of Environmental Protection -
21 CAPITAL AND OPERATING COSTS
Capital and operating costs have been developed using information available from the CostMine cost data service by InfoMine USA, Inc. This basic data was reviewed in discussions with staff at operating mines in Northern Nevada where heap leach processing was underway to assure that the estimates represented the range of practice.
A conceptual basis for the development of site infrastructure ( heap leach pad, overburden storage facility, roads, shops offices, process plant) was defined as the basis for capital cost estimates. The capital costs were developed based on a nominal mining rate of 179,600 tonnes per day, processing 81,000 tonnes of mineralized material per day. The estimate includes facilities, mobile equipment and sustaining capital required over the LOM.
Cost accuracy is estimated to be + or – 35%. All costs are in constant USD from Q3 2012, without escalation for inflation.
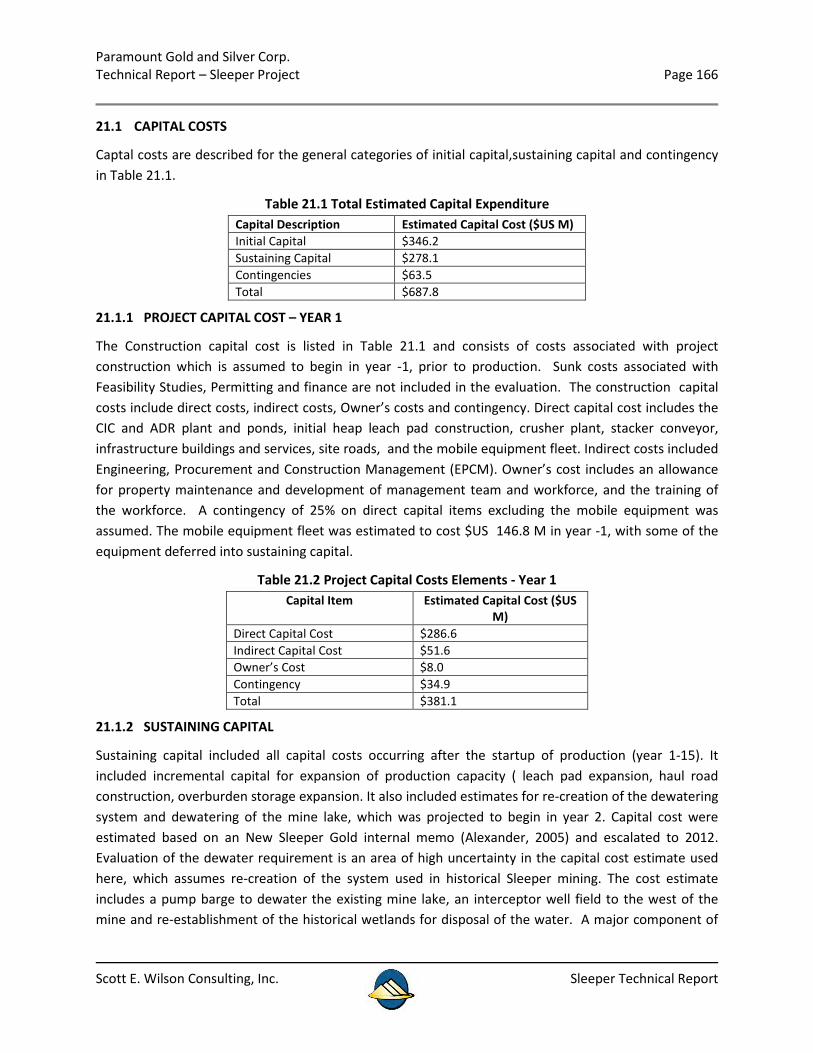
Paramount Gold and Silver Corp. Technical Report – Sleeper Project Page 166
Scott E. Wilson Consulting, Inc. Sleeper Technical Report
21.1 CAPITAL COSTS
Captal costs are described for the general categories of initial capital,sustaining capital and contingency in Table 21.1.
Table 21.1 Total Estimated Capital Expenditure Capital Description Estimated Capital Cost ($US M) Initial Capital $346.2 Sustaining Capital $278.1 Contingencies $63.5 Total $687.8
21.1.1 PROJECT CAPITAL COST – YEAR 1
The Construction capital cost is listed in Table 21.1 and consists of costs associated with project construction which is assumed to begin in year -1, prior to production. Sunk costs associated with Feasibility Studies, Permitting and finance are not included in the evaluation. The construction capital costs include direct costs, indirect costs, Owner’s costs and contingency. Direct capital cost includes the CIC and ADR plant and ponds, initial heap leach pad construction, crusher plant, stacker conveyor, infrastructure buildings and services, site roads, and the mobile equipment fleet. Indirect costs included Engineering, Procurement and Construction Management (EPCM). Owner’s cost includes an allowance for property maintenance and development of management team and workforce, and the training of the workforce. A contingency of 25% on direct capital items excluding the mobile equipment was assumed. The mobile equipment fleet was estimated to cost $US 146.8 M in year -1, with some of the equipment deferred into sustaining capital.
Table 21.2 Project Capital Costs Elements - Year 1 Capital Item Estimated Capital Cost ($US
M) Direct Capital Cost $286.6 Indirect Capital Cost $51.6 Owner’s Cost $8.0 Contingency $34.9 Total $381.1
21.1.2 SUSTAINING CAPITAL
Sustaining capital included all capital costs occurring after the startup of production (year 1-15). It included incremental capital for expansion of production capacity ( leach pad expansion, haul road construction, overburden storage expansion. It also included estimates for re-creation of the dewatering system and dewatering of the mine lake, which was projected to begin in year 2. Capital cost were estimated based on an New Sleeper Gold internal memo (Alexander, 2005) and escalated to 2012. Evaluation of the dewater requirement is an area of high uncertainty in the capital cost estimate used here, which assumes re-creation of the system used in historical Sleeper mining. The cost estimate includes a pump barge to dewater the existing mine lake, an interceptor well field to the west of the mine and re-establishment of the historical wetlands for disposal of the water. A major component of
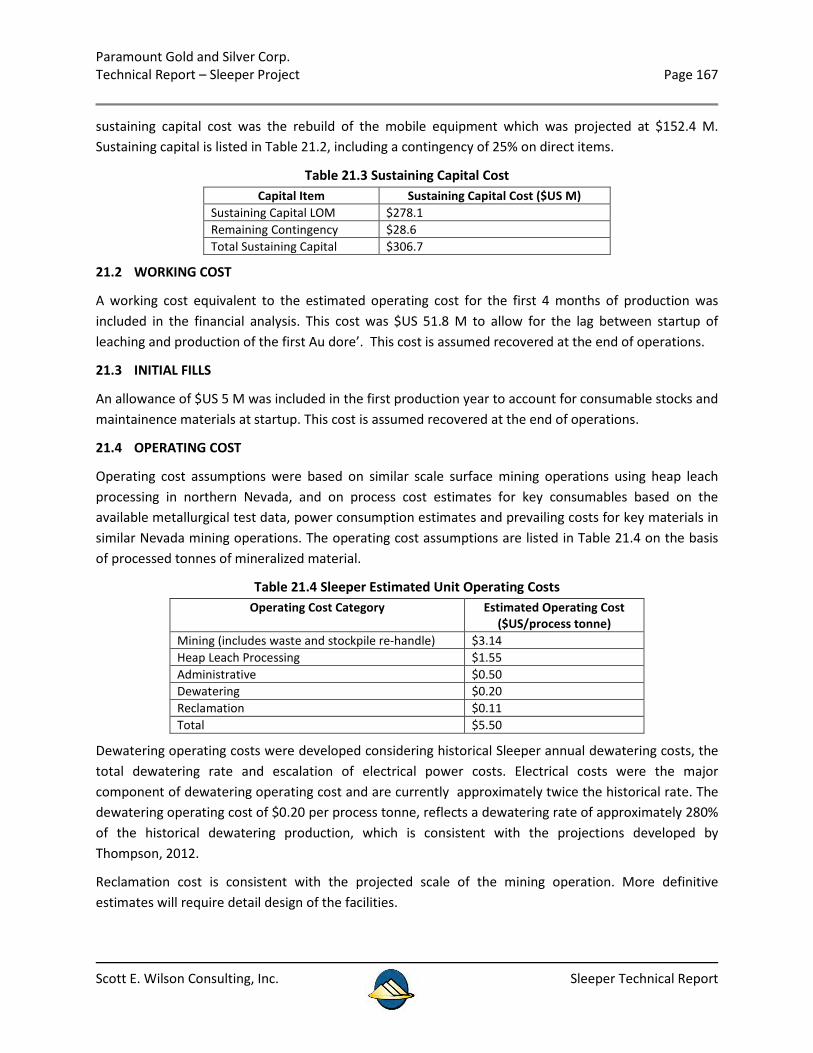
Paramount Gold and Silver Corp. Technical Report – Sleeper Project Page 167
Scott E. Wilson Consulting, Inc. Sleeper Technical Report
sustaining capital cost was the rebuild of the mobile equipment which was projected at $152.4 M. Sustaining capital is listed in Table 21.2, including a contingency of 25% on direct items.
Table 21.3 Sustaining Capital Cost Capital Item Sustaining Capital Cost ($US M)
Sustaining Capital LOM $278.1 Remaining Contingency $28.6 Total Sustaining Capital $306.7
21.2 WORKING COST
A working cost equivalent to the estimated operating cost for the first 4 months of production was included in the financial analysis. This cost was $US 51.8 M to allow for the lag between startup of leaching and production of the first Au dore’. This cost is assumed recovered at the end of operations.
21.3 INITIAL FILLS
An allowance of $US 5 M was included in the first production year to account for consumable stocks and maintainence materials at startup. This cost is assumed recovered at the end of operations.
21.4 OPERATING COST
Operating cost assumptions were based on similar scale surface mining operations using heap leach processing in northern Nevada, and on process cost estimates for key consumables based on the available metallurgical test data, power consumption estimates and prevailing costs for key materials in similar Nevada mining operations. The operating cost assumptions are listed in Table 21.4 on the basis of processed tonnes of mineralized material.
Table 21.4 Sleeper Estimated Unit Operating Costs Operating Cost Category Estimated Operating Cost
($US/process tonne) Mining (includes waste and stockpile re-handle) $3.14 Heap Leach Processing $1.55 Administrative $0.50 Dewatering $0.20 Reclamation $0.11 Total $5.50
Dewatering operating costs were developed considering historical Sleeper annual dewatering costs, the total dewatering rate and escalation of electrical power costs. Electrical costs were the major component of dewatering operating cost and are currently approximately twice the historical rate. The dewatering operating cost of $0.20 per process tonne, reflects a dewatering rate of approximately 280% of the historical dewatering production, which is consistent with the projections developed by Thompson, 2012.
Reclamation cost is consistent with the projected scale of the mining operation. More definitive estimates will require detail design of the facilities.
Paramount Gold and Silver Corp. Technical Report – Sleeper Project Page 168
Scott E. Wilson Consulting, Inc. Sleeper Technical Report
22 ECONOMIC ANALYSIS
An economic evaluation of the Sleeper gold project was performed based on the schedule of production physicals from Section 16 and the capital and operating cost estimates in Section 21. The evaluation assumes constant US dollars from Q3 2012 and does not consider any royalty or tax. A constant gold price of $US 1,384 per Au ounce and a constant silver price of $US 26 per Ag ounce were assumed for a base case evaluation, based on trailing 3 year averages as of July 3, 2012. No escalation of costs beyond Q3 2012 is assumed in the analysis. Construction of the project is assumed to require 1 year before startup of production, with an LOM of 17 years. Active mining would be conducted for 14 years, with year 15 required to exhaust the stockpile of mineralized material. Recovery of metal inventory is assumed during rinse down of the leach pad in years 16 and 17.
The gold/silver production model assumes an inventory buildup of 15% of the recoverable metal in year 1 to account for the startup of the metal leaching. Pad inventory is assumed to continue increasing at a rate of 11% of recoverable metal production in year 2 -15. Recovery of the year 1 inventory increment is assumed in year 3 and recovery of the metal inventory continues to year 17.
This PEA is preliminary in nature, and is based on technical and economic assumptions which will be evaluated in more advanced studies. The PEA is based on the Sleeper in-situ resource model (Even, Nur and Gochnour, October 2011) which consists of material in Measured, Indicated and Inferred classifications. Inferred mineral resources are considered too speculative geologically to have technical and economic considerations applied to them. The current basis of project information is not sufficient to convert the in-situ mineral resources to Mineral Reserves, and mineral resources that are not mineral reserves do not have demonstrated economic viability. Accordingly, there can be no certainty that the results estimated in this PEA will be realized. The PEA results are only intended as an initial, first-pass review of the potential project economics based on preliminary information.
The mineralized material scheduled to heap leach processing was classified as 46% Measured, 21% Indicated and 32% Inferred.
22.1 ECONOMIC PERFORMANCE PARAMETERS
Mining physicals in the production schedule from Table 16.4 were used with unit operating cost assumptions from Table 21.4 to calculate annual operating costs. Capital costs were input on an annual basis using a conceptual schedule for construction in year -1, followed by sustaining capital and contingencies over the LOM.
Economic and physical performance parameters are listed in Table 22.1, for the base case price assumptions, and for spot price assumptions as at July 3, 2012.
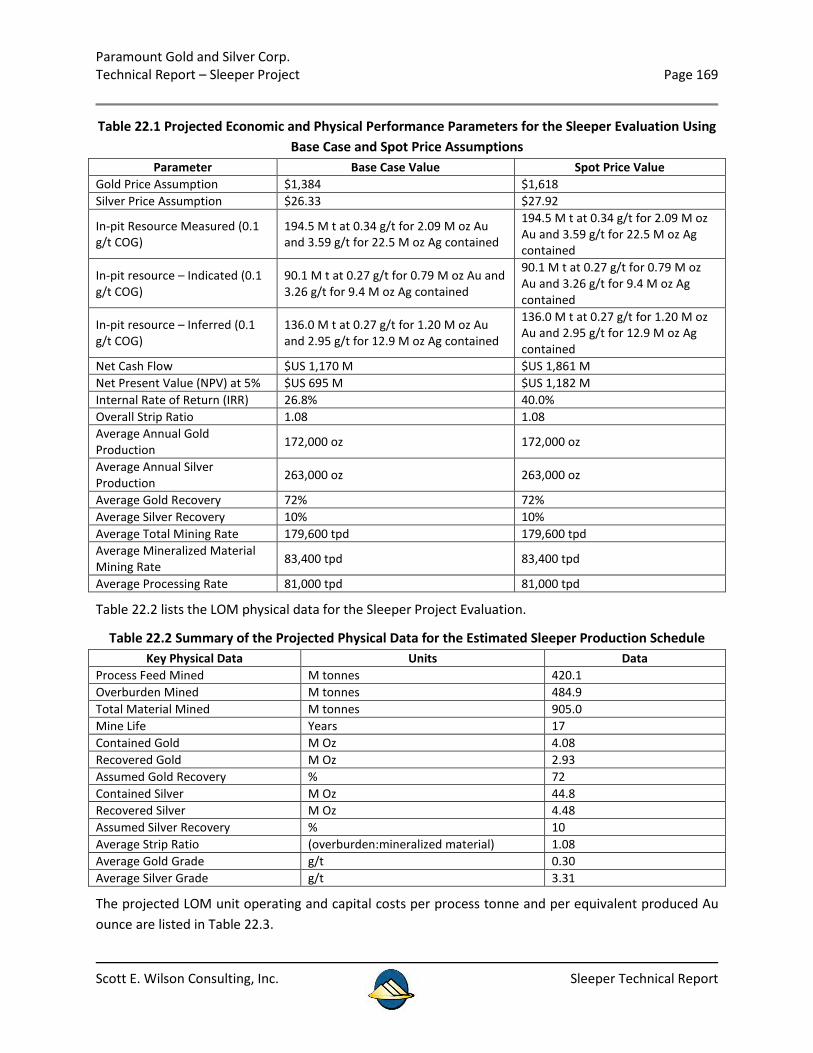
Paramount Gold and Silver Corp. Technical Report – Sleeper Project Page 169
Scott E. Wilson Consulting, Inc. Sleeper Technical Report
Table 22.1 Projected Economic and Physical Performance Parameters for the Sleeper Evaluation Using Base Case and Spot Price Assumptions
Parameter Base Case Value Spot Price Value Gold Price Assumption $1,384 $1,618 Silver Price Assumption $26.33 $27.92
In-pit Resource Measured (0.1 g/t COG)
194.5 M t at 0.34 g/t for 2.09 M oz Au and 3.59 g/t for 22.5 M oz Ag contained
194.5 M t at 0.34 g/t for 2.09 M oz Au and 3.59 g/t for 22.5 M oz Ag contained
In-pit resource – Indicated (0.1 g/t COG)
90.1 M t at 0.27 g/t for 0.79 M oz Au and 3.26 g/t for 9.4 M oz Ag contained
90.1 M t at 0.27 g/t for 0.79 M oz Au and 3.26 g/t for 9.4 M oz Ag contained
In-pit resource – Inferred (0.1 g/t COG)
136.0 M t at 0.27 g/t for 1.20 M oz Au and 2.95 g/t for 12.9 M oz Ag contained
136.0 M t at 0.27 g/t for 1.20 M oz Au and 2.95 g/t for 12.9 M oz Ag contained
Net Cash Flow $US 1,170 M $US 1,861 M Net Present Value (NPV) at 5% $US 695 M $US 1,182 M Internal Rate of Return (IRR) 26.8% 40.0% Overall Strip Ratio 1.08 1.08 Average Annual Gold Production 172,000 oz 172,000 oz
Average Annual Silver Production 263,000 oz 263,000 oz
Average Gold Recovery 72% 72% Average Silver Recovery 10% 10% Average Total Mining Rate 179,600 tpd 179,600 tpd Average Mineralized Material Mining Rate 83,400 tpd 83,400 tpd
Average Processing Rate 81,000 tpd 81,000 tpd
Table 22.2 lists the LOM physical data for the Sleeper Project Evaluation.
Table 22.2 Summary of the Projected Physical Data for the Estimated Sleeper Production Schedule Key Physical Data Units Data
Process Feed Mined M tonnes 420.1 Overburden Mined M tonnes 484.9 Total Material Mined M tonnes 905.0 Mine Life Years 17 Contained Gold M Oz 4.08 Recovered Gold M Oz 2.93 Assumed Gold Recovery % 72 Contained Silver M Oz 44.8 Recovered Silver M Oz 4.48 Assumed Silver Recovery % 10 Average Strip Ratio (overburden:mineralized material) 1.08 Average Gold Grade g/t 0.30 Average Silver Grade g/t 3.31
The projected LOM unit operating and capital costs per process tonne and per equivalent produced Au ounce are listed in Table 22.3.
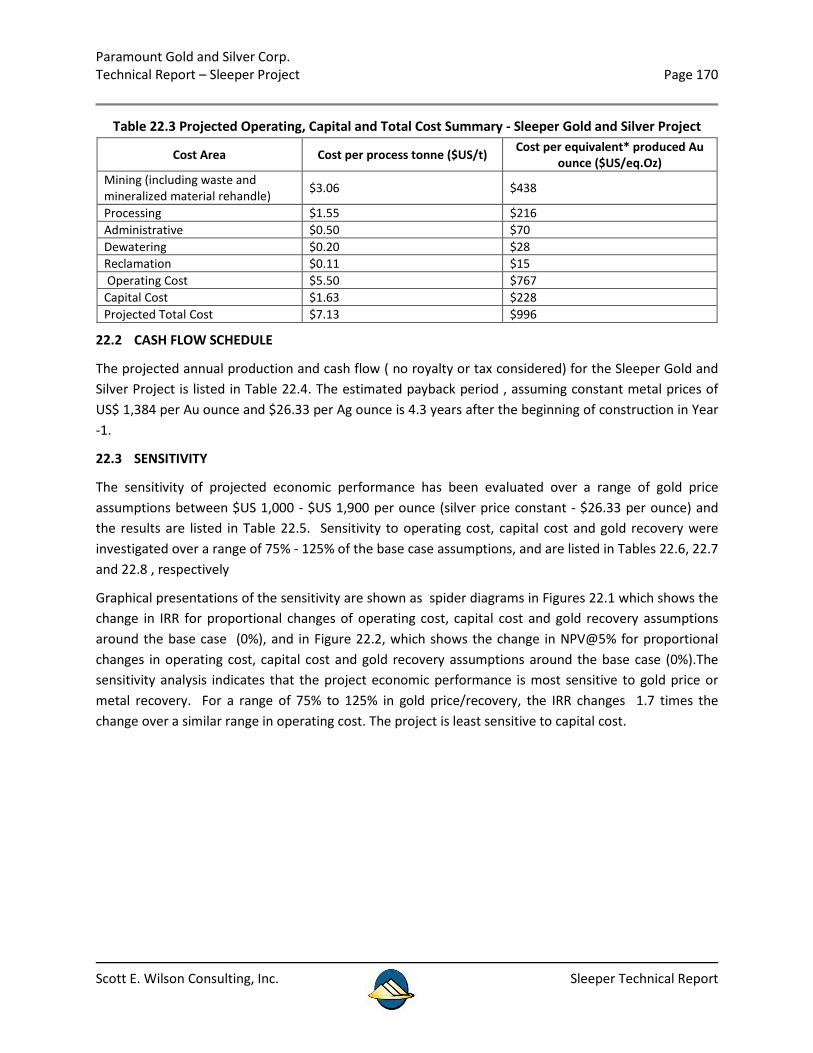
Paramount Gold and Silver Corp. Technical Report – Sleeper Project Page 170
Scott E. Wilson Consulting, Inc. Sleeper Technical Report
Table 22.3 Projected Operating, Capital and Total Cost Summary - Sleeper Gold and Silver Project
Cost Area Cost per process tonne ($US/t) Cost per equivalent* produced Au ounce ($US/eq.Oz)
Mining (including waste and mineralized material rehandle) $3.06 $438
Processing $1.55 $216 Administrative $0.50 $70 Dewatering $0.20 $28 Reclamation $0.11 $15 Operating Cost $5.50 $767 Capital Cost $1.63 $228 Projected Total Cost $7.13 $996
22.2 CASH FLOW SCHEDULE
The projected annual production and cash flow ( no royalty or tax considered) for the Sleeper Gold and Silver Project is listed in Table 22.4. The estimated payback period , assuming constant metal prices of US$ 1,384 per Au ounce and $26.33 per Ag ounce is 4.3 years after the beginning of construction in Year -1.
22.3 SENSITIVITY
The sensitivity of projected economic performance has been evaluated over a range of gold price assumptions between $US 1,000 - $US 1,900 per ounce (silver price constant - $26.33 per ounce) and the results are listed in Table 22.5. Sensitivity to operating cost, capital cost and gold recovery were investigated over a range of 75% - 125% of the base case assumptions, and are listed in Tables 22.6, 22.7 and 22.8 , respectively
Graphical presentations of the sensitivity are shown as spider diagrams in Figures 22.1 which shows the change in IRR for proportional changes of operating cost, capital cost and gold recovery assumptions around the base case (0%), and in Figure 22.2, which shows the change in NPV@5% for proportional changes in operating cost, capital cost and gold recovery assumptions around the base case (0%).The sensitivity analysis indicates that the project economic performance is most sensitive to gold price or metal recovery. For a range of 75% to 125% in gold price/recovery, the IRR changes 1.7 times the change over a similar range in operating cost. The project is least sensitive to capital cost.
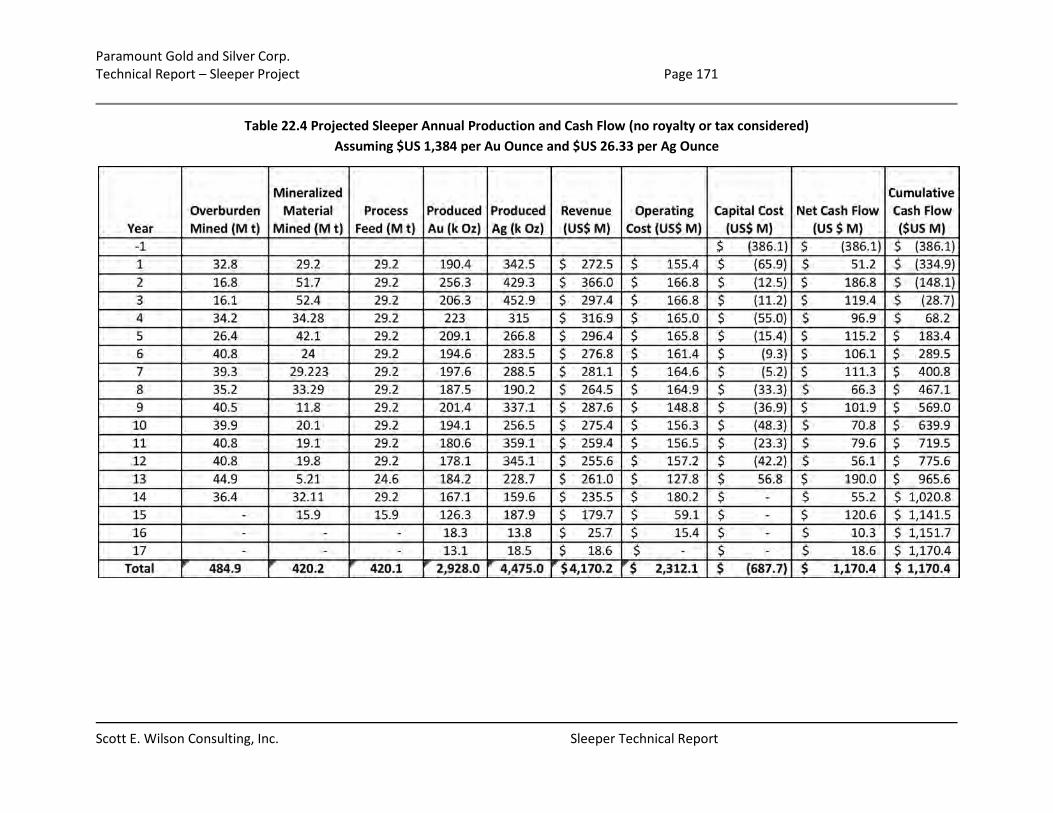
Paramount Gold and Silver Corp. Technical Report – Sleeper Project Page 171
Scott E. Wilson Consulting, Inc. Sleeper Technical Report
Table 22.4 Projected Sleeper Annual Production and Cash Flow (no royalty or tax considered) Assuming $US 1,384 per Au Ounce and $US 26.33 per Ag Ounce
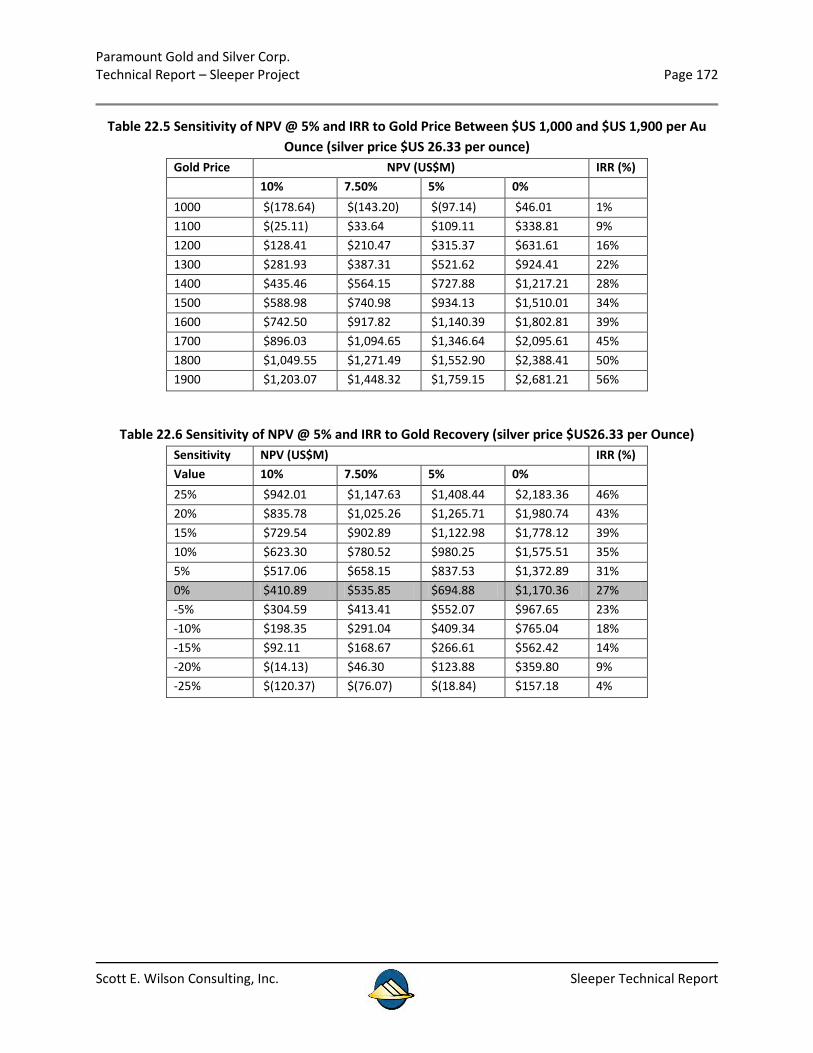
Paramount Gold and Silver Corp. Technical Report – Sleeper Project Page 172
Scott E. Wilson Consulting, Inc. Sleeper Technical Report
Table 22.5 Sensitivity of NPV @ 5% and IRR to Gold Price Between $US 1,000 and $US 1,900 per Au Ounce (silver price $US 26.33 per ounce)
Gold Price NPV (US$M) IRR (%) 10% 7.50% 5% 0% 1000 $(178.64) $(143.20) $(97.14) $46.01 1% 1100 $(25.11) $33.64 $109.11 $338.81 9% 1200 $128.41 $210.47 $315.37 $631.61 16% 1300 $281.93 $387.31 $521.62 $924.41 22% 1400 $435.46 $564.15 $727.88 $1,217.21 28% 1500 $588.98 $740.98 $934.13 $1,510.01 34% 1600 $742.50 $917.82 $1,140.39 $1,802.81 39% 1700 $896.03 $1,094.65 $1,346.64 $2,095.61 45% 1800 $1,049.55 $1,271.49 $1,552.90 $2,388.41 50% 1900 $1,203.07 $1,448.32 $1,759.15 $2,681.21 56%
Table 22.6 Sensitivity of NPV @ 5% and IRR to Gold Recovery (silver price $US26.33 per Ounce) Sensitivity NPV (US$M) IRR (%) Value 10% 7.50% 5% 0% 25% $942.01 $1,147.63 $1,408.44 $2,183.36 46% 20% $835.78 $1,025.26 $1,265.71 $1,980.74 43% 15% $729.54 $902.89 $1,122.98 $1,778.12 39% 10% $623.30 $780.52 $980.25 $1,575.51 35% 5% $517.06 $658.15 $837.53 $1,372.89 31% 0% $410.89 $535.85 $694.88 $1,170.36 27% -5% $304.59 $413.41 $552.07 $967.65 23% -10% $198.35 $291.04 $409.34 $765.04 18% -15% $92.11 $168.67 $266.61 $562.42 14% -20% $(14.13) $46.30 $123.88 $359.80 9% -25% $(120.37) $(76.07) $(18.84) $157.18 4%
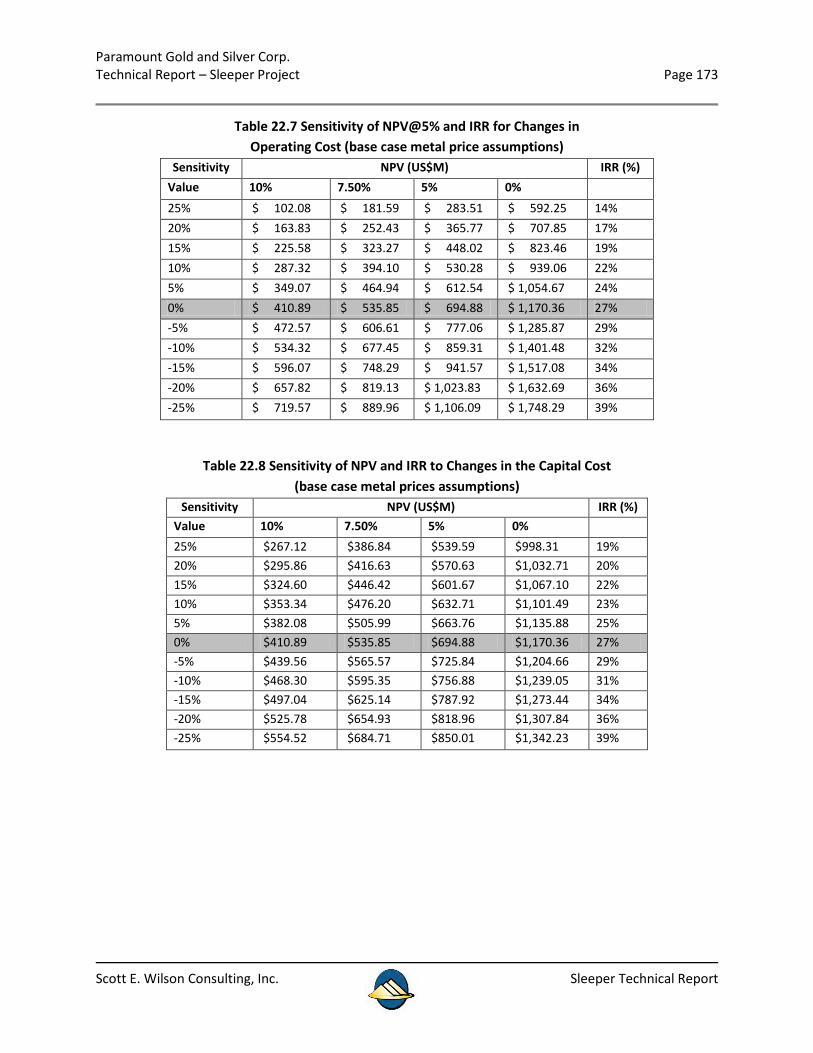
Paramount Gold and Silver Corp. Technical Report – Sleeper Project Page 173
Scott E. Wilson Consulting, Inc. Sleeper Technical Report
Table 22.7 Sensitivity of NPV@5% and IRR for Changes in Operating Cost (base case metal price assumptions)
Sensitivity NPV (US$M) IRR (%) Value 10% 7.50% 5% 0% 25% $ 102.08 $ 181.59 $ 283.51 $ 592.25 14% 20% $ 163.83 $ 252.43 $ 365.77 $ 707.85 17% 15% $ 225.58 $ 323.27 $ 448.02 $ 823.46 19% 10% $ 287.32 $ 394.10 $ 530.28 $ 939.06 22% 5% $ 349.07 $ 464.94 $ 612.54 $ 1,054.67 24% 0% $ 410.89 $ 535.85 $ 694.88 $ 1,170.36 27% -5% $ 472.57 $ 606.61 $ 777.06 $ 1,285.87 29% -10% $ 534.32 $ 677.45 $ 859.31 $ 1,401.48 32% -15% $ 596.07 $ 748.29 $ 941.57 $ 1,517.08 34% -20% $ 657.82 $ 819.13 $ 1,023.83 $ 1,632.69 36% -25% $ 719.57 $ 889.96 $ 1,106.09 $ 1,748.29 39%
Table 22.8 Sensitivity of NPV and IRR to Changes in the Capital Cost (base case metal prices assumptions)
Sensitivity NPV (US$M) IRR (%) Value 10% 7.50% 5% 0% 25% $267.12 $386.84 $539.59 $998.31 19% 20% $295.86 $416.63 $570.63 $1,032.71 20% 15% $324.60 $446.42 $601.67 $1,067.10 22% 10% $353.34 $476.20 $632.71 $1,101.49 23% 5% $382.08 $505.99 $663.76 $1,135.88 25% 0% $410.89 $535.85 $694.88 $1,170.36 27% -5% $439.56 $565.57 $725.84 $1,204.66 29% -10% $468.30 $595.35 $756.88 $1,239.05 31% -15% $497.04 $625.14 $787.92 $1,273.44 34% -20% $525.78 $654.93 $818.96 $1,307.84 36% -25% $554.52 $684.71 $850.01 $1,342.23 39%
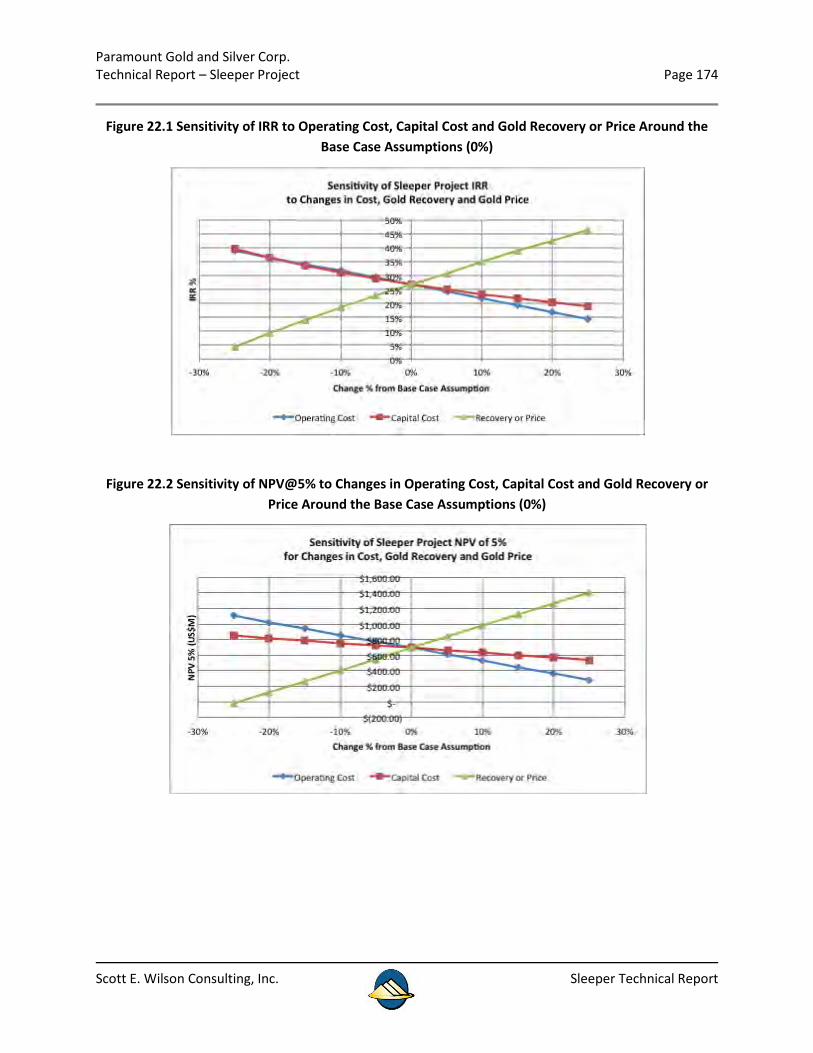
Paramount Gold and Silver Corp. Technical Report – Sleeper Project Page 174
Scott E. Wilson Consulting, Inc. Sleeper Technical Report
Figure 22.1 Sensitivity of IRR to Operating Cost, Capital Cost and Gold Recovery or Price Around the Base Case Assumptions (0%)
Figure 22.2 Sensitivity of NPV@5% to Changes in Operating Cost, Capital Cost and Gold Recovery or Price Around the Base Case Assumptions (0%)

Paramount Gold and Silver Corp. Technical Report – Sleeper Project Page 175
Scott E. Wilson Consulting, Inc. Sleeper Technical Report
23 ADJACENT PROPERTIES
No adjacent properties are known to impact the Sleeper Project.

Paramount Gold and Silver Corp. Technical Report – Sleeper Project Page 176
Scott E. Wilson Consulting, Inc. Sleeper Technical Report
24 OTHER RELEVANT DATA AND INFORMATION
This is no other relevant data or information are known to exist at this time.
Paramount Gold and Silver Corp. Technical Report – Sleeper Project Page 177
Scott E. Wilson Consulting, Inc. Sleeper Technical Report
25 INTERPRETATION AND CONCLUSIONS
The Sleeper gold-silver deposit represents a project with a great deal of potential for being an important gold producer in Nevada once again.
The project economic evaluation indicates a strong and positive performance for the conceptual Sleeper Project considered based on the technical assumptions and current metal price environment. The project performance is most sensitive to gold price and gold recovery. Metallurgical data available at this time is limited, and creates uncertainity that should be address as the project evolves with an expanded metallurgical investigation. Other uncertainty exists around the dewater assumptions used in the PEA, and more detailed evaluation of dewater should be performed for future work since this technical assumption will affect both mine performance and permitting.
Exploration potential adjacent to the mine is very positive as well as brownfield opportunities in the other target within the claim block that still remain to be tested (although overall exploration potential was not part of SRK’s work scope, this potential was recognized nonetheless.
Au and Ag mineralization display various controls, including sub-vertical feeder structures and stockwork halos as well as bedding-parallel controls. The latter, is particularly seen at Facility, related to what has been interpreted in the model presented here in this report, as the base of the rhyolite (either as a flow or dome) and the contact with the underlying Mesozoic basement. These mineralization trends have not been extensively drilled, and present strong potential for continuity for increasing resources at the project.

Paramount Gold and Silver Corp. Technical Report – Sleeper Project Page 178
Scott E. Wilson Consulting, Inc. Sleeper Technical Report
26 RECOMMENDATIONS
Project Development
SEWC recommends that an overall project development strategy be developed by Paramount to focus future work on the outstanding areas of uncertainty in project information. SEWC has identified two areas of technical uncertainty with the highest priority for information development, Metallurgical Recovery and Dewatering.
• Metallurgical Recovery assumptions are based on limited testing information. An expanded metallurgical testing program should be developed to verify metallurgical recovery assumptions for the Facility Zone, deeper Sleeper Zone and mineralized Waste Dumps. This will require a drilling program to develop sample materials.
• Dewatering Engineering to be advanced. Dewatering projections should address the expanded mine shapes and water disposal through re-establishment of wetlands or a rapid infiltration basin.
QA/QC Controls
SRK recommends that the QA/QC sample and laboratory analysis evaluation be done on a regular basis during drill hole campaigns. When QA/QC analyses are completed after the drill campaign, it can be too late for making necessary adaptations and corrections. Fortunately, there does not seem to a consistent problem with the laboratory analyses, however, more attention to detail in consistently sending check assays to other labs and submitting coarse reject duplicates for analysis should be made.
Geologic Model
The following recommendations are presented.
• Grades were used as a proxy for mineralization style in the model (vein, stockwork and dissemination). Identifying mineralization style consistently in the database would allow modeling these features directly in a more geologically consistent fashion.
• The lithological units presented here are preliminary, based on the grouping of codes mapped by different companies over a long period of time. It is recommended that the partition suggested here be used as a basis for future drill hole logging review campaigns, in order to produce an integrated lithological coding system applicable to the whole deposit.
• The structures used were determined primarily on the bases of Au grade distribution and previous interpretations and conceptual models. It is recommended that field and drill hole structural information be carefully reviewed and entered into a newly compiled and integrated database as a more detailed structural model will be necessary at a more advanced project stage.
Paramount Gold and Silver Corp. Technical Report – Sleeper Project Page 179
Scott E. Wilson Consulting, Inc. Sleeper Technical Report
27 REFERENCES
Alexander, G., 2005. Pit Dewatering, Internal Memo, New Sleeper Gold, from Glenn Alexander to Jim Smithson, June 1, 2005.
Bevan, Peter A., 2002, Sleeper Tailings Project, Winnemucca, Nevada, USA. Confidential report for X-Cal Resources Ltd. Dated October 11, 2002.
Borg, I. and Handin, J., 1966, Experimental deformation of crystalline rocks: Tectonophysics, v. 3(4), p. 249-368.
Bradley, Mark A., 2005, Progress Report – Sleeper Facilities Area. Confidential report for New Sleeper Gold LLC dated May 4, 2005.
Burke, D.B., and Silberling, N.J., 1973, The Auld Lang Syne Group, of Late Triassic and Jurassic(?) age, north-central Nevada: U.S. Geol. Survey Bull. 1394-E, p. E1E14.
Chevillon, Vic, 2006, Internal memo to X-Cal Resources of August 14, 2006.
Conrad, J.E., McKee, E.H., Rytuba, J.J., Nash, J.T., and Utterback, W.C., 1993, Geochronology of the Sleeper deposit, Humboldt County, Nevada: Epithermal goldsilver mineralization following emplacement of a silicic flow-dome complex: Econ. Geol., v. 88, p. 317-327.
Corbett, G. J., 2005, Sleeper, Power Point presentation. Presented to New Sleeper Gold LLC staff April 2005.
Corbett, G.J., 2005, Comments on Continued Exploration at the Sleeper Gold Mine and Environs, Nevada. Confidential report for New Sleeper Gold LLC dated May 2005.
Crawford, A. E. J., 2007, Geologic Map of Nevada; USGS Data Series, DS-249
Doerner, Bill, 2005, New Sleeper Gold Corporation Titan – 24 Magnetic telluric Survey, Data Processing Inversion Interpretation. Confidential report for New Sleeper Gold LLC by Quantech Consulting Inc, Reno NV dated Sep 2005.
Doucette, John, 2005, Summary of XRF data for Silicic Rocks from Sleeper Mine Area. Confidential memo for New Sleeper Gold LLC dated Nov 2, 2005.
Even, George, Nur, Joled and Gochnour,Lee, 2012. Mineral Resource Estimation Sleeper Gold Project, Nevada, USA, SRK Consulting (Chile) S.A., October 2012.
Ferdock, Gregory C., Bradley, M., Ross, K., Martin, L., Fleming, A., Wellman, J., and Blair, K., 2005, Mineralogy and mineralization at the New Sleeper Gold project, Awakening Mining District, Slumbering Hills, Humboldt County, Nevada, in Rhoden, H.N., Steininger, R.C., and Vikre, P.G., eds., Geological Society of Nevada Symposium 2005: Window to the World, Reno, Nevada, May 2005,pp.497-510.
Ferdock, Gregory C., 2005, BC-03-03 Target Generation. Confidential memo for New Sleeper Gold LLC dated May 2005.
Paramount Gold and Silver Corp. Technical Report – Sleeper Project Page 180
Scott E. Wilson Consulting, Inc. Sleeper Technical Report
Ferdock, Gregory C., 2005, Mineralogical Sample Evaluation, placer gold collected from OP-01-05and BC-03-03. Confidential memo for New Sleeper Gold LLC dated Nov 2005.
Fleming, Adrian, 2005, Sleeper Project Nevada 2004 Report. Contributions from: Blair, K., Bradley, M., Doucette, J., Ferdock, G., Martin, L., O’Donnell, M., Ross, K., Wellman, J. Annual report for year ending 2004, for New Sleeper Gold Corp. and X-Cal Resources Ltd., dated April 2005.
Gustin, Michael M., Fleming, Adrian, 2004, Technical Report on the Sleeper Gold Project Nevada, USA, prepared for New Sleeper Gold Corp., dated March 5, 2004,
Hedenquist, Jeffrey W., 2005, Observations on the Sleeper Gold Project, Nevada. Confidential memo for X-Cal Resources dated December, 2005.
Histed, Rich, 2005, Trench ICP Analysis. Confidential report for New Sleeper Gold LLC dated August 2005.
Histed, Rich, 2005, Sleeper Range Front Review. Confidential report for New Sleeper Gold LLC dated August 27, 2005.
Histed, Rich, 2005, Range Front South Target Area. Confidential report for New Sleeper Gold LLC dated November 2005.
Giroux, Kornze, Martin, Technical Report 2008 On The Sleeper Gold Property, dated September 22, 2008.
Goldstrand, P.M., and Schmidt, K.W., 2000, Geology, mineralization, and ore controls at the Ken Snyder mine, Elko County, Nevada: Geol. Soc. Nevada, in Geology and Ore Deposits 2000: The Great Basin and Beyond Symposium, May 15-8, 2000, Reno-Sparks, Nevada, Proceedings, p. 265-287.
Jaacks, Jeffrey A., 2005, Review of Sleeper Soil Gas Program. Confidential report for New Sleeper Gold LLC dated Sep 26, 2005.
Jackson, Robert G., 2005, 3 D Geochemical Model of the Sleeper Low Sulphidation Gold System, Nevada. Confidential report for New Sleeper Gold LLC dated August 2005.
Jackson, Robert G., 2005, Recommendations for Mobile Soil Geochemical Surveys. Confidential memo for New Sleeper Gold LLC dated November 2005.
Kinakin, D., 2012a. Sleeper Gold Project Preliminary Economic Assessment-Open Pit Slope Design Recommendations, Preliminary, a letter report to Glen van Treek, VP Exploration, Paramount Gold & Silver Corp., from BGC Engineering Inc. , Report No. 1059-001, Vancouver, BC, February 10, 2012.
Martin, Larry G., 2005, Trench 03. Confidential report for New Sleeper Gold LLC dated April 2005.
Martin, Larry G., 2005, Targets to the North/Northwest. Confidential memo for New Sleeper Gold LLC dated May 26, 2005.
Martin, Larry G., 2005, Trench Update. Confidential memo for New Sleeper Gold LLC dated July 15, 2005.
Martin, Larry G., 2005, Photo Lineament Study. Confidential report for New Sleeper Gold LLC dated August 05, 2005.
Paramount Gold and Silver Corp. Technical Report – Sleeper Project Page 181
Scott E. Wilson Consulting, Inc. Sleeper Technical Report
Martin, Larry G., 2005, Trench Study. Confidential report for New Sleeper Gold LLC dated November 05, 2005.
McClelland, G., 2012. Report on Phase 2 Metallurgical Evaluation – Waste Dump, Westwood and Facilities Composites (“bench” scale tests), a report to Glen van Treek, VP Exploration, Paramount Gold & Silver Corp. , from McClelland Laboratories, Inc., Sparks, NV, January 27, 2012.
McPhie, J., Doyle, M., Allen, R., 1993, Volcanic Textures, A guide to the interpretation of textures in volcanic rocks. Centre for ore deposit OD and Exploration Studies, University of Tasmania, 198p.
MRDI, 1997, Modeling and resource estimation of the Facility, Saddle, West Wood, and Silica Cap area, Sleeper Gold Property: report by Mineral Resources Development for Placer Dome U.S. Inc. and X-Cal Resources Ltd., 155 p.
Nash, J.T., Utterback, W.C., and Saunders, J.A., 1991, Geology and geochemistry of the Sleeper gold deposits, Humboldt County, Nevada, an interim report, in Raines, G.L., Lisle, R.E., Schafer, R.W., and Wilkinson, W.H., eds., Geology and ore deposits of the Great Basin, Symposium proceedings: Reno, Geological Society of Nevada and U.S. Geological Survey, p. 1063-1084.
Nash, J.T., Utterback, W.C., and Trudel, W.C., 1995, Geology and geochemistry of Tertiary volcanic host rocks, Sleeper gold-silver deposit, Humboldt County, Nevada:
U.S. Geological Survey Bulletin 2090, 63 p.
Nyman, Mark, 2005, Notes Regarding Northwest Sleeper Drill Target. Confidential memo for New Sleeper Gold LLC dated November 3, 2005.
O’Donnell, Megan, 2005, Red Mercury Concept Test Proposal – Phase I. Confidential memo for New Sleeper Gold LLC dated November 2005.
Proteus, 2002. Information Memorandum: X-Cal Resources Ltd., dated August 6, 2002 by Proteus Capital Corporation, 30 p.
Redfern, R.R and Rowe, W.A., 2003, Technical Report on the Sleeper Gold Property for X-Cal Resources Ltd., dated December 2003, 118 p.
Ross, Ken, 2005, Preliminary Report on Mineralization of the West Wood Breccias. Confidential report for New Sleeper Gold LLC dated December 2005.
Rowe, Winthrop A., 1998, Sleeper Gold Project, internal memo for X-Cal Resources Ltd, report dated June, 1998, 69 p.
Rowe, Winthrop A., 2004, General Observations on the Deep Core Holes Under the Sleeper Pit. Confidential memo for New Sleeper Gold LLC dated August, 2004.
Sierra Mining and & Engineering LLC, November, 1999, Mineral Inventory Report – Sleeper Mine, Humboldt Co., NV for X-Cal Resources, Ltd.
Paramount Gold and Silver Corp. Technical Report – Sleeper Project Page 182
Scott E. Wilson Consulting, Inc. Sleeper Technical Report
Sillitoe, Richard H., 2006, Exploration Potential of the Sleeper Project, Nevada. Confidential memo for X-Cal Resources dated January, 2006.
Smithson, Jim, 2005, Environmental reports, monitor sampling and observations, compliance documents, regulatory agency reports, confidential memos to Sleeper Joint Venture.
Snyder, Ken, 2005, Sleeper Exploration Review. Memo dated May 9, 2005.
Snyder, Ken, 2005, Status of Sleeper Project, Exploration. Memo dated June 27, 2005.
Snyder, Ken, 2005, Sleeper Technical Summit. Memo dated Sep 30, 2005.
Tarnocai, C. 2000, Structural setting of the Sleeper Project, Confidential Memo with maps and plates for Placer Dome, made available to X-Cal, dated October, 2000, 3p.
Taylor, John D., 2007, Sleeper Project – Blasthole Modeling Update, Confidential memo to X-Cal Resources Ltd.
Thomason, R.E., Kornze, L., and Rowe, W.A., 2006, Technical Report on the Sleeper Gold Property for X-Cal Resources Ltd., report dated March 12, 2006, 149 p.
Thompson, R., 2012b. Sleeper Gold Project Preliminary Economic Assessment-Open Pit Depressurization Recommendations, Preliminary, a letter report to Glen van Treek, VP Exploration, Paramount Gold & Silver Corp., from BGC Engineering Inc., Report No. 1059-001, Vancouver, BC, February 10, 2010.
Utterback, William C., 2005, Critical Review and Commentary of: “Comments on Continued Exploration at the Sleeper Gold Mine and Environs, Nevada”, Corbett, G.J., May 2005. Confidential report for New Sleeper Gold LLC dated Sep 18, 2005.
Utterback, William C., 2005, Conclusions and Recommendations Resulting from Drill Core Features. Confidential report for New Sleeper Gold LLC dated Aug 18, 2005.
White, T.L., 2003, Airborne Magnetic survey and IP survey lines for the Sleeper Project: Internal report and verbal communications to X-Cal Resources Ltd., 2 p.
Willden, R., 1964, Geology and mineral deposits of Humboldt County, Nevada: Nevada Bur. Mines Geol. Bull. 59, 154 p.
Wood, J.D., 1988, Geology of the Sleeper gold deposit, Humboldt County, Nevada, in Schafer, R.W., et al., eds., Bulk mineable precious metal deposits of the Western United States: Reno, Geological Society of Nevada, p. 293-302.
Wood, J.D., and Hamilton, S.K., 1991, The Sleeper gold-silver deposit: Discovery through feasibility: Econ. Geol. Monograph 8, p. 289-299.
Wright, James L., 2005, Sleeper Property Induced Polarization Inverted Sections. Confidential report for New Sleeper Gold LLC dated Jan 15, 2005.
Wright, James L., 2005, Sleeper Property Gravity and Induced Polarization Surveys GIS Database. Confidential report for New Sleeper Gold LLC dated Jan 15, 2005.
Paramount Gold and Silver Corp. Technical Report – Sleeper Project Page 183
Scott E. Wilson Consulting, Inc. Sleeper Technical Report
Wright, James L., 2005, Sleeper Property Induced Polarization Survey. Confidential report for New Sleeper Gold LLC dated April 25, 2005.
Wright, James L., 2005, Sleeper Property Magnetic – Telluric Survey GIS Database.
Zamudio, Joe, 2005, ASD mineralogical determinations of selected holes from Sleeper Gold Project. Internal confidential memos to Sleeper Joint Venture.
Zoutomou, Edouard K., 2007, Sleeper Mine Tailings and Heap Evaluation as Potential Gold Resources. Confidential report to X-Cal Resources Ltd

Paramount Gold and Silver Corp. Technical Report – Sleeper Project Page 184
Scott E. Wilson Consulting, Inc. Sleeper Technical Report
Appendices

Appendix A Claim List
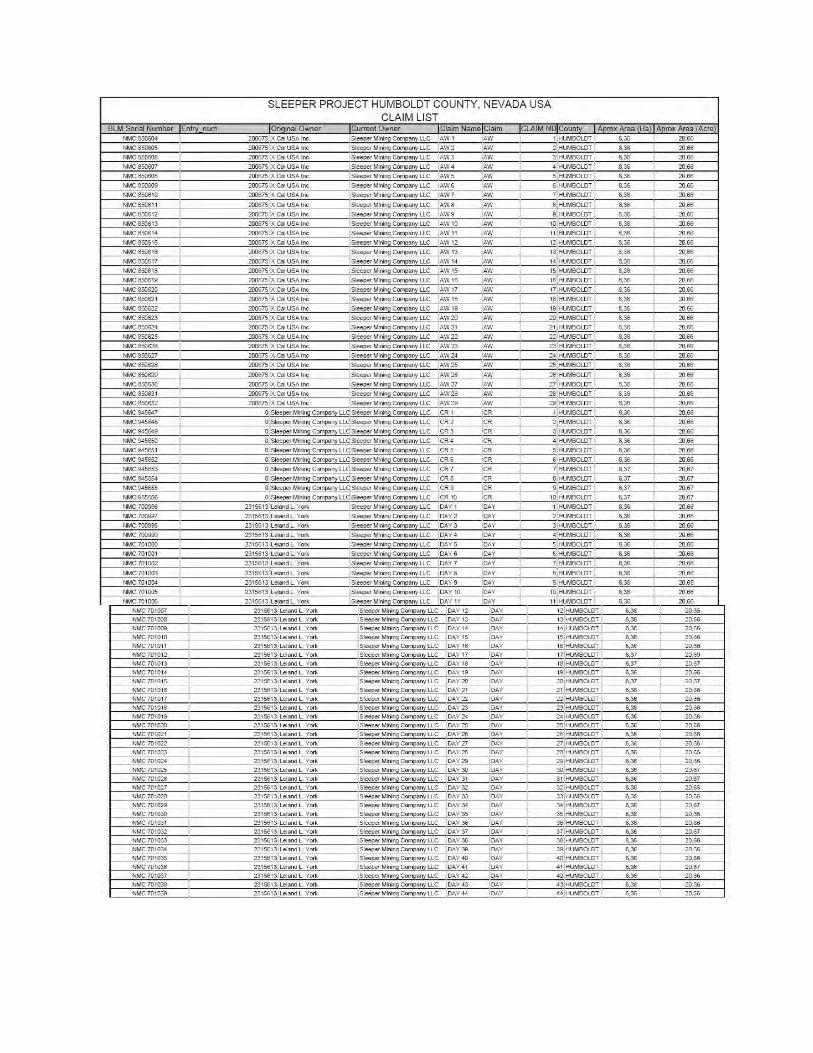
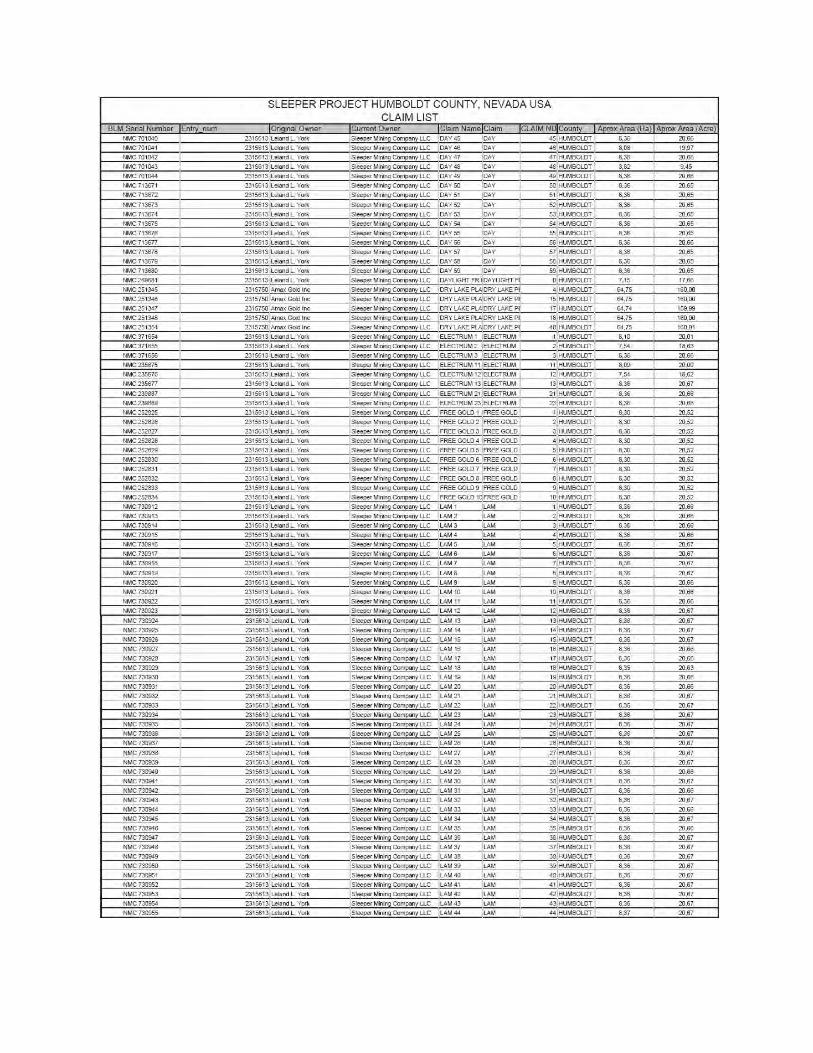
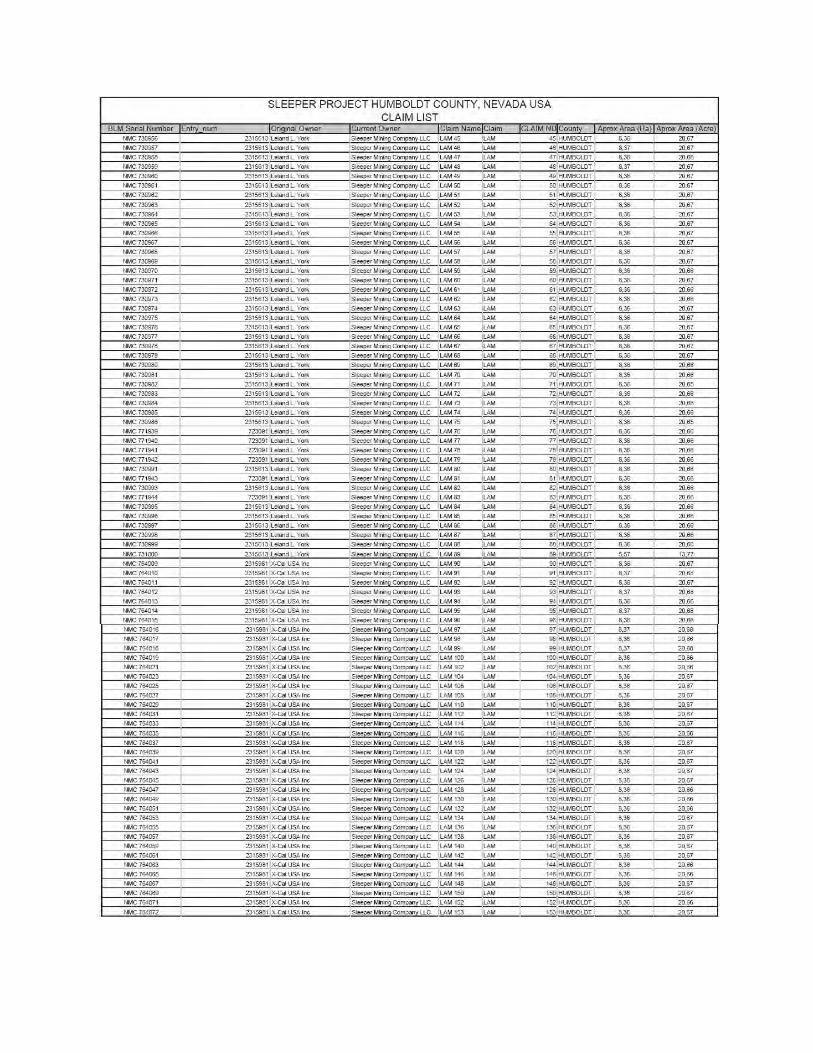
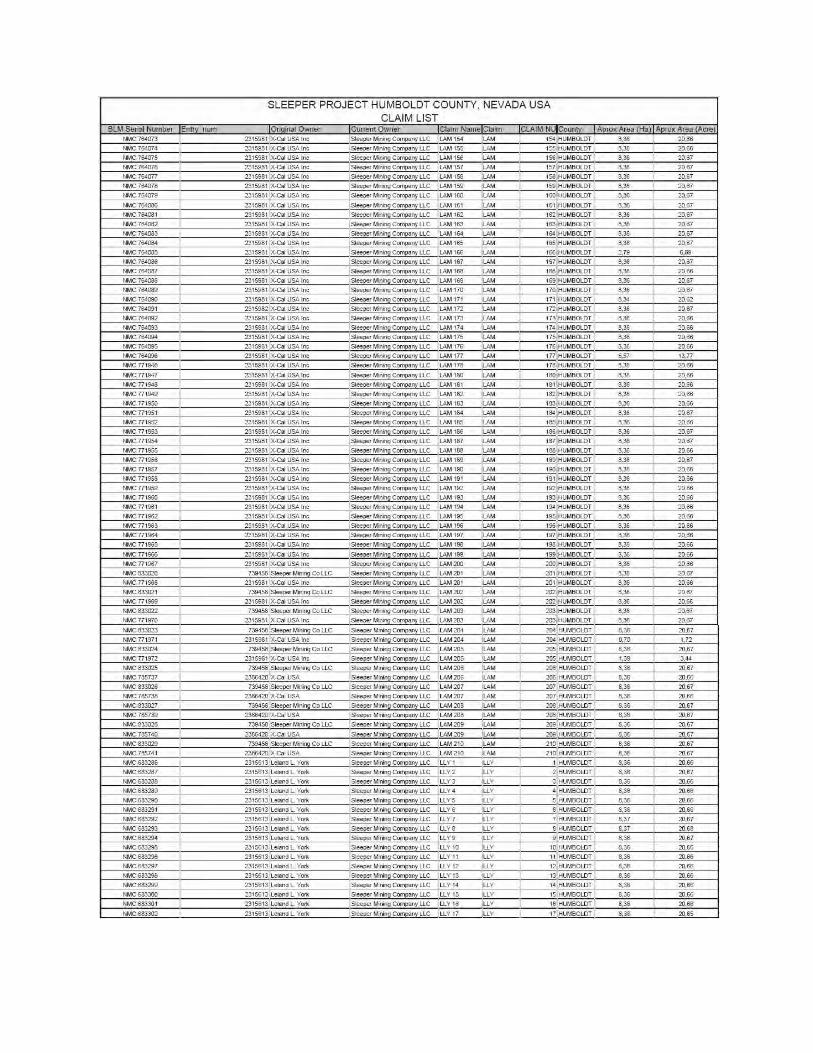

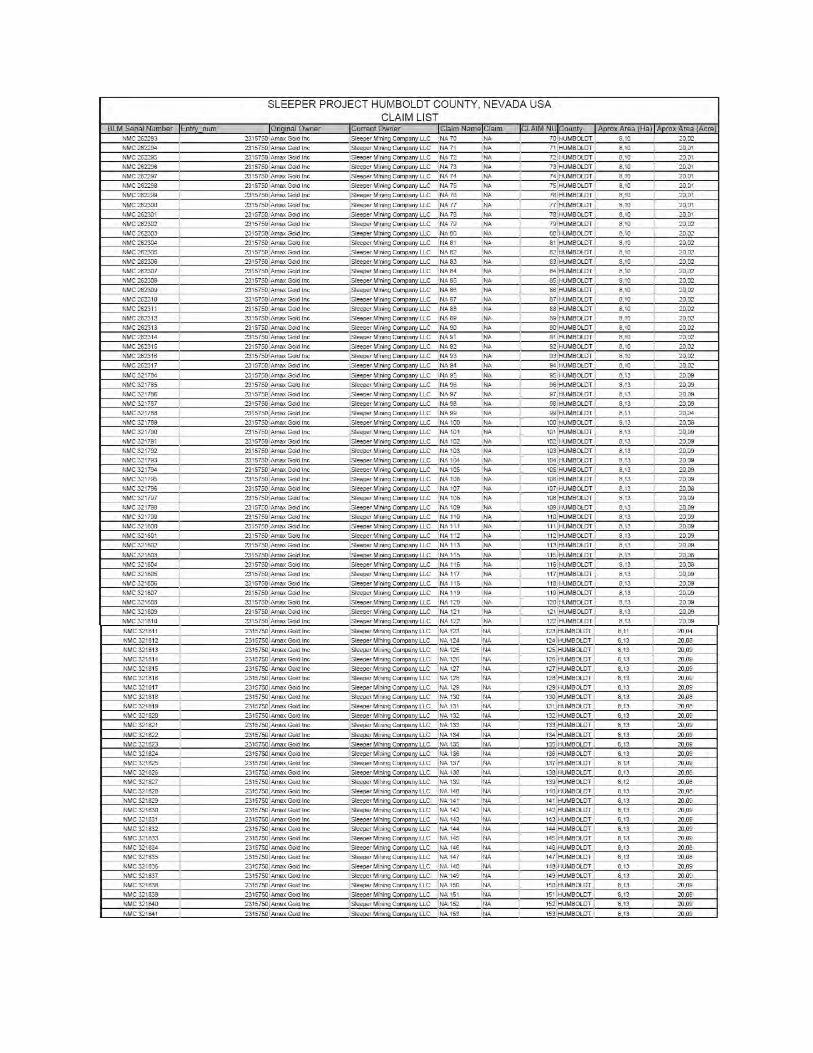
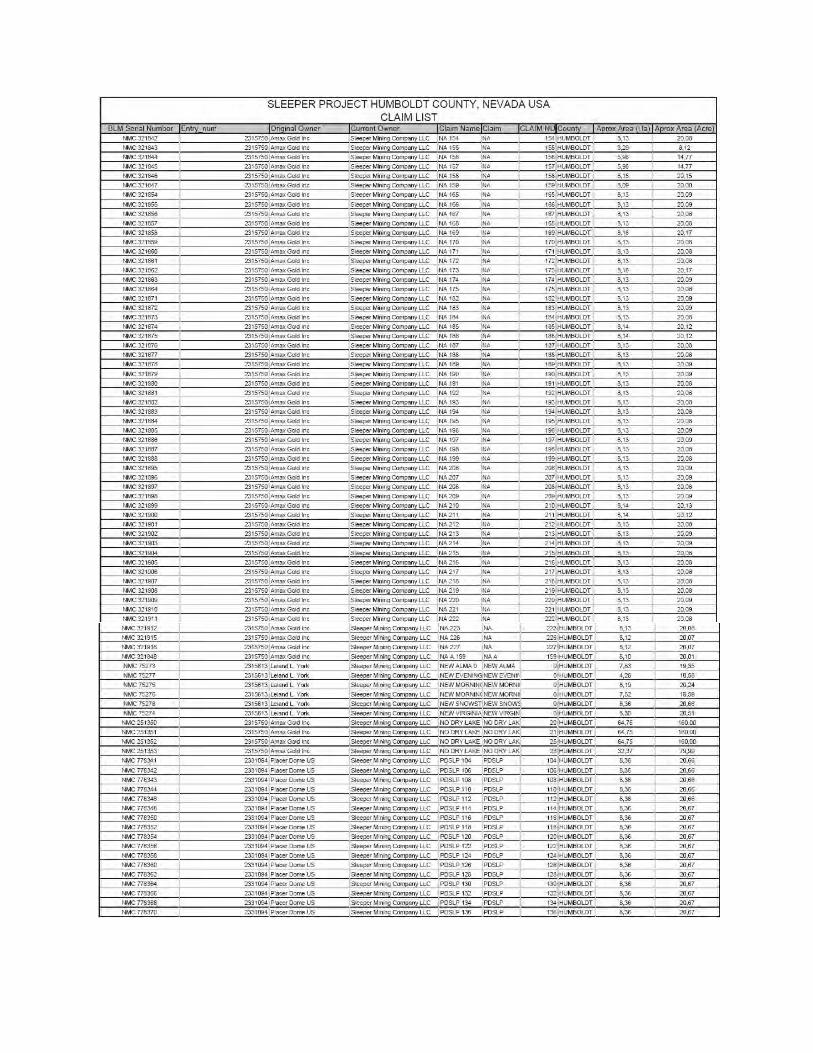
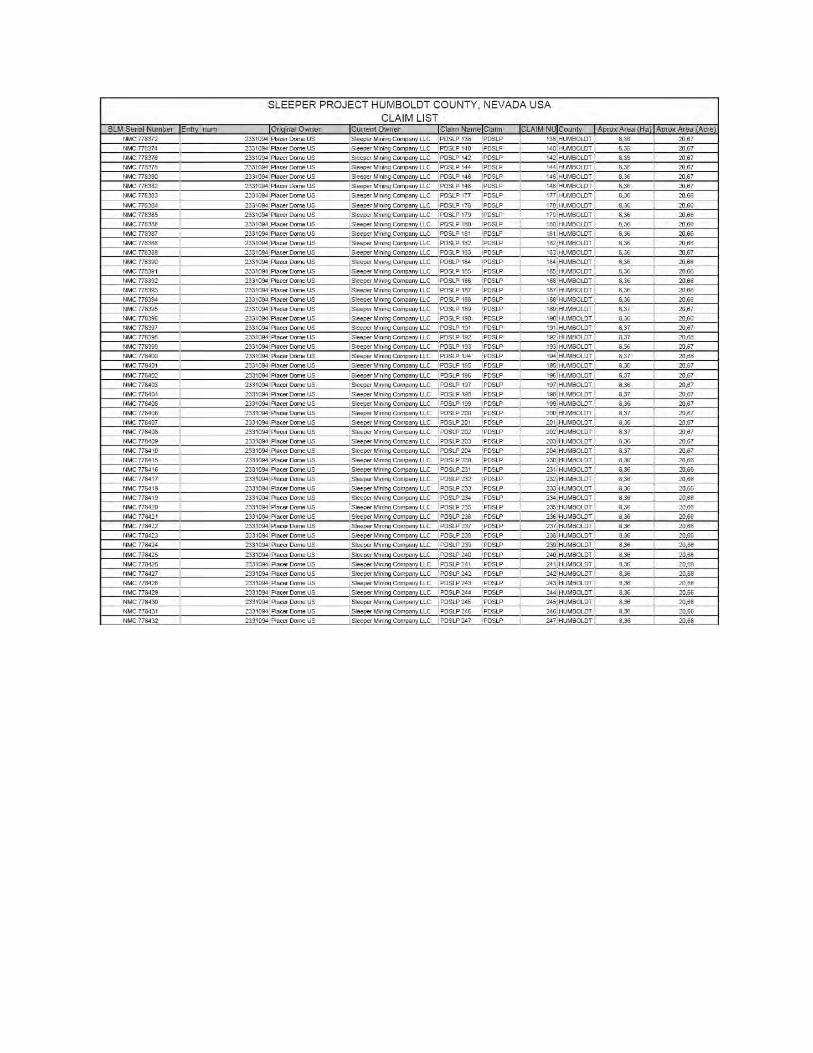
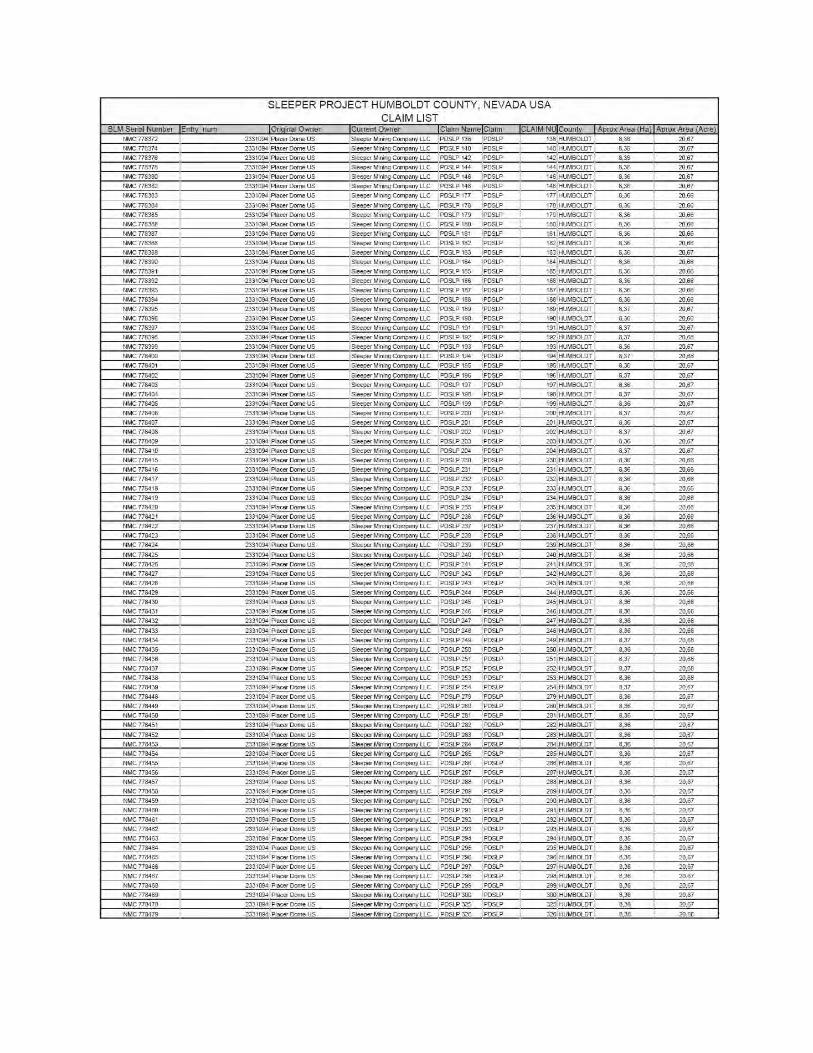
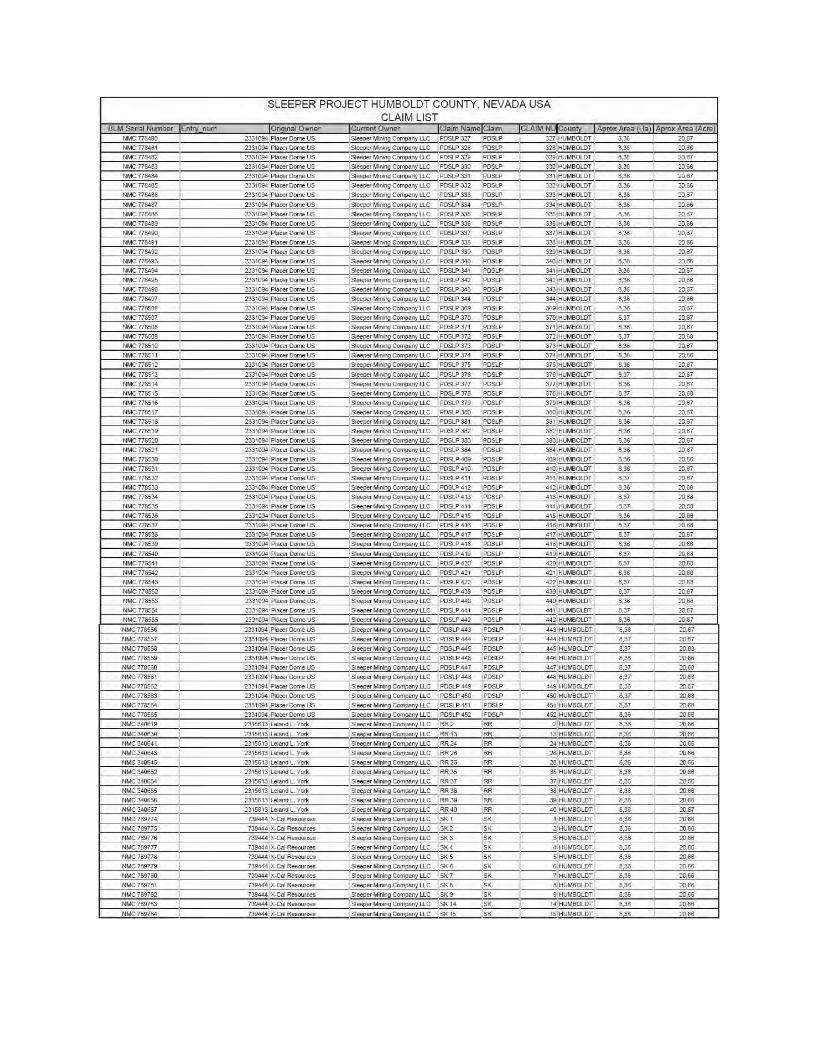
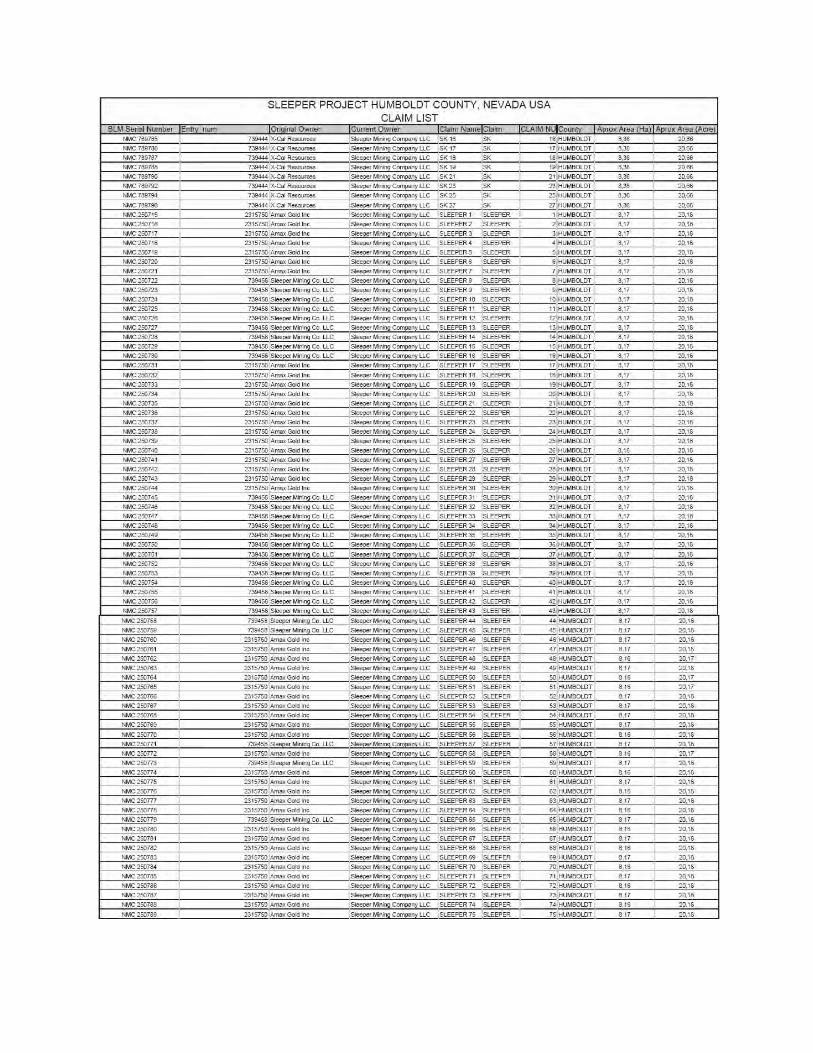
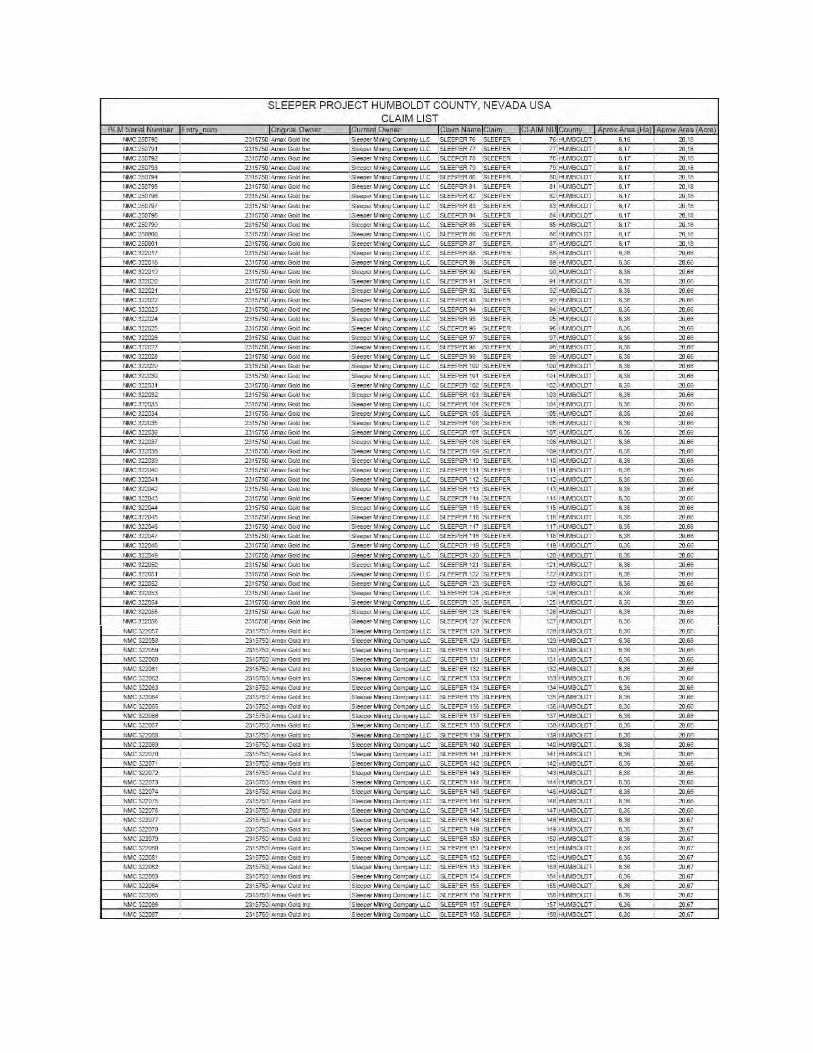
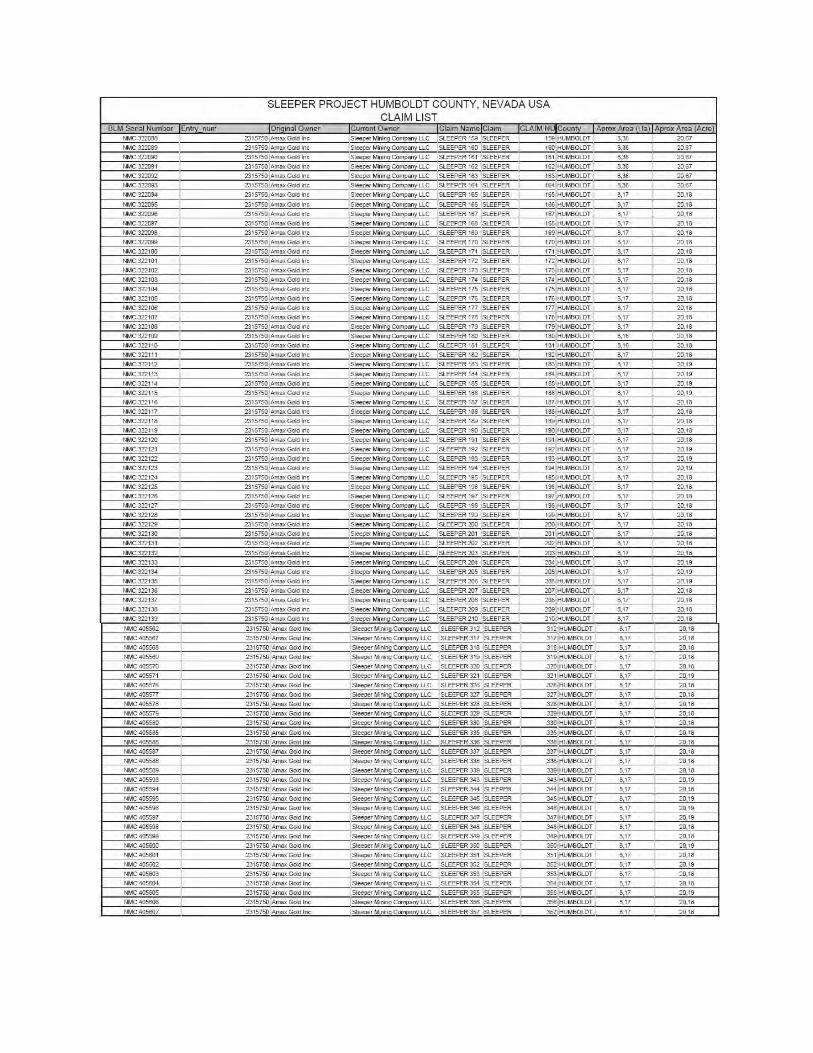
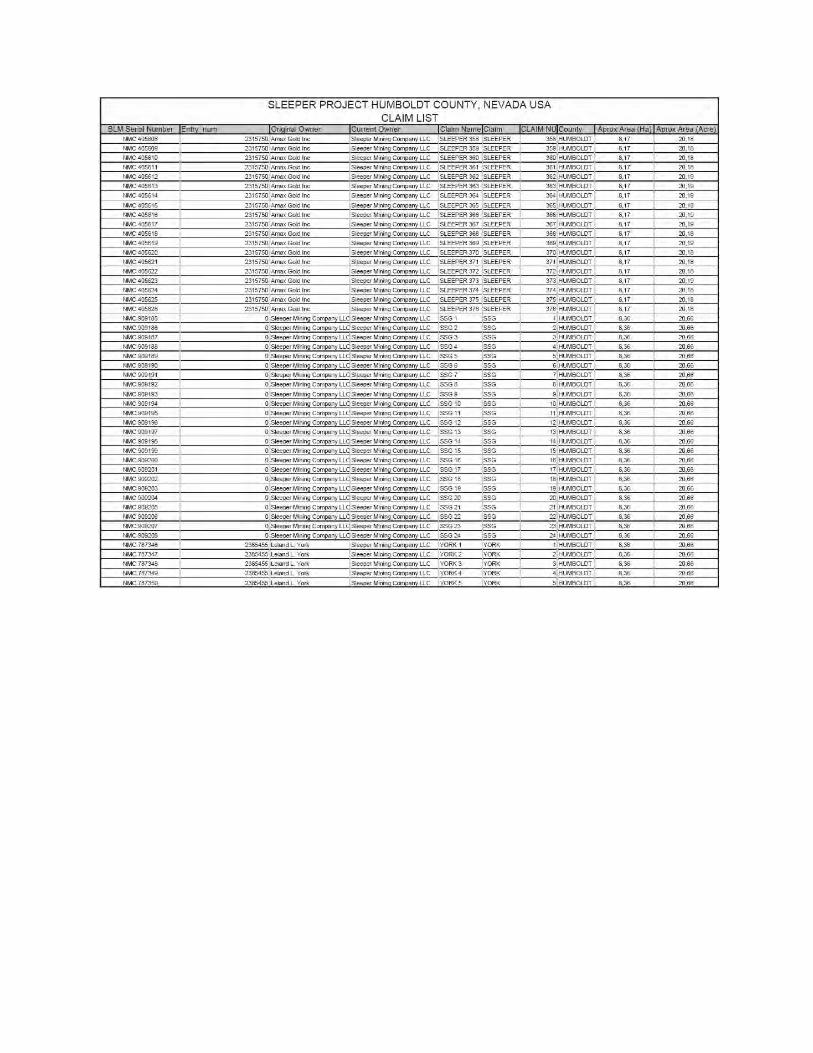

Appendix B Contact Profiles
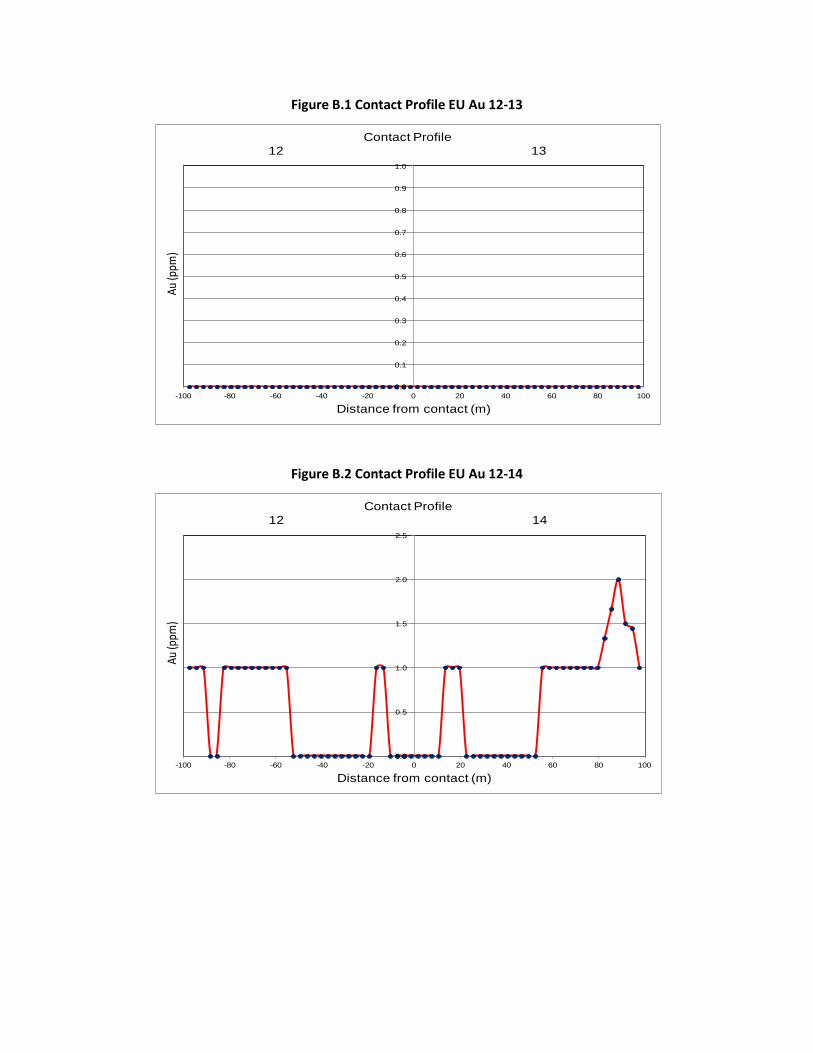
Figure B.1 Contact Profile EU Au 12-13
Figure B.2 Contact Profile EU Au 12-14
0.0
0.1
0.2
0.3
0.4
0.5
0.6
0.7
0.8
0.9
1.0
-100 -80 -60 -40 -20 0 20 40 60 80 100
Au (p
pm)
Distance from contact (m)
Contact Profile12 13
0.0
0.5
1.0
1.5
2.0
2.5
-100 -80 -60 -40 -20 0 20 40 60 80 100
Au (p
pm)
Distance from contact (m)
Contact Profile12 14
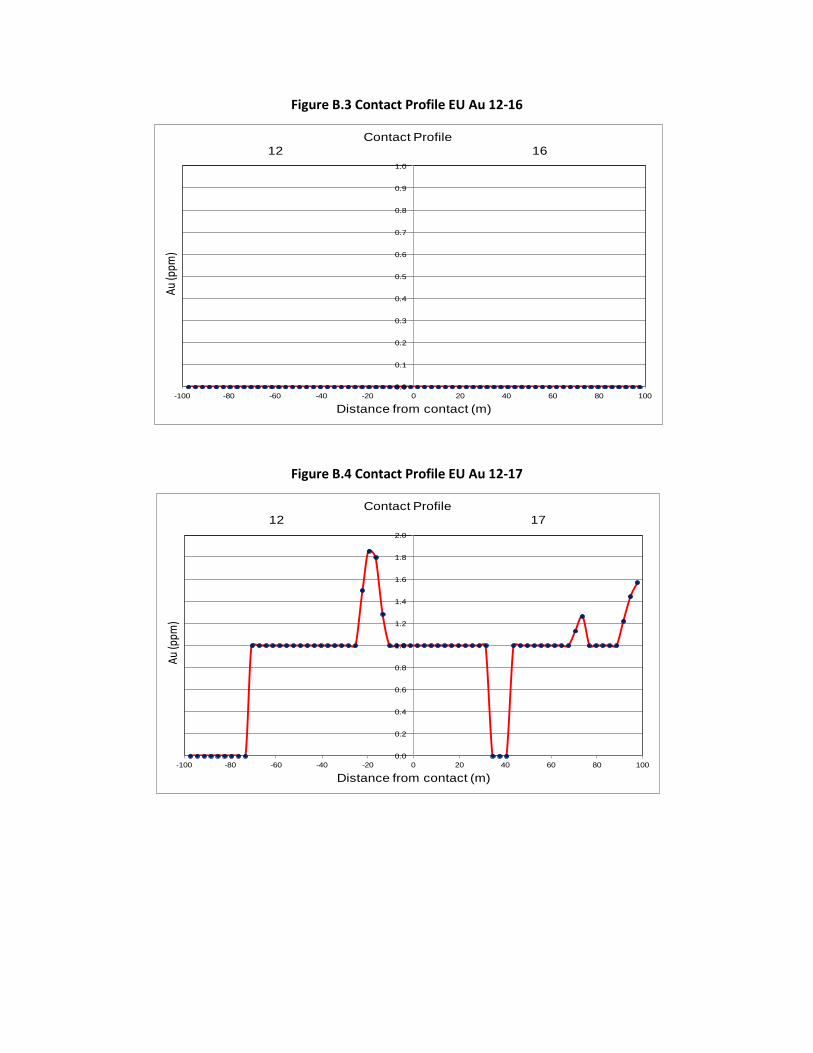
Figure B.3 Contact Profile EU Au 12-16
Figure B.4 Contact Profile EU Au 12-17
0.0
0.1
0.2
0.3
0.4
0.5
0.6
0.7
0.8
0.9
1.0
-100 -80 -60 -40 -20 0 20 40 60 80 100
Au (p
pm)
Distance from contact (m)
Contact Profile12 16
0.0
0.2
0.4
0.6
0.8
1.0
1.2
1.4
1.6
1.8
2.0
-100 -80 -60 -40 -20 0 20 40 60 80 100
Au (p
pm)
Distance from contact (m)
Contact Profile12 17
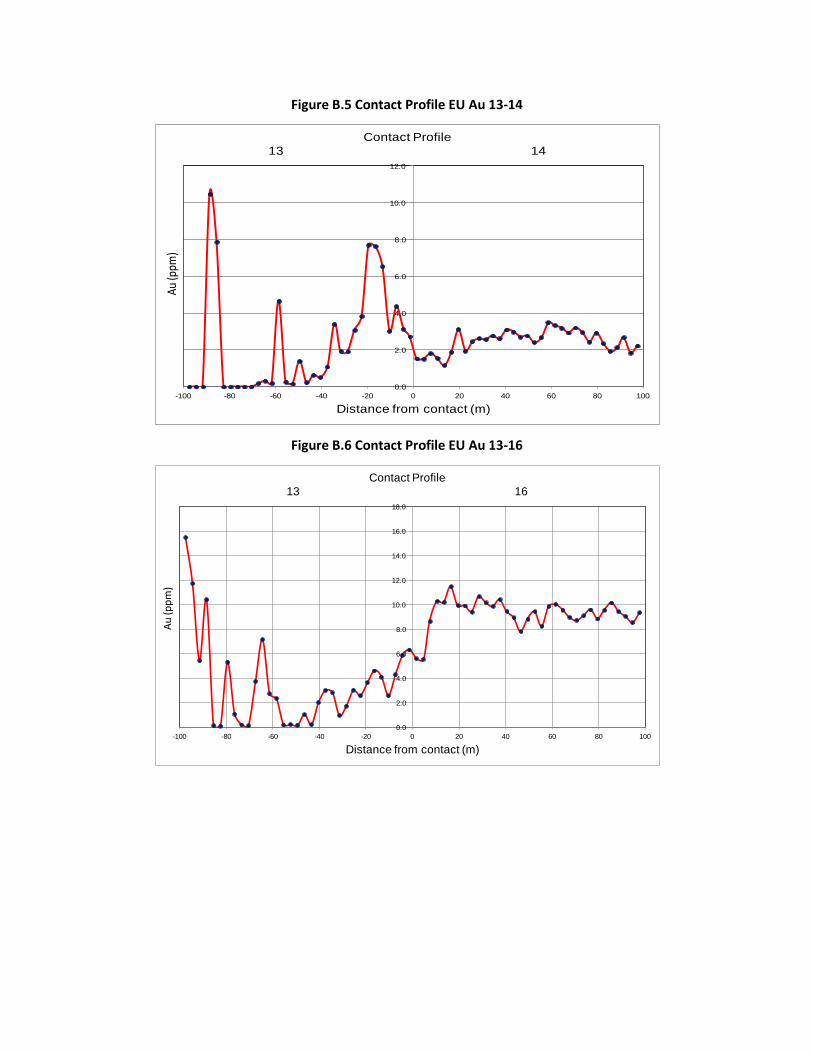
Figure B.5 Contact Profile EU Au 13-14
Figure B.6 Contact Profile EU Au 13-16
0.0
2.0
4.0
6.0
8.0
10.0
12.0
-100 -80 -60 -40 -20 0 20 40 60 80 100
Au (p
pm)
Distance from contact (m)
Contact Profile13 14
0.0
2.0
4.0
6.0
8.0
10.0
12.0
14.0
16.0
18.0
-100 -80 -60 -40 -20 0 20 40 60 80 100
Au (p
pm)
Distance from contact (m)
Contact Profile13 16
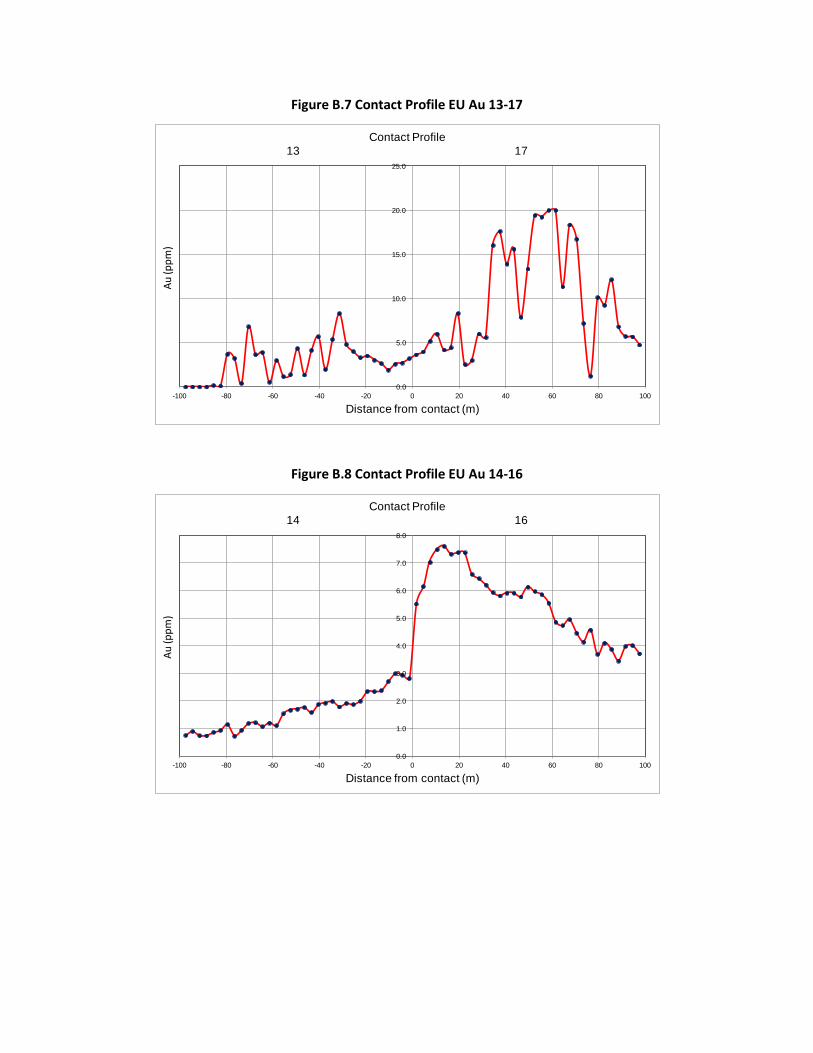
Figure B.7 Contact Profile EU Au 13-17
Figure B.8 Contact Profile EU Au 14-16
0.0
5.0
10.0
15.0
20.0
25.0
-100 -80 -60 -40 -20 0 20 40 60 80 100
Au (p
pm)
Distance from contact (m)
Contact Profile13 17
0.0
1.0
2.0
3.0
4.0
5.0
6.0
7.0
8.0
-100 -80 -60 -40 -20 0 20 40 60 80 100
Au (p
pm)
Distance from contact (m)
Contact Profile14 16
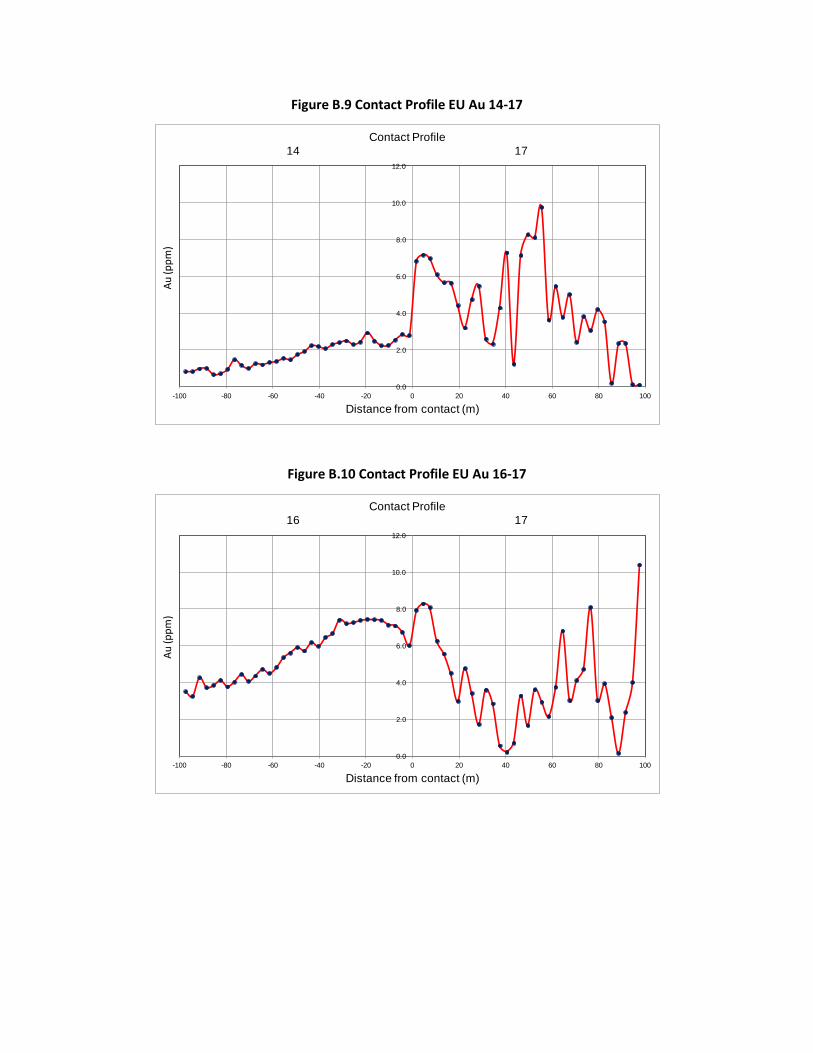
Figure B.9 Contact Profile EU Au 14-17
Figure B.10 Contact Profile EU Au 16-17
0.0
2.0
4.0
6.0
8.0
10.0
12.0
-100 -80 -60 -40 -20 0 20 40 60 80 100
Au (p
pm)
Distance from contact (m)
Contact Profile14 17
0.0
2.0
4.0
6.0
8.0
10.0
12.0
-100 -80 -60 -40 -20 0 20 40 60 80 100
Au (p
pm)
Distance from contact (m)
Contact Profile16 17
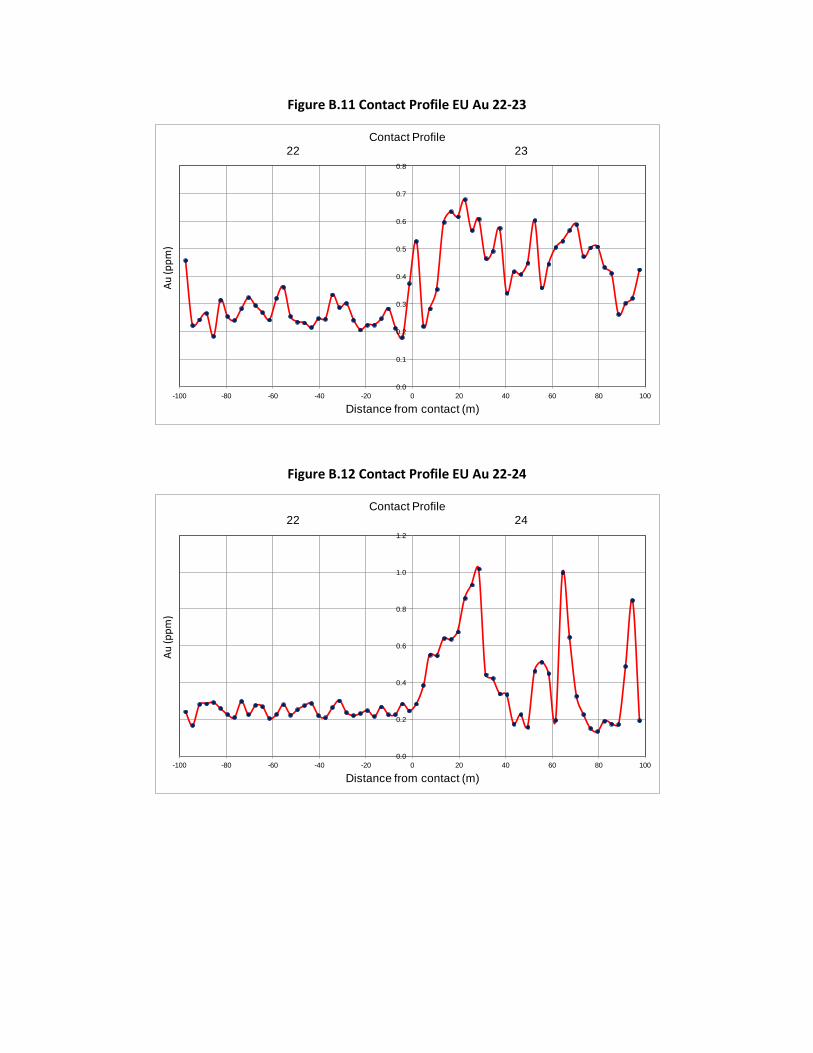
Figure B.11 Contact Profile EU Au 22-23
Figure B.12 Contact Profile EU Au 22-24
0.0
0.1
0.2
0.3
0.4
0.5
0.6
0.7
0.8
-100 -80 -60 -40 -20 0 20 40 60 80 100
Au (p
pm)
Distance from contact (m)
Contact Profile22 23
0.0
0.2
0.4
0.6
0.8
1.0
1.2
-100 -80 -60 -40 -20 0 20 40 60 80 100
Au (p
pm)
Distance from contact (m)
Contact Profile22 24
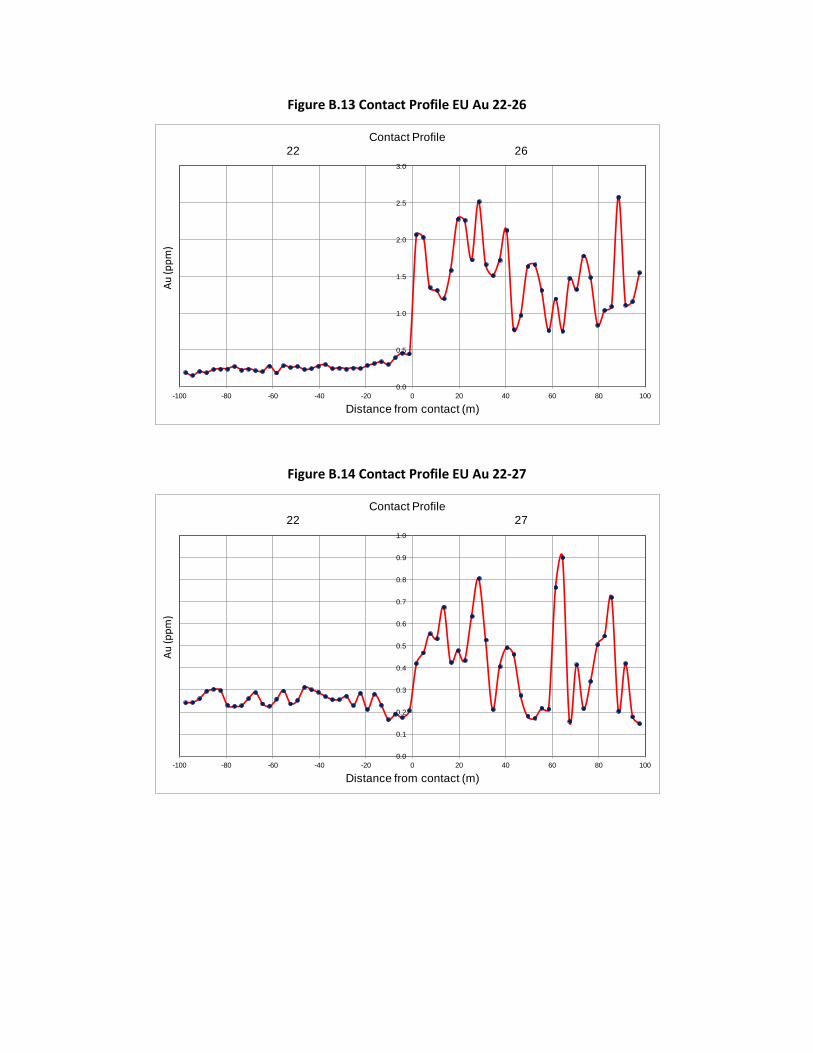
Figure B.13 Contact Profile EU Au 22-26
Figure B.14 Contact Profile EU Au 22-27
0.0
0.5
1.0
1.5
2.0
2.5
3.0
-100 -80 -60 -40 -20 0 20 40 60 80 100
Au (p
pm)
Distance from contact (m)
Contact Profile22 26
0.0
0.1
0.2
0.3
0.4
0.5
0.6
0.7
0.8
0.9
1.0
-100 -80 -60 -40 -20 0 20 40 60 80 100
Au (p
pm)
Distance from contact (m)
Contact Profile22 27
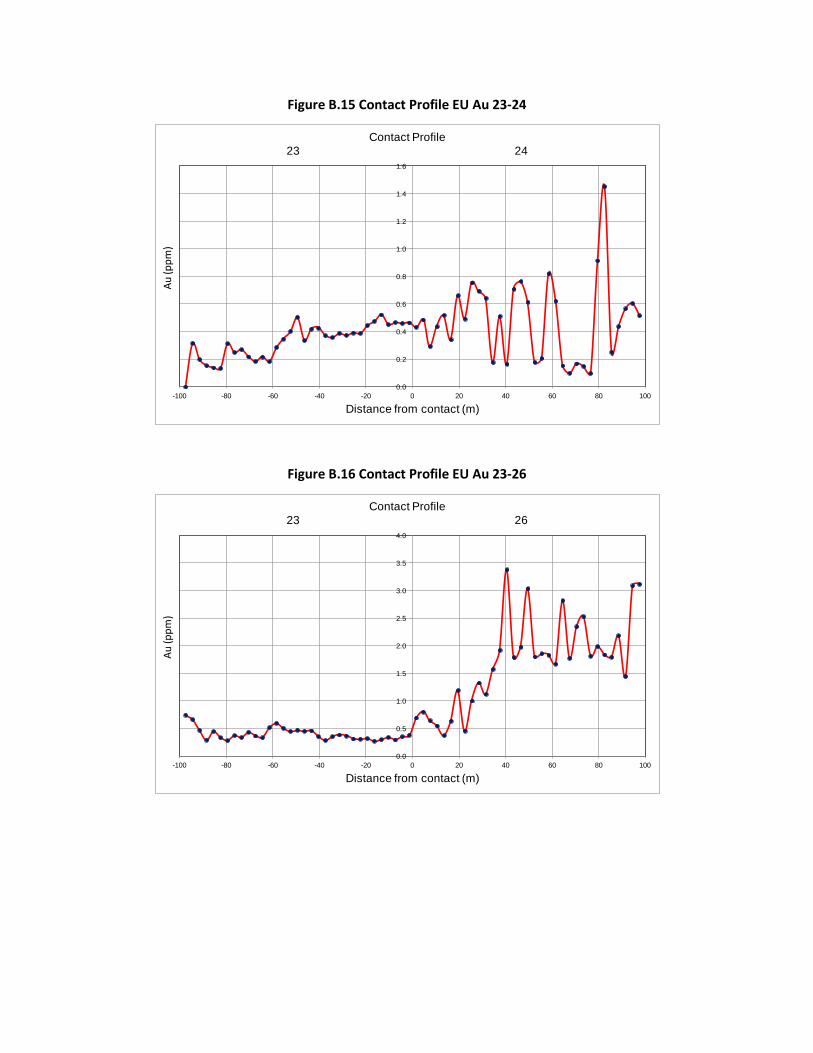
Figure B.15 Contact Profile EU Au 23-24
Figure B.16 Contact Profile EU Au 23-26
0.0
0.2
0.4
0.6
0.8
1.0
1.2
1.4
1.6
-100 -80 -60 -40 -20 0 20 40 60 80 100
Au (p
pm)
Distance from contact (m)
Contact Profile23 24
0.0
0.5
1.0
1.5
2.0
2.5
3.0
3.5
4.0
-100 -80 -60 -40 -20 0 20 40 60 80 100
Au (p
pm)
Distance from contact (m)
Contact Profile23 26
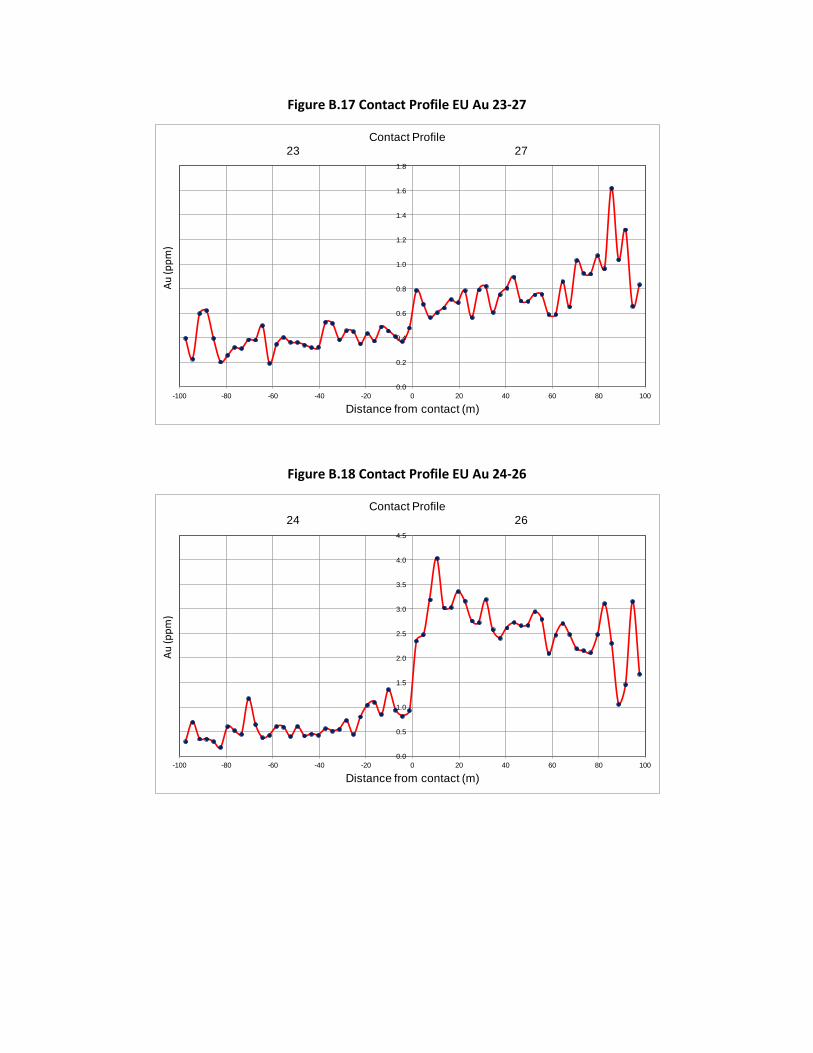
Figure B.17 Contact Profile EU Au 23-27
Figure B.18 Contact Profile EU Au 24-26
0.0
0.2
0.4
0.6
0.8
1.0
1.2
1.4
1.6
1.8
-100 -80 -60 -40 -20 0 20 40 60 80 100
Au (p
pm)
Distance from contact (m)
Contact Profile23 27
0.0
0.5
1.0
1.5
2.0
2.5
3.0
3.5
4.0
4.5
-100 -80 -60 -40 -20 0 20 40 60 80 100
Au (p
pm)
Distance from contact (m)
Contact Profile24 26
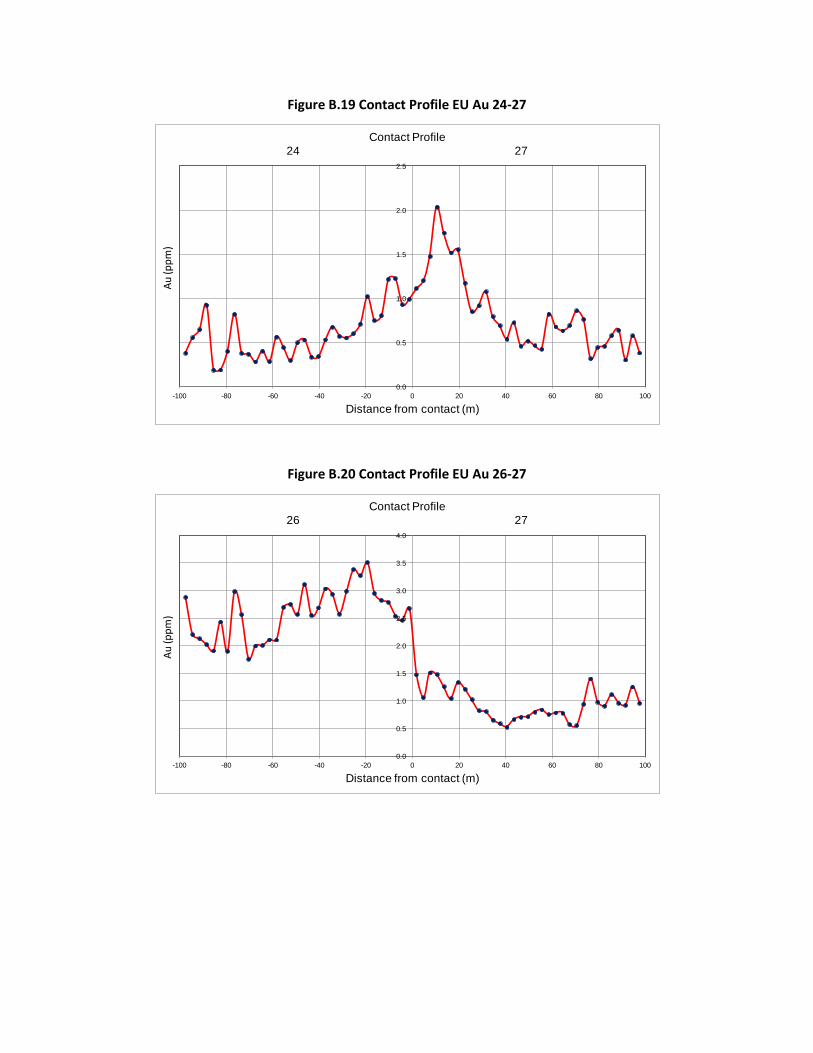
Figure B.19 Contact Profile EU Au 24-27
Figure B.20 Contact Profile EU Au 26-27
0.0
0.5
1.0
1.5
2.0
2.5
-100 -80 -60 -40 -20 0 20 40 60 80 100
Au (p
pm)
Distance from contact (m)
Contact Profile24 27
0.0
0.5
1.0
1.5
2.0
2.5
3.0
3.5
4.0
-100 -80 -60 -40 -20 0 20 40 60 80 100
Au (p
pm)
Distance from contact (m)
Contact Profile26 27
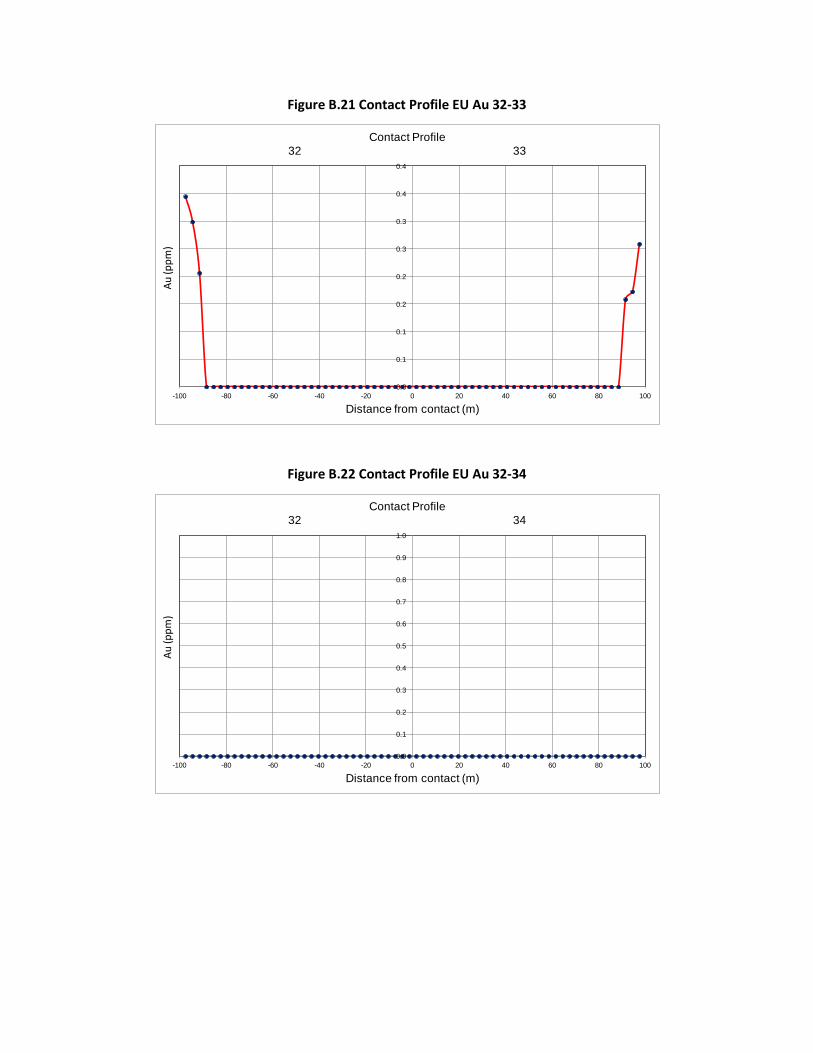
Figure B.21 Contact Profile EU Au 32-33
Figure B.22 Contact Profile EU Au 32-34
0.0
0.1
0.1
0.2
0.2
0.3
0.3
0.4
0.4
-100 -80 -60 -40 -20 0 20 40 60 80 100
Au (p
pm)
Distance from contact (m)
Contact Profile32 33
0.0
0.1
0.2
0.3
0.4
0.5
0.6
0.7
0.8
0.9
1.0
-100 -80 -60 -40 -20 0 20 40 60 80 100
Au (p
pm)
Distance from contact (m)
Contact Profile32 34
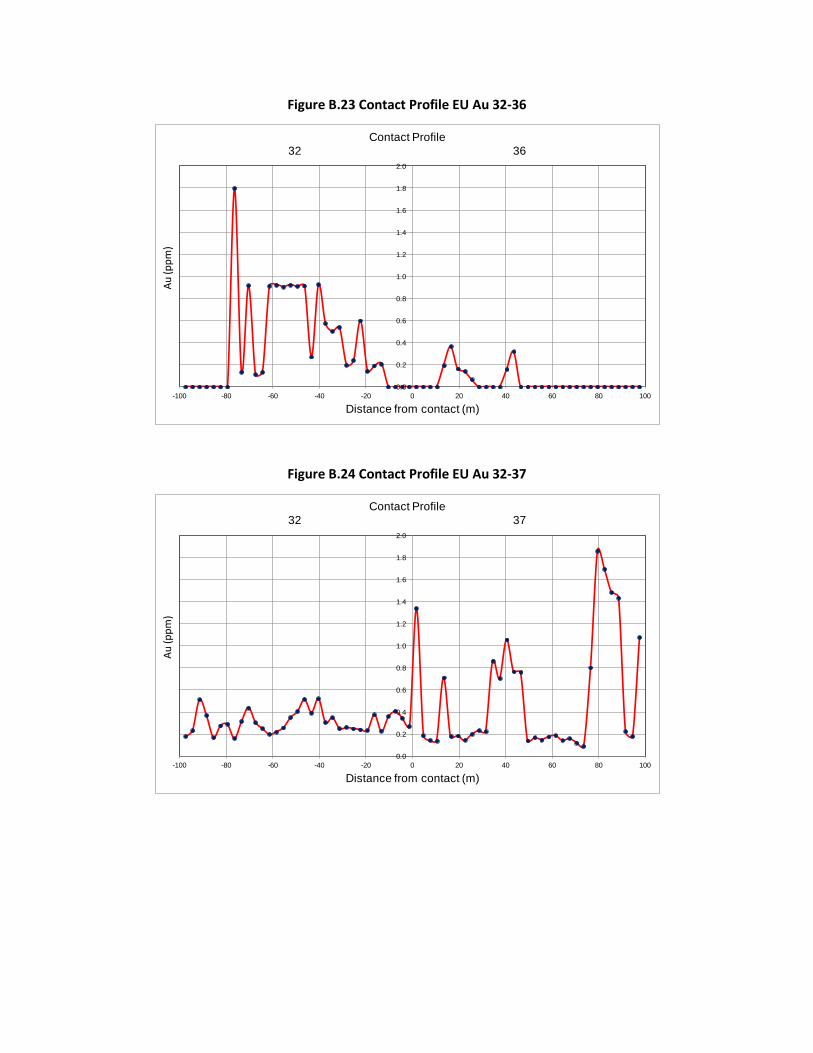
Figure B.23 Contact Profile EU Au 32-36
Figure B.24 Contact Profile EU Au 32-37
0.0
0.2
0.4
0.6
0.8
1.0
1.2
1.4
1.6
1.8
2.0
-100 -80 -60 -40 -20 0 20 40 60 80 100
Au (p
pm)
Distance from contact (m)
Contact Profile32 36
0.0
0.2
0.4
0.6
0.8
1.0
1.2
1.4
1.6
1.8
2.0
-100 -80 -60 -40 -20 0 20 40 60 80 100
Au (p
pm)
Distance from contact (m)
Contact Profile32 37
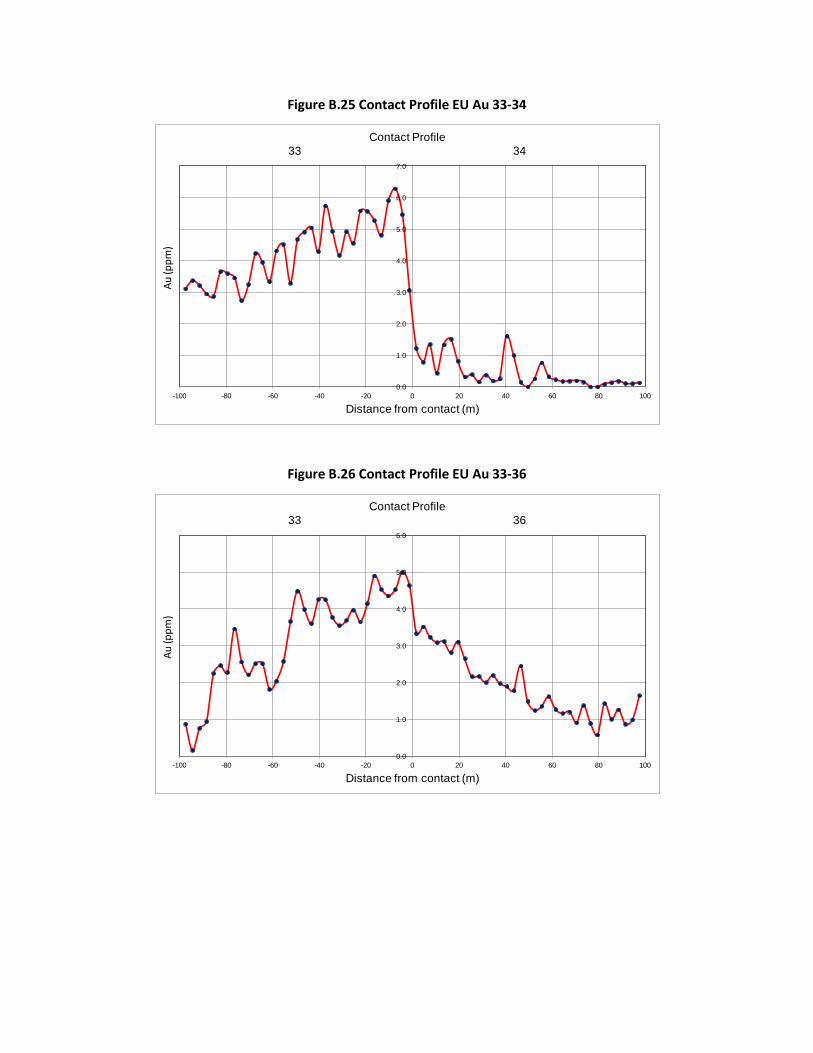
Figure B.25 Contact Profile EU Au 33-34
Figure B.26 Contact Profile EU Au 33-36
0.0
1.0
2.0
3.0
4.0
5.0
6.0
7.0
-100 -80 -60 -40 -20 0 20 40 60 80 100
Au (p
pm)
Distance from contact (m)
Contact Profile33 34
0.0
1.0
2.0
3.0
4.0
5.0
6.0
-100 -80 -60 -40 -20 0 20 40 60 80 100
Au (p
pm)
Distance from contact (m)
Contact Profile33 36
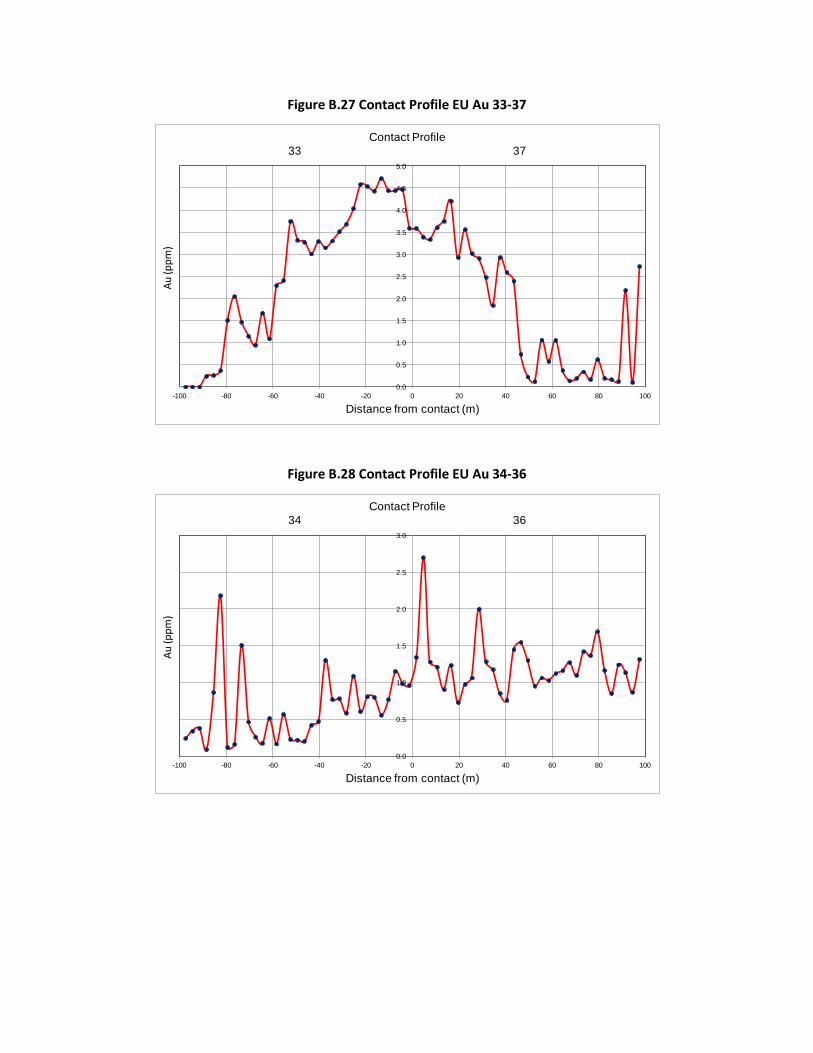
Figure B.27 Contact Profile EU Au 33-37
Figure B.28 Contact Profile EU Au 34-36
0.0
0.5
1.0
1.5
2.0
2.5
3.0
3.5
4.0
4.5
5.0
-100 -80 -60 -40 -20 0 20 40 60 80 100
Au (p
pm)
Distance from contact (m)
Contact Profile33 37
0.0
0.5
1.0
1.5
2.0
2.5
3.0
-100 -80 -60 -40 -20 0 20 40 60 80 100
Au (p
pm)
Distance from contact (m)
Contact Profile34 36

Figure B.29 Contact Profile EU Au 34-37
Figure B.30 Contact Profile EU Au 36-37
0.0
0.5
1.0
1.5
2.0
2.5
3.0
3.5
4.0
4.5
-100 -80 -60 -40 -20 0 20 40 60 80 100
Au (p
pm)
Distance from contact (m)
Contact Profile36 37

Appendix C Variogram Maps
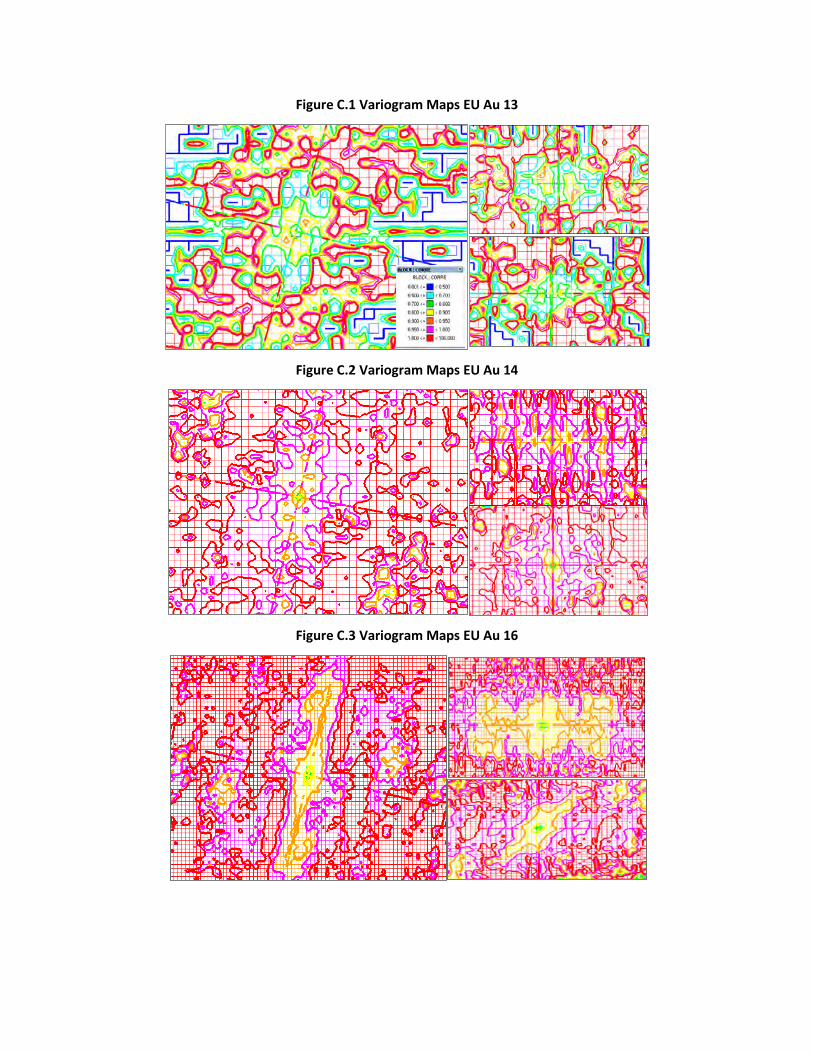
Figure C.1 Variogram Maps EU Au 13
Figure C.2 Variogram Maps EU Au 14
Figure C.3 Variogram Maps EU Au 16
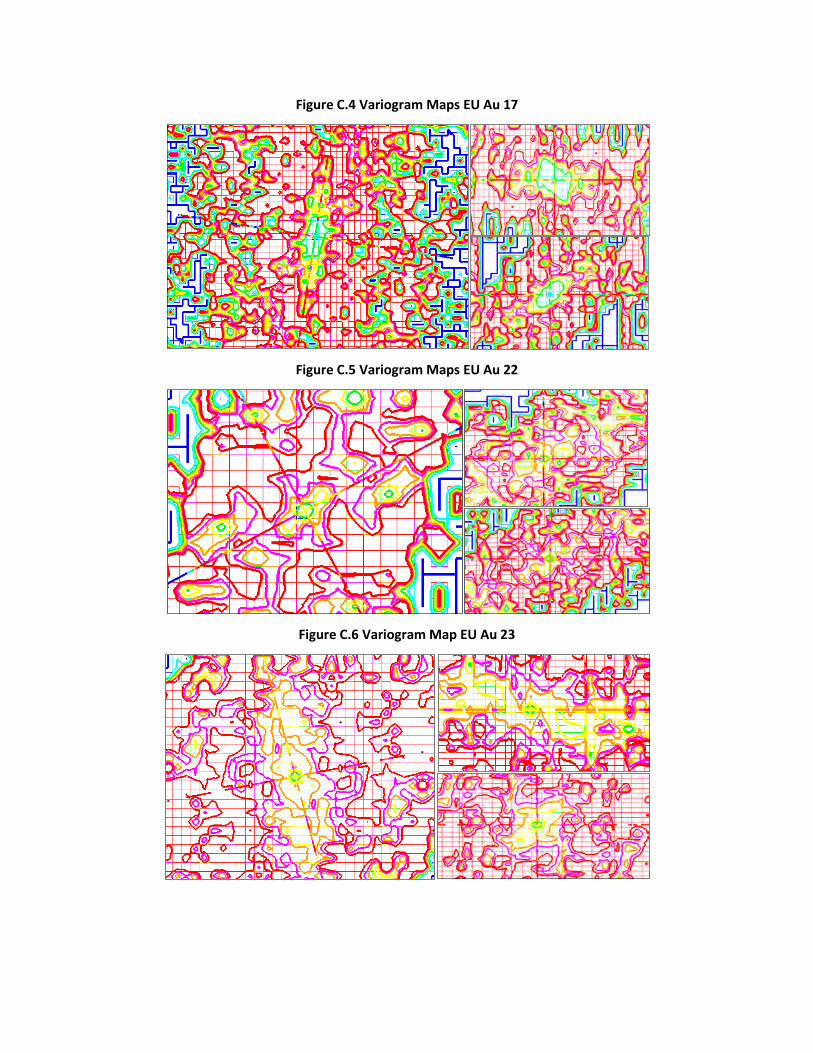
Figure C.4 Variogram Maps EU Au 17
Figure C.5 Variogram Maps EU Au 22
Figure C.6 Variogram Map EU Au 23
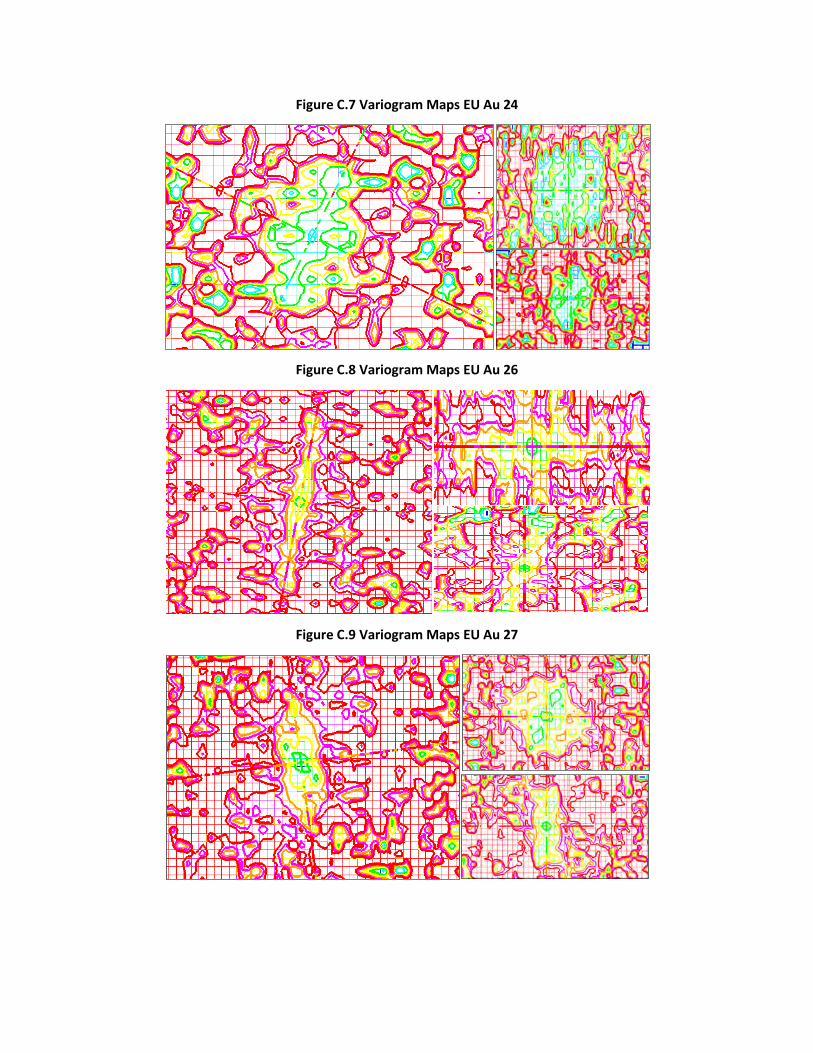
Figure C.7 Variogram Maps EU Au 24
Figure C.8 Variogram Maps EU Au 26
Figure C.9 Variogram Maps EU Au 27
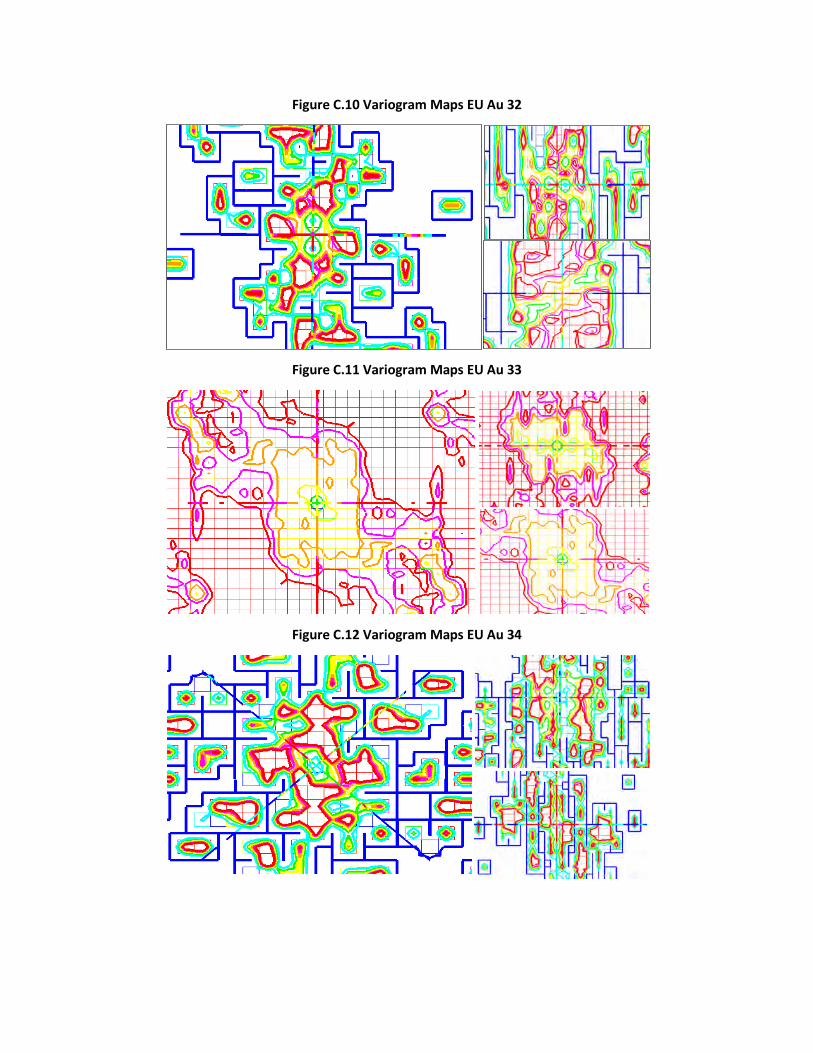
Figure C.10 Variogram Maps EU Au 32
Figure C.11 Variogram Maps EU Au 33
Figure C.12 Variogram Maps EU Au 34
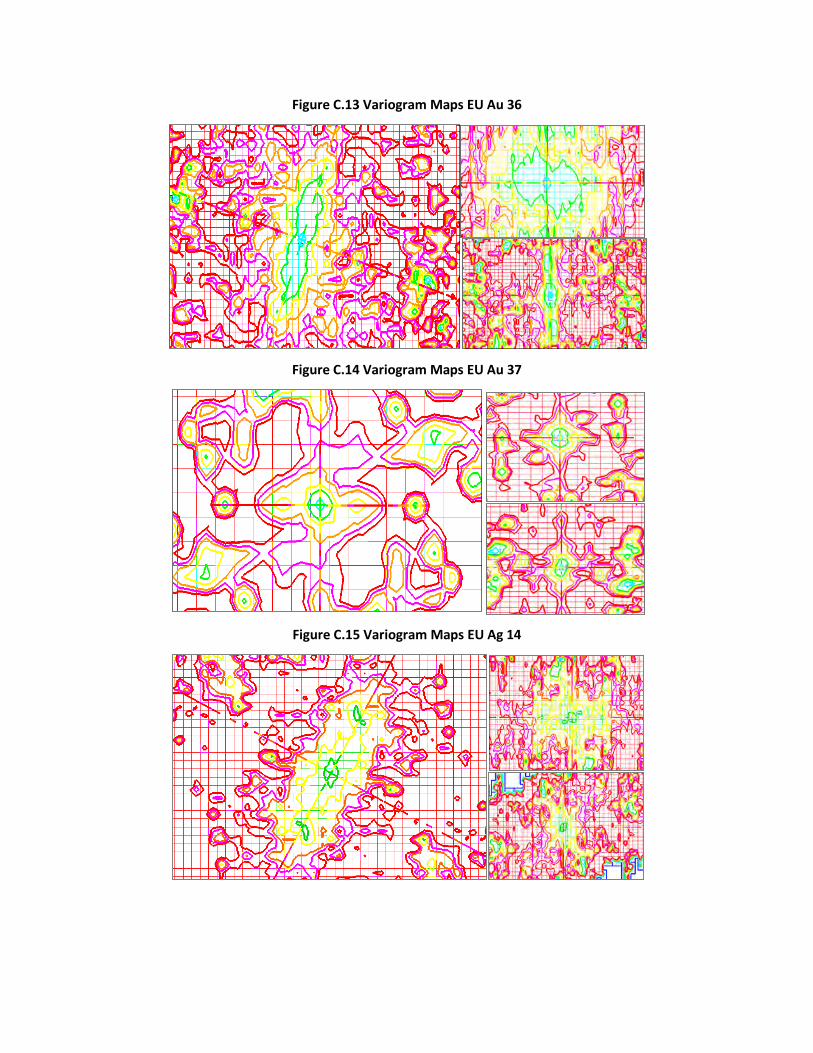
Figure C.13 Variogram Maps EU Au 36
Figure C.14 Variogram Maps EU Au 37
Figure C.15 Variogram Maps EU Ag 14
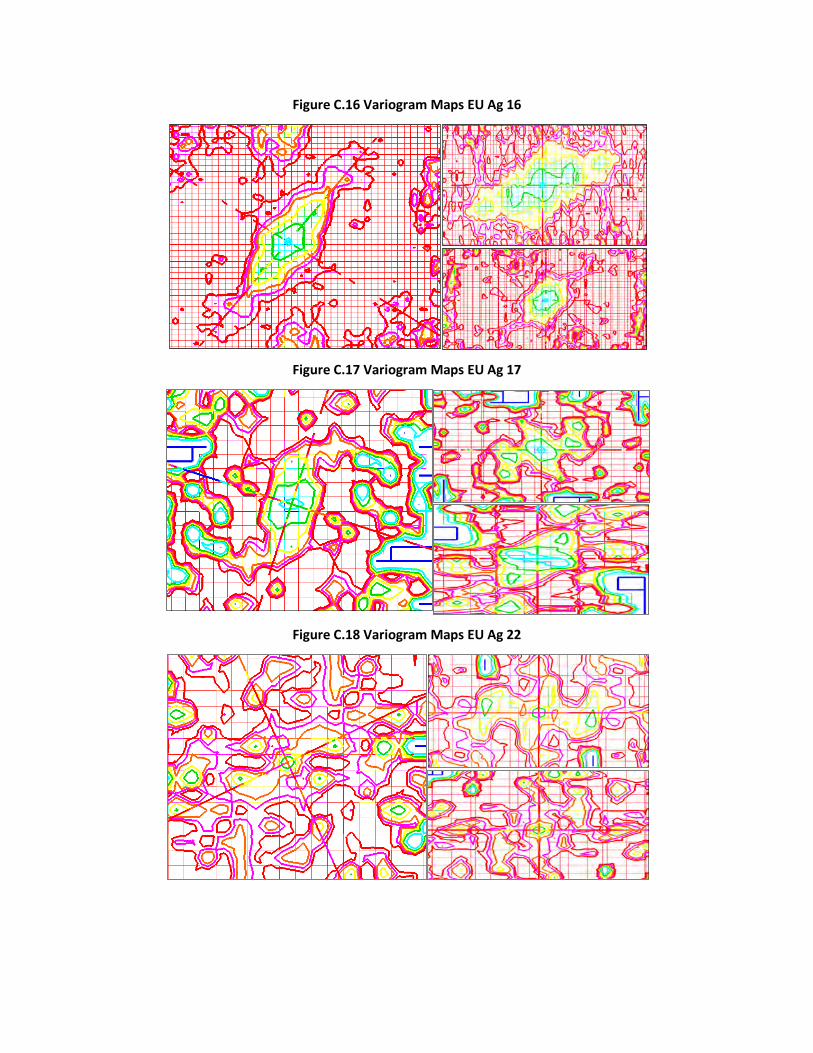
Figure C.16 Variogram Maps EU Ag 16
Figure C.17 Variogram Maps EU Ag 17
Figure C.18 Variogram Maps EU Ag 22
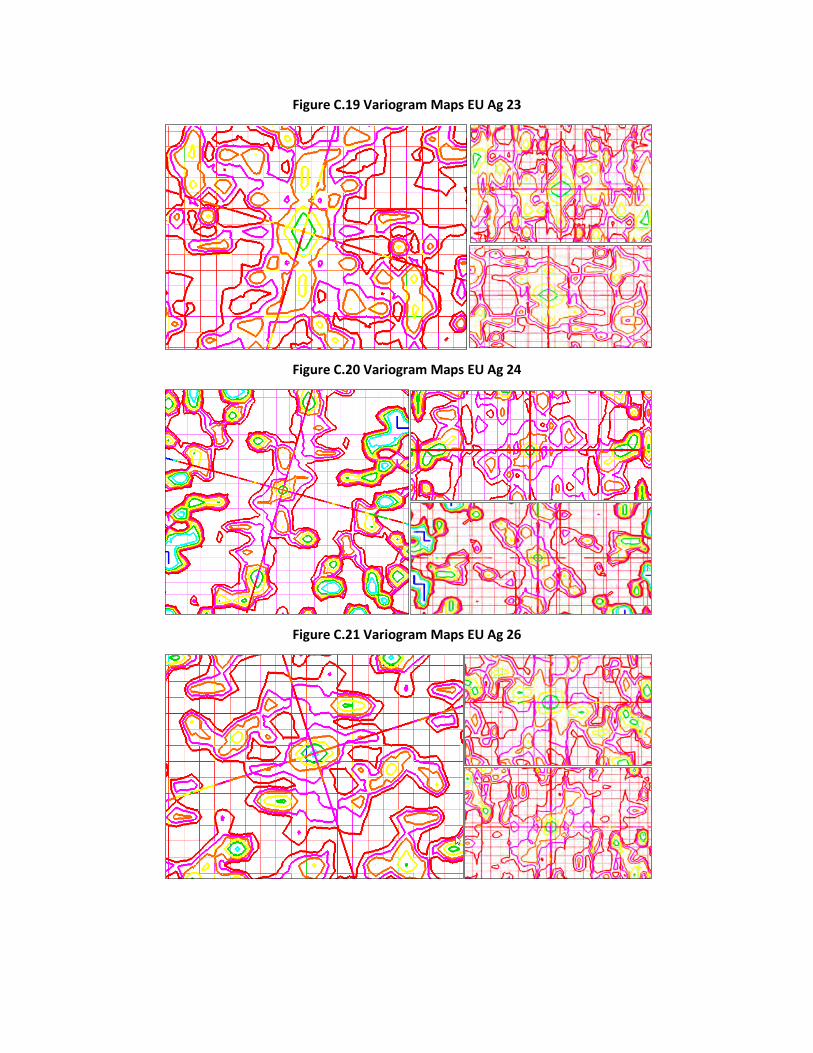
Figure C.19 Variogram Maps EU Ag 23
Figure C.20 Variogram Maps EU Ag 24
Figure C.21 Variogram Maps EU Ag 26
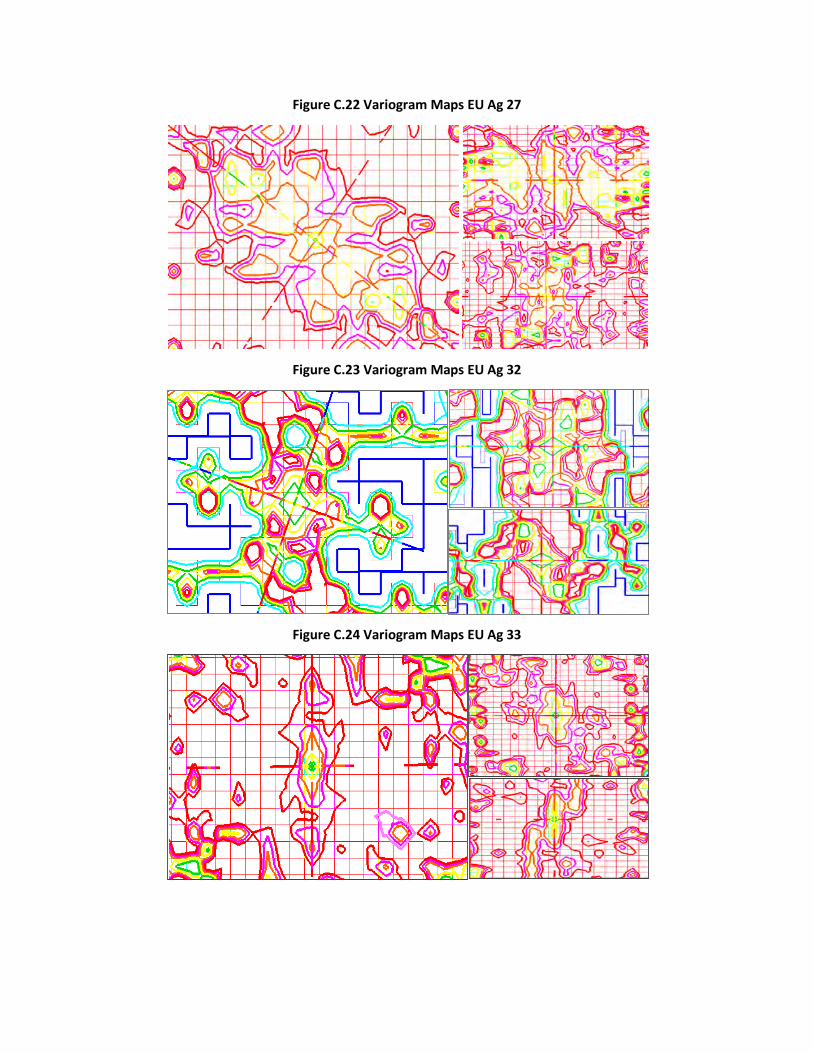
Figure C.22 Variogram Maps EU Ag 27
Figure C.23 Variogram Maps EU Ag 32
Figure C.24 Variogram Maps EU Ag 33
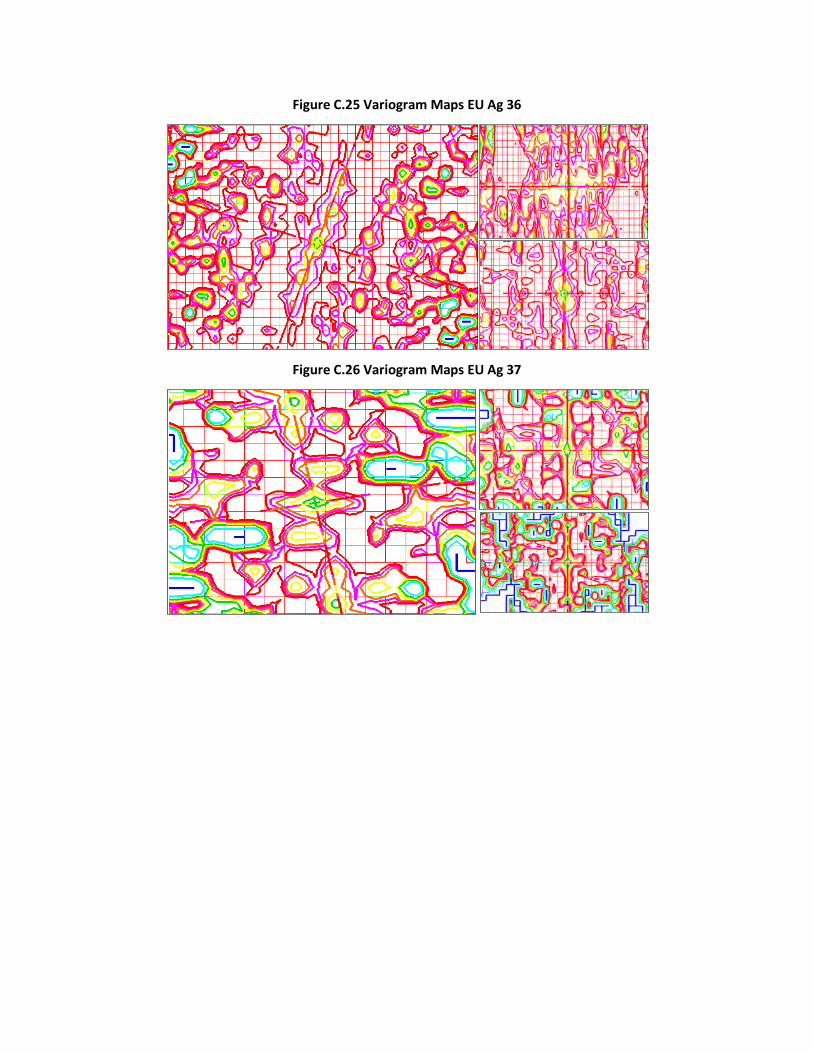
Figure C.25 Variogram Maps EU Ag 36
Figure C.26 Variogram Maps EU Ag 37

Appendix D Outliers
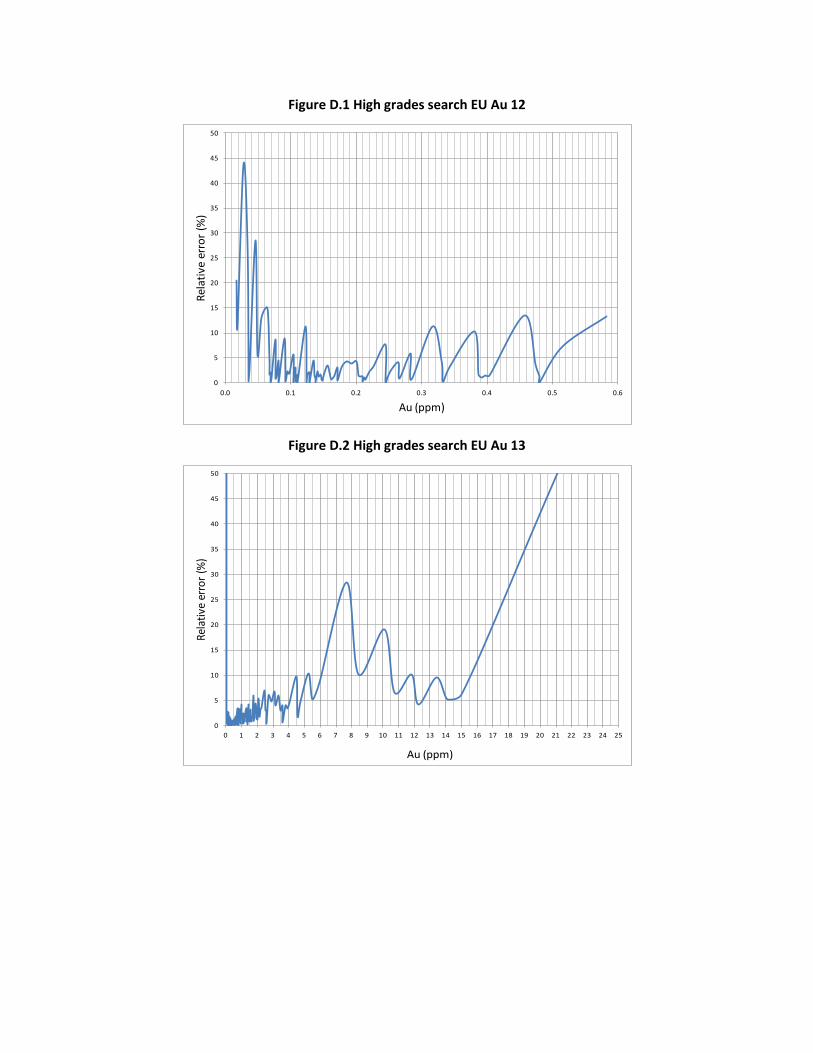
Figure D.1 High grades search EU Au 12
Figure D.2 High grades search EU Au 13
0
5
10
15
20
25
30
35
40
45
50
0.0 0.1 0.2 0.3 0.4 0.5 0.6
Rela
tive
erro
r (%
)
Au (ppm)
0
5
10
15
20
25
30
35
40
45
50
0 1 2 3 4 5 6 7 8 9 10 11 12 13 14 15 16 17 18 19 20 21 22 23 24 25
Rela
tive
erro
r (%
)
Au (ppm)
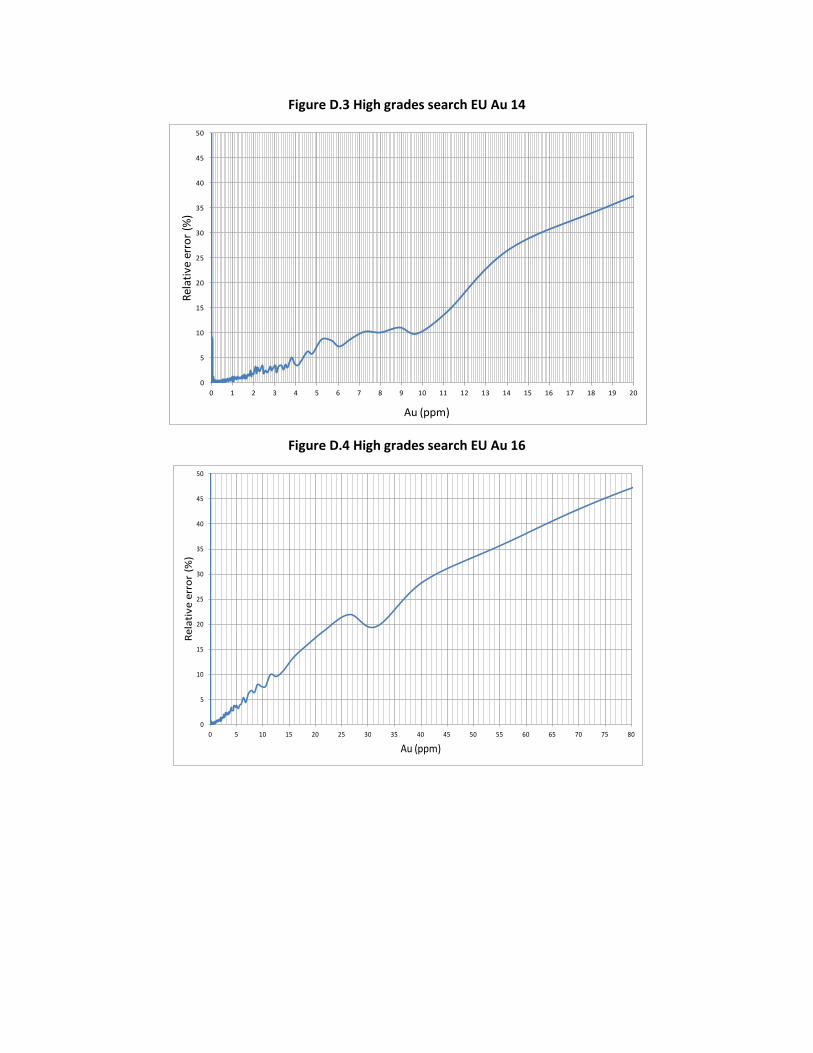
Figure D.3 High grades search EU Au 14
Figure D.4 High grades search EU Au 16
0
5
10
15
20
25
30
35
40
45
50
0 1 2 3 4 5 6 7 8 9 10 11 12 13 14 15 16 17 18 19 20
Rela
tive
erro
r (%
)
Au (ppm)
0
5
10
15
20
25
30
35
40
45
50
0 5 10 15 20 25 30 35 40 45 50 55 60 65 70 75 80
Rela
tive
erro
r (%
)
Au (ppm)
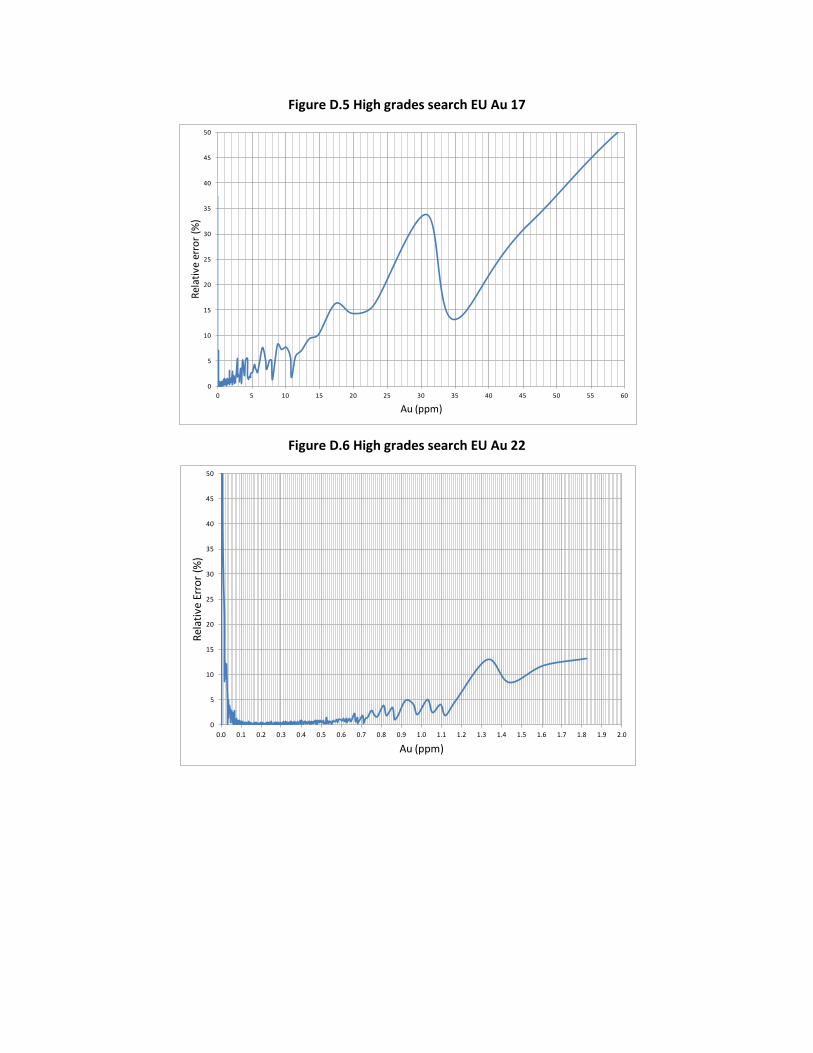
Figure D.5 High grades search EU Au 17
Figure D.6 High grades search EU Au 22
0
5
10
15
20
25
30
35
40
45
50
0 5 10 15 20 25 30 35 40 45 50 55 60
Rela
tive
erro
r (%
)
Au (ppm)
0
5
10
15
20
25
30
35
40
45
50
0.0 0.1 0.2 0.3 0.4 0.5 0.6 0.7 0.8 0.9 1.0 1.1 1.2 1.3 1.4 1.5 1.6 1.7 1.8 1.9 2.0
Rela
tive
Erro
r (%
)
Au (ppm)
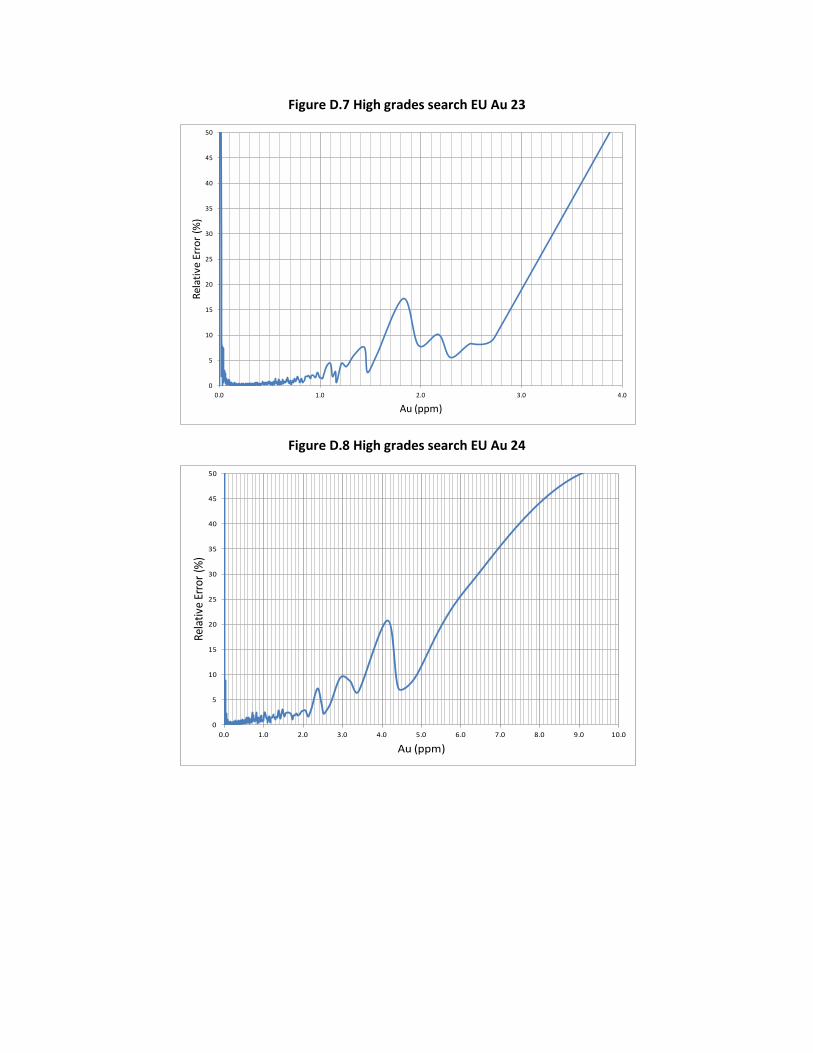
Figure D.7 High grades search EU Au 23
Figure D.8 High grades search EU Au 24
0
5
10
15
20
25
30
35
40
45
50
0.0 1.0 2.0 3.0 4.0
Rela
tive
Erro
r (%
)
Au (ppm)
0
5
10
15
20
25
30
35
40
45
50
0.0 1.0 2.0 3.0 4.0 5.0 6.0 7.0 8.0 9.0 10.0
Rela
tive
Erro
r (%
)
Au (ppm)
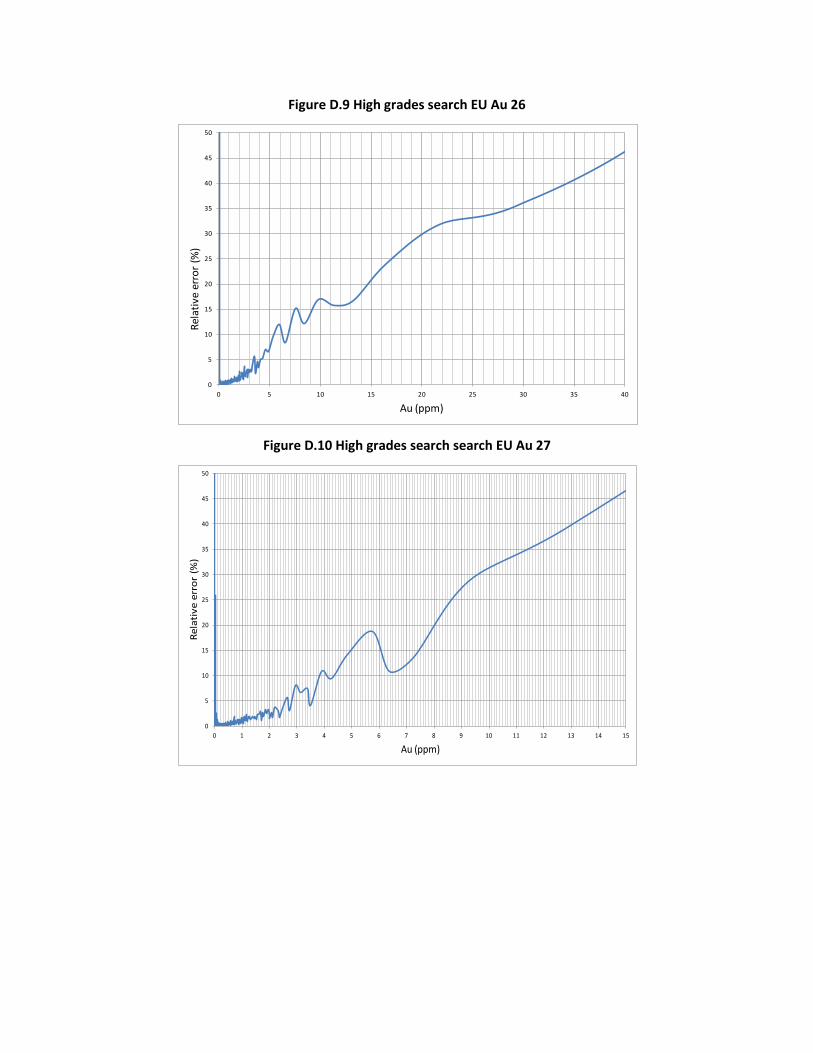
Figure D.9 High grades search EU Au 26
Figure D.10 High grades search search EU Au 27
0
5
10
15
20
25
30
35
40
45
50
0 5 10 15 20 25 30 35 40
Rela
tive
erro
r (%
)
Au (ppm)
0
5
10
15
20
25
30
35
40
45
50
0 1 2 3 4 5 6 7 8 9 10 11 12 13 14 15
Rela
tive
erro
r (%
)
Au (ppm)
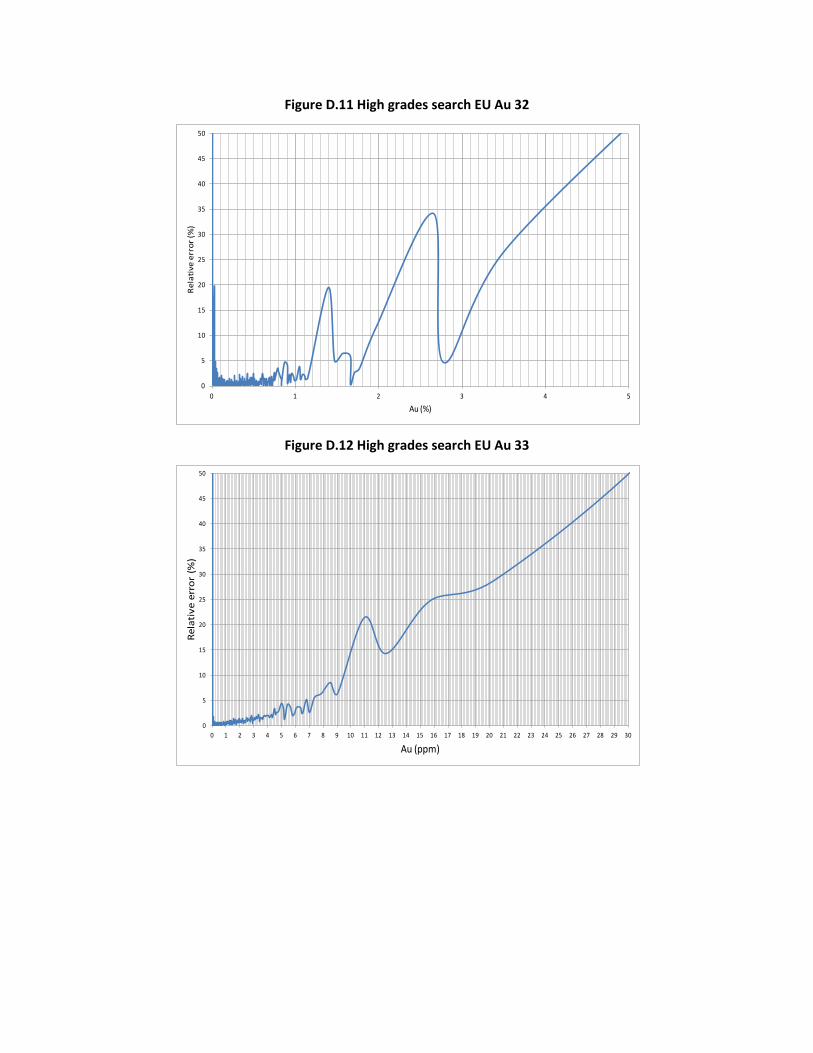
Figure D.11 High grades search EU Au 32
Figure D.12 High grades search EU Au 33
0
5
10
15
20
25
30
35
40
45
50
0 1 2 3 4 5
Rela
tive
erro
r (%
)
Au (%)
0
5
10
15
20
25
30
35
40
45
50
0 1 2 3 4 5 6 7 8 9 10 11 12 13 14 15 16 17 18 19 20 21 22 23 24 25 26 27 28 29 30
Rela
tive
err
or (
%)
Au (ppm)
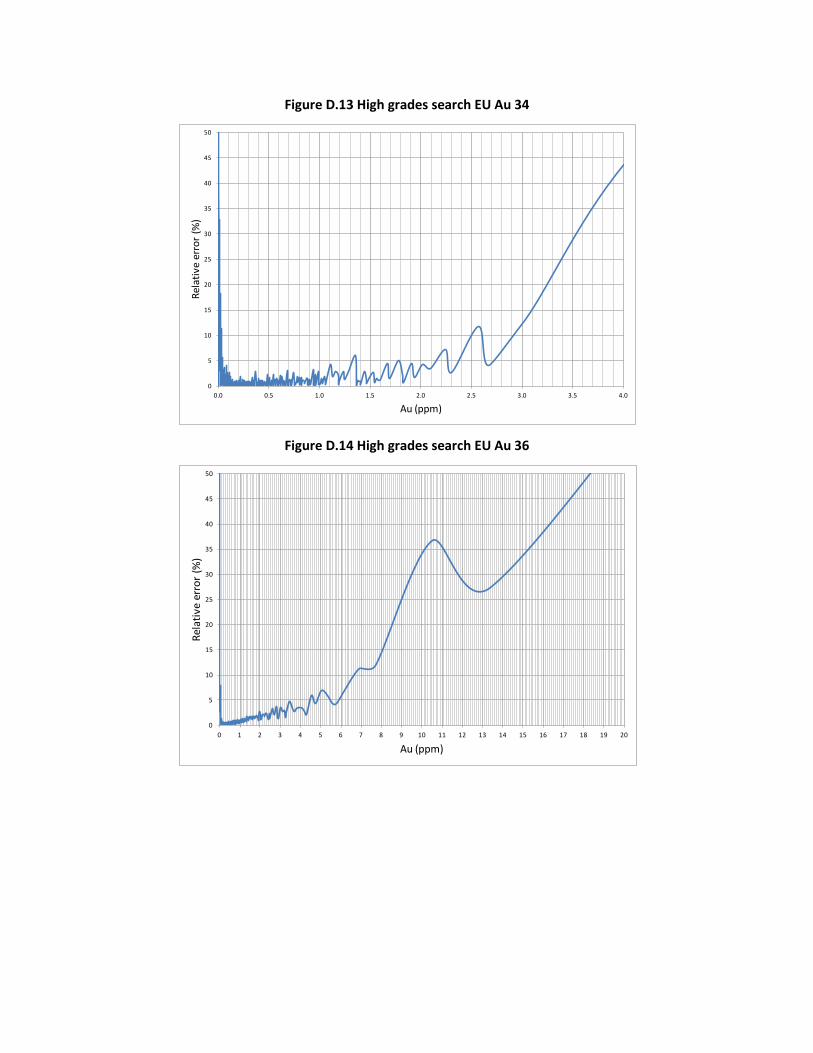
Figure D.13 High grades search EU Au 34
Figure D.14 High grades search EU Au 36
0
5
10
15
20
25
30
35
40
45
50
0.0 0.5 1.0 1.5 2.0 2.5 3.0 3.5 4.0
Rela
tive
erro
r (%
)
Au (ppm)
0
5
10
15
20
25
30
35
40
45
50
0 1 2 3 4 5 6 7 8 9 10 11 12 13 14 15 16 17 18 19 20
Rela
tive
erro
r (%
)
Au (ppm)
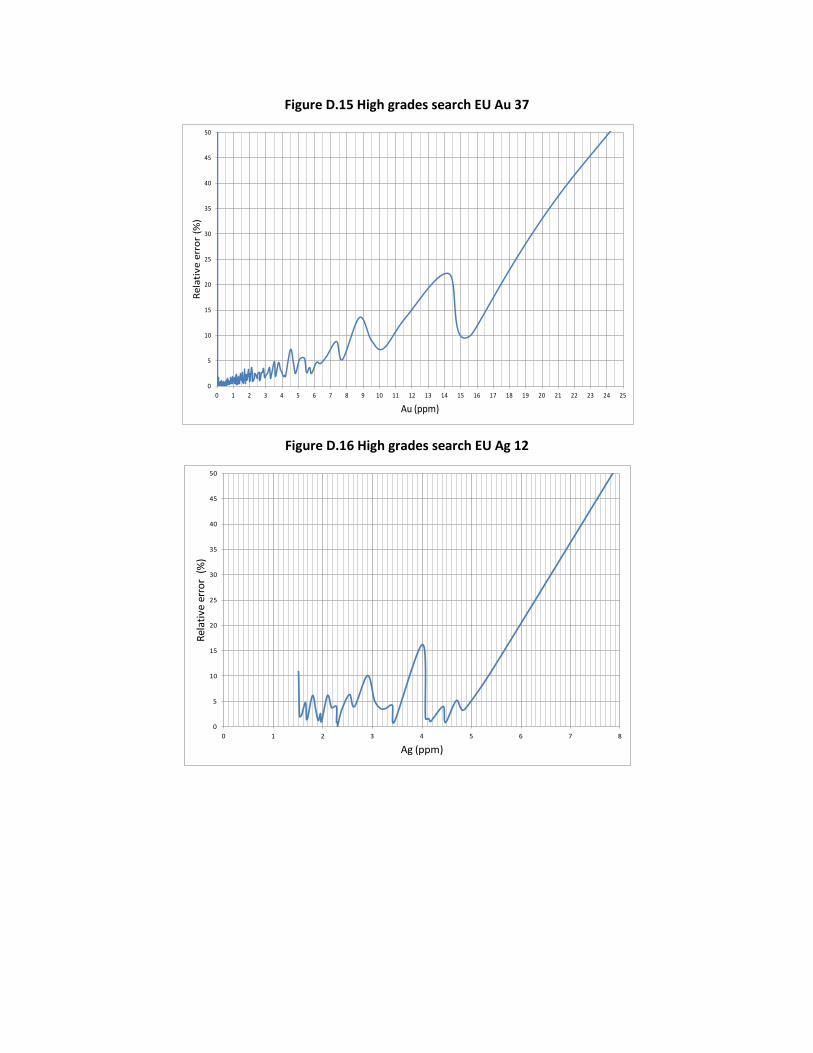
Figure D.15 High grades search EU Au 37
Figure D.16 High grades search EU Ag 12
0
5
10
15
20
25
30
35
40
45
50
0 1 2 3 4 5 6 7 8 9 10 11 12 13 14 15 16 17 18 19 20 21 22 23 24 25
Rela
tive
erro
r (%
)
Au (ppm)
0
5
10
15
20
25
30
35
40
45
50
0 1 2 3 4 5 6 7 8
Rela
tive
erro
r (%
)
Ag (ppm)

Figure D.17 High grades search EU Ag 13
Figure D.18 High grades search EU Ag 14
0
5
10
15
20
25
30
35
40
45
50
0 10 20 30 40 50 60 70 80 90 100 110 120 130 140 150 160 170 180
Rela
tive
erro
r (%
)
Ag (ppm)
0
5
10
15
20
25
30
35
40
45
50
0 10 20 30 40 50 60 70 80 90 100 110 120 130 140 150 160 170 180 190 200 210 220 230 240 250
Rela
tive
erro
r (%
)
Ag (ppm)
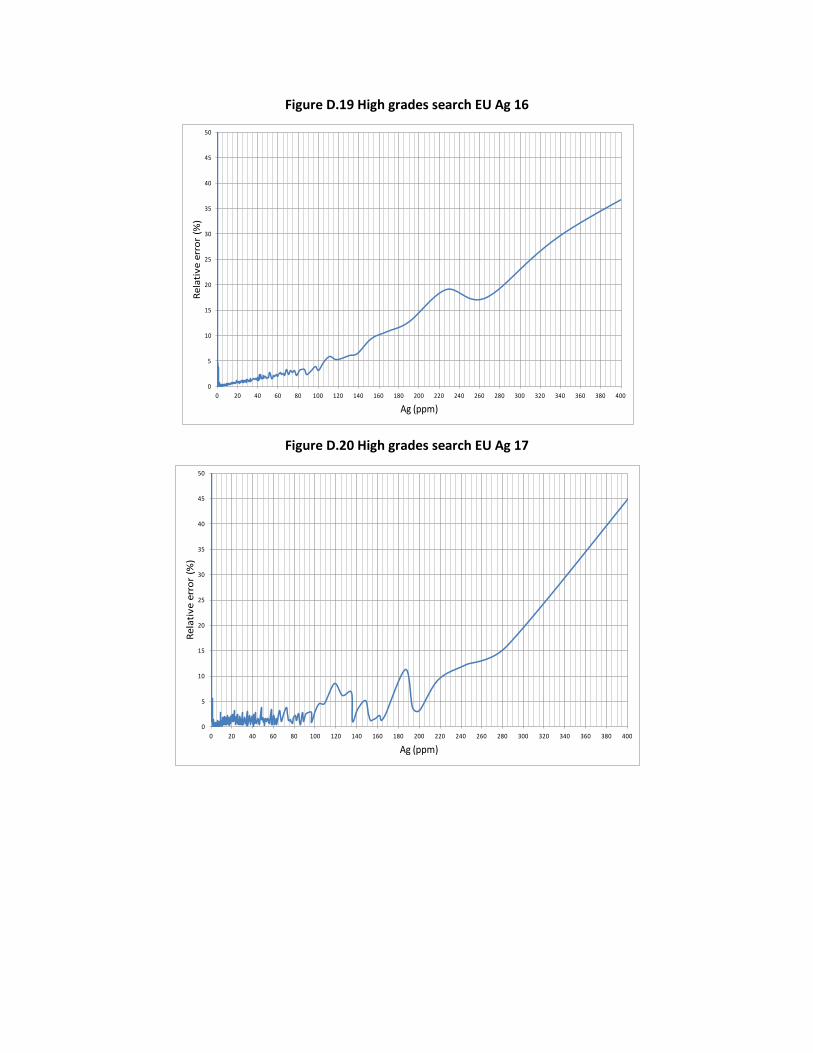
Figure D.19 High grades search EU Ag 16
Figure D.20 High grades search EU Ag 17
0
5
10
15
20
25
30
35
40
45
50
0 20 40 60 80 100 120 140 160 180 200 220 240 260 280 300 320 340 360 380 400
Rela
tive
erro
r (%
)
Ag (ppm)
0
5
10
15
20
25
30
35
40
45
50
0 20 40 60 80 100 120 140 160 180 200 220 240 260 280 300 320 340 360 380 400
Rela
tive
erro
r (%
)
Ag (ppm)
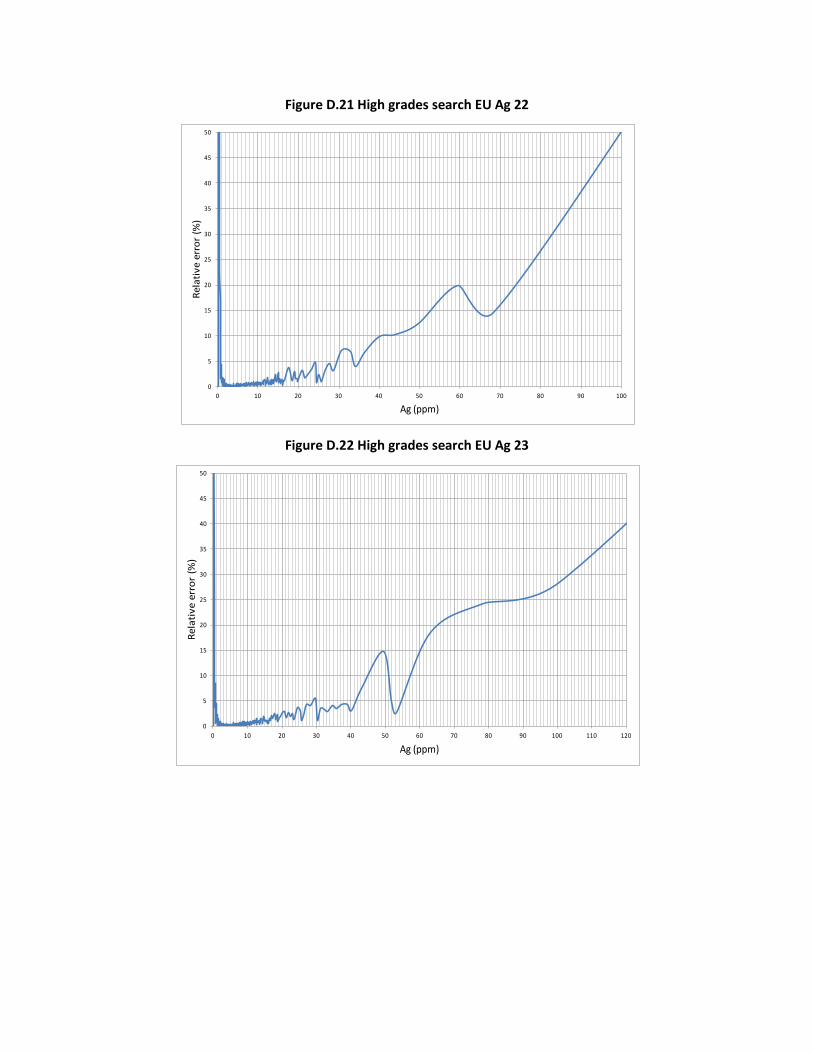
Figure D.21 High grades search EU Ag 22
Figure D.22 High grades search EU Ag 23
0
5
10
15
20
25
30
35
40
45
50
0 10 20 30 40 50 60 70 80 90 100
Rela
tive
erro
r (%
)
Ag (ppm)
0
5
10
15
20
25
30
35
40
45
50
0 10 20 30 40 50 60 70 80 90 100 110 120
Rela
tive
erro
r (%
)
Ag (ppm)
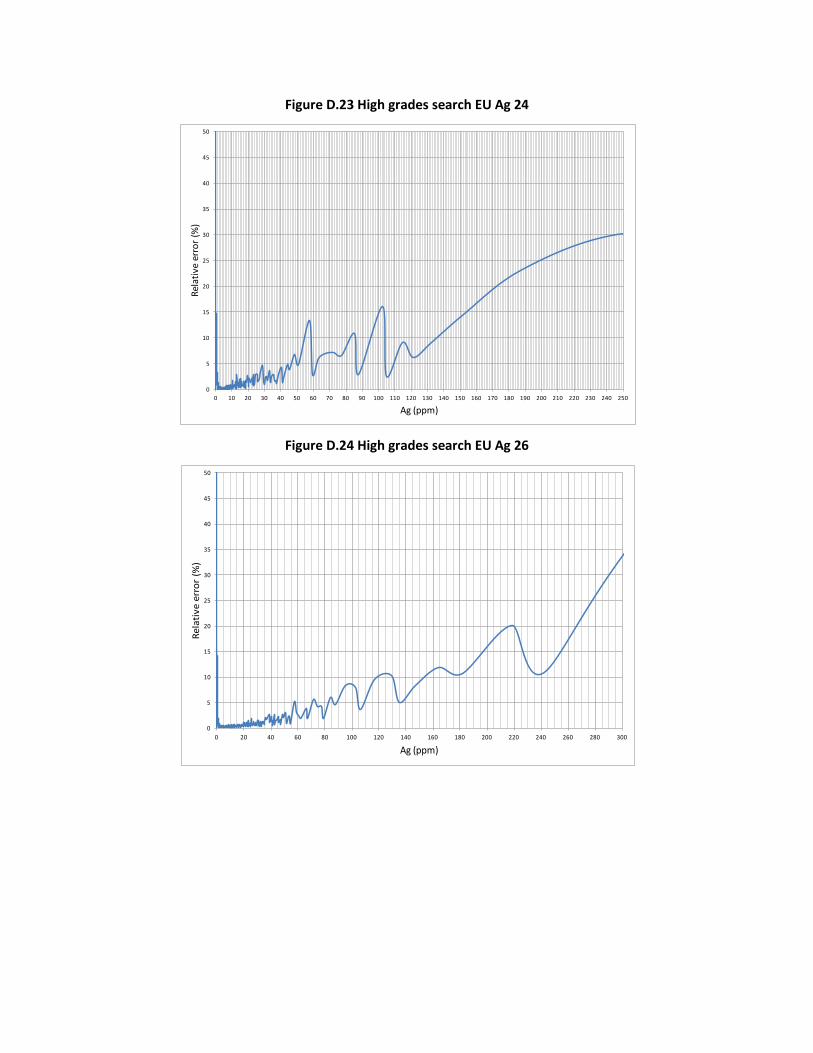
Figure D.23 High grades search EU Ag 24
Figure D.24 High grades search EU Ag 26
0
5
10
15
20
25
30
35
40
45
50
0 10 20 30 40 50 60 70 80 90 100 110 120 130 140 150 160 170 180 190 200 210 220 230 240 250
Rela
tive
erro
r (%
)
Ag (ppm)
0
5
10
15
20
25
30
35
40
45
50
0 20 40 60 80 100 120 140 160 180 200 220 240 260 280 300
Rela
tive
erro
r (%
)
Ag (ppm)
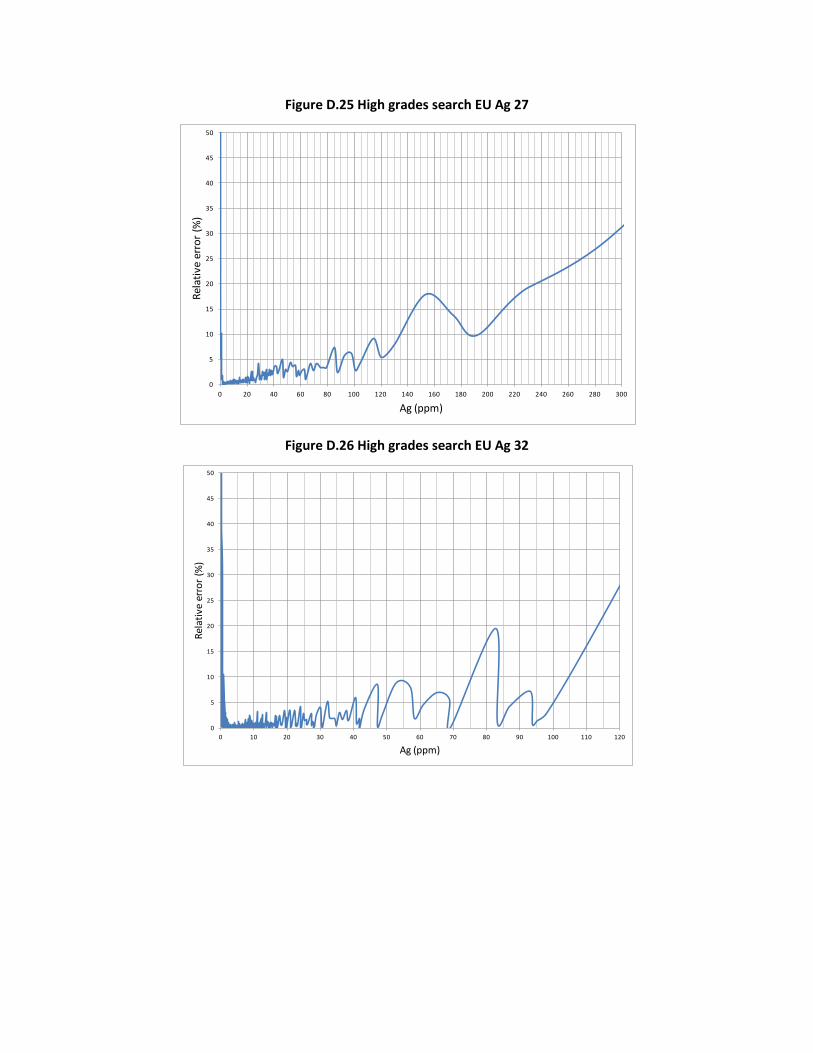
Figure D.25 High grades search EU Ag 27
Figure D.26 High grades search EU Ag 32
0
5
10
15
20
25
30
35
40
45
50
0 20 40 60 80 100 120 140 160 180 200 220 240 260 280 300
Rela
tive
erro
r (%
)
Ag (ppm)
0
5
10
15
20
25
30
35
40
45
50
0 10 20 30 40 50 60 70 80 90 100 110 120
Rela
tive
erro
r (%
)
Ag (ppm)
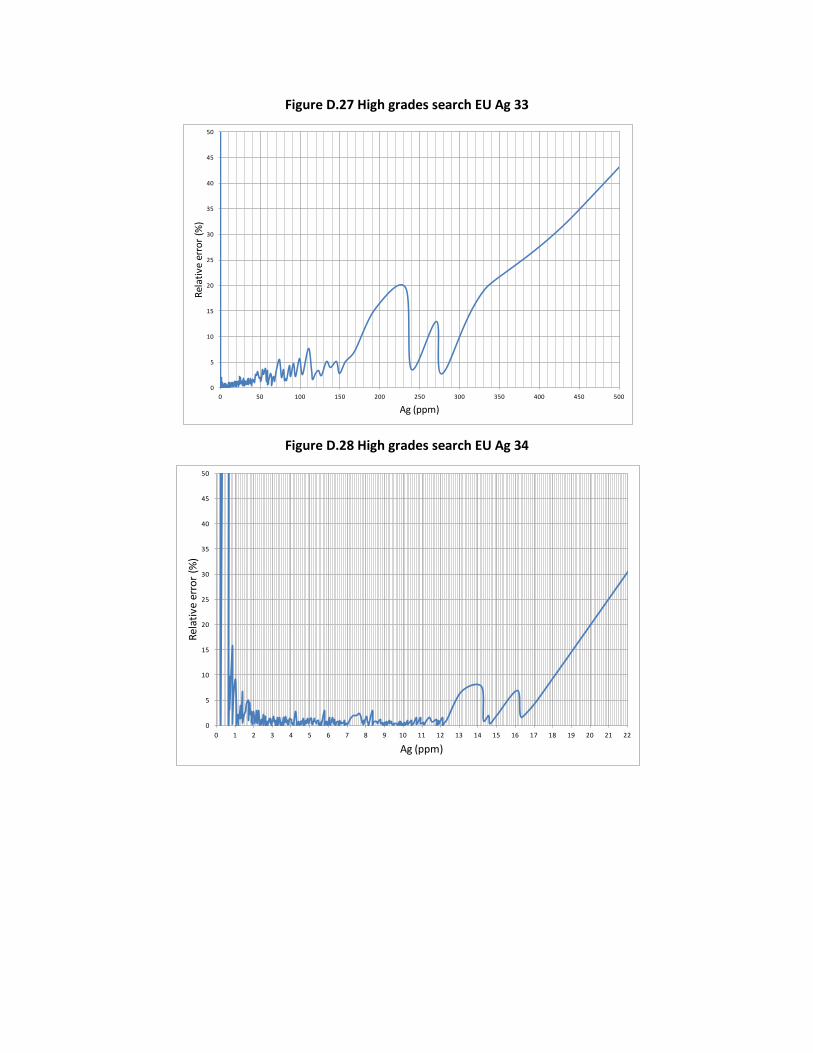
Figure D.27 High grades search EU Ag 33
Figure D.28 High grades search EU Ag 34
0
5
10
15
20
25
30
35
40
45
50
0 50 100 150 200 250 300 350 400 450 500
Rela
tive
erro
r (%
)
Ag (ppm)
0
5
10
15
20
25
30
35
40
45
50
0 1 2 3 4 5 6 7 8 9 10 11 12 13 14 15 16 17 18 19 20 21 22
Rela
tive
erro
r (%
)
Ag (ppm)
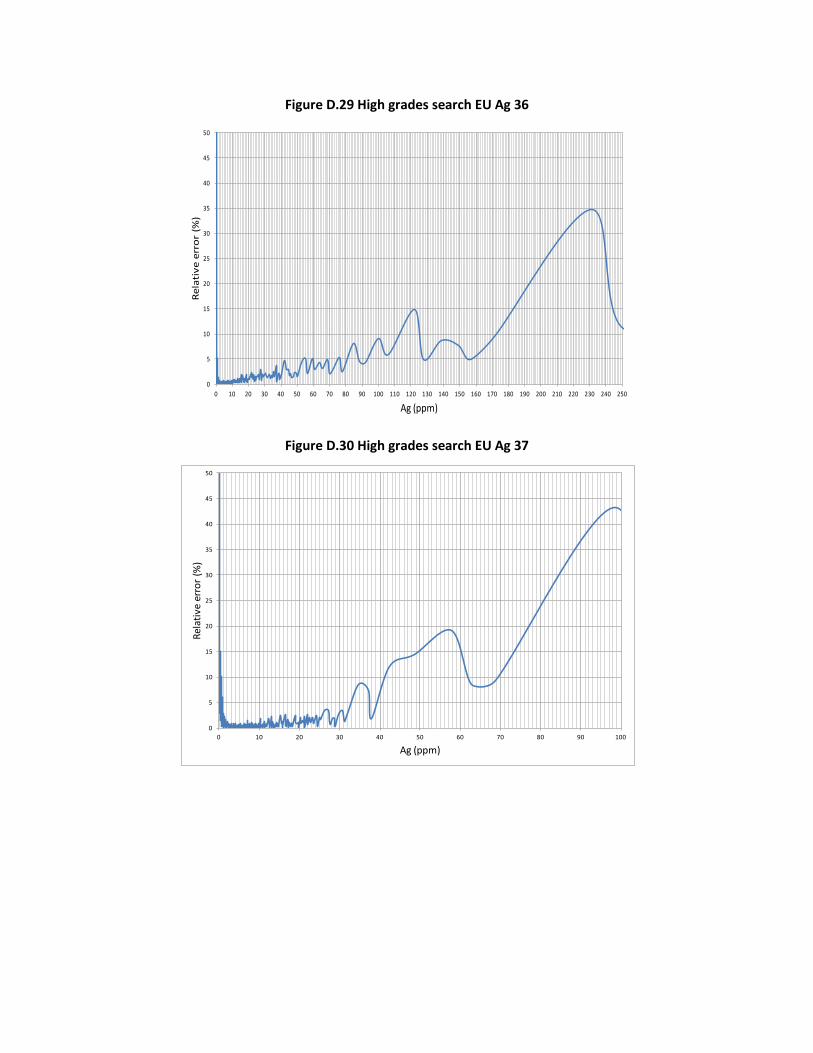
Figure D.29 High grades search EU Ag 36
Figure D.30 High grades search EU Ag 37
0
5
10
15
20
25
30
35
40
45
50
0 10 20 30 40 50 60 70 80 90 100 110 120 130 140 150 160 170 180 190 200 210 220 230 240 250
Rela
tive
err
or (
%)
Ag (ppm)
0
5
10
15
20
25
30
35
40
45
50
0 10 20 30 40 50 60 70 80 90 100
Rela
tive
erro
r (%
)
Ag (ppm)


![[1003] CONNOR SPORTS REZILL SLEEPER FLOORING · [1003] connor sports® rezill sleeper flooring NOTE : before you start work, check with our technical services whether this data sheet](https://static.fdocuments.net/doc/165x107/5f049f097e708231d40ee0e1/1003-connor-sports-rezill-sleeper-flooring-1003-connor-sports-rezill-sleeper.jpg)