
Paper3The_Dynamic_Relationship_between_Inflation_andEconomic_Growth_in_Indonesia.pdf
14
Page: 1 The Dynamics Relationship Between Inflation And Economic Growth In Indonesia: A Regional Thresholds Approach 1 By Tri Winarno Bank Indonesia Senior Researcher Department of Economic and Monetary Policy Bank Indonesia Building Sjafruddin Prawiranegara 19 th Floor Jalan MH. Thamrin No.2 Jakarta Pusat, Indonesia (10100) Phone: (62-21-3014772);Fax(62-21-3502030); [email protected] Abstract This paper examines the issue of the existence of threshold effects in the relationship between inflation rate and growth rate of gross domestics products (GDP) in the context of Indonesia. This analysis uses a dynamic panel threshold model to estimate inflation thresholds for long-term economic growth. Advancing on Hansen (1999) and Caner and Hansen(2004), this model allows the estimation of threshold effects with panel data even in case of endogenous regressors. The empirical analysis is based on annual panel-data set including 26 provinces in Indonesia for the period 2002–2012. A specific question addressed in this research was: What is the threshold inflation rate for Indonesia? The findings clearly suggest that one inflation threshold value (i.e., structural break point) exists for Indonesia; and this implies a non-linear relationship between inflation and growth rate of GDP. The estimated threshold regression model suggests 4.62 percent as the threshold value of inflation rate above which inflation significantly retards growth rate of GDP. In addition, below the threshold level, there is a statistically significant positive relationship between inflation rate and growth rate of GDP. If Bank Indonesia (Central Bank of Indonesia) pays more attention to the inflation phenomena, then substantial gains can be achieved in low-inflation environment while conducting the policy mix. Keywords: Inflation Thresholds, Inflation and Growth, Dynamic Panel, structural break, provinces, Indonesia. JEL classification: E31, C23, O40 1 The views expressed in this article are solely my own and do not necessarily reflect that of Bank Indonesia. E-mail: [email protected]
-
Upload
wan-na-prommanop -
Category
Documents
-
view
2 -
download
1
Transcript of Paper3The_Dynamic_Relationship_between_Inflation_andEconomic_Growth_in_Indonesia.pdf

Page: 1
The Dynamics Relationship Between Inflation And Economic Growth In Indonesia:
A Regional Thresholds Approach1
By Tri Winarno
Bank Indonesia Senior Researcher Department of Economic and Monetary Policy
Bank Indonesia Building Sjafruddin Prawiranegara 19th Floor
Jalan MH. Thamrin No.2 Jakarta Pusat, Indonesia (10100) Phone: (62-21-3014772);Fax(62-21-3502030); [email protected]
Abstract This paper examines the issue of the existence of threshold effects in the
relationship between inflation rate and growth rate of gross domestics
products (GDP) in the context of Indonesia. This analysis uses a dynamic panel threshold model to estimate inflation thresholds for long-term
economic growth. Advancing on Hansen (1999) and Caner and Hansen(2004), this model allows the estimation of threshold effects with
panel data even in case of endogenous regressors. The empirical analysis is based on annual panel-data set including 26 provinces in Indonesia for the
period 2002–2012. A specific question addressed in this research was: What is the threshold inflation rate for Indonesia? The findings clearly suggest that
one inflation threshold value (i.e., structural break point) exists for Indonesia; and this implies a non-linear relationship between inflation and
growth rate of GDP. The estimated threshold regression model suggests 4.62
percent as the threshold value of inflation rate above which inflation
significantly retards growth rate of GDP. In addition, below the threshold level, there is a statistically significant positive relationship between inflation
rate and growth rate of GDP. If Bank Indonesia (Central Bank of Indonesia) pays more attention to the inflation phenomena, then substantial gains can
be achieved in low-inflation environment while conducting the policy mix.
Keywords: Inflation Thresholds, Inflation and Growth, Dynamic Panel, structural break, provinces, Indonesia.
JEL classification: E3 1 , C2 3 , O 4 0
1The views expressed in this article are solely my own and do not necessarily reflect that of Bank
Indonesia. E-mail: [email protected]
Page: 2
1. Introduction
The conventional view in macroeconomics holds that low inflation is a necessary
condition for fostering economic growth. Although the debate about the precise relationship
between inflation and growth remains open, the question of the existence and nature of the
link between inflation and economic growth has been the subject of considerable interest and
debate. Different schools of thought offer different evidence on this relationship. For example,
structuralists believe that inflation is essential for economic growth, whereas the monetarists
see inflation as detrimental to economic growth (Mallik and Chowdhury 2001, p. 123). In a
seminal paper,Tobin (1965) introduces money into a Solow-Swan model as an asset alternative
to capital. Inthis context, inflation increases the opportunitycost of money holdings and thus
favors capital accumulation and hence growth. Conversely, in endogenous growth models, the
effects of inflation are explained in the works of Gomme (1993) and Jones and Manuelli (1995).
For example, where money is introduced in the budget constraint in a model of human capital
accumulation, an increase in the rate of inflation negatively affects both consumption and
labour supply leading to a lower growth rate. De Gregorio (1993) shows that inflation may have
relevant effects on accumulation of physical capital. In his model, money is a means of reducing
transaction costs both for consumers and firms, a higher inflation rate induces agents to reduce
their money holdings, thus increasing the transaction costs and generating negative effects on
investment and growth. Earlier empirical works generally accepted the view that there exists a
negative relationship between inflation and economic growth (Barro 1991; Fischer 1993;
Bullard and Keating 1995).
If inflation is indeed detrimental to economic activity and growth, it readily follows that
policy-makers should aim at a low rate of inflation. But how low should inflation be or should it
be 0 per cent? In other words, at what level of inflation does the relationship between inflation
and growth become negative? The answer to this question obviously depends upon the nature
and structure of the economy and will vary from country to country. Recent studies specifically
test for non-linearity in the relationship between inflation and economic growth. That is, at
lower rates of inflation, the relationship is insignificant or positive, but at higher levels, inflation
has a significantly negative effect on economic growth. If such a non-linear relationship exists
between inflation and growth, then it should be possible to estimate the threshold level
(structural break point) at which the sign of the relationship between the two variables would
switch. This is mainly achieved either by defining a priori the thresholds for different levels of
inflation rate in ad hoc manners (Fischer 1993; Barro 1995; Bruno and Easterly 1998), or by
using a spline regression technique to directly estimate the threshold rate of inflation (Sarel
1996; Ghosh and Phillips 1998). For example, the seminal work by Fischer (1993) examined the
possibility of non-linearities in the relationship between inflation and economic growth in panel
of ninety-three countries. Using both cross-section and panel data for a sample that includes
Page: 3
both developing and industrialized countries, results from this study suggest a negative
relationship between inflation and growth. Interestingly, by using break points of 15 per cent
and 40 per cent in spline regression, Fisher showed not only the presence of nonlinearities in
the relationship between inflation and growth, but also that the strength of this relationship
weakens for inflation rates above 40 per cent. Sarel (1996) used a panel data of eighty-seven
countries during the period 1970–90 and tested a structural break in the relationship between
inflation and growth and found evidence of a significant structural break at an annual inflation
rate of 8 per cent — implying below that rate, inflation does not have a significant effect on
growth, or it may even show a marginally positive effect. Above that level, the effect is
negative, statistically significant and extremely strong. Bruno and Easterly (1998) examined the
determinants of economic growth using annual consumer price index (CPI) inflation of twenty-
six countries which experienced inflation crises during the period 1961–92. In their empirical
analysis, inflation rate of 40 per cent and over is considered as the threshold level for an
inflation crisis. They found inconsistent or somewhat inconclusive relationship between
inflation and economic growth below this threshold level when countries with high inflation
crises were excluded from the sample.
Khan and Senhadji (2001) used an unbalanced panel data with 140 countries covering
the period 1960–98 to estimate the threshold levels for industrial and developing countries.
Using the non-linear least squares (NLLS) estimation method, Khan and Senhadji (2001)
estimated that the threshold levels for industrial countries and developing countries were at 1–
3 per cent and 11–12 per cent respectively. The negative and significant relationship between
inflation and growth, for inflation rates above the threshold level, is quite robust with respect
to the estimation method. Most recent economists have chosen to analyze the relationship
between inflation and growth by exploiting time series variation in the data. For instance,
Mubarik (2005) estimated the threshold level of inflation for Pakistan using an annual data set
from the period 1973–2000. His estimation of the threshold model suggests that an inflation
rate beyond 9 per cent is detrimental for the economic growth of Pakistan. This, in turn,
suggests that an inflation rate below the estimated level of 9 percent is favorable for the
economic growth. On the contrary, Hussain (2005) found no threshold level of inflation for
Pakistan by using the data set from the period 1973–2005. He suggests that targeting inflation
exceeding a range of 4–6 percent will be a deterrent to economic growth. Previously, Singh and
Kalirajan (2003) specifically addressed the issue of existence of the threshold effect by using
annual data from India for the period 1971–98. They also suggest that there is no threshold
level of inflation for India; however, their findings clearly suggest that an increase in inflation
from any level has negative effect on economic growth. Lee and Wong (2005) estimated the
threshold levels of inflation for Taiwan and Japan using quarterly data set from the period
1965–2002 for Taiwan and 1970–2001 for Japan. Their estimation of the threshold models
suggest that an inflation rate beyond 7.25 per cent is detrimental for the economic growth of

Page: 4
Taiwan. On the other hand, they found two threshold levels for Japan, which are 2.52 per cent
and 9.66 per cent. This suggests that inflation rate below the estimated level of 9.66 per cent is
favorable to economic growth and beyond this threshold value it is harmful for the economic
growth.
Based on the background, the purpose of this paper is to re-examine the relationship
between inflation rate and economic growth, and it attempts to estimate precise threshold
levels by using annual regional panel data for Indonesia over the period 2002–2012.
Particularly, the questions that are addressed in this paper are: (1) Is there any threshold level
of inflation in the case of Indonesia above which inflation affects growth rate of GDP
differently? (2) Is such astructural break statistically significant? This paper employs relatively
new econometric methods for threshold estimation advancing on Hansen (1999) and Caner and
Hansen (2004). The remainder of this paper proceeds as follows. Section 2 provides
econometric techniques to find the precise threshold levels for inflation rate. Section 3
describes the data. Section 4 provides the estimation results and discussions. Last but not the
least, section 5 offers some concluding remarks and proposes possible extensions for future
research on the topic.
2. A Dynamic Panel Threshold Model
2.1. The Econometric Model
This section develops a dynamic panel threshold model that extends Hansen’s (1999)
original static set up by endogenous regressors. In our empirical application where we analyze
the role of inflation thresholds in the relationship between inflation and economic growth (yit=
dgpdit), the endogenous regressor will be initial income (gdpit−1). Our model extension builds
on the cross-sectional threshold model of Caner and Hansen (2004) where GMM type
estimators are used in order to allow for endogeneity. To that aim, consider the following panel
threshold model:
………..(1)
where subscripts i = 1, . . . ,N represents the country and t = 1, . . . , T indexes time. μi is the
country specific fixed effect and the error term is εit ~ (0, σ2). I(·) is the indicator function
indicating the regime defined by the threshold variable qit and the threshold level ϒ . zit is a m-
dimensional vector of explanatory regressors which may include lagged values of y and other
endogenous variables. The vector of explanatory variables is partitioned into a subset z1it, of
exogenous variables uncorrelated with εit, and a subset of endogenous variables z2it, correlated
with εit. In addition to the structural equation (1) the model requires a suitable set of k ≥m
instrumental variables xit including z1it.
Page: 5
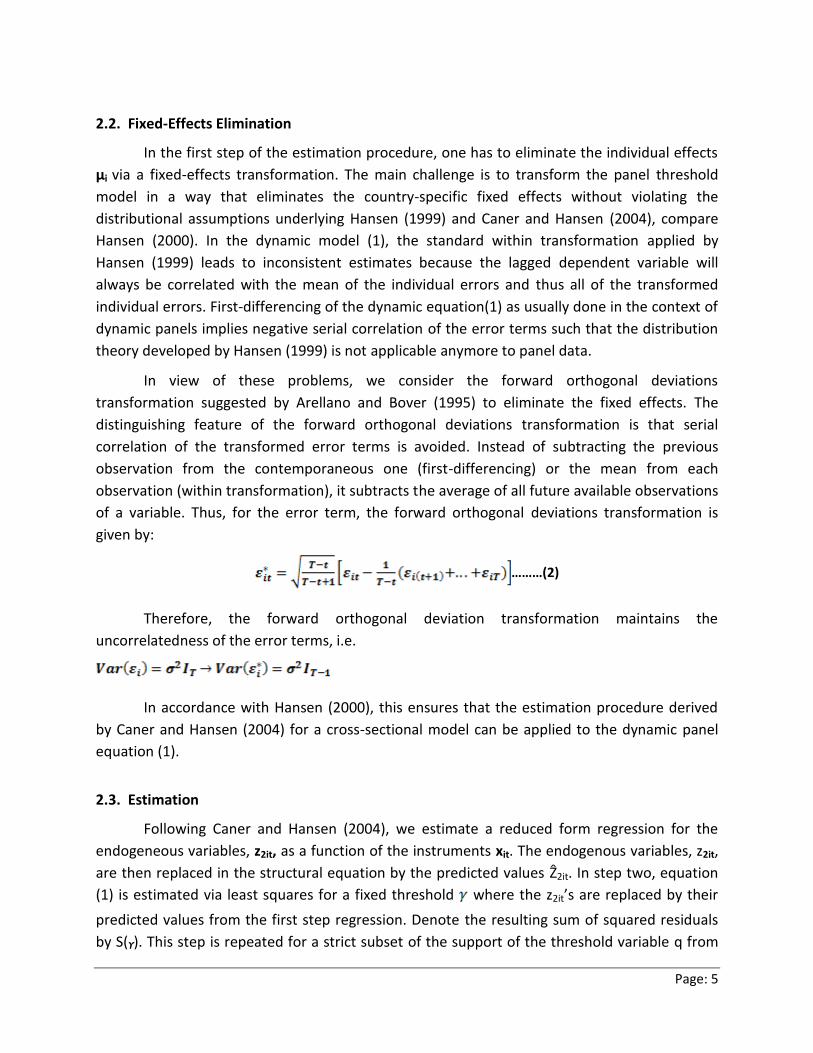
2.2. Fixed-Effects Elimination
In the first step of the estimation procedure, one has to eliminate the individual effects
μi via a fixed-effects transformation. The main challenge is to transform the panel threshold
model in a way that eliminates the country-specific fixed effects without violating the
distributional assumptions underlying Hansen (1999) and Caner and Hansen (2004), compare
Hansen (2000). In the dynamic model (1), the standard within transformation applied by
Hansen (1999) leads to inconsistent estimates because the lagged dependent variable will
always be correlated with the mean of the individual errors and thus all of the transformed
individual errors. First-differencing of the dynamic equation(1) as usually done in the context of
dynamic panels implies negative serial correlation of the error terms such that the distribution
theory developed by Hansen (1999) is not applicable anymore to panel data.
In view of these problems, we consider the forward orthogonal deviations
transformation suggested by Arellano and Bover (1995) to eliminate the fixed effects. The
distinguishing feature of the forward orthogonal deviations transformation is that serial
correlation of the transformed error terms is avoided. Instead of subtracting the previous
observation from the contemporaneous one (first-differencing) or the mean from each
observation (within transformation), it subtracts the average of all future available observations
of a variable. Thus, for the error term, the forward orthogonal deviations transformation is
given by:
………(2)
Therefore, the forward orthogonal deviation transformation maintains the
uncorrelatedness of the error terms, i.e.
In accordance with Hansen (2000), this ensures that the estimation procedure derived
by Caner and Hansen (2004) for a cross-sectional model can be applied to the dynamic panel
equation (1).
2.3. Estimation
Following Caner and Hansen (2004), we estimate a reduced form regression for the
endogeneous variables, z2it, as a function of the instruments xit. The endogenous variables, z2it,
are then replaced in the structural equation by the predicted values Ẑ2it. In step two, equation
(1) is estimated via least squares for a fixed threshold where the z2it’s are replaced by their
predicted values from the first step regression. Denote the resulting sum of squared residuals
by S(ϒ). This step is repeated for a strict subset of the support of the threshold variable q from

Page: 6
which in a third step the estimator of the threshold value ϒ is selected as the one associated
with the smallest sum of squared residuals, that is = argminSn(ϒ).
In accordance with Hansen (1999) and Caner and Hansen (2004), the critical values for
determining the 95% confidence interval of the threshold value are given by
Γ = { ϒ: LR(ϒ) ≤C(α )},
Where C( α ) is the 95% percentile of the asymptotic distribution of the likelihood ratio statistic
LR(ϒ ). The underlying likelihood ratio has been adjusted to account for the number of time
periods used for each cross section, see Hansen (1999). Once is determined, the slope
coefficients can be estimated by the generalized methodof moments (GMM) for the previously
used instruments and the previous estimated threshold .
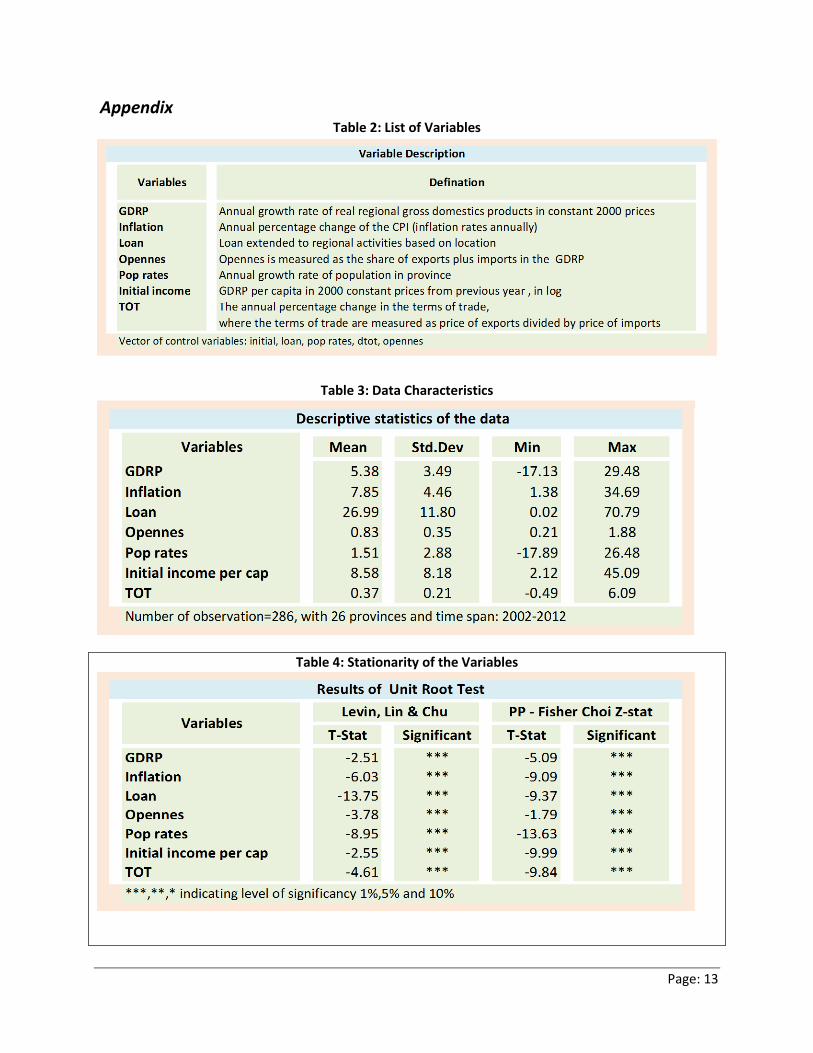
3. Data and Variables
Our empirical application of the dynamic panel threshold model to the inflation-growth
nexus is based on a balanced panel-data set of 26 provinces in Indonesia. The data of provinces
are identified in accordance with the Indonesia’s National Statistical Office (BPS) and shown in
Table 3 in the Appendix. This research uses annual panel data from 2002 to 2012 and obtained
from BPS. For each province, annual growth rates of real gross domestics regional products
(GDRP) are in constant 2000 prices (dgdp). Inflation is computed as the annual percentage
change of the Consumer Price Index (π).
3.1. Control Variables
Any empirical analysis of inflation’s impact on economic growth has to control for the
influence of other economic variables that are correlated with the rate of inflation. Following
Khan and Senhadji (2001) and Drukker et al. (2005), we consider the population growth rate
(dpop), the initial income level (initial) measured as GDP per capita from the previous period
and openness (open) measured as the share of exports plus imports in GDP. The annual
percentage change in the terms of trade (dtot) is measured as prices of exports divided by
prices of imports. These variables are obtained from BPS. However, instead of the percentage
of GDP dedicated to investment (igdp) we use the loan growth rate (dloan), and this variable
taken from Bank Indonesia data. More information about the control variables is contained in
Table 2 in the Appendix. All these variables passed the robustness tests of Levin, Lin & Chu and
PP - Fisher Choi Z-stat (see Table 4 in the Appendix).
Page: 7
3.2. Inflation
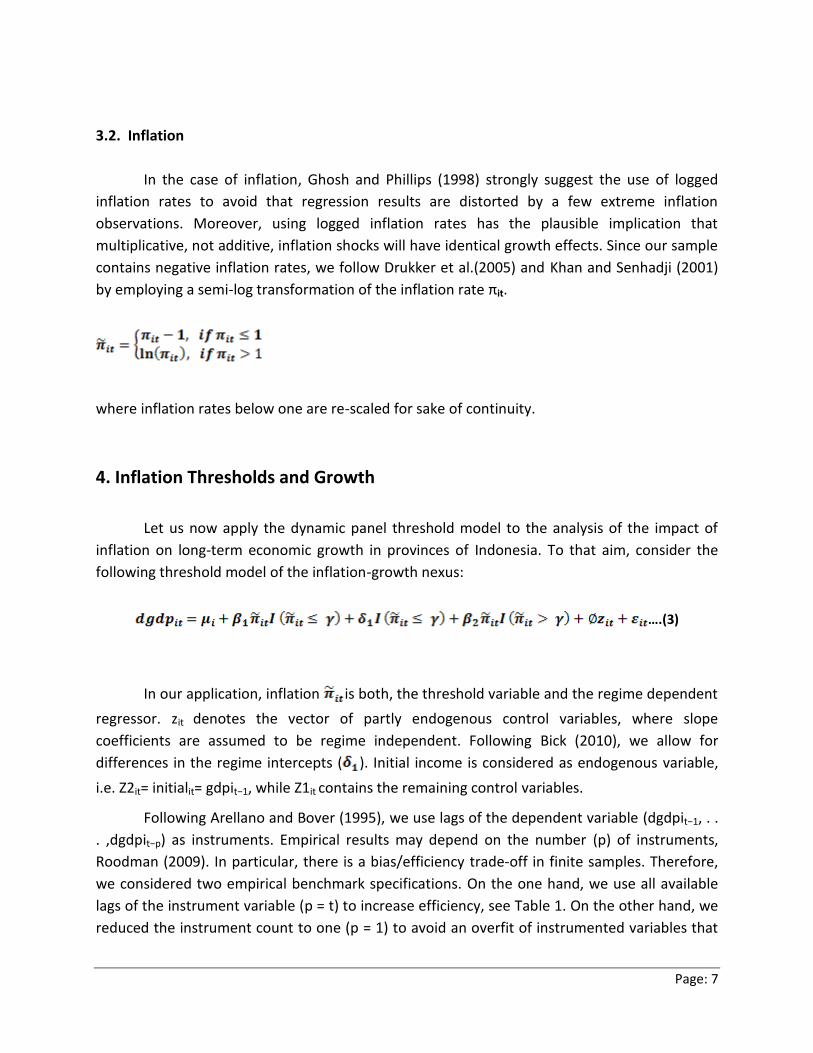
In the case of inflation, Ghosh and Phillips (1998) strongly suggest the use of logged
inflation rates to avoid that regression results are distorted by a few extreme inflation
observations. Moreover, using logged inflation rates has the plausible implication that
multiplicative, not additive, inflation shocks will have identical growth effects. Since our sample
contains negative inflation rates, we follow Drukker et al.(2005) and Khan and Senhadji (2001)
by employing a semi-log transformation of the inflation rate πit.
where inflation rates below one are re-scaled for sake of continuity.
4. Inflation Thresholds and Growth
Let us now apply the dynamic panel threshold model to the analysis of the impact of
inflation on long-term economic growth in provinces of Indonesia. To that aim, consider the
following threshold model of the inflation-growth nexus:
….(3)
In our application, inflation is both, the threshold variable and the regime dependent
regressor. zit denotes the vector of partly endogenous control variables, where slope
coefficients are assumed to be regime independent. Following Bick (2010), we allow for
differences in the regime intercepts ( ). Initial income is considered as endogenous variable,
i.e. Z2it= initialit= gdpit−1, while Z1it contains the remaining control variables.
Following Arellano and Bover (1995), we use lags of the dependent variable (dgdpit−1, . .
. ,dgdpit−p) as instruments. Empirical results may depend on the number (p) of instruments,
Roodman (2009). In particular, there is a bias/efficiency trade-off in finite samples. Therefore,
we considered two empirical benchmark specifications. On the one hand, we use all available
lags of the instrument variable (p = t) to increase efficiency, see Table 1. On the other hand, we
reduced the instrument count to one (p = 1) to avoid an overfit of instrumented variables that
Page: 8
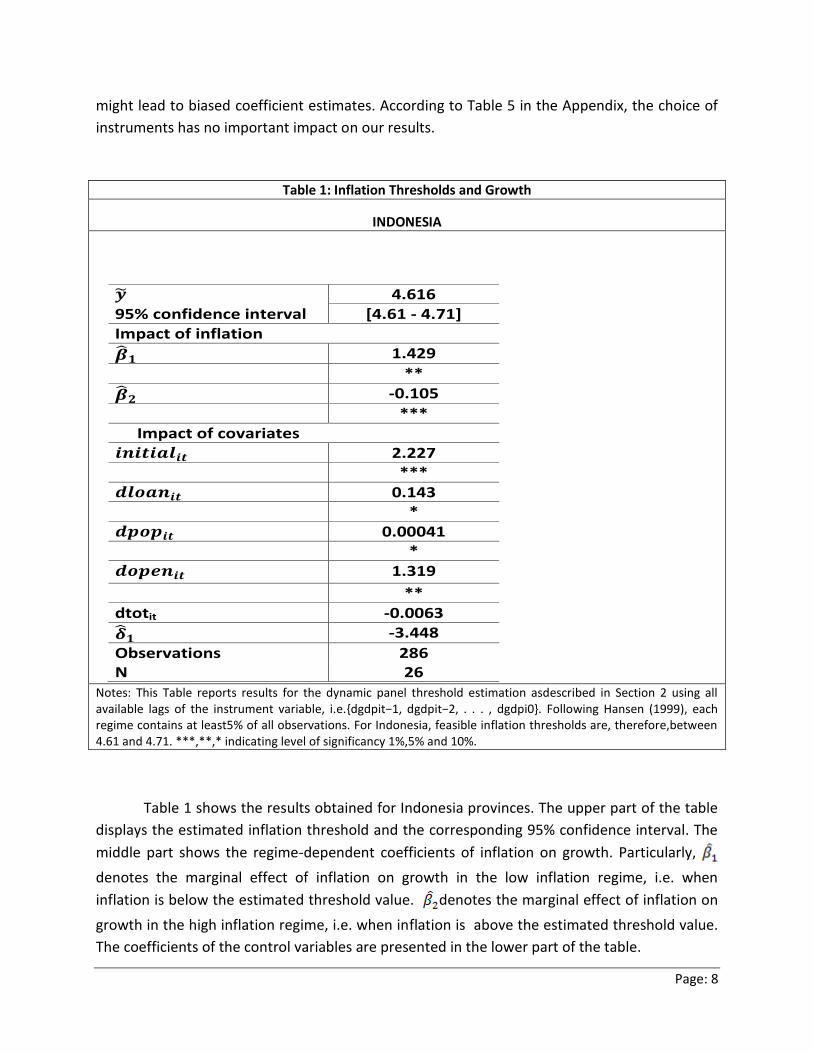
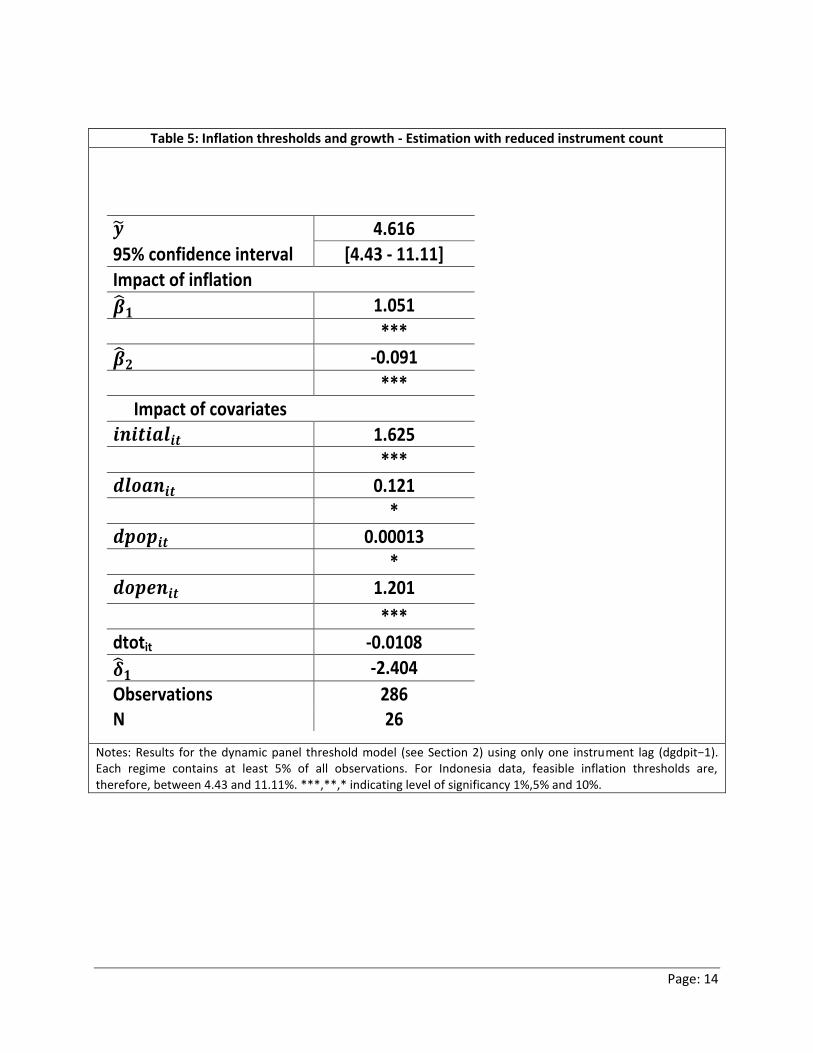
might lead to biased coefficient estimates. According to Table 5 in the Appendix, the choice of
instruments has no important impact on our results.
Table 1: Inflation Thresholds and Growth
INDONESIA
𝒚 4.616
95% confidence interval [4.61 - 4.71]
Impact of inflation
𝜷 𝟏 1.429
**
𝜷 𝟐 -0.105
*** Impact of covariates
𝒊𝒏𝒊𝒕𝒊𝒂𝒍𝒊𝒕 2.227
***
𝒅𝒍𝒐𝒂𝒏𝒊𝒕 0.143
*
𝒅𝒑𝒐𝒑𝒊𝒕 0.00041
*
𝒅𝒐𝒑𝒆𝒏𝒊𝒕 1.319
**
dtotit -0.0063
𝜹 𝟏 -3.448
Observations 286 N 26
Notes: This Table reports results for the dynamic panel threshold estimation asdescribed in Section 2 using all available lags of the instrument variable, i.e.{dgdpit−1, dgdpit−2, . . . , dgdpi0}. Following Hansen (1999), each regime contains at least5% of all observations. For Indonesia, feasible inflation thresholds are, therefore,between 4.61 and 4.71. ***,**,* indicating level of significancy 1%,5% and 10%.
Table 1 shows the results obtained for Indonesia provinces. The upper part of the table
displays the estimated inflation threshold and the corresponding 95% confidence interval. The
middle part shows the regime-dependent coefficients of inflation on growth. Particularly,
denotes the marginal effect of inflation on growth in the low inflation regime, i.e. when
inflation is below the estimated threshold value. denotes the marginal effect of inflation on
growth in the high inflation regime, i.e. when inflation is above the estimated threshold value.
The coefficients of the control variables are presented in the lower part of the table.

Page: 9
4.1. The Inflation-Growth Nexus in Indonesia
The results for the empirical relation between inflation and economic growth in
Indonesia based on the first benchmark specification are presented in the Table 1. The
estimated inflation threshold of 4.616% as well as the marginal effects of inflation on growth
strongly support the prevailing inflation targets of Bank Indonesia. First, the 95% confidence
interval ([4.61, 4.71]) indicates that the critical value of inflation for Indonesia is clearly lower
than the 40% proposed by Bruno and Easterly (1998). Second, both regime-dependent
coefficients of inflation are significant and plausibly signed. Inflation is positively correlated
with economic growth in Indonesia if below the threshold ( =1.429), while the opposite is true
for higher inflation ( = -0.105). The absolute size of the inflation coefficients suggest that
correlation between inflation and economic growth of Indonesia is stronger when inflation is
low. According to the 95% confidence intervals, this conclusion holds at least for inflation rates
”below but close to 5%”. It is worth emphasizing that our results are robust with respect to the
choice of instruments, see Table 5 in the Appendix. The only notable exception refers to the
confidence interval of the inflation threshold. If the instrument count is reduced to one,
estimation is less efficient and the 95% confidence interval of the inflation threshold widens to
[4.43, 11.11]. As a consequence, the evidence on the long-run growth effects of inflation rates
around 5% must be viewed with caution.
5. Concluding Remarks
This paper provided new evidence on the non-linear relationship between inflation and
long-term economic growth. To that aim, we built on Hansen (1999) and Caner and Hansen
(2004) and developed a dynamic threshold model that allows for endogeneous regressors in a
panel setup. Applying the forward orthogonal deviations transformation suggested by Arellano
and Bover (1995) ensured that the original distribution theory of the threshold model applied
to static panels as in Hansen (1999) is still valid in a dynamic context.
Applying the dynamic regional panel threshold model to the analysis of thresholds in the
inflation-growth nexus of Indonesia, confirmed the general consensus among economists. In
particular, our empirical results suggest that inflation distorts economic growth provided it
exceeds a certain critical value. For the case of Indonesia, our results support the inflation
targets of about 5% which are more or less explicitly announced by Bank Indonesia.
Contributing to the recent discussion on the appropriate level of inflation targets stirred by
Blanchard et al. (2010), we estimated that inflation rates exceeding a critical value of 5% are
Page: 10
negatively correlated with economic growth. Inflation rates above this threshold come along
with significantly negative growth rates.
However, policy conclusions based on reduced form estimates have to be viewed with
caution. In particular, the estimated inflation-growth nexus does not necessarily reflect
causality but rather correlation. Yet, significant inflation thresholds in the empirical relationship
between inflation and growth may provide a useful guideline for further research on the impact
of inflation on growth. Lin and Ye (2009), for example, show that the performance of inflation
targeting in developing countries can be affected by further country characteristics.
Accordingly, inflation thresholds in developing countries and, thus the appropriate level of the
inflation target might be also country-specific. The identification of country-specific inflation
thresholds in the inflation-growth nexus might provide useful information about the
appropriate location and width of an inflation targeting band.
Page: 11
References Arellano, M. and Bover, O. (1995). Another look at the instrumental variables estimationof error-
components models, Journal of Econometrics 68: 29–51.
Barro, R. J. “Economic Growth in a Cross Section of Countries”. Quarterly Journal of Economics 106, no. 2
(1991): 407–43.
———. “Inflation and Economic Growth”. National Bureau of Economic Research (NBER) Working Paper
No. 5326 (1995).
Bick, A. (2010). Threshold Effects of Inflation on Economic Growth in Developing Countries, Economics
Letters 108(2): 126–129.
Blanchard, O., Dell Ariccia, G. and Mauro, P. (2010). Rethinking Macroeconomic Policy, IMF Staff Position
Note SPN/10/03.
Bruno, M. and Easterly, W. (1998). Inflation Crisis and Long-Run Growth, Journal of Monetary Economics
41: 3–26.
Bruno, M. and W. Easterly, W. “Inflation Crises and Long-Run Growth”. Journal of Monetary Economics
41, no. 1 (1998): 3–26.
Bullard, J. and D. Keating. “The Long-Run Relationship between Inflation and Output in Postwar
Economies”. Journal of Monetary Economics 36, no. 3 (1995): 477–496.
Caner, M. and Hansen, B. E. (2004). Instrumental Variable Estimation of a ThresholdModel, Econometric
Theory 20: 813–843.
De Gregorio, J. “Inflation, Taxation and Long Run Growth”. Journal of Monetary Economics 31, no. 3
(1993): 271–298.
Drukker, D., Gomis-Porqueras, P. and Hernandez-Verme, P. (2005). Threshold Effectsin the Relationship
Between Inflation and Growth: A New Panel-Data Approach,Working Paper .
Fischer, S. “The Role of Macroeconomic Factors in Growth”. Journal of Monetary Economics 32, no. 3
(1993): 485–512.
Ghosh, A. and Phillips, S. (1998). Warning: Inflation May Be Harmful to Your Growth, IMF Staff Papers
45(4): 672–710.
Gomme, P. “Money and Growth Revisited: Measuring the Costs of Inflation in an Endogenous Growth
Model”. Journal of Monetary Economics 32, no. 1 (1993), pp. 51–77.
Hansen, B. E. (1999). Threshold Effects in Non-Dynamic Panels: Estimation, Testing,and Inference,
Journal of Econometrics 93: 345–368.
Hansen, B. E. (2000). Sample Splitting and Threshold Estimation, Econometrica68(3): 575–603.
Hussain, M. “Inflation and Growth: Estimation of Threshold Point for Pakistan”. Pakistan Business
Review, October (2005): 1–15.
Jones, L. E. and R. E. Manuelli. “Growth and the Effects of Inflation”. Journal of Economic Dynamics and
Control 19, no. 8 (1995): 1405–28.
Khan, M. S. and Senhadji, A. S. (2001). Threshold effects in the Relationship between Inflation and
Growth, IMF Staff Papers 48.
Lee, C. C. and S. Y. Wong. “Inflationary Threshold Effects in the Relationship between Financial
Development and Economic Growth: Evidence from Taiwan and Japan”. Journal of Economic
Development 30, no. 1 (2005): 49–69.
Page: 12
Lin, S. and Ye, H. (2009). Does Inflation Targeting Make a Difference in Developing Countries?, Journal of
Development Economics 89: 118–123.
Mallik, G. and A. Chowdhury. “Inflation and Economic Growth: Evidence from South Asian Countries”.
Asian Pacific Development Journal 8, no. 1 (2001): 123–35.
Mubarik, Y. A. “Inflation and Growth: An Estimate of the Threshold Level of Inflation in Pakistan”. State
Bank of Pakistan — Research Bulletin 1, no. 1 (2005): 35–44.
Roodman, D. (2009). A Note on the Theme of Too Many Instruments, Oxford Bulletinof Economics and
Statistics 71(1): 135–158.
Sarel, M. “Nonlinear Effects of Inflation on Economic Growth”. IMF Staff Papers 43, no. 1 (March 1996):
199–215.
Singh, K. and K. Kaliappa. “The Inflation-Growth Nexus in India: An Empirical Analysis”. Journal of Policy
Modeling 25, no. 4 (2003): 377–396.
Tobin, J. “Money and Economic growth”. Econometrica 33 (1965): 671–684.
Page: 13
Appendix Table 2: List of Variables
Table 3: Data Characteristics
Table 4: Stationarity of the Variables
Page: 14
Table 5: Inflation thresholds and growth - Estimation with reduced instrument count
𝒚 4.616
95% confidence interval [4.43 - 11.11]
Impact of inflation
𝜷 𝟏 1.051
***
𝜷 𝟐 -0.091
*** Impact of covariates
𝒊𝒏𝒊𝒕𝒊𝒂𝒍𝒊𝒕 1.625
***
𝒅𝒍𝒐𝒂𝒏𝒊𝒕 0.121
*
𝒅𝒑𝒐𝒑𝒊𝒕 0.00013
*
𝒅𝒐𝒑𝒆𝒏𝒊𝒕 1.201
***
dtotit -0.0108
𝜹 𝟏 -2.404
Observations 286 N 26
Notes: Results for the dynamic panel threshold model (see Section 2) using only one instrument lag (dgdpit−1). Each regime contains at least 5% of all observations. For Indonesia data, feasible inflation thresholds are, therefore, between 4.43 and 11.11%. ***,**,* indicating level of significancy 1%,5% and 10%.


