PANCHESHWAR DEVELOPMENT AUTHORITY (PDA) · 1.8 project features 10 1.9 outline of the report 11...
187
JUNE 2017 PANCHESHWAR DEVELOPMENT AUTHORITY (PDA) Consultant: 76-C, Institutional Area, Sector – 18, Gurgaon – 122015, Haryana (INDIA) Telephone: 0124-2342576, Fax: 0124-2349187 [email protected] Website: http://www.wapcos.co.in VOLUME-II : SOCIAL IMPACT ASSESSMENT REPORT PANCHESHWAR MULTIPURPOSE PROJECT GOVERNMENT OF INDIA Ministry of Water Resources, River Development and Ganga Rejuvenation GOVERNMENT OF NEPAL Ministry of Energy
Transcript of PANCHESHWAR DEVELOPMENT AUTHORITY (PDA) · 1.8 project features 10 1.9 outline of the report 11...

JUNE 2017
PANCHESHWAR DEVELOPMENT AUTHORITY (PDA)
Consultant:
76-C, Institutional Area, Sector – 18, Gurgaon – 122015, Haryana (INDIA)
Telephone: 0124-2342576, Fax: 0124-2349187 [email protected]
Website: http://www.wapcos.co.in
VOLUME-II : SOCIAL IMPACT ASSESSMENT REPORT
PANCHESHWAR MULTIPURPOSE PROJECT
GOVERNMENT OF INDIA Ministry of Water Resources,
River Development and Ganga Rejuvenation
GOVERNMENT OF NEPAL Ministry of Energy

CONTENTS

PANCHESHWAR MULTIPURPOSE PROJECT SIA Study Report
i
TABLE OF CONTENTS
Sub Heading Heading Page No.
CHAPTER 1: INTRODUCTION
1.1 GENERAL 1
1.2 THE MAHAKALI TREATY-1996 2
1.3 PANCHESHWAR DEVELOPMENT AUTHORITY 3
1.4 HISTORY OF THE PROJECT 4
1.5 PROJECT LOCATION 7
1.6 MAHAKALI RIVER BASIN 8
1.7 ACCESS 9
1.8 PROJECT FEATURES 10
1.9 OUTLINE OF THE REPORT 11
CHAPTER 2: ASSESSMENT OF PROJECT AFFECTED VILLAGES AND FAMILIES
2.1 METHODOLOGY ADOPTED FOR ENYMERATION 1
2.2 IDENTIFICATION OF PROJECT AFFECTED VILLAGES
1
2.3 ACQUISITION OF PRIVATE LAND 4
2.4 ENUMERATION OF PAFS AFFECTED DUE TO LAND ACQUISITION
8
CHAPTER 3: ENVIRONMENTAL BASELINE STATUS-SOCIO-ECONOMIC ASPECTS
3.1 GENERAL 1
3.2 DEMOGRAHIC PROFILE OF VILLAGES 1
CHAPTER 4: DATA ANALYSIS OF SURVEYED POPULATION
4.1 GENERAL 1
4.2 SOCIO-ECONOMIC PROFILE OF PROJECT AFFECTED FAMILIES
1
CHAPTER 5: PROPERTY SURVEY
5.1 GENERAL 1
5.2 OBJECTIVES OF THE STUDY 1
5.3 STUDY APPROACH AND METHODOLOGY 1
5.4 FIELD WORK 3
5.5 DATA COMPILATION, ANALYSIS AND REPORTING 3
5.6 LAND REQUIREMENT FOR THE PROJECT AND PROPOSED ACTIVITIES
4
5.7 ASSESSMENT OF LOSS OF PRIVATE PROPERTIES 5
5.8 COMMUNITY PROPERTIES AND ASSETS 10
5.9 GOVERNMENT BUILDING, STRUCTURE AND SPACES
11
5.10 SUMMARY 12
CHAPTER 6: SOCIAL IMPACT ASSESSMENT
6.1 INTRODUCTION 1
6.2 IMPACTS DURING CONSTRUCTION PHASE 1
6.3 IMPACTS DURING OPERATION PHASE 5
6.4 IMPACTS DUE TO COMMAND AREA DEVELOPMENT
9
CHAPTER 7: RESETTLEMENT AND REHABILITATION PLAN
7.1 INTRODUCTION 1

PANCHESHWAR MULTIPURPOSE PROJECT SIA Study Report
ii
7.2 RESETTLEMENT AND REHABILITATION PLAN 2
7.3 MEASURES FOR RESETTLEMENT 3
7.4 AMENITIES AND INFRASTRUCTURAL FACILITIES TO BE PROVIDED AT RESETTLEMENT AREAS
5
7.5 MEASURES FOR REHABILITATION 11
7.6 COMMUNITY PROPERTIES 21
7.7 BUDGET 23
CHAPTER 8: LIVELIHOOD PLAN FOR PAFS WHO ARE LIKELY TO LOSE ENTIRE LANDS
8.1 INTRODUCTION 1
8.2 LLIVESTOCK REARING 1
8.3 HORTICULTURE 3
8.4 BEE-KEEPING 5
8.5 TRAINING FOR SKILL DEVELOPMENT 5
8.6 TOURISM DEVELOPMENT 6
8.7 WOMEN SELF HELP GROUPS 7
8.8 BUDGET FOR LIVELIHOOD PLAN FOR PAFS 9
CHAPTER 9: LOCAL AREA DEVELOPMENT PLAN
9.1 INTRODUCTION 1
9.2 LOCAL AREA DEVELOPMENT PLAN 1
9.3 BUDGET FOR LADP 7
CHAPTER 10: MONITORING AND EVALUATION
10.1 INTRODUCTION 1
10.2 INSTITUTIONAL/ADMINISTRATIVE ARRANGEMENT FOR IMPLEMENTATION OF R&R MEASURES
1
10.3 MONITORING AND EVALUATION 3
10.4 BUDGET 7
CHAPTER 11: COST ESTIMATES
11.1 COST FOR IMPLEMENTING MANAGEMENT PLAN FOR SOCIAL ASPECTS
1

PANCHESHWAR MULTIPURPOSE PROJECT SIA Study Report
iii
LIST OF TABLES
Table-1.1: Composition of Governing Body of PDA 4
Table-2.1: List of affected villages of Pancheshwar MPP 1
Table-2.2: List of affected villages of Rupaligad RDP 4
Table-2.3 Ownership status of land to be acquired for various project
appurtenance on Indian portion
5
Table-2.4 Details of land to be acquired for the project 5
Table-2.5: Details of private land to be acquired in Fully Affected Villages
of Pancheshwar Dam
5
Table-2.6: Details of private land to be acquired in Partially Affected
Villages of Pancheshwar Dam
6
Table-2.7 Details of private land to be acquired in Partially Affected
Villages of Rupalugad Dam
8
Table-2.8 Village-wise list of PAFs losing Land Only, Land & Homestead
and Homestead for Pancheshwar MPP
9
Table-2.9: Village wise list of Affected PAFs for Rupaligad RDP 12
Table-2.10 Summary of PAFs in Pancheshwar MPP and Rupaligad RDP 13
Table-3.1: Demographic Profile of Study Area villages 1
Table-3.2: Caste Profile of the Study Area Villages 7
Table-3.3: Literacy Profile of Study Area Villages 12
Table-3.4: Occupational Profile of Study Area Villages 17
Table-4.1: List of Project Affected Villages 2
Table-4.2: Religious Affiliation of the Project Affected Families 7
Table-4.3: Demographic Profile of the PAFs 11
Table-4.4: Marital status of the Surveyed Population 15
Table-4.5: Village wise details of Migration Pattern of surveyed PAFs 20
Table-4.6: Caste Profile of surveyed Project Affected Families 25
Table-4.7: Educational Profile of the Project Affected Families 29
Table-4.8: Occupational Profile of the Surveyed Project Affected Families 34
Table-4.9: Summary of Occupational Profile of the surveyed Project
Affected Families
43
Table-5.1: List of PAFs losing land, land & homesteads and homesteads
only
4
Table-5.2: Break-up of Land requirement for the Project 4
Table-5.3: Details of the homestead and being affected 5
Table-5.4: List of other properties affected 9
Table-5.5: Details of community property being affected in fully affected
villages
10
Table-5.6 Village wise details of government building, structure and
spaces in the fully affected villages
11
Table-6.1: Impoverishment Risk Assessment 7
Table-7.1: Details of land to be acquired for the project 1
Table-7.2 List of PAFs losing Homesteads & Land and Only Land 2

PANCHESHWAR MULTIPURPOSE PROJECT SIA Study Report
iv
Table-7.3: Provisions for Resettlement Plan for families losing homestead 3
Table-7.4 Man-power required in the proposed Primary Health Centre 9
Table-7.5 Recommended species for Avenue Plantation in Resettlement
Colony
9
Table-7.6: Summary of amenities and facilities to be provided in
resettlement sites
11
Table-7.7 Entitlement matrix for the Private Land Acquisition 13
Table-7.8: Provisions for Rehabilitation Plan for families losing land 21
Table-7.9 Community Properties affected due to the project 22
Table-7.10 Provision for community properties 22
Table-7.11: Budget for implementation of the Rehabilitation and
Resettlement Plan
23
Table-7.12: Budget earmarked in DPR for Private Land Acquisition 24
Table-8.1: Budget earmarked for livestock development amongst PAFs 2
Table-8.2 Details of horticulture trees and land requirement 3
Table-8.3: Cost of Plantation 3
Table-8.4: Cost for Horticulture Development 4
Table-8.5: Summary of costs for horticulture development 4
Table-8.6: Revenue Generation by Fruit Trees 4
Table-8.7: Maturity Index/Indicators to assess the maturity of Self-Help
Groups
9
Table-8.8: Budget earmarked for implementation of plan for income
generating activities
9
Table-9.1: Break up of cost required for up-gradation of existing primary
schools
2
Table-9.2 List of villages for upgradation of primary schools 2
Table-9.3: Break up of cost required for construction of new primary
schools
3
Table-9.4: Details of scholarships 4
Table-9.5: Budget for up-gradation of PHSCs 5
Table-9.6: Budget for construction of new PHSCs 5
Table-9.7: Budget for construction of community toilets in study area
villages
6
Table-9.8: Cost for up-gradation of Government hospital 7
Table-9.9: Budget for implementation of Local Area Development Plan 7
Table-11.1: Cost for Implementing Social Management Plan 1

PANCHESHWAR MULTIPURPOSE PROJECT SIA Study Report
v
LIST OF FIGURES
Figure-1.1 Index Map of the Project 8
Figure-3.1 Demographic profile of the Study Area Villages 7
Figure-3.2 Caste profile of the Study Area Villages 11
Figure-3.3 Literacy Profile of the Study Area Villages 16
Figure-3.4 Occupational profile of main workers in Study Area Villages 21
Figure-4.1 Details of the Religious Affiliation of the PAFs 11
Figure-4.2 Marital Status of the Surveyed Population 19
Figure-4.3 Resident and Non-resident surveyed population 23
Figure-4.4 Places of migration 23
Figure-4.5 Reasons for migration among sample population 24
Figure-4.6 Caste Profile of surveyed PAFs 28
Figure-4.7 Source of Drinking Water amongst PAFs 40
Figure-4.8 Distance for Source of Drinking Water 40

PANCHESHWAR MULTIPURPOSE PROJECT SIA Study Report
vi
ABBREVIATIONS
ANM Auxiliary Nurse Midwife
ASI Archaeological Survey of India
CWC Central Water Commission
CEA Central Electricity Authority
CSMRS Central Soil and Materials Research Station
CWPRS Central Water and Power Research Station
DC District Collector
DM District Magistrate
DPR Detailed Project Report
EIA Environmental Impact Assessment
ESMP Environmental and Social Management Plan
HMG/N His Majesty's Government of Nepal
GPS Global Positioning System
GSI Geological Survey of India
IDA International Development Agency
IRA Impoverishment Risk Assessment
ITI Industrial Training Institute
JCWR Joint Committee on Water Resources - Joint Group of Experts
JGE Joint Group of Experts
LADP Local Area Development Plan
LHV Lady Health Visitor
M&E Monitoring and Evaluation
NGO Non-Governmental Organisation
PAF Project Affected Families
PDA Pancheshwar Development Authority
PDR Project Definition Report
PHC Primary Heath Centre
PHSC Primary Heath Sub-Centre
PMP Pancheshwar Multi-Purpose Project
RMP Rehabilitation Master Plan
R&R Rehabilitation and Resettlement
RoR Right of Records
SDM Sub-District Magistrate
SIA Social Impact Assessment

CHAPTER-1 INTRODUCTION

PANCHESHWAR MULTIPURPOSE PROJECT SIA Study Report
Chapter 1: Introduction Page 1
CHAPTER-1
INTRODUCTION
1.1 GENERAL
The Pancheshwar Multipurpose Project (PMP) has been envisaged on the
Mahakali River (known as Sarada in India) where the river forms the
international boundary between India and Nepal, dividing the Far Western
Development Region of Nepal from the Uttrakhand State in India. The main
dam at Pancheshwar is proposed across the Mahakali River, 2.5 km
downstream of the confluence of river Sarju with Mahakali River and, about 70
km upstream of the Tanakpur town (India).
It is a bi-national scheme, primarily aimed at energy production. In addition,
the Project aims to enhance the food grains production in both the countries
by providing additional irrigation resulting from the augmentation of dry
season flows. Due to moderation of flood peaks at reservoir(s), incidental
flood control benefits are also envisaged from the project.
View of Pancheshwar Dam Site

PANCHESHWAR MULTIPURPOSE PROJECT SIA Study Report
Chapter 1: Introduction Page 2
1.2 THE MAHAKALI TREATY-1996
Recognizing that the Mahakali River is a boundary river on major stretches
between the two countries, a treaty (known as the “Mahakali Treaty”) was
signed on February 12, 1996 between His Majesty’s Government of Nepal and
the Government of India concerning the integrated development of the
Mahakali River including Sarada Barrage, Tanakpur Barrage and
Pancheshwar Project. The center-piece of the treaty was “Pancheshwar
Multipurpose Project” which both sides agreed to implement in accordance
with the Detailed Project Report jointly prepared by them.
The main principles enshrined in the Treaty, on which the Pancheshwar
Multipurpose Project is to be designed and implemented, are summarized as
under:
Both Parties have equal entitlement in the utilization of the waters of the
Mahakali River without prejudice to their respective existing
consumptive uses of the waters of the Mahakali River.
Water requirements of Nepal shall be given prime consideration in
utilization of the waters of the Mahakali River. Both the parties shall be
entitled to draw their share of waters of the Mahakali River from the
Tanakpur Barrage and/or other mutually agreed points.
The Project shall be designed to produce the maximum total net
benefit. All benefits accruing to both the Parties with the development
of the Project in the forms of power, irrigation, flood control etc., shall be
assessed.
The P roject shall be implemented as an integrated project including
power stations of equal capacity on each side of the Mahakali River
and the total energy generated shall be shared equally between the
Parties.
Cost of the project shall be borne by the parties in proportion to the
benefits accruing to them. Both the Parties shall jointly endeavour to
mobilize the finance required for the implementation of the Project.
A portion of Nepal’s share of energy shall be sold to India. The
quantum of such energy and its price shall be mutually agreed upon
between the Parties.
Further, in the letters dated 12 February, 1996 exchanged by the two
Governments along with the Mahakali Treaty, the principles for assessment of
project benefits during the preparation of the Detailed Project Report of the
Project are also deliberated as under:
Net power benefit shall be assessed on the basis of, inter alia, saving

PANCHESHWAR MULTIPURPOSE PROJECT SIA Study Report
Chapter 1: Introduction Page 3
in costs to the beneficiaries as compared with the relevant alternatives
available,
Irrigation benefit shall be assessed on the basis of incremental and
additional benefits due to augmentation of river flow, and
Flood control benefit shall be assessed on the basis of the value of
works saved and damaged avoided (to both sides of the river).
Besides the above, Nepal is entitled to draw 1000 cusec of water in
monsoon season and 150 cusec in the dry season from Sarada Barrage
(through its irrigation canal) at Banbasa under Article-1 of the Treaty. This
water drawn from Banbasa barrage provides irrigation to a command area of
11,600 ha; known as Mahakali Irrigation Project (stage-I & II) in Nepal. In
addition, another 1000 cusec of Mahakali water in the wet season and 300
cusec of water in the dry season has been committed under Article-2 of the
Treaty from the Tanakpur Barrage.
Under Article-1 (2) of the Treaty, it was further agreed that India shall maintain
a flow of not less than 10 m3/s (350 cusecs), downstream of the Sarada
Barrage, into the Mahakali River, to maintain and preserve the river eco-
system.
Further, the local communities living along both sides of the Mahakali River
shall be entitled to use of the waters of the Mahakali River, not exceeding five
(5) percent of the average Annual flow at Pancheshwar under Article-7 of the
Treaty.
The Pancheshwar DPR has been prepared keeping the above guiding
principles in consideration and the benefits from the Project which are likely to
be accrued to each Party, are assessed clearly in accordance with the letters
dated 12.02.1996 exchanged by the two Governments along with the Mahakali
Treaty.
1.3 PANCHESHWAR DEVELOPMENT AUTHORITY
Pursuant to the Article-10 of the Mahakali Treaty, it was agreed that, both the
Parties may form project specific joint entity for the development, execution
and operation of new projects including Pancheshwar Multipurpose Project in
the Mahakali River for their mutual benefit. Accordingly, at the 3rd meeting of
the Joint Committee on Water Resources (JCWR) headed by the water
resources secretaries of India and Nepal, held in November 2009, it was
decided to set up the Pancheshwar Development Authority, an independent
autonomous body, to finalize the Pancheshwar Detailed Project Report and

PANCHESHWAR MULTIPURPOSE PROJECT SIA Study Report
Chapter 1: Introduction Page 4
expedite the implementation of the Project.
The Authority was set up in August 2014, having two Co-Chairpersons, one
from each side, and twelve Members (six Members from each side), which
would be working as a Governing Body of the Authority. Among others, the
Ambassadors of Nepal to India and India to Nepal shall be permanent invitees
at the meeting of the Governing Body. The Composition of Governing Body of
Pancheshwar Development Authority (PDA) is given in Table-1.1.
Table-1.1: Composition of Governing Body of PDA
Indian side Nepalese side
1. Secretary , MOWR, GOI Co-Chairman Secretary, MoEn, GON
2. Secretary/ Joint Secretary
(Hydro), MOP
Member Joint Secretary, MoEn
3. Joint Secretary (North), MEA Member Joint Secretary, Ministry of
Foreign Affairs
4. Commissioner (Ganga),
MOWR
Member Director General,
Department of Electricity
Development
5. JS & FA, MOWR Member Joint Secretary, Ministry of
Finance
6. Principal Secretary (Energy),
Govt. of Uttarakhand
Member Director General,
Department of Irrigation
7. Chief Executive Officer/
Additional Chief Executive
Officer, PDA
Member
Secretary/ Joint
Secretary
Chief Executive Officer/
Additional Chief Executive
Officer, PDA
8. Ambassador of India to
Nepal
Special Invitee Ambassador of Nepal to
India
9. Chairman, Central Water
Commission
Special Invitee
10. Principal Advisor (WR),
Planning Commission
Special Invitee Joint Secretary, Water and
Energy Commission
11. Principal Secretary/
Secretary (WR), Govt. of UP
Special Invitee Managing Director, NEA
Source: DPR
1.4 HISTORY OF THE PROJECT
The Pancheshwar dam site was first identified during the hydroelectric survey
of potential sites on the Mahakali River conducted by the erstwhile Central
Water and Power Commission of India in 1956. A storage type development for
power generation was envisaged at that time.

PANCHESHWAR MULTIPURPOSE PROJECT SIA Study Report
Chapter 1: Introduction Page 5
In the year 1962, State Government of Uttar Pradesh carried out preliminary
field investigations with the assistance of the Survey of India and Geological
Survey of India. Based upon the field investigations carried out and data
collected by U.P. Irrigation Department, a project report of the scheme was
prepared by WAPCOS INDIA LIMITED in November 1971. The report
suggested a concrete gravity dam with a crest at an elevation 638 m a s l or a
height from the river bed of about 232 m.
In order to develop the feasibility study of the scheme and to decide about
further investigations to be carried out, a Joint Group of Experts (JGE) of India
and Nepal was constituted in the year 1978. Detailed investigations on Indian
side to formulate the scheme were initiated by Central Water Commission
(India) in July, 1981.
During the 3rd JGE meeting held in April, 1984, it was decided that the
feasibility report would be prepared jointly but the investigations required for the
study be carried out independently by India and Nepal in their respective
territories. The Nepal side appointed consultants with the financial assistance
of the International Development Agency (IDA) to carry out field investigation
works at feasibility level. On the Indian side these investigations were carried
out by Central Water Commission (CWC) with the help of Survey of India,
Geological Survey of India (GSI), Central Electricity Authority (CEA), Central
Soil and Materials Research Station (CSMRS), New Delhi and Central Water
and Power Research Station (CWPRS), Pune.
During 5th meeting of the Joint Group of Experts (JGE) held in March, 1991,
field data collected by both sides were exchanged and data gaps were
identified. It was decided to prepare and finalize a mutually acceptable Project
Definition Report (PDR) to outline the project parameters. Based on the data
collected by both sides, draft Project Definition Report(s) identifying the basic
characteristics of the project, its preliminary benefits and costs was prepared
by both India and Nepal independently and made available to either side for
further discussions.
During the goodwill visit of the Nepalese Prime Minister to India in December
1991, an understanding was reached between the two Countries to prepare a
Joint Detailed Project Report, at Feasibility level.
The 6th meeting of Joint Group of Experts of India and Nepal (JGE) on
Pancheshwar Multipurpose Project was held in February 1992 to discuss the
data gaps in field investigations and modalities for preparation of the Detailed
Project Report. An action plan was drawn and the work of preparation of

PANCHESHWAR MULTIPURPOSE PROJECT SIA Study Report
Chapter 1: Introduction Page 6
Detailed Project Report was assigned by distributing the subject chapters
between the two sides. The additional field investigations that were identified in
the 6th meeting of JGE were completed in December 1993. These field
investigations comprised mainly of topographical surveys, geological
explorations, seismological studies, in-situ rock tests, construction material
surveys, etc. The Indian side completed the assigned chapters and sent to His
Majesty's Government of Nepal (HMG/N) in 1994 for review. Based on the
information contained therein, a draft Detailed Project Report (DPR) was
prepared by HMG/N in 1995 and forwarded to Government of India in July/
August 1996 for their comments. After examination of the draft DPR, three
meetings of Joint Group of Experts followed by two meetings at the level of
Technical officials were held and the contents thereof were discussed to arrive
at a mutually agreed solution.
In the 11th JGE meeting held in March 1999, it was agreed in principle to
establish a Joint Project Office - Pancheshwar Investigation (JOP-PI) at
Kathmandu along with Field Offices, as required, to conduct additional field
investigations for the Re-regulating dam and studies for preparation of Detailed
Project Report jointly. Accordingly, the JPO-PI was established at Kathmandu
in December 1999. The Division office at Tanakpur and three sub-division
offices viz. at Pancheshwar for main dam, at Tamli for Rupaligad site and at
Thuligad for Purnagiri site were established in May 2000. The personnel from
both India and Nepal were deployed to conduct additional field investigations
and studies for preparation of Detailed Project Report jointly.
Due to submergence of Rangun khola valley in Nepal, the Govt. of Nepal did
not agree to locate the re-regulating dam at Purnagiri site and insisted to
construct the regulating dam at Rupaligad only to store the Pancheshwar
powerhouses’ releases during peak hours and release them from Rupaligad
round the clock, to meet the irrigation water requirement downstream. To
resolve the issue pending for last more than ten years, the Indian side agreed
to the Nepalese request to locate the re-regulating dam at Rupaligad site in the
3rd meeting of the Joint Committee on Water Resources (JCWR) held in
November, 2009 at Pokhara (Nepal).

PANCHESHWAR MULTIPURPOSE PROJECT SIA Study Report
Chapter 1: Introduction Page 7
Rupaligad dam site- downstream axis
1.5 PROJECT LOCATION
The Pancheshwar main dam site is proposed about 2.5 km downstream of the
confluence of Sarju with the Mahakali River, a primary tributary of the
Mahakali from India. Here, the Mahakali river flows in a narrow V -shaped
gorge, flanked by 45 degree slopes rising more than 1,000 m above the river
bed. A re-regulating dam is proposed downstream of main dam to even out
peaking out flows from Pancheshwar power houses for meeting irrigation water
requirement and to exploit hydro potential of the basin below Pancheshwar. For
this purpose, two alternative locations were identified; one at Rupaligad, 25 Km
downstream of main dam and other at Purnagiri, 61 Km downstream main
dam. Finally, the Rupaligad site has been selected for re-regulating dam.

PANCHESHWAR MULTIPURPOSE PROJECT SIA Study Report
Chapter 1: Introduction Page 8
An Index Map showing location of main dam and re-regulating dam is
presented in the Figure-1.1.
Figure-1.1: Index Map of the Project
The project structures, including the reservoir area, lie in Champawat,
Pithoragarh, Bageshwar and Almora districts of Uttaranchal state in India and
in Baitadi and Dharchula districts of Far Western Development Region in
Nepal. The entire area directly covered by the project structures and the
proposed reservoir is located between 29°25'0" and 29°47'30" latitude N and
79°55'0" and 80°35'0" longitude E.
1.6 MAHAKALI RIVER BASIN
The Mahakali River originates from the Lipulekh glacier at an elevation of about
7,820 m in the Himalayas. The river flows steeply through a complex sequence

PANCHESHWAR MULTIPURPOSE PROJECT SIA Study Report
Chapter 1: Introduction Page 9
of sedimentary and metamorphic rocks of the High and Inner Himalayan
physiographic provinces and then passes through the Lower Himalayan
province (Mahabharat and Siwalik ranges) before emerging onto the Gangetic
plain in the Terai region.
The Mahakali (Sarada) basin up to the Pancheshwar dam site has a total
catchment area of 12,276 km2, located between 29°20'30" and 30°35'30"
latitude N and 79°20'30" and 81°9'45" longitude E. Out of the total catchment,
an area of 9,720 km2 of the river catchment lies in India, and 4,456 km2 in
Nepal.
During its course, the river carries the flows from several major tributaries
including the Dhauli Ganga (catchment 1357 km2), Gori Ganga (catchment
2300 km2) and Sarju (catchment 4019 km2) from India and the Chamaliya
(catchment:1572 km2) from Nepal. Other minor tributaries joining the Mahakali
River below Pancheshwar dam site are Lohawati & Ladhiya Rivers from India
and Surnayagad, Rupaligad, Sirsegad & Ragun Khola from Nepal before the
river emerges onto the Gangetic plains below the Purnagiri temple near
Tanakpur town. The total drainage area up to Purnagiri temple has been
worked out to be around 14,922 sq km, out of which 10,884 sq km area lies in
India and 4,038 sq km area in Nepal.
The upper reaches of the Mahakali River and of its various tributaries are
characterized by very steep drops. For instance in the first 100 km reach, the
river drops over 4900 m. In its middle and lower reaches it flows through
relatively gentle gradients providing favorable terrain for storage projects.
1.7 ACCESS
At present, the only access by road to the project area is through India. The all
weather 40 km long road from Lohaghat to the Mahakali River at Pancheshwar
was constructed by the State Public Works Department in 1971 to facilitate the
field investigations of the dam project taken up by the Indian side.
It is proposed to use the existing Tanakpur – Lohaghat - Pancheshwar road
(about 130 km) as the main access through India, for the pre- construction
activities of the project. The last portion of this road, approaching the actual
dam site that would eventually be submerged by the reservoir would be
suitably relocated according to the requirement of the permanent project
structures and of the construction planning.
At present, access to the site from Nepal is possible only by helicopter or by a

PANCHESHWAR MULTIPURPOSE PROJECT SIA Study Report
Chapter 1: Introduction Page 10
two-day, 60 km trek from the Patan village. The only existing vehicular access
to the far western development region of Nepal from the rest of the country is
the East - West Highway. The Dhanghari - Dadeldhura - Patan - Baitadi feeder
road, connects the project area to the East- West highway.
In order to gain access through Nepal for the transportation of construction
equipment, machinery, materials, etc. for the project; and for transport of
generating equipment to the Pancheshwar and Rupaligad Re-regulating dam
sites, a new road from Brahmdev to Pancheshwar along the left bank of
Mahakali River has been envisaged and detailed field investigations including
cost estimates have been undertaken by the Project Authority.
1.8 PROJECT FEATURES
As presently conceived, the project includes the following main structures:
A main rock fill dam at Pancheshwar, 315 m high from the deepest
foundation level, forming about 80 km long reservoir, with a surface area
of 116 km2 and a total gross storage volume of about 11.35 billion m3;
Spillway on the left bank (Nepal side of the river), designed to safely
discharge the estimated maximum river flow;
Two underground powerhouses, one on each bank, having a total
installed capacity of 4800 MW (2400 MW capacity on each bank);
A re-regulating dam downstream at Rupaligad site to even-out main dam
releases to achieve continuous river flow conditions;
Two Underground power houses at re-regulating dam having a total
installed capacity of 120 MW each.
The project will generate a total of 7678 GWh dependable power every
year at main dam complex; that will meet a substantial part of the energy
and peak power demand of the Northern India. The project would also
simultaneously cover the medium and long term energy requirements of
Nepal. In addition, 1438 GWh of dependable power would be generated
annually at Rupaligad dam power stations.
At the same time, the project will regulate the natural river flow, allowing
the year round irrigation of agricultural land in the Kanchanpur District in
Nepal, and meeting the existing and future water requirements of the
Indian irrigation systems. It is expected that an additional irrigation
potential of 1.70 lakh hactare in Nepal and 2.59 lakh hactare in the
Indian side would be created with augmented river flows in the post-
Pancheshwar scenario.

PANCHESHWAR MULTIPURPOSE PROJECT SIA Study Report
Chapter 1: Introduction Page 11
In addition, the project will have an incidental flood mitigation effect, reducing
risk of flooding along the lower course of the Mahakali (Sarada) river, both in
the Nepalese and Indian territories. It is expected to protect low lying areas in
Chandani-Dodhara villages along the west bank of Mahakali River in Nepal.
Further, around 10,000 hactare of area of district Pilibhit and 90,000 hactare in
the district Lakhimpur Kheri in Uttar Pradesh (India) are inundated almost every
five years in the Sarada basin due to floods in a stretch of 60 km of the river
which would get protection from floods of 25 years frequency, in the post-
Pancheshwar scenario.
1.9 OUTLINE OF THE REPORT
The document for the Comprehensive EIA study for the proposed Pancheshwar
Multipurpose project has been presented in three volumes as listed below:
Volume-I: Environmental Impact Assessment (EIA) study Report
Volume-II: Social Impact Assessment Study (SIA) Report
Volume-III: delineates the Environmental Management Plan.
The present document (Volume-II) Social Impact Assessment Study for the
proposed Pancheshwar Multipurpose project and the contents of the document
are organized as follows:
Chapter-1 describes the Pancheshwar Multipurpose Project along with its
history and present proposal.
Chapter-2 gives assessment of Project Affected Families and Project Affected
Villages and methodology adopted for enumeration.
Chapter-3 outlines the Baseline Status of Socio-Economic aspects of the
Project Affected Villages of Pancheshwar Multipurpose Project.
Chapter-4 presents Socio-Economic data analysis of the Surveyed Population
in the Project Affected Villages.
Chapter-5 elucidates the data analysis of the Property Survey of Project
Affected Villages.
Chapter-6 presents the Social Impact Assessment due to proposed
Pancheshwar Multipurpose project.

PANCHESHWAR MULTIPURPOSE PROJECT SIA Study Report
Chapter 1: Introduction Page 12
Chapter-7 presents the Rehabilitation and Resettlement Plan for PAFs due to
the proposed Pancheshwar Multipurpose project.
Chapter-8 outlines the livelihood plan for the Project Affected Families
Chapter-9 outlines the proposed Local Area Development Plan for project area
and its surrounding villages.
Chapter-10 describes the Monitoring and Evaluation aspects for the R&R and
LADP measures.
Chapter-11 elucidates the Cost Estimates for implementation of R&R and
LADP measures along with ESMP.

CHAPTER-2 ASSESSMENT OF PROJECT AFFECTED
VILLAGES AND FAMILIES

PANCHESHWAR MULTIPURPOSE PROJECT SIA Study Report
Chapter 2: Assessment of Project Affected Villages and Families Page 1
CHAPTER – 2
ASSESSMENT OF PROJECT AFFECTED VILLAGES AND FAMILIES
2.1 METHODOLOGY ADOPTED FOR ENYMERATION
The purpose of enumeration of affected properties and project affected families,
both secondary as well as primary sources of information was used. A
preliminary list of probable affected villages was prepared using submergence
area maps and Administrative Atlas for Uttarakhand, which was subsequently
verified and updated with the help of revenue officials. The khasra maps
collected from the Revenue Department were scanned and superimposed on
the project area/ submergence area map to delineate the affected/ impacted
zone. These maps were extensively used to delineate the plots or parcels of
land likely to be affected due to the process of land acquisition. A list of such
plots was prepared to correlate with ownership details through the RoRs.
2.2 IDENTIFICATION OF PROJECT AFFECTED VILLAGES
A total of 134 villages will be affected, of which 123 villages are affected in the
Pancheshwar MPDP (Refer Table-2.1) and 11 villages in the Rupaligad RDP
(Refer Table).
Table-2.1: List of affected villages of Pancheshwar MPP
S. No. Village Name Tehsil District Status
1 Nishani Pithoragarh Pithoragarh Partially Affected
2 Gogana Pithoragarh Pithoragarh Partially Affected
3 Rarikhuti Pithoragarh Pithoragarh Partially Affected
4 Jamrari Pithoragarh Pithoragarh Partially Affected
5 Kharku Bhalya Pithoragarh Pithoragarh Fully Affected
6 Matyal/Matyal Chakawali Pithoragarh Pithoragarh Fully Affected
7 Bhalya Pithoragarh Pithoragarh Fully Affected
8 Upertola Pithoragarh Pithoragarh Partially Affected
9 Pati Palchura Pithoragarh Pithoragarh Partially Affected
10 Salla Pithoragarh Pithoragarh Partially Affected
11 Sail Pithoragarh Pithoragarh Partially Affected
12 Tameria Pithoragarh Pithoragarh Partially Affected
13 Haldu Pithoragarh Pithoragarh Fully Affected
14 Kwerali Pithoragarh Pithoragarh Partially Affected
15 Sakun Pithoragarh Pithoragarh Partially Affected
16 Dhyan Pithoragarh Pithoragarh Partially Affected
17 Kuteri Pithoragarh Pithoragarh Partially Affected

PANCHESHWAR MULTIPURPOSE PROJECT SIA Study Report
Chapter 2: Assessment of Project Affected Villages and Families Page 2
S. No. Village Name Tehsil District Status
18 Tarigaon Pithoragarh Pithoragarh Partially Affected
19 Gyal Pipali Pithoragarh Pithoragarh Partially Affected
20 Baunakot Pithoragarh Pithoragarh Partially Affected
21 Basaur Mainan Pithoragarh Pithoragarh Partially Affected
22 Baltari Pithoragarh Pithoragarh Fully Affected
23 Gaurihat Pithoragarh Pithoragarh Partially Affected
24 Rajyoura Pithoragarh Pithoragarh Partially Affected
25 Kanari Pithoragarh Pithoragarh Fully Affected
26 Majirkanda Pithoragarh Pithoragarh Partially Affected
27 Getigada Gangolihat Pithoragarh Partially Affected
28 Bateri Pithoragarh Pithoragarh Partially Affected
29 Amtari Kanalichina Pithoragarh Fully Affected
30 Ranuwa Kanalichina Pithoragarh Fully Affected
31 Bathauli Kanalichina Pithoragarh Fully Affected
32 Dyora Kanalichina Pithoragarh Partially Affected
33 Sunkholi Kanalichina Pithoragarh Fully Affected
34 Pantsera Kanalichina Pithoragarh Partially Affected
35 Syuwan Kanalichina Pithoragarh Partially Affected
36 Dwali Sera Kanalichina Pithoragarh Partially Affected
37 Ghigharani Didihat Pithoragarh Fully Affected
38 Sailoni Didihat Pithoragarh Partially Affected
39 Chamtoli Didihat Pithoragarh Fully Affected
40 Titri Didihat Pithoragarh Fully Affected
41 Bagadihat Didihat Pithoragarh Partially Affected
42 Bheliya Didihat Pithoragarh Partially Affected
43 Jogyoura Didihat Pithoragarh Fully Affected
44 Garjiya Didihat Pithoragarh Partially Affected
45 Jamtari Didihat Pithoragarh Partially Affected
46 Oltari Didihat Pithoragarh Partially Affected
47 Daulani Kanalichina Pithoragarh Partially Affected
48 Toli* Pithoragarh Pithoragarh Partially Affected
49 Tham Dharchula Pithoragarh Partially Affected
50 Duti Bagarh Dharchula Pithoragarh Partially Affected
51 Dungatoli Dharchula Pithoragarh Partially Affected
52 Kimkhola Dharchula Pithoragarh Partially Affected
53 Bokata Gangolihat Pithoragarh Partially Affected
54 Bungli Gangolihat Pithoragarh Partially Affected
55 Bursum Bari Gangolihat Pithoragarh Partially Affected
56 Dhandadhar Gangolihat Pithoragarh Partially Affected
57 Dubola-Birtola Gangolihat Pithoragarh Partially Affected
58 Kuinar* Gangolihat Pithoragarh Partially Affected
59 Kuntola Gangolihat Pithoragarh Partially Affected
60 Tudli Gangolihat Pithoragarh Partially Affected

PANCHESHWAR MULTIPURPOSE PROJECT SIA Study Report
Chapter 2: Assessment of Project Affected Villages and Families Page 3
S. No. Village Name Tehsil District Status
61 Nali Gangolihat Pithoragarh Partially Affected
62 Seraghara Gangolihat Pithoragarh Fully Affected
63 Sinoli Bhamalta Gangolihat Pithoragarh Partially Affected
64 Jatrola Gangolihat Pithoragarh Fully Affected
65 Rasyun Gangolihat Pithoragarh Partially Affected
66 Kharkholi Gangolihat Pithoragarh Partially Affected
67 Askora Gangolihat Pithoragarh Partially Affected
68 Pali Gangolihat Pithoragarh Partially Affected
69 Raitoli Gangolihat Pithoragarh Partially Affected
70 Rautora Gangolihat Pithoragarh Partially Affected
71 Timta Chamdungra Gangolihat Pithoragarh Partially Affected
72 Damde* Gangolihat Pithoragarh Partially Affected
73 Duni Gangolihat Pithoragarh Partially Affected
74 Chaur Ghurelli Gangolihat Pithoragarh Partially Affected
75 Tulkand* Gangolihat Pithoragarh Partially Affected
76 Sibana Gangolihat Pithoragarh Partially Affected
77 Sugari* Gangolihat Pithoragarh Partially Affected
78 Busail Gangolihat Pithoragarh Partially Affected
79 Garali Gangolihat Pithoragarh Partially Affected
80 Anwala Talla Mall Sugar
Mavla
Gangolihat Pithoragarh Partially Affected
81 Sauli Gangolihat Pithoragarh Partially Affected
82 Dhajari Gangolihat Pithoragarh Partially Affected
83 Diyuri Gangolihat Pithoragarh Partially Affected
84 Suwal Gangolihat Pithoragarh Partially Affected
85 Tallisar Pithoragarh Pithoragarh Partially Affected
86 Khatigaon Pithoragarh Pithoragarh Partially Affected
87 Garali Pithoragarh Pithoragarh Partially Affected
88 Nali Malli Almora Almora Partially Affected
89 Kunj Kimola Almora Almora Partially Affected
90 Umer Almora Almora Partially Affected
91 Bamouri Khalsa / Bamori Almora Almora Fully Affected
92 Ara Salpar Bhanoli Almora Partially Affected
93 Kola/Kaula Bhanoli Almora Fully Affected
94 Mayoli Bhanoli Almora Partially Affected
95 Deol Siri Bhanoli Almora Partially Affected
96 Dasoli Badiyar Bhanoli Almora Partially Affected
97 Kana Pokhari Bhanoli Almora Partially Affected
98 Uncha Bauragunth Bhanoli Almora Fully Affected
99 Bali Khet Bhanoli Almora Partially Affected
100 Nali Talli Almora Almora Partially Affected
101 Dhura Laga Taak Bhanoli Almora Fully Affected
102 Birkhola Bhanoli Almora Partially Affected

PANCHESHWAR MULTIPURPOSE PROJECT SIA Study Report
Chapter 2: Assessment of Project Affected Villages and Families Page 4
S. No. Village Name Tehsil District Status
103 Dhankana Bhanoli Almora Partially Affected
104 Melta* Almora Almora Partially Affected
105 Nayal Dhura Rangol Almora Partially Affected
106 Padoli Almora Almora Partially Affected
107 Jingal Almora Almora Partially Affected
108 Chimkholi Bhanoli Almora Partially Affected
109 Betta Lohaghat Champawat Partially Affected
110 Sulan Barakot Champawat Partially Affected
111 Netra Barakot Champawat Fully Affected
112 Sugar Khal Barakot Champawat Partially Affected
113 Batauri Mug Gunth Barakot Champawat Partially Affected
114 Kothere Barakot Champawat Partially Affected
115 Singda Barakot Champawat Partially Affected
116 Bruyuri Barakot Champawat Partially Affected
117 Gaika Jyula Barakot Champawat Partially Affected
118 Khai Kot Talla Lohaghat Champawat Partially Affected
119 Bibli Lohaghat Champawat Partially Affected
120 Simalkhet Pati Champawat Fully Affected
121 Khai Kot Malla Lohaghat Champawat Partially Affected
122 Choolgaon Barakot Champawat Partially Affected
123 Raygaon Barakot Champawat Partially Affected
Note: * = As per revenue records and field investigation, no private land or private
properties are likely to be acquired/ impacted in villages Toli, Kuinar, Damde,
Tulkhand and Sugari in district Pithoragarh and village Melta in district Almora; thus
there are no PAFs losing land or homesteads from these villages. However,
government land and/or forest land is impacted.
Table-2.2: List of affected villages of Rupaligad RDP
S. No. Village Name Tehsil District Status
1 Bachkot Champawat Champawat Partially Affected
2 Polap Champawat Champawat Partially Affected
3 Nidil Lohaghat Champawat Partially Affected
4 Jindi Sorari Lohaghat Champawat Partially Affected
5 Bhagauti Lohaghat Champawat Partially Affected
6 Dungraleti Lohaghat Champawat Partially Affected
7 Pasam Lohaghat Champawat Partially Affected
8 Ashlad Lohaghat Champawat Partially Affected
9 Jamarso Lohaghat Champawat Partially Affected
10 Matiyali Lohaghat Champawat Partially Affected
11 Chilniya Pati Champawat Partially Affected

PANCHESHWAR MULTIPURPOSE PROJECT SIA Study Report
Chapter 2: Assessment of Project Affected Villages and Families Page 5
2.3 ACQUISITION OF PRIVATE LAND
The details of ownership status of land to be acquired on Indian portion is given
in Tables-2.3 to 2.6.
Table-2.3 Ownership status of land to be acquired for various project
appurtenance on Indian portion
Category Area (ha)
Private 3735.80 (Refer Tables-2.4 to 2.7)
Forest 2422.50
Government 2941.70
Total 9100.00 ha
Source: Revenue, Forest Department and Property Survey
Table-2.4: Details of land to be acquired for the project
S. No. Parameter Total Private Land Acquired (ha)
1 Pancheshwar Fully Affected Villages 463.81
2 Pancheshwar Partially Affected Villages 3227.83
3 Rupalgadi Partially Affected Villages 44.16
Total 3735.8
Source: Property Survey
Table-2.5: Details of private land to be acquired in Fully Affected Villages of Pancheshwar Dam
S. No. Village Name Acquired land (m2)
1 Khadku bhaalya 26.5540
2 Matyal/ matyal chakawali 14.5920
3 Bhalya 19.2845
4 Haldu 41.8962
5 Baltari 43.5132
6 Kanari 3.8598
7 Amtari 23.9930
8 Renuwa 22.9684
9 Bathauli 6.9370
10 Sunkholi 12.1660
11 Ghigharani 26.2500
12 Chamtoli 26.3950
13 Titri 53.7840
14 Jogyoura 23.4340
15 Seraghat 9.1224
16 Jartola 24.9480
17 Aara salpar 32.3184
18 Kunj kimola 3.9258
19 Uncha bera 9.3022

PANCHESHWAR MULTIPURPOSE PROJECT SIA Study Report
Chapter 2: Assessment of Project Affected Villages and Families Page 6
S. No. Village Name Acquired land (m2)
20 Dhura laga taak 16.2622
21 Netra 13.0260
22 Simalkhet 9.2781
Total Land 463.8100
Source: Revenue Department and Property Survey
Table-2.6: Details of private land to be acquired in Partially Affected Villages of Pancheshwar Dam
S. No. Village Name Acquired land (m2)
1 Nisni 2.70700
2 Gogana 11.70190
3 Rarikhuti 29.10300
4 Jamrari 11.23895
5 Upertola 21.57800
6 Pati Palchaura 3.68087
7 Salla 17.93499
8 Sail 11.65500
9 Taremia 49.79410
10 Kwerali 1.61048
11 Sakun 16.43890
12 Dhyan 0.65000
13 Kuteri 7.52500
14 Tarigaon 23.99300
15 Gyal Pipli 4.32000
16 Baunkot 4.83700
17 Basaur manain 8.45000
18 Gaurihat 4.31012
19 Rajyoura 6.53700
20 Majirakanda 1279.21245
21 Getigada 24.21205
22 Bhateri 0.02800
23 Dyora 40.12150
24 Panthsera 30.19686
25 Syuwan 1.86341
26 Dwalishera 35.40190
27 Sailoni 23.07000
28 Bagadihat 25.80360
29 Bheliya 0.96900
30 Garjiya 18.82800
31 Jamtari 2.39600
32 Oltari 9.66610
33 Daulani 2.26700
34 Toli NO PRIVATE LAND ACQUISTION
35 Thaam 0.68930
36 Duti bagar 12.96164
37 Dungatoli 7.12600
38 Kimkhola 23.37380
39 Bokata 7.79715

PANCHESHWAR MULTIPURPOSE PROJECT SIA Study Report
Chapter 2: Assessment of Project Affected Villages and Families Page 7
S. No. Village Name Acquired land (m2)
40 Bungli 4.96858
41 Bursum bari 3.46960
42 Dandadhar 9.13900
43 Dubola birtola 17.68800
44 Kuinar NO PRIVATE LAND ACQUISTION
45 Kuntola 9.81378
46 Tudli 2.77841
47 Nali 4.62185
48 Sinloi bhamalta 2.21400
49 Rasyun 8.06651
50 Kharkoli 7.71901
51 Askora 1.64178
52 Pali 1.73099
53 Raitoli 6.69492
54 Rautora 1.79600
55 Timta chamdungra 0.92600
56 Damde NO PRIVATE LAND ACQUISTION
57 Duni NO PRIVATE LAND ACQUISTION
58 Dhaur ghurelli 2.21981
59 Tulkhand NO PRIVATE LAND ACQUISTION
60 Sibna 3.01000
61 Sugari NO PRIVATE LAND ACQUISTION
62 Busail NO PRIVATE LAND ACQUISTION
63 Garali 0.73017
64 Anwala talla malla sugar mavla 0.60900
65 Sauli NO PRIVATE LAND ACQUISTION
66 Dhajari 0.56527
67 Diyuri 1.31004
68 Suwal 6.17675
69 Tallisar 9.42734
70 Khatigaon 2.57600
71 Garali 3.09900
72 Nalli malli 23.24242
73 Umer 989.40000
74 Bamori 12.75400
75 Kola 10.06800
76 Mayoli 1.40300
77 Deolisiri 3.14435
78 Dasoli badiyar 25.79314
79 Kuna pokhri 3.26800
80 Balikhet 24.13736
81 Talli nalli 15.30020

PANCHESHWAR MULTIPURPOSE PROJECT SIA Study Report
Chapter 2: Assessment of Project Affected Villages and Families Page 8
S. No. Village Name Acquired land (m2)
82 Birkola 2.28664
83 Dhankana 5.89859
84 Melta NO PRIVATE LAND ACQUISTION
85 Nayal dhura 13.67211
86 Padoli 3.75900
87 Jingal 7.54119
88 Dhimkholi 10.69234
89 Betta 5.18200
90 Sulan 15.79300
91 Sugarkhal 9.71168
92 Botari mug gunth 37.46900
93 Kuthera 13.33462
94 Singra 0.36800
95 Bruyuri 0.44730
96 Gaika jhula 1.24900
97 Khaikot talla 10.39290
98 Vivel 51.22802
99 Khaikhot malla 17.95193
100 Choolgaon 13.91700
101 Raygaon 1.38814
Total Land ha 3227.83381
Source: Revenue Department and Property Survey
Table-2.7: Details of private land to be acquired in Partially Affected Villages of
Rupalugad Dam
S. No. Village Name Acquired land (m2)
1 Bachkot 0.09
2 Polap 0.01
3 Nidil 17.27
4 Jindi sorari 6.67
5 Bagauti 1.47
6 Dungraleti 4.86
7 Pasam 6.65
8 Ashlad 0.99
9 Jamar sau 1.93
10 Matiyani 3.20
11 Chilniya 1.03
Total Land ha 44.16
Source: Revenue Department and Property Survey
2.4 ENUMERATION OF PAFS AFFECTED DUE TO LAND ACQUISITION
After the affected/ impacted zone was delineation on the superimposed khasra
maps, a list of all the affected khasra/ plot numbers within the impacted zone

PANCHESHWAR MULTIPURPOSE PROJECT SIA Study Report
Chapter 2: Assessment of Project Affected Villages and Families Page 9
was prepared. Thereafter, revenue records, viz., Right of Records (RoRs) were
collected for all the affected villages. The State of Uttarakhand has
computerized and uploaded RoRs on their website: www.devbhumi.uk.gov.in
which was collected and computerized for analysis. The RoRs provided
ownership details of land parcels within each affected village. The list of
affected land plots/ parcels was correlated with the RoRs to establish
ownership details of each affected land plots. Analysis of the RoRs lead to
enumeration of affected persons/ families/ land titleholders and information was
compiled to show PAFs likely to lose land only, land and homesteads and
homesteads only. The village-wise PAFs likely to lose land only, land and
homesteads and homesteads only for Pancheshwar MPP and Rupaligad RDP
are listed in Tables 2.8 and 2.9. The summary of number of PAFs likely to be
affected due to the project are given in Table-2.10.
Table-2.8: Village-wise list of PAFs losing Land Only, Land & Homestead and
Homestead for Pancheshwar MPP
S. No. District Name Village Name Land &
house
Only
Land
Total
1 Pithoragarh Nishani 17 29 46
2 Pithoragarh Gogana 49 868 917
3 Pithoragarh Rarikhunti 337 337
4 Pithoragarh Jamrari 12 311 323
5 Pithoragarh Kharku-Bhalya 30 180 210
6 Pithoragarh Matyal/ Matyal
Chakawali
49 74 123
7 Pithoragarh Bhalya 37 220 257
8 Pithoragarh Upertola 14 241 255
9 Pithoragarh Pati Palchura 96 96
10 Pithoragarh Salla 5 237 242
11 Pithoragarh Sail 184 184
12 Pithoragarh Tade Miya 74 327 401
13 Pithoragarh Haldu 20 504 524
14 Pithoragarh Kwerali 1 61 62
15 Pithoragarh Sakun 361 361
16 Pithoragarh Dhyan 41 41
17 Pithoragarh Kutheri 105 105
18 Pithoragarh Tarigaon 31 630 661
19 Pithoragarh Gyal Pipali 4 94 98
20 Pithoragarh Baunakot 5 126 131
21 Pithoragarh Basaur Mainan 270 270
22 Pithoragarh Baltari 50 703 753
23 Pithoragarh Gaurihat 220 220

PANCHESHWAR MULTIPURPOSE PROJECT SIA Study Report
Chapter 2: Assessment of Project Affected Villages and Families Page 10
S. No. District Name Village Name Land &
house
Only
Land
Total
24 Pithoragarh Rajyoura 10 169 179
25 Pithoragarh Kanari 40 35 75
26 Pithoragarh Majirkanda 85 1426 1511
27 Pithoragarh Getigara 20 410 430
28 Pithoragarh Bateri 5 5
29 Pithoragarh Amtari 25 226 251
30 Pithoragarh Renuwa 12 131 143
31 Pithoragarh Bathauli 16 16
32 Pithoragarh Dyora 36 107 143
33 Pithoragarh Sunkholi 6 43 49
34 Pithoragarh Panthsera 221 221
35 Pithoragarh Syuwan 21 21
36 Pithoragarh Dwalisera 77 65 142
37 Pithoragarh Ghigharani 19 112 131
38 Pithoragarh Sailoni 15 89 104
39 Pithoragarh Chamtoli 56 56
40 Pithoragarh Titri 53 123 176
41 Pithoragarh Bagadihat 26 176 202
42 Pithoragarh Bheliya 3 3
43 Pithoragarh Jogyoura 12 53 65
44 Pithoragarh Garjiya 253 253
45 Pithoragarh Jamtari 1 48 49
46 Pithoragarh Oltari 96 96
47 Pithoragarh Daulani 11 13 24
48 Pithoragarh Toli 1 1
49 Pithoragarh Tham 76 76
50 Pithoragarh Duti Bhagarh 549 549
51 Pithoragarh Dungatoli 7 109 116
52 Pithoragarh Kimkhola 13 55 68
53 Pithoragarh Bokata 551 551
54 Pithoragarh Bungli 4 280 284
55 Pithoragarh Bursum Bari 7 235 242
56 Pithoragarh Dhandadhar 2 153 155
57 Pithoragarh Dubola-Birtola 21 64 85
58 Pithoragarh Kuinar 1 1
59 Pithoragarh Kuntola 440 440
60 Pithoragarh Tudli 515 515
61 Pithoragarh Nali 261 261
62 Pithoragarh Seraghat 14 95 109
63 Pithoragarh Sinoli Bhamalta 9 72 81
64 Pithoragarh Jartola 19 113 132
65 Pithoragarh Rasyun 850 850

PANCHESHWAR MULTIPURPOSE PROJECT SIA Study Report
Chapter 2: Assessment of Project Affected Villages and Families Page 11
S. No. District Name Village Name Land &
house
Only
Land
Total
66 Pithoragarh Kharkoli 15 304 319
67 Pithoragarh Askora 30 311 341
68 Pithoragarh Pali 303 303
69 Pithoragarh Raitoli 25 1074 1099
70 Pithoragarh Raitora 61 61
71 Pithoragarh Timta
Chamdungra
8 48 56
72 Pithoragarh Damde 1 1
73 Pithoragarh Duni 1 1
74 Pithoragarh Chaurghurali 83 83
75 Pithoragarh Tulkhand 1 1
76 Pithoragarh Sibna 1 40 41
77 Pithoragarh Sugari 1 1
78 Pithoragarh Busial 435 435
79 Pithoragarh Garali 110 110
80 Pithoragarh Anwala Talla
Malla Sugar
Naula
47 47
81 Pithoragarh Dhajari 84 84
82 Pithoragarh Diyuri 105 105
83 Pithoragarh Suwal 104 104
84 Pithoragarh Tallisar 563 563
85 Pithoragarh Khetigaon 120 120
86 Pithoragarh Garali 174 174
87 Almora Malli Nalli 612 612
88 Almora Umer 85 85
89 Almora Bamori 23 248 271
90 Almora Aara Salpar 18 859 877
91 Almora Kola 87 87
92 Almora Kunj Kimola 320 320
93 Almora Mayoli 27 27
94 Almora Dwali Siddi 154 154
95 Almora Dasoli Badiyar 471 471
96 Almora Kuna Phokri 8 52 60
97 Almora Uncha Bera 471 471
98 Almora Balikhet 640 640
99 Almora Talli Nalli 462 462
100 Almora Dhura Laga Taak 431 431
101 Almora Birkola 193 193
102 Almora Dhankana 7 65 72
103 Almora Melta 1 1
104 Almora Nayal Dhura 31 245 276

PANCHESHWAR MULTIPURPOSE PROJECT SIA Study Report
Chapter 2: Assessment of Project Affected Villages and Families Page 12
S. No. District Name Village Name Land &
house
Only
Land
Total
105 Almora Padoli 30 30
106 Almora Jingal 3 529 532
107 Almora Chimkholi 181 181
108 Champawat Betta 6 49 55
109 Champawat Salan 15 71 86
110 Champawat Netra 51 165 216
111 Champawat Sugarkhal 336 336
112 Champawat Bautari 49 408 457
113 Champawat Kuthere 302 302
114 Champawat Singda 9 201 210
115 Champawat Bruyuri 13 14 27
116 Champawat Gaika Jula 6 46 52
117 Champawat Khai Kot Thall 127 127
118 Champawat Vivel 23 401 424
119 Champawat Simalkhet 494 494
120 Champawat Khai Kot Malla 315 315
121 Champawat Choolagaon 206 206
122 Champawat Raygaon 349 349
Total 1283 28153 29436
Source: Revenue Department and Property Survey
Table-2.9: Village wise list of Affected PAFs for Rupaligad RDP
S. No. District Name Village Name Land &
house
Only
Land
Total
1 Champawat Bachkot 16 16
2 Champawat Polap 26 26
3 Champawat Nidil 221 221
4 Champawat Jindi Sorari 361 361
5 Champawat Bagauti 3 3
6 Champawat Dungraleti 2 291 293
7 Champawat Pasam 11 152 163
8 Champawat Ashlad 17 17
9 Champawat Jamar Sau 158 158
10 Champawat Matiyani 153 153
11 Champawat Chilniya 12 164 176
Total 25 1562 1587
Source: Revenue Department and Property Survey

PANCHESHWAR MULTIPURPOSE PROJECT SIA Study Report
Chapter 2: Assessment of Project Affected Villages and Families Page 13
Table-2.10: Summary of PAFs in Pancheshwar MPP and Rupaligad RDP
S. No. Dam No. of
villages
PAFs
losing land
and houses
PAFs
losing only
land
Total PAFs
1. Pancheshwar
MPP
122 1283 28153 29436
2. Rupaligad RDP 12 25 1562 1587
Total 1308 29715 31023
Source: Revenue Department and Property Survey
It was assessed that in all there are 1308 affected persons/ families that are
likely to be displace/ evicted from their homesteads. Project-wise, there are
1283 PAFs from 59 villages and 25 PAFs from 3 villages in Pancheshwar
MPDP and Rupaligad RDP respectively.
In all there are 29715 land titleholders/ project affected persons/ families that
would lose their lands. This includes the PAFs from Pancheshwar MPDP and
Rupaligad RDP which reckons 28153 and 1562 respectively. It may be noted
that there are no families that are likely to be displaced from their homesteads
only and not lose their lands.

CHAPTER-3
ENVIRONMENTAL BASELINE STATUS-SOCIO-ECONOMIC ASPECTS

PANCHESHWAR MULTIPURPOSE PROJECT SIA Study Report
Chapter 3: Environmental Baseline Status-Socio-Economic Aspects Page 1
CHAPTER-3
ENVIRONMENTAL BASELINE STATUS-SOCIO-ECONOMIC ASPECTS
3.1 GENERAL
Before the start of any Environmental Impact Assessment study, it is necessary
to identify the baseline levels of relevant environmental parameters which are
likely to be affected as a result of the construction and operation of the
proposed project. The baseline study for Socio-Economic aspects has been
presented in this Chapter. The data presented in this chapter is mainly
extracted from Census of India 2011.
3.2 DEMOGRAHIC PROFILE OF VILLAGES
3.2.1 Population
As per 2011 Census the total population of the area is about 54488. The male
and female population in the villages is 48.2% and 51.8% respectively and
population below 6 years of age accounts for 15.0% of the total population. The
number of females per 1000 males is 1074 and average family (persons per
family) size is 5. The demographic details of are given in Table–3.1 and
depicted in Figure-3.1.
Table-3.1: Demographic Profile of Study Area villages
S. No. District Village
Name To
tal
Ho
us
eh
old
s
T
ota
l
Po
pu
lati
on
To
tal M
ale
Po
pu
lati
on
To
tal
Fem
ale
Po
pu
lati
on
Se
x R
ati
o
Av
era
ge
Fam
ily
Siz
e
Po
pu
lati
on
<
6 y
ea
rs
Se
x R
ati
o
PANCHESHWAR MPDP
1 Pithoragarh Nisani 154 711 364 347 953 5 108 742
2 Pithoragarh Gogana 321 1457 735 722 982 5 226 883
3 Pithoragarh
Rari
Khunti 36
175 89 86 966 5 27 588
4 Pithoragarh Jamrari 138 686 343 343 1000 5 116 966
5 Pithoragarh
Kharku
Bhalya 39
174 91 83 912 4 27 286
6 Pithoragarh Matiyal 41 186 103 83 806 5 28 867
7 Pithoragarh Bhalya 51 212 111 101 910 4 39 696
8 Pithoragarh Upertola 65 387 201 186 925 6 73 738

PANCHESHWAR MULTIPURPOSE PROJECT SIA Study Report
Chapter 3: Environmental Baseline Status-Socio-Economic Aspects Page 2
S. No. District Village
Name To
tal
Ho
us
eh
old
s
T
ota
l
Po
pu
lati
on
To
tal M
ale
Po
pu
lati
on
To
tal
Fem
ale
Po
pu
lati
on
Se
x R
ati
o
Av
era
ge
Fam
ily S
ize
Po
pu
lati
on
<
6 y
ea
rs
Se
x R
ati
o
9
Pithoragarh
Poli
Palchaur
a
48
224 100 124 1240 5 40 739
10 Pithoragarh Salla 231 1113 514 599 1165 5 192 811
11 Pithoragarh Sail 196 1020 470 550 1170 5 173 966
12 Pithoragarh
Taramiy
a 105
554 251 303 1207 5 121 891
13 Pithoragarh
Haldu(S
oniya) 82
401 178 223 1253 5 70 707
14 Pithoragarh Kwerali 137 547 265 282 1064 4 73 521
15 Pithoragarh Sakun 91 377 179 198 1106 4 31 722
16 Pithoragarh Dhyarh 37 162 82 80 976 4 26 444
17 Pithoragarh Kuteri* 0 0 0 0 0 0 0 0
18 Pithoragarh Tarigaon 39 168 75 93 1240 4 21 1100
19 Pithoragarh
Gyal
Pipali 24
128 64 64 1000 5 18 1000
20 Pithoragarh
Baun
Kote 12
63 29 34 1172 5 7
21 Pithoragarh
Basaur
Mainan 46
185 83 102 1229 4 16 2200
22 Pithoragarh Baltari 92 360 167 193 1156 4 44 517
23 Pithoragarh Gaurihat 219 895 419 476 1136 4 92 736
24 Pithoragarh Rajyoura 47 205 106 99 934 4 28 556
25 Pithoragarh Kanari 67 286 123 163 1325 4 37 1313
26 Pithoragarh
Majirkan
da 637
2404 1267 1137 897 4 275 763
27 Pithoragarh
Gethi
Gara 75
356 178 178 1000 5 50 613
28 Pithoragarh Bhateri 255
115
2 558 594 1065 5 137 756
29 Pithoragarh Amatari 43 157 71 86 1211 4 10 2333
30 Pithoragarh Ranuwa 36 143 75 68 907 4 20 1222
31 Pithoragarh Bathauli 115 506 239 267 1117 4 63 703
32 Pithoragarh Dyora 132 624 301 323 1073 5 98 849
33 Pithoragarh Sunkholi 37 148 79 69 873 4 15 250
34 Pithoragarh
Pant
Sera 95
388 180 208 1156 4 49 885
35 Pithoragarh Syuwan 53 248 125 123 984 5 14 400

PANCHESHWAR MULTIPURPOSE PROJECT SIA Study Report
Chapter 3: Environmental Baseline Status-Socio-Economic Aspects Page 3
S. No. District Village
Name To
tal
Ho
us
eh
old
s
T
ota
l
Po
pu
lati
on
To
tal M
ale
Po
pu
lati
on
To
tal
Fem
ale
Po
pu
lati
on
Se
x R
ati
o
Av
era
ge
Fam
ily S
ize
Po
pu
lati
on
<
6 y
ea
rs
Se
x R
ati
o
36 Pithoragarh
Dwali
Sera 139
624 312 312 1000 4 93 476
37 Pithoragarh
Ghighar
ani 65
328 157 171 1089 5 53 1304
38 Pithoragarh Sailoni 101 385 179 206 1151 4 47 1238
39 Pithoragarh Chamtoli 13 58 31 27 871 4 10 1000
40 Pithoragarh Titari 121 523 252 271 1075 4 79 927
41 Pithoragarh
Bagari
Hat 112
473 219 254 1160 4 77 833
42 Pithoragarh Bheliya 55 243 153 90 588 4 20 667
43 Pithoragarh Jogyura 39 162 72 90 1250 4 21 909
44 Pithoragarh Garjiya 62 295 142 153 1077 5 42 556
45 Pithoragarh Jamtari 89 352 182 170 934 4 47 741
46 Pithoragarh Oltari 73 369 189 180 952 5 27 1077
47 Pithoragarh Daulani 14 37 15 22 1467 3 3 0
48 Pithoragarh Toli 40 186 82 104 1268 5 23 769
49 Pithoragarh Tham 11 58 25 33 1320 5 12 333
50 Pithoragarh
Duti
Bagad 506
159
9 889 710 799 3 176 676
51 Pithoragarh
Dhunga
Toli 235
102
5 480 545 1135 4 142 868
52 Pithoragarh
Kimkhol
a 56
252 116 136 1172 5 46 917
53 Pithoragarh Bokata 133 547 282 265 940 4 85 809
54 Pithoragarh
Bungli
Gunth 290
1404 662 742 1121 5 255 917
55 Pithoragarh
Bursum
Bari 141
712 372 340 914 5 109 817
56 Pithoragarh
Dhandad
har* 0
0 0 0 0 0 0 0
57 Pithoragarh
Dubola
Bitola 54
224 120 104 867 4 25 471
58 Pithoragarh Quinar 7 39 20 19 950 6 3 500
59 Pithoragarh Kuntola 239 1125 532 593 1115 5 183 887
60 Pithoragarh Tudil 18 84 42 42 1000 5 20 1000
61 Pithoragarh Nali 156 712 345 367 1064 5 104 891
62 Pithoragarh
Sera
Ghara 25
104 53 51 962 4 5 667

PANCHESHWAR MULTIPURPOSE PROJECT SIA Study Report
Chapter 3: Environmental Baseline Status-Socio-Economic Aspects Page 4
S. No. District Village
Name To
tal
Ho
us
eh
old
s
T
ota
l
Po
pu
lati
on
To
tal M
ale
Po
pu
lati
on
To
tal
Fem
ale
Po
pu
lati
on
Se
x R
ati
o
Av
era
ge
Fam
ily S
ize
Po
pu
lati
on
<
6 y
ea
rs
Se
x R
ati
o
63
Pithoragarh
Sinoli
Bhawalt
a
13
79 40 39 975 6 16 333
64 Pithoragarh Jartola 27 114 56 58 1036 4 17 889
65 Pithoragarh Rasyun 54 196 82 114 1390 4 35 842
66 Pithoragarh Kharkoli 50 206 91 115 1264 4 29 706
67 Pithoragarh Askora 55 256 110 146 1327 5 44 1000
68 Pithoragarh Pali 150 695 343 352 1026 5 89 816
69 Pithoragarh Raitola 44 169 81 88 1086 4 22 571
70 Pithoragarh Rautora 93 402 196 206 1051 4 46 394
71
Pithoragarh
Cham
Dungara
Timta
276
1409 701 708 1010 5 262 858
72 Pithoragarh
Damde
Or 174
894 451 443 982 5 139 655
73 Pithoragarh Duni 257 1250 628 622 990 5 151 987
74 Pithoragarh
Chaur
Duroli 109
489 226 263 1164 4 63 750
75 Pithoragarh
Tulakha
nd 48
220 100 120 1200 5 35 1917
76 Pithoragarh Sibana 13 49 24 25 1042 4 4 333
77 Pithoragarh Sugari 125 580 262 318 1214 5 89 816
78 Pithoragarh Busail 109 500 226 274 1212 5 72 895
79 Pithoragarh Garali 31 121 53 68 1283 4 16 600
80
Pithoragarh
Anwala
Talla
Malla
Sugar
Mavla
45
196 95 101 1063 4 34 1125
81 Pithoragarh Sauli 19 70 30 40 1333 4 14 1000
82 Pithoragarh Dhajari* 0 0 0 0 0 0 0 0
83 Pithoragarh Diyuri 16 82 44 38 864 5 10 1000
84 Pithoragarh Suwal 20 82 37 45 1216 4 7 1333
85 Pithoragarh Tallisar 96 383 193 190 984 4 44 833
86 Pithoragarh
Khati
Gaon 137
646 303 343 1132 5 92 840
87 Pithoragarh Garali 107 452 213 239 1122 4 80 1000
88 Almora Nali Talli 95 415 171 244 1427 4 49 885

PANCHESHWAR MULTIPURPOSE PROJECT SIA Study Report
Chapter 3: Environmental Baseline Status-Socio-Economic Aspects Page 5
S. No. District Village
Name To
tal
Ho
us
eh
old
s
T
ota
l
Po
pu
lati
on
To
tal M
ale
Po
pu
lati
on
To
tal
Fem
ale
Po
pu
lati
on
Se
x R
ati
o
Av
era
ge
Fam
ily S
ize
Po
pu
lati
on
<
6 y
ea
rs
Se
x R
ati
o
89 Almora Umer 20 92 44 48 1091 5 11 571
90 Almora
Bamouri
Khalsa 21
100 48 52 1083 5 11 571
91 Almora
Ara
Salpar 240
1128 500 628 1256 5 166 824
92 Almora Kola 47 249 112 137 1223 5 39 950
93 Almora Malar 60 306 131 175 1336 5 53 1208
94 Almora Mayoli 54 218 101 117 1158 4 27 421
95 Almora Dewalsiri 48 263 127 136 1071 5 47 1765
96 Almora
Dasoli
Badiyar 246
1184 544 640 1176 5 192 811
97 Almora
Kuna
Pokhari 40
165 85 80 941 4 24 846
98
Almora
Uncha
Bauragu
nth*
0
0 0 0 0 0 0 0
99 Almora Bali Khet 66 318 131 187 1427 5 46 1556
100 Almora Nali Malli 125 554 259 295 1139 4 85 848
101 Almora
Ghura
lagga tak 50
221 89 132 1483 4 21 1100
102 Almora Birkola 68 319 126 193 1532 5 58 2053
103 Almora
Dhankan
a 11
50 23 27 1174 5 10 1500
104 Almora Melta 7 51 22 29 1318 7 13 1600
105 Almora
Nayal
Dhura 59
212 114 98 860 4 15 1500
106 Almora Padoli 19 74 33 41 1242 4 12 500
107 Almora Jingal 38 236 124 112 903 6 44 833
108 Almora
Chimkho
li 28
115 43 72 1674 4 18 2000
109 Champawat Betta 31 133 61 72 1180 4 26 1000
110 Champawat Sulan* 0 0 0 0 0 0 0 0
111 Champawat Netra 32 174 89 85 955 5 20 538
112 Champawat
Sugar
Khal 94
555 267 288 1079 6 90 1143
113 Champawat Batauri 120 587 305 282 925 5 113 712
114 Champawat Kothera 85 371 185 186 1005 4 55 774
115 Champawat Sigda 157 772 413 359 869 5 100 587

PANCHESHWAR MULTIPURPOSE PROJECT SIA Study Report
Chapter 3: Environmental Baseline Status-Socio-Economic Aspects Page 6
S. No. District Village
Name To
tal
Ho
us
eh
old
s
T
ota
l
Po
pu
lati
on
To
tal M
ale
Po
pu
lati
on
To
tal
Fem
ale
Po
pu
lati
on
Se
x R
ati
o
Av
era
ge
Fam
ily S
ize
Po
pu
lati
on
<
6 y
ea
rs
Se
x R
ati
o
116 Champawat Bruyuri 47 194 82 112 1366 4 27 1077
117 Champawat
Gaika
Jyula 29
164 79 85 1076 6 41 1412
118 Champawat
Khai Kot
Talla 56
239 109 130 1193 4 50 1083
119 Champawat Bibli* 0 0 0 0 0 0 0 0
120 Champawat
Simalkh
et 7
31 21 10 476 4 0
121 Champawat
Khai Kot
Malla 72
378 169 209 1237 5 74 1176
122 Champawat
Choolga
on 57
279 142 137 965 5 43 955
123 Champawat
Raighao
n 254
1257 619 638 1031 5 195 857
Subtotal (A) 1
1041 4
9666
2
4091
2
5575
1
28188 4
7
256 1062
RUPALI GAD RDP
124 Champawat Bachkot 77 319 144 175 1215 4 53 710
125 Champawat Polap 69 289 128 161 1258 4 44 692
126 Champawat Nidil 86 373 160 213 1331 4 61 906
127 Champawat
Jindi
Sorari 18
84 46 38 826 5 18 500
128 Champawat Bagauti 94 446 218 228 1046 5 66 1000
129 Champawat Dungraleti 174 866 369 497 1347 5 179 1106
130 Champawat Pasam 108 546 252 294 1167 5 96 1182
131 Champawat Aslad 45 223 108 115 1065 5 43 536
132 Champawat
Jamarsa
wn 43
189 79 110 1392 4 32 684
133 Champawat Matiyani 168 895 381 514 1349 5 196 1021
134 Champawat Chilniya 103 592 298 294 987 6 110 964
Subtotal (B)
985
4822 2183
2639
12983
5
898
1209
Total(A+B)
12026
54488 26274
28214
141171
5
8154
1074
Source: 2011 Census

PANCHESHWAR MULTIPURPOSE PROJECT SIA Study Report
Chapter 3: Environmental Baseline Status-Socio-Economic Aspects Page 7
Figure-3.1: Demographic profile of the Study Area Villages
3.2.2 Caste Profile
According to Census 2011 data that the General Caste Population 71.8% is the
dominant caste in the villages followed by Schedule Tribe Population 27.5%
and Schedule Caste population 0.7%. The village wise caste profile of the area
is summarized in Table-3.2 and depicted in Figure-3.2.
Table-3.2: Caste Profile of the Study Area Villages
S. No. District Village Name
To
tal
Po
pu
lati
on
Ge
ne
ral
cas
te
Po
pu
lati
on
Sc
he
du
le
Ca
ste
Po
pu
lati
on
Sc
he
du
le
Tri
be
Po
pu
lati
on
PANCHESHWAR MPDP
1 Pithoragarh Nisani 711 594 117 0
2 Pithoragarh Gogana 1457 998 459 0
3 Pithoragarh Rari Khunti 175 175 0 0
4 Pithoragarh Jamrari 686 539 147 0
5 Pithoragarh Kharku
Bhalya
174 122 52 0
6 Pithoragarh Matiyal 186 0 186 0
7 Pithoragarh Bhalya 212 1 211 0
8 Pithoragarh Upertola 387 0 386 1
9 Pithoragarh Poli
Palchaura
224 224 0 0
10 Pithoragarh Salla 1113 774 339 0
11 Pithoragarh Sail 1020 647 373 0
12 Pithoragarh Taramiya 554 363 191 0
13 Pithoragarh Haldu(Soniya) 401 300 101 0
0
5000
10000
15000
20000
25000
30000
TOTAL MALE POPULATION TOTAL FEMALE POPULATION
24091 25575
2183 2639
Pancheshwar MPDP Rupaligad RDP

PANCHESHWAR MULTIPURPOSE PROJECT SIA Study Report
Chapter 3: Environmental Baseline Status-Socio-Economic Aspects Page 8
S. No. District Village Name
To
tal
Po
pu
lati
on
Ge
ne
ral
cas
te
Po
pu
lati
on
Sc
he
du
le
Ca
ste
Po
pu
lati
on
Sc
he
du
le
Tri
be
Po
pu
lati
on
14 Pithoragarh Kwerali 547 541 6 0
15 Pithoragarh Sakun 377 375 2 0
16 Pithoragarh Dhyarh 162 160 2 0
17 Pithoragarh Kuteri 0
18 Pithoragarh Tarigaon 168 133 35 0
19 Pithoragarh Gyal Pipali 128 74 54 0
20 Pithoragarh Baun Kote 63 15 48 0
21 Pithoragarh Basaur
Mainan
185 110 75 0
22 Pithoragarh Baltari 360 284 76 0
23 Pithoragarh Gaurihat 895 717 178 0
24 Pithoragarh Rajyoura 205 153 52 0
25 Pithoragarh Kanari 286 189 97 0
26 Pithoragarh Majirkanda 2404 1917 479 8
27 Pithoragarh Gethi Gara 356 208 148 0
28 Pithoragarh Bhateri 1152 774 378 0
29 Pithoragarh Amatari 157 83 74 0
30 Pithoragarh Ranuwa 143 91 52 0
31 Pithoragarh Bathauli 506 494 12 0
32 Pithoragarh Dyora 624 479 145 0
33 Pithoragarh Sunkholi 148 148 0 0
34 Pithoragarh Pant Sera 388 336 52 0
35 Pithoragarh Syuwan 248 110 138 0
36 Pithoragarh Dwali Sera 624 209 415 0
37 Pithoragarh Ghigharani 328 122 206 0
38 Pithoragarh Sailoni 385 278 106 1
39 Pithoragarh Chamtoli 58 29 29 0
40 Pithoragarh Titari 523 224 299 0
41 Pithoragarh Bagari Hat 473 161 312 0
42 Pithoragarh Bheliya 243 181 62 0
43 Pithoragarh Jogyura 162 63 99 0
44 Pithoragarh Garjiya 295 237 58 0
45 Pithoragarh Jamtari 352 218 134 0
46 Pithoragarh Oltari 369 114 221 34
47 Pithoragarh Daulani 37 32 5 0
48 Pithoragarh Toli 186 171 15 0
49 Pithoragarh Tham 58 58 0 0
50 Pithoragarh Duti Bagad 1599 877 375 347
51 Pithoragarh Dhunga Toli 1025 771 252 2
52 Pithoragarh Kimkhola 252 217 35 0

PANCHESHWAR MULTIPURPOSE PROJECT SIA Study Report
Chapter 3: Environmental Baseline Status-Socio-Economic Aspects Page 9
S. No. District Village Name
To
tal
Po
pu
lati
on
Ge
ne
ral
cas
te
Po
pu
lati
on
Sc
he
du
le
Ca
ste
Po
pu
lati
on
Sc
he
du
le
Tri
be
Po
pu
lati
on
53 Pithoragarh Bokata 547 362 185 0
54 Pithoragarh Bungli Gunth 1404 1288 116 0
55 Pithoragarh Bursum Bari 712 511 201 0
56 Pithoragarh Dhandadhar 0
57 Pithoragarh Dubola Bitola 224 221 3 0
58 Pithoragarh Quinar 39 39 0 0
59 Pithoragarh Kuntola 1125 741 384 0
60 Pithoragarh Tudil 84 0 84 0
61 Pithoragarh Nali 712 629 83 0
62 Pithoragarh Sera Ghara 104 102 2 0
63 Pithoragarh Sinoli
Bhawalta
79 79 0 0
64 Pithoragarh Jartola 114 99 15 0
65 Pithoragarh Rasyun 196 196 0 0
66 Pithoragarh Kharkoli 206 206 0 0
67 Pithoragarh Askora 256 256 0 0
68 Pithoragarh Pali 695 237 458 0
69 Pithoragarh Raitola 169 139 30 0
70 Pithoragarh Rautora 402 402 0 0
71 Pithoragarh Cham
Dungara
Timta
1409 559 850 0
72 Pithoragarh Damde Or 894 237 657 0
73 Pithoragarh Duni 1250 877 373 0
74 Pithoragarh Chaur Duroli 489 334 155 0
75 Pithoragarh Tulakhand 220 220 0 0
76 Pithoragarh Sibana 49 49 0 0
77 Pithoragarh Sugari 580 543 37 0
78 Pithoragarh Busail 500 424 76 0
79 Pithoragarh Garali 121 121 0 0
80 Pithoragarh Anwala Talla
Malla Sugar
Mavla
196 138 58 0
81 Pithoragarh Sauli 70 69 1 0
82 Pithoragarh Dhajari 0
83 Pithoragarh Diyuri 82 82 0 0
84 Pithoragarh Suwal 82 82 0 0
85 Pithoragarh Tallisar 383 284 99 0
86 Pithoragarh Khati Gaon 646 372 274 0
87 Pithoragarh Garali 452 265 187 0

PANCHESHWAR MULTIPURPOSE PROJECT SIA Study Report
Chapter 3: Environmental Baseline Status-Socio-Economic Aspects Page 10
S. No. District Village Name
To
tal
Po
pu
lati
on
Ge
ne
ral
cas
te
Po
pu
lati
on
Sc
he
du
le
Ca
ste
Po
pu
lati
on
Sc
he
du
le
Tri
be
Po
pu
lati
on
88 Almora Nali Talli 415 406 9 0
89 Almora Umer 92 41 51 0
90 Almora Bamouri
Khalsa
100 77 23 0
91 Almora Ara Salpar 1128 1108 20 0
92 Almora Kola 249 249 0 0
93 Almora Malar 306 305 1 0
94 Almora Mayoli 218 146 72 0
95 Almora Dewalsiri 263 66 197 0
96 Almora Dasoli
Badiyar
1184 541 643 0
97 Almora Kuna Pokhari 165 117 48 0
98 Almora Uncha
Bauragunth
0 0 0 0
99 Almora Bali Khet 318 318 0 0
100 Almora Nali Malli 554 256 298 0
101 Almora Ghura lagga
tak
221 221 0 0
102 Almora Birkola 319 302 17 0
103 Almora Dhankana 50 50 0 0
104 Almora Melta 51 0 51 0
105 Almora Nayal Dhura 212 154 58 0
106 Almora Padoli 74 71 3 0
107 Almora Jingal 236 185 49 2
108 Almora Chimkholi 115 115 0 0
109 Champawat Betta 133 38 95 0
110 Champawat Sulan 0 0 0 0
111 Champawat Netra 174 174 0 0
112 Champawat Sugar Khal 555 555 0 0
113 Champawat Batauri 587 481 106 0
114 Champawat Kothera 371 273 98 0
115 Champawat Sigda 772 732 40 0
116 Champawat Bruyuri 194 157 37 0
117 Champawat Gaika Jyula 164 164 0 0
118 Champawat Khai Kot Talla 239 204 35 0
119 Champawat Bibli 0 0 0 0
120 Champawat Simalkhet 31 23 8 0
121 Champawat Khai Kot
Malla
378 314 64 0
122 Champawat Choolgaon 279 236 43 0

PANCHESHWAR MULTIPURPOSE PROJECT SIA Study Report
Chapter 3: Environmental Baseline Status-Socio-Economic Aspects Page 11
S. No. District Village Name
To
tal
Po
pu
lati
on
Ge
ne
ral
cas
te
Po
pu
lati
on
Sc
he
du
le
Ca
ste
Po
pu
lati
on
Sc
he
du
le
Tri
be
Po
pu
lati
on
123 Champawat Raighaon 1257 969 288 0
Subtotal(A) 49666 35301 13970 395
RUPALIGAD RDP
124 Champawat Bachkot 319 137 182 0
125 Champawat Polap 289 271 18 0
126 Champawat Nidil 373 346 27 0
127 Champawat Jindi Sorari 84 53 31 0
128 Champawat Bagauti 446 349 97 0
129 Champawat Dungraleti 866 777 89 0
130 Champawat Pasam 546 452 94 0
131 Champawat Aslad 223 80 143 0
132 Champawat Jamarsawn 189 177 12 0
133 Champawat Matiyani 895 591 304 0
134 Champawat Chilniya 592 582 10 0
Sub-total (B) 4822 3815 1007 0
Total(A+B) 54488 39116 14977 395
Source: 2011 Census
Figure-3.2: Caste profile of the Study Area Villages
3.2.3 Literacy rate
The total literate population in Study Area Villages is of the order of 64.5% (as
per 2011 census data). The overall illiterate population in the villages is 35.5%.
The male and female literacy rate in the villages is 75.6% and 65.97%
0 5000 10000 15000 20000 25000 30000 35000 40000
General castePopulation
Schedule Caste Population
Schedule Tribe Population
Rupaligad RDP Pancheshwar MPDP

PANCHESHWAR MULTIPURPOSE PROJECT SIA Study Report
Chapter 3: Environmental Baseline Status-Socio-Economic Aspects Page 12
respectively. The details of literacy rate in Study Area Villages are given in
Table -3.3 and depicted in Figure-3.3.
Table-3.3: Literacy Profile of Study Area Villages
S.
No
District Village
Name
To
tal
Po
pu
lati
on
Po
pu
lati
on
Lit
era
te
Ma
le
Lit
era
te
Fem
ale
Lit
era
te
Po
pu
lati
on
Illite
rate
Ma
le
Illite
rate
Fem
ale
Illite
rate
PANCHESHWAR MPDP
1 Pithoragarh Nisani 711 473 280 193 238 84 154
2 Pithoragarh Gogana 1457 989 581 408 468 154 314
3 Pithoragarh Rari
Khunti
175 125 70 55 50 19 31
4 Pithoragarh Jamrari 686 434 265 169 252 78 174
5 Pithoragarh Kharku
Bhalya
174 123 70 53 51 21 30
6 Pithoragarh Matiyal 186 121 80 41 65 23 42
7 Pithoragarh Bhalya 212 137 85 52 75 26 49
8 Pithoragarh Upertola 387 256 150 106 131 51 80
9 Pithoragarh Poli
Palchaura
224 143 75 68 81 25 56
10 Pithoragarh Salla 1113 691 375 316 422 139 283
11 Pithoragarh Sail 1020 648 353 295 372 117 255
12 Pithoragarh Taramiya 554 315 170 145 239 81 158
13 Pithoragarh Haldu(Son
iya)
401 262 132 130 139 46 93
14 Pithoragarh Kwerali 547 362 188 174 185 77 108
15 Pithoragarh Sakun 377 275 153 122 102 26 76
16 Pithoragarh Dhyarh 162 114 61 53 48 21 27
17 Pithoragarh Kuteri
18 Pithoragarh Tarigaon 168 109 64 45 59 11 48
19 Pithoragarh Gyal Pipali 128 90 53 37 38 11 27
20 Pithoragarh Baun Kote 63 40 25 15 23 4 19
21 Pithoragarh Basaur
Mainan
185 125 73 52 60 10 50
22 Pithoragarh Baltari 360 246 134 112 114 33 81
23 Pithoragarh Gaurihat 895 686 358 328 209 61 148
24 Pithoragarh Rajyoura 205 130 80 50 75 26 49
25 Pithoragarh Kanari 286 196 98 98 90 25 65
26 Pithoragarh Majirkanda 2404 1842 1068 774 562 199 363
27 Pithoragarh Gethi Gara 356 229 131 98 127 47 80
28 Pithoragarh Bhateri 1152 780 441 339 372 117 255
29 Pithoragarh Amatari 157 105 57 48 52 14 38

PANCHESHWAR MULTIPURPOSE PROJECT SIA Study Report
Chapter 3: Environmental Baseline Status-Socio-Economic Aspects Page 13
S.
No
District Village
Name
To
tal
Po
pu
lati
on
Po
pu
lati
on
Lit
era
te
Ma
le
Lit
era
te
Fem
ale
Lit
era
te
Po
pu
lati
on
Illite
rate
Ma
le
Illite
rate
Fem
ale
Illite
rate
30 Pithoragarh Ranuwa 143 103 63 40 40 12 28
31 Pithoragarh Bathauli 506 343 182 161 163 57 106
32 Pithoragarh Dyora 624 443 238 205 181 63 118
33 Pithoragarh Sunkholi 148 129 67 62 19 12 7
34 Pithoragarh Pant Sera 388 308 148 160 80 32 48
35 Pithoragarh Syuwan 248 186 102 84 62 23 39
36 Pithoragarh Dwali Sera 624 386 210 176 238 102 136
37 Pithoragarh Ghigharani 328 239 134 105 89 23 66
38 Pithoragarh Sailoni 385 279 151 128 106 28 78
39 Pithoragarh Chamtoli 58 37 21 16 21 10 11
40 Pithoragarh Titari 523 342 188 154 181 64 117
41 Pithoragarh Bagari Hat 473 309 160 149 164 59 105
42 Pithoragarh Bheliya 243 144 96 48 99 57 42
43 Pithoragarh Jogyura 162 98 49 49 64 23 41
44 Pithoragarh Garjiya 295 210 102 108 85 40 45
45 Pithoragarh Jamtari 352 210 125 85 142 57 85
46 Pithoragarh Oltari 369 264 155 109 105 34 71
47 Pithoragarh Daulani 37 21 11 10 16 4 12
48 Pithoragarh Toli 186 139 69 70 47 13 34
49 Pithoragarh Tham 58 36 14 22 22 11 11
50 Pithoragarh Duti
Bagad
1599 1231 742 489 368 147 221
51 Pithoragarh Dhunga
Toli
1025 689 372 317 336 108 228
52 Pithoragarh Kimkhola 252 157 83 74 95 33 62
53 Pithoragarh Bokata 547 327 217 110 220 65 155
54 Pithoragarh Bungli
Gunth
1404 853 495 358 551 167 384
55 Pithoragarh Bursum
Bari
712 484 292 192 228 80 148
56 Pithoragarh Dhandadha
r
57 Pithoragarh Dubola
Bitola
224 175 101 74 49 19 30
58 Pithoragarh Quinar 39 30 16 14 9 4 5
59 Pithoragarh Kuntola 1125 670 361 309 455 171 284
60 Pithoragarh Tudil 84 54 30 24 30 12 18
61 Pithoragarh Nali 712 470 271 199 242 74 168
62 Pithoragarh Sera
Ghara
104 84 47 37 20 6 14

PANCHESHWAR MULTIPURPOSE PROJECT SIA Study Report
Chapter 3: Environmental Baseline Status-Socio-Economic Aspects Page 14
S.
No
District Village
Name
To
tal
Po
pu
lati
on
Po
pu
lati
on
Lit
era
te
Ma
le
Lit
era
te
Fem
ale
Lit
era
te
Po
pu
lati
on
Illite
rate
Ma
le
Illite
rate
Fem
ale
Illite
rate
63 Pithoragarh Sinoli
Bhawalta
79 47 27 20 32 13 19
64 Pithoragarh Jartola 114 71 42 29 43 14 29
65 Pithoragarh Rasyun 196 92 47 45 104 35 69
66 Pithoragarh Kharkoli 206 145 69 76 61 22 39
67 Pithoragarh Askora 256 158 82 76 98 28 70
68 Pithoragarh Pali 695 441 240 201 254 103 151
69 Pithoragarh Raitola 169 96 55 41 73 26 47
70 Pithoragarh Rautora 402 270 150 120 132 46 86
71 Pithoragarh Cham
Dungara
Timta
1409 839 486 353 570 215 355
72 Pithoragarh Damde Or 894 526 317 209 368 134 234
73 Pithoragarh Duni 1250 838 492 346 412 136 276
74 Pithoragarh Chaur
Duroli
489 354 181 173 135 45 90
75 Pithoragarh Tulakhand 220 143 84 59 77 16 61
76 Pithoragarh Sibana 49 38 20 18 11 4 7
77 Pithoragarh Sugari 580 376 199 177 204 63 141
78 Pithoragarh Busail 500 324 172 152 176 54 122
79 Pithoragarh Garali 21 53 68 85 43 42 36
80 Pithoragarh Anwala
Talla Malla
Sugar
Mavla
196 105 63 42 91 32 59
81 Pithoragarh Sauli 70 51 22 29 19 8 11
82 Pithoragarh Dhajari
83 Pithoragarh Diyuri 82 61 38 23 21 6 15
84 Pithoragarh Suwal 82 55 33 22 27 4 23
85 Pithoragarh Tallisar 383 267 159 108 116 34 82
86 Pithoragarh Khati
Gaon
646 391 222 169 255 81 174
87 Pithoragarh Garali 452 274 151 123 178 62 116
88 Almora Nali Talli 415 249 126 123 166 45 121
89 Almora Umer 92 54 26 28 38 18 20
90 Almora Bamouri
Khalsa
100 65 39 26 35 9 26
91 Almora Ara Salpar 1128 725 365 360 403 135 268
92 Almora Kola 249 176 90 86 73 22 51
93 Almora Malar 306 181 96 85 125 35 90

PANCHESHWAR MULTIPURPOSE PROJECT SIA Study Report
Chapter 3: Environmental Baseline Status-Socio-Economic Aspects Page 15
S.
No
District Village
Name
To
tal
Po
pu
lati
on
Po
pu
lati
on
Lit
era
te
Ma
le
Lit
era
te
Fem
ale
Lit
era
te
Po
pu
lati
on
Illite
rate
Ma
le
Illite
rate
Fem
ale
Illite
rate
94 Almora Mayoli 218 129 64 65 89 37 52
95 Almora Dewalsiri 263 159 94 65 104 33 71
96 Almora Dasoli
Badiyar
1184 684 383 301 500 161 339
97 Almora Kuna
Pokhari
165 94 59 35 71 26 45
98 Almora Uncha
Bauragunt
h
0 0 0 0 0 0 0
99 Almora Bali Khet 318 212 109 103 106 22 84
100 Almora Nali Malli 554 287 161 126 267 98 169
101 Almora Ghura
lagga tak
221 146 74 72 75 15 60
102 Almora Birkola 319 211 102 109 108 24 84
103 Almora Dhankana 50 30 19 11 20 4 16
104 Almora Melta 51 28 15 13 23 7 16
105 Almora Nayal
Dhura
212 132 84 48 80 30 50
106 Almora Padoli 74 46 22 24 28 11 17
107 Almora Jingal 236 166 99 67 70 25 45
108 Almora Chimkholi 115 59 29 30 56 14 42
109 Champawat Betta 133 67 36 31 66 25 41
110 Champawat Sulan 0 0 0 0 0 0 0
111 Champawat Netra 174 124 74 50 50 15 35
112 Champawat Sugar
Khal
555 341 204 137 214 63 151
113 Champawat Batauri 587 374 228 146 213 77 136
114 Champawat Kothera 371 255 144 111 116 41 75
115 Champawat Sigda 772 537 338 199 235 75 160
116 Champawat Bruyuri 194 126 64 62 68 18 50
117 Champawat Gaika
Jyula
164 94 57 37 70 22 48
118 Champawat Khai Kot
Talla
239 123 73 50 116 36 80
119 Champawat Bibli 0 0 0 0 0 0 0
120 Champawat Simalkhet 31 29 21 8 2 0 2
121 Champawat Khai Kot
Malla
378 215 118 97 163 51 112
122 Champawat Choolgaon 279 214 120 94 65 22 43
123 Champawat Raighaon 1257 757 472 285 500 147 353

PANCHESHWAR MULTIPURPOSE PROJECT SIA Study Report
Chapter 3: Environmental Baseline Status-Socio-Economic Aspects Page 16
S.
No
District Village
Name
To
tal
Po
pu
lati
on
Po
pu
lati
on
Lit
era
te
Ma
le
Lit
era
te
Fem
ale
Lit
era
te
Po
pu
lati
on
Illite
rate
Ma
le
Illite
rate
Fem
ale
Illite
rate
Subtotal
(A)
4
9666
3
2600
1
8406
1
4294
1
7041
5
742
1
1334
RUPALI GAD RDP
124 Champawat Bachkot 319 158 87 71 161 57 104
125 Champawat Polap 289 162 87 75 127 41 86
126 Champawat Nidil 373 222 116 106 151 44 107
127 Champawat Jindi
Sorari
84 40 30 10 44 16 28
128 Champawat Bagauti 446 286 170 116 160 48 112
129 Champawat Dungraleti 866 373 221 152 493 148 345
130 Champawat Pasam 546 289 181 108 257 71 186
131 Champawat Aslad 223 106 61 45 117 47 70
132 Champawat Jamarsaw
n
189 91 43 48 98 36 62
133 Champawat Matiyani 895 410 239 171 485 142 343
134 Champawat Chilniya 592 385 231 154 207 67 140
Subtotal
(B)
4822 2522 1466 1056 2300 717 1583
Total(A+B) 5448
8
3512
2
1987
2
1535
0
1934
1
645
9
1291
7
Source: 2011 Census
Figure-3.3: Literacy Profile of the Study Area Villages
3.2.4 Occupational Profile
In economic development of the region its geographical location, natural
resources, business and employment, industries and manpower play vital role.
0 2000 4000 6000 8000 10000 12000 14000 16000 18000 20000
MALE LITERATE
FEMALE LITERATE
POPULATION ILLITERATE
18406
14294
17041
1466
1056
2300
Rupaligad RDP Pancheshwar MPDP

PANCHESHWAR MULTIPURPOSE PROJECT SIA Study Report
Chapter 3: Environmental Baseline Status-Socio-Economic Aspects Page 17
The occupational profile of the villages is given in Table-3.4. The Occupational
Profile of Study Area Villages is depicted in Figure-3.4.The total working
population in the area constitutes for 49.5% and dependent population or non-
workers in the villages are 50.5% of the total population. It is further observed
that 62.3% of the total working population falls under main worker category.
The marginal workers account for about 37.7% of the total working population.
Table-3.4: Occupational Profile of Study Area Villages
S.
No
District Village Name
To
tal
Po
pu
lati
on
To
tal
Wo
rkin
g
Po
pu
lati
on
Ma
in
Wo
rke
rs
Ma
rgin
al
Wo
rke
rs
No
n
Wo
rke
rs
PANCHESHWAR
MPDP
1 Pithoragarh Nisani 711 270 135 135 441
2 Pithoragarh Gogana 1457 753 535 218 704
3 Pithoragarh Rari Khunti 175 120 7 113 55
4 Pithoragarh Jamrari 686 321 238 83 365
5 Pithoragarh Kharku Bhalya 174 121 14 107 53
6 Pithoragarh Matiyal 186 44 8 36 142
7 Pithoragarh Bhalya 0 0 0 0 0
8 Pithoragarh Upertola 0 0 0 0 0
9 Pithoragarh Poli Palchaura 224 112 103 9 112
10 Pithoragarh Salla 1113 565 407 158 548
11 Pithoragarh Sail 1020 595 512 83 425
12 Pithoragarh Taramiya 554 244 216 28 310
13 Pithoragarh Haldu(Soniya) 401 193 191 2 208
14 Pithoragarh Kwerali 547 307 230 77 240
15 Pithoragarh Sakun 377 163 132 31 214
16 Pithoragarh Dhyarh 162 75 72 3 87
17 Pithoragarh Kuteri 0 0 0 0 0
18 Pithoragarh Tarigaon 168 99 97 2 69
19 Pithoragarh Gyal Pipali 128 66 65 1 62
20 Pithoragarh Baun Kote 63 37 27 10 26
21 Pithoragarh Basaur Mainan 185 100 79 21 85
22 Pithoragarh Baltari 360 208 204 4 152
23 Pithoragarh Gaurihat 895 415 334 81 480
24 Pithoragarh Rajyoura 205 42 1 41 163
25 Pithoragarh Kanari 286 171 10 161 115
26 Pithoragarh Majirkanda 2404 1110 935 175 1294
27 Pithoragarh Gethi Gara 356 189 187 2 167
28 Pithoragarh Bhateri 1152 653 632 21 499
29 Pithoragarh Amatari 157 70 57 13 87

PANCHESHWAR MULTIPURPOSE PROJECT SIA Study Report
Chapter 3: Environmental Baseline Status-Socio-Economic Aspects Page 18
S.
No
District Village Name
To
tal
Po
pu
lati
on
To
tal
Wo
rkin
g
Po
pu
lati
on
Ma
in
Wo
rke
rs
Ma
rgin
al
Wo
rke
rs
No
n
Wo
rke
rs
30 Pithoragarh Ranuwa 143 74 58 16 69
31 Pithoragarh Bathauli 506 98 53 45 408
32 Pithoragarh Dyora 624 277 223 54 347
33 Pithoragarh Sunkholi 148 109 105 4 39
34 Pithoragarh Pant Sera 388 322 319 3 66
35 Pithoragarh Syuwan 248 111 38 73 137
36 Pithoragarh Dwali Sera 624 307 65 242 317
37 Pithoragarh Ghigharani 328 166 10 156 162
38 Pithoragarh Sailoni 385 172 165 7 213
39 Pithoragarh Chamtoli 58 29 2 27 29
40 Pithoragarh Titari 523 248 40 208 275
41 Pithoragarh Bagari Hat 473 239 183 56 234
42 Pithoragarh Bheliya 243 164 161 3 79
43 Pithoragarh Jogyura 162 83 82 1 79
44 Pithoragarh Garjiya 295 57 14 43 238
45 Pithoragarh Jamtari 130 69 56 13 61
46 Pithoragarh Oltari 369 185 98 87 184
47 Pithoragarh Daulani 37 25 16 9 12
48 Pithoragarh Toli 1701 1039 649 390 662
49 Pithoragarh Tham 58 41 20 21 17
50 Pithoragarh Duti Bagad 1599 1037 741 296 562
51 Pithoragarh Dhunga Toli 1025 521 436 85 504
52 Pithoragarh Kimkhola 252 116 43 73 136
53 Pithoragarh Bokata 547 185 79 106 362
54 Pithoragarh Bungli Gunth 1404 668 655 13 736
55 Pithoragarh Bursum Bari 712 362 336 26 350
56 Pithoragarh Dhandadhar 0 0 0 0 0
57 Pithoragarh Dubola Bitola 224 111 17 94 113
58 Pithoragarh Quinar 39 18 16 2 21
59 Pithoragarh Kuntola 1125 742 392 350 383
60 Pithoragarh Tudil 84 43 1 42 41
61 Pithoragarh Nali 712 362 202 160 350
62 Pithoragarh Sera Ghara 104 72 8 64 32
63 Pithoragarh Sinoli Bhawalta 79 41 1 40 38
64 Pithoragarh Jartola 114 58 0 58 56
65 Pithoragarh Rasyun 196 114 96 18 82
66 Pithoragarh Kharkoli 206 108 90 18 98
67 Pithoragarh Askora 256 119 88 31 137
68 Pithoragarh Pali 390 300 127 173 90

PANCHESHWAR MULTIPURPOSE PROJECT SIA Study Report
Chapter 3: Environmental Baseline Status-Socio-Economic Aspects Page 19
S.
No
District Village Name
To
tal
Po
pu
lati
on
To
tal
Wo
rkin
g
Po
pu
lati
on
Ma
in
Wo
rke
rs
Ma
rgin
al
Wo
rke
rs
No
n
Wo
rke
rs
69 Pithoragarh Raitola 169 102 102 0 67
70 Pithoragarh Rautara 0 0 0 0 0
71 Pithoragarh Cham Dungara
Timta
1409 754 369 385 655
72 Pithoragarh Damde Or 894 389 30 359 505
73 Pithoragarh Duni 1250 485 388 97 765
74 Pithoragarh Chaur Duroli 489 206 26 180 283
75 Pithoragarh Tulakhand 220 107 48 59 113
76 Pithoragarh Sibana 49 25 25 0 24
77 Pithoragarh Sugari 580 274 21 253 306
78 Pithoragarh Busail 500 114 114 0 386
79 Pithoragarh Garali 121 60 0 60 61
80 Pithoragarh Anwala Talla Malla
Sugar Mavla
196 94 22 72 102
81 Pithoragarh Sauli 70 30 30 0 40
82 Pithoragarh Dhajari 0 0 0 0 0
83 Pithoragarh Diyuri 82 41 38 3 41
84 Pithoragarh Suwal 82 54 18 36 28
85 Pithoragarh Tallisar 383 335 173 162 48
86 Pithoragarh Khati Gaon 646 332 309 23 314
87 Pithoragarh Garali 452 265 200 65 187
88 Almora Nali Talli 415 191 49 142 224
89 Almora Umer 92 31 28 3 61
90 Almora Bamouri Khalsa 100 49 9 40 51
91 Almora Ara Salpar 1128 583 380 203 545
92 Almora Kola 249 139 2 137 110
93 Almora Malar 306 160 160 0 146
94 Almora Mayoli 218 105 61 44 113
95 Almora Dewalsiri 263 133 115 18 130
96 Almora Dasoli Badiyar 1184 548 277 271 636
97 Almora Kuna Pokhari 165 102 91 11 63
98 Almora Uncha Bauragunth 0 0 0 0 0
99 Almora Bali Khet 318 182 160 22 136
100 Almora Nali Malli 554 253 21 232 301
101 Almora Ghura lagga tak 221 124 122 2 97
102 Almora Birkola 319 160 156 4 159
103 Almora Dhankana 50 36 26 10 14
104 Almora Melta 367 223 3 220 144
105 Almora Nayal Dhura 212 146 126 20 66
PANCHESHWAR MULTIPURPOSE PROJECT SIA Study Report
Chapter 3: Environmental Baseline Status-Socio-Economic Aspects Page 20
S.
No
District Village Name
To
tal
Po
pu
lati
on
To
tal
Wo
rkin
g
Po
pu
lati
on
Ma
in
Wo
rke
rs
Ma
rgin
al
Wo
rke
rs
No
n
Wo
rke
rs
106 Almora Padoli 74 36 25 11 38
107 Almora Jingal 236 129 22 107 107
108 Almora Chimkholi 115 71 71 0 44
109 Champawat Betta 133 63 5 58 70
110 Champawat Sulan 0 0 0 0 0
111 Champawat Netra 174 109 54 55 65
112 Champawat Sugar Khal 555 151 149 2 404
113 Champawat Batauri 587 136 92 44 451
114 Champawat Kothera 371 276 128 148 95
115 Champawat Sigda 772 243 173 70 529
116 Champawat Bruyuri 194 114 24 90 80
117 Champawat Gaika Jyula 164 80 21 59 84
118 Champawat Khai Kot Talla 239 111 3 108 128
119 Champawat Bibli 0 0 0 0 0
120 Champawat Simalkhet 31 5 2 3 26
121 Champawat Khai Kot Malla 378 180 12 168 198
122 Champawat Choolgaon 279 68 64 4 211
123 Champawat Raighaon 1257 546 192 354 711
Subtotal (A) 49969 24985 15849 9136 24984
124 Champawat Bachkot 319 94 94 0 225
125 Champawat Polap 289 119 117 2 170
126 Champawat Nidil 373 207 7 200 166
127 Champawat Jindi Sorari 84 39 3 36 45
128 Champawat Bagauti 446 261 160 101 185
129 Champawat Dungraleti 866 407 252 155 459
130 Champawat Pasam 546 258 10 248 288
131 Champawat Aslad 223 128 84 44 95
132 Champawat Jamarsawn 189 90 79 11 99
133 Champawat Matiyani 895 288 222 66 607
134 Champawat Chilniya 592 242 14 228 350
Subtotal(B) 4822 2133 1042 1091 2689
Total (A+B) 54791 27118 16891 10227 27673
Source: 2011 Census

PANCHESHWAR MULTIPURPOSE PROJECT SIA Study Report
Chapter 3: Environmental Baseline Status-Socio-Economic Aspects Page 21
Figure-3.4 Occupational profile of main workers in Study Area Villages
0
5000
10000
15000
20000
25000
Main Workers Marginal Workers Non Workers
15835
9093
24746
1042 1091 2689
Pancheshwar MPDP Rupaligad RDP

CHAPTER-4
DATA ANALYSIS OF SURVEYED POPULATION

PANCHESHWAR MULTIPURPOSE PROJECT SIA Study Report
Chapter 4: Data Analysis of Socio-Economic Survey Page 1
CHAPTER – 4
DATA ANALYSIS OF SOCIO-ECONOMIC SURVEY
4.1 GENERAL
Most often, development projects are planned based on the availability of
exploitable natural resources. This attracts flow of finances, investments, jobs
and other livelihood opportunities, which brings in people from different cultural
and social background. Such planned activities not only provide impetus to the
local economy but also bring about a multi-dimensional economic, social and
cultural change. Most often it has been observed that such development
projects are commissioned in economically and socially backward areas.
Commissioning of a development project invariably brings about a number of
desired and undesired impacts along with it. The main aim of the of the study is
to provide services for conducting social and property survey for the
Pancheshwar Multi-purpose Project (PMP) in Uttarakhand. As part of the study,
socio-economic survey was conducted for the project affected families of
Pancheshwar Multipurpose Project. The baseline setting for socio-economic
aspects are outlined in the present Chapter.
4.2 SOCIO-ECONOMIC PROFILE OF PROJECT AFFECTED FAMILIES
4.2.1 Methodology Adopted for Socio-Economic Survey
Information for undertaking the socio-economic studies included both
secondary as well as primary data and information. Secondary data was
collected from the revenue department in the form of Right of Records (RoRs)
and Khasra (Cadastral) maps. Secondary source of information in terms of
existing reports, maps and other documents pertaining to the project. Primary
data and information was collected through interactions and consultations with
project affected families in the affected villages. Primary socio-economic
information from the stratified random 30% sample PAFs was gathered with the
help of survey tools, specially devised for this purpose. The primary information
from the sample PAFs was computerized and analyzed to draw inferences and
subsequently a socio-economic survey report was prepared.
A considerable time was spent in collation of information from the secondary
sources. Through desk research and review of maps from District Administrative
Atlas of Uttarakhand, a comprehensive list of probable affected villages was
prepared. In all there are 134 affected villages in districts Pithoragarh (87),
Champawat (26) and Almora (21). The project-wise list of project affected

PANCHESHWAR MULTIPURPOSE PROJECT SIA Study Report
Chapter 4: Data Analysis of Socio-Economic Survey Page 2
villages is giver in Table-4.1.
Table-4.1: List of Project Affected Villages
S. No Village Name Impact Status
District Pithoragarh
Sub-district Pithoragarh
1. Nisani Partially Affected
2. Gogana Partially Affected
3. Rari Khunti Partially Affected
4. Jamrari Partially Affected
5. Kharku Bhalya Fully Affected
6. Matiyal Fully Affected
7. Bhalya Fully Affected
8. Upertola Partially Affected
9. Poli Palchaura Partially Affected
10. Salla Partially Affected
11. Sail Partially Affected
12. Taramiya Partially Affected
13. Haldu(Soniya) Fully Affected
14. Kwerali Partially Affected
15. Sakun Partially Affected
16. Dhyarh Partially Affected
17. Kuteri Partially Affected
18. Tarigaon Partially Affected
19. Gyal Pipali Partially Affected
20. Baun Kote Partially Affected
21. Basaur Mainan Partially Affected
22. Baltari Fully Affected
23. Rajoura Partially Affected
24. Kanari Fully Affected
25. Majirakhanda Partially Affected
26. Getigada Partially Affected
27. Bhateri Partially Affected
Sub-district Kanalichina Fully Affected
1. Amtari Fully Affected
2. Ranuwa Fully Affected
3. Bathauli Fully Affected
4. Dyora Partially Affected
5. Sunkholi Fully Affected
6. Panthsera Partially Affected
7. Syuwan Partially Affected
8. Dwalishera Partially Affected
Sub-district Didihat

PANCHESHWAR MULTIPURPOSE PROJECT SIA Study Report
Chapter 4: Data Analysis of Socio-Economic Survey Page 3
S. No Village Name Impact Status
1. Ghighrani Fully Affected
2. Sailoni Partially Affected
3. Chamtoli Fully Affected
4. Titri Fully Affected
5. Bagadihat Partially Affected
6. Bheliya Partially Affected
7. Jogyura Fully Affected
8. Garjiya Partially Affected
9. Jamtari Partially Affected
10. Oltari Partially Affected
Sub-district Kanalichina
1. Daulani Partially Affected
Sub-district Pithoragarh
1. Toli Partially Affected
Sub-district Dharchula
1. Thaam Partially Affected
2. Duti Bagar Partially Affected
3. Dungatoli Partially Affected
4. Kimkhola Partially Affected
Sub-district Gangolihat
1. Bokata Partially Affected
2. Bungli Partially Affected
3. Bursum Bari Partially Affected
4. Dandahar Partially Affected
5. Dubola Birtola Partially Affected
6. Kuinar Partially Affected
7. Kuntola Partially Affected
8. Tudil Partially Affected
9. Nali Partially Affected
10. Seragada Fully Affected
11. Sinoli Bhamaita Partially Affected
12. Jartoia Fully Affected
13. Rasyun Partially Affected
14. Kharkholi Partially Affected
15. Askora Partially Affected
16. Pali Partially Affected
17. Raitoli Partially Affected
18. Rautora Partially Affected
19. Timta Chamdungra Partially Affected
20. Damde Partially Affected
21. Duni Partially Affected
22. Chaur Ghurelli Partially Affected
23. Tulkhand Partially Affected

PANCHESHWAR MULTIPURPOSE PROJECT SIA Study Report
Chapter 4: Data Analysis of Socio-Economic Survey Page 4
S. No Village Name Impact Status
24. Sibna Partially Affected
25. Sugari Partially Affected
26. Busail Partially Affected
27. Garali Partially Affected
28. Anwala Talla Malla Sugar Mavla Partially Affected
29. Sauli Partially Affected
30. Dhajari Partially Affected
31. Diyuri Partially Affected
32. Suwal Partially Affected
Sub-district Pithoragarh
1. Tallisar Partially Affected
2. Khatigaon Partially Affected
3. Garali Partially Affected
Sub-district Almora
1. Nali Malli Partially Affected
2. Umer Partially Affected
3. Bamori Partially Affected
Sub-district Bhanoli
1. Ara Salpar Fully Affected
2. Kola Partially Affected
3. Kunj Kimola Fully Affected
4. Mayoli Partially Affected
5. Deolisiri Partially Affected
6. Dasoli Badiyar Partially Affected
7. Kuna Pokhri Partially Affected
8. Uncha Beragunth Fully Affected
9. Balikhet Partially Affected
Sub-district Almora
1. Talli Nali Partially Affected
Sub-district Bhanoli
1. Dhura Laga Tank Fully Affected
2. Birkola Partially Affected
3. Dhankana Partially Affected
Sub-district Almora
1. Melta Partially Affected
Sub-district Bhanoli
1. Nayal Dhura Partially Affected
Sub-district Almora
1. Padoli Partially Affected
2. Jingal Partially Affected
Sub-district Bhanoli
1. Chimkholi Partially Affected

PANCHESHWAR MULTIPURPOSE PROJECT SIA Study Report
Chapter 4: Data Analysis of Socio-Economic Survey Page 5
S. No Village Name Impact Status
Sub-district Barakot
1. Betta Partially Affected
2. Sulan Partially Affected
3. Netra Fully Affected
4. Sugarkhal Partially Affected
5. Botari Mug Gunth Partially Affected
6. Kuthera Partially Affected
7. Singara Partially Affected
8. Bruyuri Partially Affected
9. Gaika jhula Partially Affected
Sub-district Loharghat
1. Khaikot Talla Partially Affected
2. Vivel Partially Affected
Sub-district Pati
1. Simalkhet Fully Affected
Sub-district Loharghat
1. Khai Khot Malla Partially Affected
Sub-district Barakot
1. Choolagaon Partially Affected
2. Raygaon Partially Affected
Sub-district Champawat
1. Bachkot Partially Affected
2. Polap Partially Affected
Sub-district Loharghat
1. Nidil Partially Affected
2. Jindi Sorari Partially Affected
3. Bhagauti Partially Affected
4. Dungraleti Partially Affected
5. Pasam Partially Affected
6. Ashlad Partially Affected
7. Jamarso Partially Affected
8. Matiyani Partially Affected
Sub-district Pati
1. Chiliniya Partially Affected
Source: Primary Survey
The process of collation of information, such as record of rights (RoR) and
khasra maps, from the Revenue authorities was initiated and completed. The
team was met District Magistrates/ Collectors (DM/ DC) of districts Pithoragarh,
Champawat and Almora, and appraised them about the Pancheshwar
Multipurpose Project, the property and socio-economic study, information and
data required for the study, and requested assistance of the Revenue
Department to share the required information. Subsequent to the meeting,

PANCHESHWAR MULTIPURPOSE PROJECT SIA Study Report
Chapter 4: Data Analysis of Socio-Economic Survey Page 6
respective DMs directed their officers and concerned staff to extend all possible
support and assistance. On the directions of the respective DMs, team
members met respective Sub-Divisional Magistrates (SDM), Tehsildars,
Patwaris, Land Record Section Officer and Staff. The comprehensive list of
affected villages was verified and updated and subsequently revenue maps for
the affected villages were collected.
At headquarters, collected khasra maps were scanned and superimposed on the
submergence area map to delineate the affected/ impacted zone. Thereafter, a
list of all the plots/ khasra, likely to be acquired/ impacted was listed down. This
was extensively used to gather Right of Records (RoRs). The State of
Uttarakhand has computerized and uploaded RoRs on their website:
www.devbhumi.uk.gov.in which was used to collate RoRs of the affected
villages. These analyses led to enumeration of affected persons/ families/ land
titleholders likely to lose land, land and homesteads and homesteads only.
A list of affected persons/ families/ land titleholders was prepared, which was
used to identify them in the field for conducting socio-economic survey in the
affected villages. Thus, for the purpose of identification of PAFs in the affected
villages, this list of affected persons/ families/ land titleholders was used, and
30% stratified random sample survey of affected families was conducted.
For the process of primary data collection, a survey team comprising of local
educated youths was formed. It was ensured that the members of the survey
team (investigators/ surveyors) were educated, well acquainted with Hindi
language (as the schedules were to be filled-in this language) and at the same
time that they were well versed with the local customs and language. Training
was imparted to the members of the survey team, wherein they were appraised
about the purpose of the survey and on the method of consultations with the
affected families/ persons and how to use GPS and filled-in the survey schedule.
The survey team traversed the submergence area and dam alignment and
visited the affected villages for conducting the socio-economic survey. Based on
the list of project affected families prepared from the Khasra details, Survey
coordinator delineated the stratified random 30% sample of PAFs. A list of such
PAFs was prepared and shared by the investigators and used to identify the
PAFs in the field and canvass them. A considerable time was spent in reaching
many of these villages. Upon reaching the affected villages, they contacted
the Village Panchayat/ Panchayat member or secretary and appraised them
about the survey work and required information.
At the end of each day’s work the filled-in data checklists were cleaned for
internal discrepancies. The survey team coordinator ensured that the survey

PANCHESHWAR MULTIPURPOSE PROJECT SIA Study Report
Chapter 4: Data Analysis of Socio-Economic Survey Page 7
team members eliminated the internal discrepancies and filled-in the missing
information in the survey schedules. The gathered information was thereafter
computerized. This keyed-in information/data was then analyzed and inferences
were drawn using Microsoft Excel computer software.
This socio-economic survey report has been prepared for the entire 134 project
affected villages and at the end of the survey, the survey team contacted 1965
project affected families as part of the stratified random sample survey.
4.2.2 Findings of Socio-economic survey
A total of 11776 families from 111 affected villages were covered as a part of
the survey in Pancheshwar Multipurpose Project.120 families from 11 affected
villages were surveyed for Rupaligad Project. Thus a total of 11896 families in
122 affected villages were covered as a part of the survey.
Religious affiliation
The village-wise religious orientation of the surveyed population is depicted in
Table-4.2 and Figure-4.1. Among the sample population, a large majority 99.53%
of the surveyed population follows the Hindu faith. Only 0.32% PAFs were
Mulsim. For the remaining data on their religious faith was not available. The
religious affiliation of 0.16% the surveyed families is not defined. In the
Rupaligad RDP the entire sample PAFs follows the Hindu faith.
Table-4.2: Religious Affiliation of the Project Affected Families
S. No
Project Affected
Village Name Hindu Muslim DNA Total
Pancheshwar MPDP (A)
1 Nisni 10 10
2 Gogana 39 39
3 Rarikhuti 18 18
4 Jamrari 19 19
5 Kharku Bhalya 12 12
6
Matiyal/Matiyala
Chakwali 6 6
7 Bhalya 22 22
8 Upertola 8 8
9 Pati Palchaura 10 10
10 Salla 20 20
11 Sail 18 18
12 Taremia 25 25

PANCHESHWAR MULTIPURPOSE PROJECT SIA Study Report
Chapter 4: Data Analysis of Socio-Economic Survey Page 8
S. No
Project Affected
Village Name Hindu Muslim DNA Total
13 Haldu 40 40
14 Kwerali 9 9
15 Sakun 22 22
16 Dhyan 5 5
17 Kuteri 8 8
18 Tarigaon 28 28
19 Gyal Pipli 7 7
20 Baunkot 14 14
21 Baltari 52 1 53
22 Gaurihat 23 23
23 Rajyoura 18 18
24 Kanari 45 45
25 Majirakanda 53 53
26 Getigada 27 1 28
27 Bhateri 1 1
28 Amtari 36 36
29 Ranuwa 11 11
30 Bathauli 3 3
31 Dyora 19 19
32 Sunkholi 8 8
33 Panthsera 17 17
34 Syuwan 3 3
35 Dwalishera 21 21
36 Ghighrani 19 19
37 Sailoni 13 13
38 Chamtoli 8 8
39 Titri 30 30
40 Bagadihat 27 27
41 Bheliya 1 1
42 Jogyura 12 12
43 Garjiya 19 19
44 Jamtari 7 7
45 Oltari 16 16
46 Daulani 7 7
47 Tham 4 4
48 Duti Bagar 66 6 72
49 Dungatoli 13 13
50 Kimkhola 14 14
51 Bokata 18 18
52 Bungli 20 20
53 Bursum Bari 15 15
54 Dandadhar 10 10

PANCHESHWAR MULTIPURPOSE PROJECT SIA Study Report
Chapter 4: Data Analysis of Socio-Economic Survey Page 9
S. No
Project Affected
Village Name Hindu Muslim DNA Total
55 Dubola Birtola 9 9
56 Kuntola 17 17
57 Tudil 10 10
58 Nali 15 15
59 Seragada 9 9
60 Sinoli Bhamalta 7 7
61 Jartola 1 1
62 Rasyun 21 21
63 Kharkoli 19 19
64 Askora 16 16
65 Pali 8 8
66 Raitoli 20 20
67 Rautora 9 9
68 Timta Chamdungra 20 20
69 Damde 13 13
70 Chaur Ghurelli 9 9
71 Sibna 6 6
72 Busail 21 21
73 Garali 12 12
74
Anwala Talla Malla
Sugar Mavla 7 7
75 Dhajari 9 9
76 Diyuri 12 12
77 Suwal 6 6
78 Tallisar 23 23
79 Khatigaon 13 13
80 Nali Malli 27 27
81 Umer 6 6
82 Bamori/Bamori Khalsa 14 14
83 Ara Salpar 35 35
84 Kola 6 6
85 Kunj Kimola 31 31
86 Mayoli 3 3
87 Dasoli Badiyar 11 11
88 Kuna Pokhri 7 7
89 Uncha Beragunth 23 23
90 Nali Talli 13 13
91 Dhura Laga Tank 18 18
92 Dhankana 5 5
93 Nayal Dhura 20 20
94 Padoli 3 3
95 Jingal 20 20

PANCHESHWAR MULTIPURPOSE PROJECT SIA Study Report
Chapter 4: Data Analysis of Socio-Economic Survey Page 10
S. No
Project Affected
Village Name Hindu Muslim DNA Total
96 Chimkholi 13 13
97 Betta 6 6
98 Sulan 6 6
99 Polap 3 3
100 Sugarkhal 15 15
101 Batauri Mug Gunth 20 20
102 Kothera 17 17
103 Sigra 17 17
104 Bruyuri 4 4
105 Gaika jhula 6 6
106 Khaikot Talla 11 11
107 Bibil 27 27
108 Simalkhet 21 21
109 Khai Khot Malla 11 1 12
110 Choolagaon 13 13
111 Raygaon 27 27
Subtotal (A) 1767 6 3 1776
Rupaligad RDP (B)
112 Netra 15 15
113 Bachkot 2 2
114 Nidil 17 17
115 Jindi Sorari 14 14
116 Bhagauti 1 1
117 Dungraleti 22 22
118 Pasam 15 15
119 Ashlad 3 3
120 Jamarso 12 12
121 Matiyani 6 6
122 Chiliniya 13 13
Subtotal (B) 120 0 0 120
Total(A+B) 1887 6 3 1896
Source: Primary Survey

PANCHESHWAR MULTIPURPOSE PROJECT SIA Study Report
Chapter 4: Data Analysis of Socio-Economic Survey Page 11
Figure-4.1: Details of the Religious Affiliation of the PAFs
b) Demographic Profile
Based on the findings of the survey, it is observed that the sex ratio amongst
the project affected families is 853 females per thousand males. The sex ratio
for Pancheshwar MPDP and Rupaligad project is 859/1000 males and
814/1000 males respectively.
In Pancheshwar MPDP low sex ratio (below 800 females/1000 males) was
observed in 58 villages. In Rupaligad, low sex ratio, it was observed in 7
villages. The sex ratio was observed to be between 800 and 1000 in 27
villages in Pancheshwar MPDP and 3 villages of Rupaligad RDP. Equal
percentage of male and female population was observed in Taremia, Kwerali,
Bathauli, Bursam Bari, Sibana, and Sigra, and village Nidil in Rupaligad. In all
there are 30 villages (29 in Pancheshwar MPDP and 1 village in Rupaligad
RDP) where in female population was more than male population. The village
wise details of male and female population are given in Table-4.3.
Table-4.3: Demographic Profile of the PAFs
S. No Project Affected
Villages
Female
Population
Male
Population
Sex
Ratio DNA Total
PANCHESHWAR MPDP
1 Nisni 42 33 1273 0 75
2 Gogana 210 263 798 0 473
3 Rarikhuti 20 34 588 0 54
4 Jamrari 105 82 1280 0 187
5 Kharku Bhalya 48 43 1116 0 91
6 Matiyal/ Matiyal
Chakawali 43 39 1103 0 82
7 Bhalya 51 57 895 0 108
0
500
1000
1500
2000
HINDU MUSLIM DNA TOTAL
Pancheshwar MPDP Rupaligad RDP

PANCHESHWAR MULTIPURPOSE PROJECT SIA Study Report
Chapter 4: Data Analysis of Socio-Economic Survey Page 12
S. No Project Affected
Villages
Female
Population
Male
Population
Sex
Ratio DNA Total
8 Upertola 77 61 1262 0 138
9 Pati Palchaura 37 39 949 0 76
10 Salla 20 21 952 0 41
11 Sail 64 52 1231 0 116
12 Taremia 157 157 1000 0 314
13 Haldu 134 129 1039 0 263
14 Kwerali 11 11 1000 0 22
15 Sakun 86 125 688 0 211
16 Dhyan 27 20 1350 0 47
17 Kuteri 24 27 889 0 51
18 Tarigaon 122 94 1298 0 216
19 Gyal Pipli 18 16 1125 0 34
20 Baunakot 38 24 1583 0 62
21 Baltari 88 114 772 0 202
22 Gaurihat 95 76 1250 0 171
23 Rajyoura 59 56 1054 0 115
24 Kanari 131 174 753 0 305
25 Majirkanda 199 195 1021 0 394
26 Getigada 48 76 632 0 124
27 Bhateri 9 6 1500 0 15
28 Amtari 85 121 702 0 206
29 Ranuwa 37 44 841 0 81
30 Bathauli 3 3 1000 0 6
31 Dyora 51 63 810 0 114
32 Sunkholi 15 20 750 0 35
33 Pantsera 5 12 417 0 17
34 Syuwan 6 15 400 0 21
35 Dwali Sera 119 134 888 0 253
36 Ghighrani 115 114 1009 0 229
37 Sailoni 20 49 408 0 69
38 Chamtoli 30 34 882 0 64
39 Titri 83 118 703 0 201
40 Bagadihat 180 170 1059 0 350
41 Bheliya 6 5 1200 0 11
42 Jogyoura 69 48 1438 0 117
43 Garjiya 75 58 1293 0 133
44 Jamtari 14 22 636 0 36
45 Oltari 32 53 604 0 85
46 Daulani 13 14 929 0 27
47 Tham 16 25 640 0 41
48 Duti Bagar 128 201 637 0 329
49 Dungatoli 33 46 717 0 79

PANCHESHWAR MULTIPURPOSE PROJECT SIA Study Report
Chapter 4: Data Analysis of Socio-Economic Survey Page 13
S. No Project Affected
Villages
Female
Population
Male
Population
Sex
Ratio DNA Total
50 Kimkhola 91 85 1071 0 176
51 Bokata 34 35 971 0 69
52 Bungli 28 36 778 0 64
53 Bursum Bari 53 53 1000 0 106
54 Dandadhar 3 7 429 0 10
55 Dubola Birtola 58 52 1115 0 110
56 Kuntola 12 19 632 0 31
57 Tudil 38 48 792 0 86
58 Nali 84 73 1151 0 157
59 Seraghara 25 29 862 0 54
60 Sinoli Bhamalta 55 53 1038 0 108
61 Jartola 1 0 0 1
62 Rasyun 200 190 1053 0 390
63 Kharkoli 180 164 1098 0 344
64 Askora 124 106 1170 1 231
65 Pali 21 27 778 0 48
66 Raitola 77 100 770 0 177
67 Rautora 17 40 425 0 57
68 Timta Chamdungra 72 73 986 0 145
69 Damde 57 77 740 0 134
70 Chaur Ghurelli 15 17 882 0 32
71 Sibana 7 7 1000 0 14
72 Busail 44 77 571 0 121
73 Garali 21 38 553 0 59
74 Anwala Talla Malla
Sugar Mavla 26 31 839 0 57
75 Dhajari 13 32 406 0 45
76 Dyuri 25 32 781 0 57
77 Suwal 12 19 632 0 31
78 Tallisar 47 92 511 0 139
79 Khatigaon 17 41 415 0 58
80 Nali Malli 11 24 458 0 35
81 Umer 31 37 838 0 68
82 Bamori Khalsa/
Bamori 30 44 682 0 74
83 Ara Salphar 128 165 776 0 293
84 Kola 14 21 667 0 35
85 Kunj Kimola 43 110 391 0 153
86 Mayoli 5 9 556 0 14
87 Dasoli Badiyar 15 23 652 0 38
88 Kuna Pokhri 13 22 591 0 35
89 Uncha Beragunth 6 11 545 0 17

PANCHESHWAR MULTIPURPOSE PROJECT SIA Study Report
Chapter 4: Data Analysis of Socio-Economic Survey Page 14
S. No Project Affected
Villages
Female
Population
Male
Population
Sex
Ratio DNA Total
90 Nali Talli 1 20 50 0 21
91 Dhura Laga Tank 37 55 673 0 92
92 Dhankana 37 29 1276 0 66
93 Nayal Dhura 68 109 624 0 177
94 Padoli 8 9 889 0 17
95 Jingal 37 51 725 0 88
96 Chimkholi 44 60 733 0 104
97 Beta 7 11 636 0 18
98 Sulan 16 23 696 0 39
99 Polap 5 11 455 0 16
100 Sugar Khal 30 41 732 0 71
101 Batauri Mug Gunth 139 163 853 0 302
102 Kothere 45 57 789 0 102
103 Sigra 87 87 1000 0 174
104 Bruyuri 19 13 1462 0 32
105 Gaika Jyula 7 16 438 0 23
106 Khai Kot Talla 32 33 970 0 65
107 Simalkhet 52 71 732 0 123
108 Khaikot Malla 17 33 515 0 50
109 Choolgaon 17 25 680 0 42
110 Raygaon 42 53 792 0 95
Pancheshwar
MPDP Total 5634 6555 859 1 12190
RUPALIGAD RDP
112 Netra 91 92 989 0 183
113 Bachkot 2 4 500 0 6
114 Nidil 44 44 1000 0 88
115 Jindi Sorari 24 40 600 0 64
116 Bhagauti 1 2 500 0 3
117 Dungraleti 70 83 843 0 153
118 Pasam 24 48 500 0 72
119 Ashlad 10 14 714 24
120 Jamarso 60 52 1154 112
121 Matiyali 34 57 596 91
122 Chilniya 20 31 645 51
Rupaligad RDP
Total 380 467 814 0 847
TOTAL 6014 7022 856 1 13037
Source: Primary Survey

PANCHESHWAR MULTIPURPOSE PROJECT SIA Study Report
Chapter 4: Data Analysis of Socio-Economic Survey Page 15
c) Marital Status
Information pertaining to marital status of the affected population was also
collected. The village-wise details are depicted in Figure-4.2 and village wise
details are given in Table-4.4. Overall, out of the total surveyed population,
single, married, widows, widowers and divorcees comprise of 33.66%,
65.07%, 0.95%, 0.31% and 0.01% respectively. Out of the total surveyed
population of Pancheshwar MPDP the single, married, widows, widowers and
divorcees comprised 33.69%, 65.02%, 0.94%, 0.33% and 0.01% respectively
of the total population. Like-wise, of the total surveyed population of
Rupaligad RDP, single, married, and widows comprised 33.18%, 65.76%,
and 1.06% respectively. Divorcees and widowers were not observed amongst
the population in Rupaligad RDP area.
Table-4.4: Marital status of the Surveyed Population
S. No Villages
Name
Divorced Married Widow Widower DNA Single Total
Pancheshwar MPDP (A)
1 Nisni 0 49 75
2 Gogana 0 352 3 118 473
3 Rarikhuti 0 25 1 11 17 54
4 Jamrari 0 113 4 70 187
5 Kharku
Bhalya
0 64 2 25 91
6 Matiyal/
Matiyal
Chakawali
0 52 30 82
7 Bhalya 0 57 51 108
8 Upertola 88 2 48 138
9 Pati
Palchaura
0 41 2 33 76
10 Salla 0 23 18 41
11 Sail 0 66 5 45 116
12 Taremia 0 166 5 143 314
13 Haldu 0 149 1 113 263
14 Kwerali 0 12 10 22
15 Sakun 0 141 4 66 211
16 Dhyan 0 33 14 47
17 Kuteri 0 44 7 51
18 Tarigaon 0 139 5 72 216
19 Gyal Pipli 0 22 12 34
20 Baunakot 0 41 1 20 62

PANCHESHWAR MULTIPURPOSE PROJECT SIA Study Report
Chapter 4: Data Analysis of Socio-Economic Survey Page 16
S. No Villages
Name
Divorced Married Widow Widower DNA Single Total
21 Baltari 0 183 2 17 202
22 Gaurihat 0 119 1 51 171
23 Rajyoura 0 64 1 50 115
24 Kanari 0 189 1 115 305
25 Majirkanda 1 225 9 1 158 394
26 Getigada 0 98 1 25 124
27 Bhateri 0 9 6 15
28 Amtari 0 170 36 206
29 Ranuwa 0 58 23 81
30 Bathauli 0 4 2 6
31 Dyora 0 85 29 114
32 Sunkholi 0 20 15 35
33 Pantsera 0 11 6 17
34 Syuwan 0 18 3 21
35 Dwali Sera 0 159 4 90 253
36 Ghighrani 0 120
229
37 Sailoni 0 51 2 3 13 69
38 Chamtoli 0 52 12 64
39 Titri 0 160 41 201
40 Bagadihat 0 210 7 133 350
41 Bheliya 0 5 6 11
42 Jogyoura 0 72 1 44 117
43 Garjiya 0 79 1 53 133
44 Jamtari 0 17 19 36
45 Oltari 0 62 23 85
46 Daulani 0 24 3 27
47 Tham 0 20 1 20 41
48 Duti Bagar 0 242 1 86 329
49 Dungatoli 0 51 2 26 79
50 Kimkhola 0 99 1 76 176
51 Bokata 0 42 27 69
52 Bungli 0 54 10 64
53 Bursum Bari 0 59 4 43 106
54 Dandadhar 0 6 4 10
55 Dubola
Birtola
0 64 3 43 110
56 Kuntola 0 23 8 31
57 Tudil 0 54 32 86
58 Nali 0 93 64 157
59 Seraghara 0 21 3 30 54
60 Sinoli 0 57 1 50 108

PANCHESHWAR MULTIPURPOSE PROJECT SIA Study Report
Chapter 4: Data Analysis of Socio-Economic Survey Page 17
S. No Villages
Name
Divorced Married Widow Widower DNA Single Total
Bhamalta
61 Jartola 0 1 1
62 Rasyun 0 232 2 156 390
63 Kharkoli 0 203 4 137 344
64 Askora 0 149 3 1 78 231
65 Pali 0 37 11 48
66 Raitola 0 97 3 77 177
67 Rautora 0 48 9 57
68 Timta
Chamdungra
0 83 62 145
69 Damde 0 77 57 134
70 Chaur
Ghurelli
0 20 1 11 32
71 Sibana 0 5 1 8 14
72 Busail 0 90 31 121
73 Garali 0 45 14 59
74 Anwala Talla
Malla Sugar
0 29 1 27 57
Mavla
75 Dhajari 0 23 3 19 45
76 Dyuri 0 42 3 12 57
77 Suwal 0 24 7 31
78 Tallisar 0 99 40 139
79 Khatigaon 0 51 3 4 58
80 Nali Malli 0 25 10 35
81 Umer 0 48 20 68
82 Bamori
Khalsa/
Bamori
0 48 26 74
83 Ara Salphar 0 161 2 130 293
84 Kola 0 20 15 35
85 Kunj Kimola 0 121 32 153
86 Mayoli 0 11 1 2 14
87 Dasoli
Badiyar
0 38 38
88 Kuna Pokhri 0 32 3 35
89 Uncha
Beragunth
0 12 5 17
90 Nali Talli 0 13 5 3 21
91 Dhura Laga
Tank
0 53 3 1 35 92
92 Dhankana 0 30 1 35 66

PANCHESHWAR MULTIPURPOSE PROJECT SIA Study Report
Chapter 4: Data Analysis of Socio-Economic Survey Page 18
S. No Villages
Name
Divorced Married Widow Widower DNA Single Total
93 Nayal Dhura 0 118 1 58 177
94 Padoli 0 13 4 17
95 Jingal 0 62 26 88
96 Chimkholi 0 74 30 104
97 Beta 0 14 4 18
98 Sulan 0 28 11 39
99 Polap 0 10 6 16
100 Sugar Khal 0 59 12 71
101 Batauri Mug
Gunth
0 176 126 302
102 Kothere 0 65 37 102
103 Sigra 0 107 3 64 174
104 Bruyuri 0 24 1 7 32
105 Gaika Jyula 0 14 9 23
106 Khai Kot
Talla
0 63 2 65
107 Bibil 0 71 38 109
108 Simalkhet 0 87 1 35 123
109 Khaikot
Malla
0 33 16 1 50
110 Choolgaon 0 28 14 42
111 Raygaon 0 87 8 95
Subtotal(A) 1 7926 115 40 1 4107 121
90
RUPALIGAD RDP (B)
112 Netra 0 110 3 70 183
113 Bachkot 0 5 1 6
114 Nidil 0 88 88
115 Jindi Sorari 0 48 16 64
116 Bhagauti 0 2 1 3
117 Dungraleti 0 86 2 65 153
118 Pasam 0 48 24 72
119 Ashlad 0 16 1 7 24
120 Jamarso 0 66 46 112
121 Matiyali 0 43 2 46 91
122 Chilniya 0 45 1 5 51
Subtotal(B) 0 557 9 0 0 281 847
Grand total(A+B) 1 8483 124 40 1 4388 130
37
Source: Primary Survey

PANCHESHWAR MULTIPURPOSE PROJECT SIA Study Report
Chapter 4: Data Analysis of Socio-Economic Survey Page 19
Figure-4.2: Marital Status of the Surveyed Population
d) Migration Pattern
The information on migration patterns and trend among the surveyed
population were also collected as a part of the study. The village-wise details of
resident and non-resident population are given in Table-4.5. The resident
population accounts for about 84.32% of the total population, and the remaining
(15.68%) is non-resident population (Refer Figure-4.3). During the survey, it
was gathered that the non-resident population had migrated to various places,
and have settled-down permanently or temporarily.
Figure-4.4 reflects that a large majority of the non-resident population has
migrated to various parts of the Uttarakhand, while 42.07% have migrated to
other states, i.e., Delhi, Punjab, Assam, Arunachal Pradesh, Chattisgarh,
Madhya Pradesh, etc. A small proportion (1.22%) of the non-resident
population has migrated abroad as well to countries like USA and Malaysia.
The reasons of migration from the villages are depicted in Figure-4.6. About
60.1% have migrated in search of jobs and vocations, 28.1% as a result of
marriage, mainly comprising of women-folk, and 4.8% who have migrated to
stay with their family members. About 7% comprising of students, have
migrated for educational purposes as well. A minuscule proportion (0.1%) has
migrated for training purposes.
Pancheshwar MPDP
Rupaligad RDP
0
2000
4000
6000
8000
Divorced Married Widow Widower DNA
7926
115 40 1
4107
9 0 0 281847
Pancheshwar MPDP Rupaligad RDP

PANCHESHWAR MULTIPURPOSE PROJECT SIA Study Report
Chapter 4: Data Analysis of Socio-Economic Survey Page 20
Table-4.5: Village wise details of Migration Pattern of surveyed PAFs
S. No Village Name Resident
Population
Non-Resident
Population
Total
Pancheshwar MPDP
(A)
1 Nisni 59 16 75
2 Gogana 420 53 473
3 Rarikhuti 46 8 54
4 Jamrari 130 57 187
5 Kharku Bhalya 62 29 91
6 Matiyal/ Matiyal
Chakawali
61 21 82
7 Bhalya 108 108
8 Upertola 104 34 138
9 Pati Palchaura 67 9 76
10 Salla 29 12 41
11 Sail 86 30 116
12 Taremia 241 73 314
13 Haldu 206 57 263
14 Kwerali 6 16 22
15 Sakun 166 45 211
16 Dhyan 16 31 47
17 Kuteri 44 7 51
18 Tarigaon 164 52 216
19 Gyal Pipli 16 18 34
20 Baunakot 62 62
21 Baltari 180 22 202
22 Gaurihat 123 48 171
23 Rajyoura 98 17 115
24 Kanari 259 46 305
25 Majirkanda 311 83 394
26 Getigada 113 11 124
27 Bhateri 14 1 15
28 Amtari 181 25 206
29 Ranuwa 72 9 81
30 Bathauli 6 6
31 Dyora 111 3 114
32 Sunkholi 34 1 35
33 Pantsera 15 2 17
34 Syuwan 20 1 21
35 Dwali Sera 218 35 253
36 Ghighrani 203 26 229
37 Sailoni 61 8 69

PANCHESHWAR MULTIPURPOSE PROJECT SIA Study Report
Chapter 4: Data Analysis of Socio-Economic Survey Page 21
S. No Village Name Resident
Population
Non-Resident
Population
Total
38 Chamtoli 45 19 64
39 Titri 179 22 201
40 Bagadihat 284 66 350
41 Bheliya 10 1 11
42 Jogyoura 82 35 117
43 Garjiya 104 29 133
44 Jamtari 36 36
45 Oltari 71 14 85
46 Daulani 22 5 27
47 Tham 36 5 41
48 Duti Bagar 317 12 329
49 Dungatoli 76 3 79
50 Kimkhola 158 18 176
51 Bokata 61 8 69
52 Bungli 53 11 64
53 Bursum Bari 89 17 106
54 Dandadhar 6 4 10
55 Dubola Birtola 87 23 110
56 Kuntola 25 6 31
57 Tudil 71 15 86
58 Nali 122 35 157
59 Seraghara 46 8 54
60 Sinoli Bhamalta 101 7 108
61 Jartola 1 1
62 Rasyun 287 103 390
63 Kharkoli 282 62 344
64 Askora 163 68 231
65 Pali 40 8 48
66 Raitola 146 31 177
67 Rautora 46 11 57
68 Timta Chamdungra 132 13 145
69 Damde 113 21 134
70 Chaur Ghurelli 25 7 32
71 Sibana 12 2 14
72 Busail 111 10 121
73 Garali 47 12 59
74 Anwala Talla Malla
Sugar Mavla
56 1 57
75 Dhajari 33 12 45
76 Dyuri 53 4 57
77 Suwal 27 4 31
78 Tallisar 110 29 139

PANCHESHWAR MULTIPURPOSE PROJECT SIA Study Report
Chapter 4: Data Analysis of Socio-Economic Survey Page 22
S. No Village Name Resident
Population
Non-Resident
Population
Total
79 Khatigaon 42 16 58
80 Nali Malli 33 2 35
81 Umer 63 5 68
82 Bamori Khalsa/
Bamori
65 9 74
83 Ara Salphar 244 49 293
84 Kola 35 35
85 Kunj Kimola 114 39 153
86 Mayoli 10 4 14
87 Dasoli Badiyar 38 38
88 Kuna Pokhri 32 3 35
89 Uncha Beragunth 17 17
90 Nali Talli 21 21
91 Dhura Laga Tank 72 20 92
92 Dhankana 62 4 66
93 Nayal Dhura 163 14 177
94 Padoli 17 17
95 Jingal 79 9 88
96 Chimkholi 98 6 104
97 Beta 18 18
98 Sulan 36 3 39
99 Polap 15 1 16
100 Sugar Khal 70 1 71
101 Batauri Mug Gunth 264 38 302
102 Kothere 88 14 102
103 Sigra 163 11 174
104 Bruyuri 26 6 32
105 Gaika Jyula 23 23
106 Khai Kot Talla 65 65
107 Bibil 109 109
108 Simalkhet 113 10 123
109 Khaikot Malla 50 50
110 Choolgaon 42 42
111 Raygaon 94 1 95
Subtotal(A) 10258 1932 12190
Rupaligad RDP(B)
112 Netra 149 34 183
113 Bachkot 5 1 6
114 Nidil 88 88
115 Jindi Sorari 64 64
116 Bhagauti 3 3
117 Dungraleti 133 20 153

PANCHESHWAR MULTIPURPOSE PROJECT SIA Study Report
Chapter 4: Data Analysis of Socio-Economic Survey Page 23
S. No Village Name Resident
Population
Non-Resident
Population
Total
118 Pasam 69 3 72
119 Ashlad 22 2 24
120 Jamarso 83 29 112
121 Matiyali 70 21 91
122 Chilniya 49 2 51
Subtotal(B) 735 112 847
TOTAL 10993 2044 13037
Source: Primary Survey
Figure-4.3: Resident and Non-resident surveyed population
Figure-4.4: Places of migration

PANCHESHWAR MULTIPURPOSE PROJECT SIA Study Report
Chapter 4: Data Analysis of Socio-Economic Survey Page 24
Figure-4.5: Reasons for migration among sample population
e) Caste profile
As part of the socio-economic survey, information on caste profile of the
surveyed population was also gathered. The project area is dominated by the
General caste group comprising of Brahmins, Kshatriyas (Thakurs) and
Vaishyas, and account for about 83.13% of the total surveyed population. The
second largest group is that of scheduled castes who comprise 13.24% of the
total surveyed population. Backward Caste group constitutes 2.4% of the total
surveyed population. Scheduled Tribe population accounts for 0.15% of the total
surveyed population. About 1.09% of respondents did not disclose their caste
during the survey.
Out of the total surveyed population it has been observed that in the
Pancheshwar MPDP, large majority of the surveyed population 82.47% belonged
to the General Caste, followed by Scheduled Castes (13.69%), and Backward
Castes (2.54%). Scheduled Tribe population is present in very small proportion
(0.16%) to the total surveyed population. Caste details of 1.14% of the surveyed
population could not be established.
In the Rupaligad RDP villages, General Caste dominated the society, comprising
of 94.44% of the total surveyed population, followed by the Scheduled Caste
(5.56%). The village wise Caste Profile of the PAFs is elucidated in Table-4.6
and Figure-4.6 respectively.

PANCHESHWAR MULTIPURPOSE PROJECT SIA Study Report
Chapter 4: Data Analysis of Socio-Economic Survey Page 25
Table-4.6: Caste Profile of surveyed Project Affected Families
S. No Village Name Backward
Caste
General
Caste
Schedule
Caste
Schedule
Tribe DNA Total
Pancheshwar
MPDP (A) 0 0 0 0 0
1 Nisni 0 9 1 0 0 10
2 Gogana 0 36 3 0 0 39
3 Rarikhuti 0 18 0 0 0 18
4 Jamrari 0 19 0 0 0 19
5 Khadku Bhalya 1 11 0 0 0 12
6 Matiyal 0 6 0 0 6
7 Bhalya 1 6 15 0 0 22
8 Upertola 0 8 0 0 8
9 Pati Palchaura 1 9 0 0 0 10
10 Salla 0 20 0 0 0 20
11 Sail 0 10 7 0 1 18
12 Taremia 0 17 8 0 0 25
13 Haldu 0 29 11 0 0 40
14 Kwerali 0 4 5 0 0 9
15 Sakun 1 20 1 0 0 22
16 Dhyan 0 4 1 0 0 5
17 Kuteri 0 8 0 0 0 8
18 Tarigaon 0 25 3 0 0 28
19 Gyal Pipli 0 7 0 0 0 7
20 Baunkot 0 5 9 0 0 14
21 Baltari 0 44 6 0 3 53
22 Gaurihat 0 23 0 0 0 23
24 Rajyoura 0 13 5 0 0 18
25 Kanari 0 45 0 0 0 45
26 Majirakanda 2 45 6 0 0 53
27 Getigada 0 23 1 0 4 28
28 Bhateri 0 1 0 0 0 1
29 Amtari 2 29 2 0 3 36
30 Ranuwa 0 7 1 0 3 11
31 Bathauli 0 3 0 0 0 3
32 Dyora 0 15 3 0 1 19
33 Sunkholi 0 8 0 0 0 8
34 Panthsera 0 15 2 0 0 17
35 Syuwan 0 3 0 0 0 3
36 Dwalishera 0 12 9 0 0 21
37 Ghighrani 0 5 14 0 0 19
38 Sailoni 0 13 0 0 0 13
39 Chamtoli 0 8 0 0 0 8

PANCHESHWAR MULTIPURPOSE PROJECT SIA Study Report
Chapter 4: Data Analysis of Socio-Economic Survey Page 26
S. No Village Name Backward
Caste
General
Caste
Schedule
Caste
Schedule
Tribe DNA Total
40 Titri 0 16 13 0 1 30
41 Bagadihat 0 13 14 0 0 27
42 Bheliya 0 1 0 0 0 1
43 Jogyura 0 7 5 0 0 12
44 Garjiya 1 15 3 0 0 19
45 Jamtari 0 7 0 0 0 7
46 Oltari 0 6 10 0 0 16
47 Daulani 0 7 0 0 0 7
49 Thaam 0 4 0 0 0 4
50 Duti Bagar 13 47 9 3 0 72
51 Dungatoli 0 13 0 0 0 13
52 Kimkhola 0 11 3 0 0 14
53 Bokata 2 15 1 0 0 18
54 Bungli 1 14 5 0 0 20
55 Bursum Bari 0 15 0 0 0 15
56 Dandadhar 0 10 0 0 0 10
57 Dubola Birtola 3 6 0 0 0 9
59 Kuntola 0 14 3 0 0 17
60 Tudil 0 3 7 0 0 10
61 Nali 1 14 0 0 0 15
62 Seragada 0 9 0 0 0 9
63 Sinoli
Bhamalta 0 7 0 0 0 7
64 Jartola 0 1 0 0 0 1
65 Rasyun 0 21 0 0 0 21
66 Kharkoli 0 19 0 0 0 19
67 Askora 0 16 0 0 0 16
68 Pali 0 3 4 0 1 8
69 Raitoli 0 19 1 0 0 20
70 Rautora 0 9 0 0 0 9
71 Timta
Chamdungra 10 10 0 0 0 20
72 Damde 0 1 12 0 0 13
74 Chaur Ghurelli 0 9 0 0 0 9
76 Sibna 0 6 0 0 0 6
78 Busail 1 17 1 0 2 21
79 Garali 0 12 0 0 0 12
80
Anwala Talla
Malla Sugar
Mavla
0 7 0 0 0 7
82 Dhajari 0 9 0 0 0 9
83 Diyuri 0 11 0 0 1 12

PANCHESHWAR MULTIPURPOSE PROJECT SIA Study Report
Chapter 4: Data Analysis of Socio-Economic Survey Page 27
S. No Village Name Backward
Caste
General
Caste
Schedule
Caste
Schedule
Tribe DNA Total
84 Suwal 0 6 0 0 0 6
85 Tallisar 0 12 11 0 0 23
86 Khatigaon 0 13 0 0 0 13
88 Nali Malli 0 25 2 0 0 27
89 Umer 0 5 1 0 0 6
90 Bamori 0 14 0 0 0 14
91 Ara Salpar 0 33 2 0 0 35
92 Kola 0 6 0 0 0 6
93 Kunj Kimola 2 25 4 0 0 31
94 Mayoli 0 3 0 0 0 3
96 Dasoli Badiyar 0 9 2 0 0 11
97 Kuna Pokhri 0 7 0 0 0 7
98 Uncha
Beragunth 0 21 2 0 0 23
100 Nali Talli 0 13 0 0 0 13
101 Dhura Laga
Tank 0 18 0 0 0 18
103 Dhankana 0 5 0 0 0 5
105 Nayal Dhura 0 20 0 0 0 20
106 Padoli 0 3 0 0 0 3
107 Jingal 0 20 0 0 0 20
108 Chimkholi 0 13 0 0 0 13
109 Betta 0 6 0 0 0 6
110 Sulan 0 6 0 0 0 6
113 Polap 0 3 0 0 0 3
114 Sugarkhal 0 15 0 0 0 15
115 Botari Mug
Gunth 0 16 4 0 0 20
116 Kothera 0 17 0 0 0 17
117 Sigra 0 17 0 0 0 17
118 Bruyuri 0 3 1 0 0 4
119 Gaika jhula 0 6 0 0 0 6
120 Khaikot Talla 0 10 1 0 0 11
128 Bibil 0 27 0 0 0 27
130 Simalkhet 0 21 0 0 0 21
131 Khai Khot
Malla 5 6 0 0 1 12
132 Choolagaon 0 12 1 0 0 13
133 Raygaon 0 27 0 0 0 27
Subtotal (A) 47 1456 249 3 21 1776

PANCHESHWAR MULTIPURPOSE PROJECT SIA Study Report
Chapter 4: Data Analysis of Socio-Economic Survey Page 28
S. No Village Name Backward
Caste
General
Caste
Schedule
Caste
Schedule
Tribe DNA Total
RUPALIGAD RDP (B)
111 Netra 0 15 0 0 0 15
112 Bachkot 0 1 1 0 0 2
0 0 0 0
121 Nidil 0 17 0 0 0 17
122 Jindi Sorari 0 14 0 0 0 14
123 Bhagauti 0 1 0 0 0 1
124 Dungraleti 0 20 2 0 0 22
125 Pasam 0 12 3 0 0 15
126 Ashlad 0 3 0 0 0 3
127 Jamarso 0 12 0 0 0 12
129 Matiyani 0 6 0 0 0 6
134 Chiliniya 0 13 0 0 0 13
Subtotal (B) 0 114 6 0 0 120
Total (A+B) 47 1570 255 3 21 1896
Source: Primary Survey
Figure-4.6: Caste Profile of surveyed PAFs
f) Educational Profile
The village-wise educational profile among the surveyed population collected
through primary survey is the elucidated in Table-4.7.
As per the socio-economic survey, about 16% of the total surveyed population
is illiterate. The remaining population (84%) is either literate or is presently
continuing with their education. Amongst the surveyed population, persons
educated upto or pursuing the primary school level is 22.38%. The percentage
0200400600800
100012001400160018002000
BackwardCaste
General Caste ScheduleCaste
ScheduleTribe
DNA Total
47
1524
253
3 21
1848
0102
6 0 0108
Pancheshwar MPDP Total Rupali Gad RDP Total

PANCHESHWAR MULTIPURPOSE PROJECT SIA Study Report
Chapter 4: Data Analysis of Socio-Economic Survey Page 29
of surveyed population educated or undergoing their education in middle
school and secondary school is of the order of 18.35% and 36.14%
respectively. It is evident from the given statistics that the number of persons
getting educated beyond the primary school and subsequent levels drops, and
thereafter increases in the secondary level education. Further individuals who
complete school level and thereafter take-up higher education reduced
drastically. Individuals who are presently undergoing/ have completed graduate
(includes BA, B.Com, B. Sc) or post graduate (MA, M. Com, M. Sc, PhD) level
comprise 4.63% and 1.66% of the total surveyed population respectively.
Further, individuals who have taken-up or completed professional courses, e.g.
Engineering, MBA, LLB, etc., constitute a minuscule proportion (0.1%) of the
total surveyed population.
Table-4.7: Educational Profile of the Project Affected Families
S. No Village
Name
Pri
mary
Sc
ho
ol
Mid
dle
Sc
ho
ol
Se
co
nd
ary
Sc
ho
ol
Gra
du
ate
Po
st
Gra
du
ate
Pro
fess
ion
al
De
gre
e
Dip
lom
a
Lit
era
te
Illite
rate
To
tal
Pancheshwar MPDP (A)
1 Nisni 21 16 20 2 0 0 0 0 16 75
2 Gogana 94 82 206 17 4 0 0 0 70 473
3 Rarikhuti 12 14 14 1 1 0 0 0 12 54
4 Jamrari 46 36 52 1 0 0 0 0 52 187
5 Kharku
Bhalya
20 23 26 4 1 0 0 0 17 91
6 Matiyal/
Matiyal
Chakawali
17 21 25 5 2 0 0 0 12 82
7 Bhalya 19 37 25 4 5 0 0 0 18 108
8 Upertola 30 31 40 3 1 0 0 0 33 138
9 Pati
Palchaura
8 16 23 4 0 0 0 0 25 76
10 Salla 10 6 14 1 0 0 0 0 10 41
11 Sail 23 28 29 0 0 0 0 0 36 116
12 Taremia 69 69 68 9 10 6 0 0 83 314
13 Haldu 67 61 87 3 0 0 0 0 45 263
14 Kwerali 3 4 7 2 0 0 0 0 6 22
15 Sakun 37 48 87 10 2 0 0 0 27 211
16 Dhyan 9 5 18 6 1 0 0 0 8 47
17 Kuteri 13 16 19 0 0 0 0 0 3 51
18 Tarigaon 32 60 64 9 4 0 0 0 47 216

PANCHESHWAR MULTIPURPOSE PROJECT SIA Study Report
Chapter 4: Data Analysis of Socio-Economic Survey Page 30
S. No Village
Name
Pri
mary
Sc
ho
ol
Mid
dle
Sc
ho
ol
Se
co
nd
ary
Sc
ho
ol
Gra
du
ate
Po
st
Gra
du
ate
Pro
fess
ion
al
De
gre
e
Dip
lom
a
Lit
era
te
Illite
rate
To
tal
19 Gyal Pipli 7 5 15 0 0 0 0 0 7 34
20 Baunakot 9 20 20 1 0 0 0 0 12 62
21 Baltari 68 36 55 3 0 0 0 0 40 202
22 Gaurihat 24 31 81 11 5 0 0 0 19 171
23 Rajyoura 19 17 60 4 1 0 0 0 14 115
24 Kanari 87 43 134 25 7 0 0 0 9 305
25 Majirkanda 68 73 160 32 11 1 0 0 49 394
26 Getigada 45 19 43 1 0 0 0 0 16 124
27 Bhateri 2 5 5 0 0 0 0 0 3 15
28 Amtari 81 25 72 3 2 0 0 0 23 206
29 Ranuwa 28 15 29 3 2 0 0 0 4 81
30 Bathauli 1 1 4 0 0 0 0 0 0 6
31 Dyora 29 26 48 2 2 0 0 0 7 114
32 Sunkholi 6 12 17 0 0 0 0 0 0 35
33 Pantsera 4 0 12 0 0 0 0 0 1 17
34 Syuwan 6 2 10 0 0 0 0 0 3 21
35 Dwali Sera 35 44 101 27 6 0 0 0 40 253
36 Ghighrani 59 26 88 28 3 0 0 0 25 229
37 Sailoni 23 5 36 1 3 0 0 0 1 69
38 Chamtoli 6 5 31 8 7 0 0 0 7 64
39 Titri 38 38 97 5 0 0 0 0 23 201
40 Bagadihat 67 69 120 33 6 1 1 0 53 350
41 Bheliya 1 0 5 0 0 0 0 0 5 11
42 Jogyoura 11 26 44 10 3 0 0 0 23 117
43 Garjiya 23 36 44 11 0 0 0 0 19 133
44 Jamtari 2 3 19 0 0 0 0 0 12 36
45 Oltari 20 14 39 0 0 0 0 0 12 85
46 Daulani 4 10 13 0 0 0 0 0 0 27
47 Tham 10 11 10 4 0 0 0 0 6 41
48 Duti Bagar 73 37 154 28 7 0 0 0 30 329
49 Dungatoli 14 20 30 2 0 0 0 0 13 79
50 Kimkhola 48 33 60 7 3 0 0 0 25 176
51 Bokata 19 9 18 0 0 0 0 0 23 69
52 Bungli 13 15 23 1 0 0 0 0 12 64
53 Bursum Bari 25 20 36 4 1 0 0 0 20 106
54 Dandadhar 4 0 2 2 0 0 0 0 2 10
55 Dubola
Birtola
29 17 40 9 2 0 0 0 13 110

PANCHESHWAR MULTIPURPOSE PROJECT SIA Study Report
Chapter 4: Data Analysis of Socio-Economic Survey Page 31
S. No Village
Name
Pri
mary
Sc
ho
ol
Mid
dle
Sc
ho
ol
Se
co
nd
ary
Sc
ho
ol
Gra
du
ate
Po
st
Gra
du
ate
Pro
fess
ion
al
De
gre
e
Dip
lom
a
Lit
era
te
Illite
rate
To
tal
56 Kuntola 2 5 7 0 0 0 0 0 17 31
57 Tudil 17 14 21 6 0 0 0 0 28 86
58 Nali 33 36 52 7 0 0 0 0 29 157
59 Seraghara 9 4 19 5 3 0 0 0 14 54
60 Sinoli
Bhamalta
29 21 35 1 2 0 0 0 20 108
61 Jartola 0 0 1 0 0 0 0 0 0 1
62 Rasyun 93 65 116 23 9 0 0 0 84 390
63 Kharkoli 66 57 113 37 10 0 0 0 61 344
64 Askora 42 40 68 3 9 0 0 0 69 231
65 Pali 18 5 20 0 0 0 0 0 5 48
66 Raitola 26 27 64 15 9 0 0 0 36 177
67 Rautora 20 8 11 0 15 0 0 0 3 57
68 Timta
Chamdungra
36 33 37 5 1 0 0 0 33 145
69
Damde
33 26 33 2 5 0 0 0 35 134
70 Chaur
Ghurelli
8 5 18 0 0 0 0 0 1 32
71 Sibana 0 1 7 3 1 0 0 0 2 14
72 Busail 37 17 36 14 5 0 0 0 12 121
73 Garali 18 11 15 5 5 1 0 0 4 59
74 Anwala Talla
Malla Sugar
12 15 19 3 0 0 0 0 8 57
Mavla
75 Dhajari 5 9 20 6 2 0 0 0 3 45
76 Dyuri 26 11 19 0 1 0 0 0 0 57
77 Suwal 8 5 11 0 0 0 0 0 7 31
78 Tallisar 40 29 50 11 0 1 0 2 6 139
79 Khatigaon 16 0 34 1 0 0 0 0 7 58
80 Nali Malli 12 4 4 2 0 0 0 0 13 35
81 Umer 9 17 19 4 0 0 0 0 19 68
82 Bamori
Khalsa/
Bamori
16 13 20 1 0 0 0 0 24 74
83 Ara Salphar 67 66 93 17 8 0 0 0 42 293
84 Kola 4 4 8 3 0 0 0 0 16 35
85 Kunj Kimola 67 12 54 0 0 0 0 0 20 153

PANCHESHWAR MULTIPURPOSE PROJECT SIA Study Report
Chapter 4: Data Analysis of Socio-Economic Survey Page 32
S. No Village
Name
Pri
mary
Sc
ho
ol
Mid
dle
Sc
ho
ol
Se
co
nd
ary
Sc
ho
ol
Gra
du
ate
Po
st
Gra
du
ate
Pro
fess
ion
al
De
gre
e
Dip
lom
a
Lit
era
te
Illite
rate
To
tal
86 Mayoli 3 1 6 0 2 0 0 0 2 14
87 Dasoli
Badiyar
12 12 13 0 0 0 0 0 1 38
88 Kuna Pokhri 8 9 10 0 2 0 0 0 6 35
89 Uncha
Beragunth
7 2 7 0 0 0 0 0 1 17
90 Nali Talli 0 0 0 0 0 0 0 0 21 21
91 Dhura Laga
Tank
28 14 28 2 3 0 0 0 17 92
92 Dhankana 20 14 20 1 0 0 0 0 11 66
93 Nayal Dhura 28 27 75 25 11 3 0 0 8 177
94 Padoli 5 0 5 0 0 0 0 2 5 17
95 Jingal 22 12 32 1 0 0 0 0 21 88
96 Chimkholi 22 16 60 6 0 0 0 0 0 104
97 Beta 3 3 8 0 0 0 0 0 4 18
98 Sulan 8 8 13 2 0 0 0 0 8 39
99 Polap
3 3 7 0 0 0 0 0 3 16
100
Sugar Khal
11 10 43 0 0 0 0 0 7 71
101 Batauri Mug
Gunth
75 47 140 9 2 0 0 0 29 302
102 Kothere 24 10 55 1 0 0 0 0 12 102
103 Sigra 39 45 56 2 0 0 0 0 32 174
104 Bruyuri 10 4 10 0 0 0 0 0 8 32
105 Gaika Jyula 1 3 13 2 0 0 0 0 4 23
106 Khai Kot
Talla
15 16 21 4 1 0 0 0 8 65
107 Bibil 3 9 56 6 0 0 0 0 35 109
108 Simalkhet 25 19 50 8 4 0 0 0 17 123
109 Khaikot Malla 22 11 10 0 0 0 0 0 7 50
110 Choolgaon 10 7 25 0 0 0 0 0 0 42
111 Raygaon 18 10 60 2 0 0 0 0 5 95
Subtotal(A) 2729 2213 4446 591 212 13 1 4 1981 12190
Rupaligad RDP (B)
112 Netra 43 38 41 6 0 0 0 0 55 183
113 Bachkot 2 0 2 0 0 0 0 0 2 6
114 Nidil 24 30 34 0 0 0 0 0 0 88

PANCHESHWAR MULTIPURPOSE PROJECT SIA Study Report
Chapter 4: Data Analysis of Socio-Economic Survey Page 33
S. No Village
Name
Pri
mary
Sc
ho
ol
Mid
dle
Sc
ho
ol
Se
co
nd
ary
Sc
ho
ol
Gra
du
ate
Po
st
Gra
du
ate
Pro
fess
ion
al
De
gre
e
Dip
lom
a
Lit
era
te
Illite
rate
To
tal
115 Jindi Sorari 7 12 38 2 0 0 0 0 5 64
116 Bhagauti 1 1 1 0 0 0 0 0 0 3
117 Dungraleti 40 35 48 0 0 0 0 0 30 153
118 Pasam 9 6 31 4 1 0 0 0 21 72
119 Ashlad 2 0 4 0 0 0 0 0 18 24
120 Jamarso 23 23 28 0 0 0 0 0 38 112
121 Matiyali 20 24 21 0 3 0 0 0 23 91
122 Chilniya 18 10 17 0 0 0 0 0 6 51
Subtotal(B) 189 179 265 12 4 0 0 0 198 847
Grand Total
(A+B)
2918 2392 4711 603 216 13 1 4 2179 13037
Source: Primary Survey
g) Occupational Profile
The village wise occupational profile of the surveyed population is
summarized in Table-4.8.
As per socio-economic survey, it is observed that out of the total of 13037
persons, about 69% of the surveyed population is not engaged in economically
productive vocation. This group constitutes of persons engaged in household
chores (primarily women folk) and students who represent 25.7% and 15.6%
of the surveyed population. A sizeable proportion of the affected surveyed
population (about 25.9%), that consists of able-bodied adult males and females
that are not engaged in any economic activity, but are involved in assiting in
farm related activities and domestic chores; thus they are dependent on the
working population for its sustenance. This group also primarily consists of
infants, children (not going to school), and aged population. In addition, this
group also includes persons who have retired from service.
About 31% of the surveyed population is gainfully engaged in an economic
activity. This group consists of persons engaged in cultivation (15.82%),
government jobs (4.20%), private jobs (10.50), self employment/ business
(0.28%), artisans (0.02%), political position (0.07%), and labourers (0.03%).

PANCHESHWAR MULTIPURPOSE PROJECT SIA Study Report
Chapter 4: Data Analysis of Socio-Economic Survey Page 34
Table-4.8: Occupational Profile of the Surveyed Project Affected Families
S. No Village Name
Farm
er
Go
ve
rnm
en
t J
ob
Pri
vate
Jo
b
Se
lf E
mp
loye
d/
Bu
sin
es
s
Art
isan
s
Po
liti
cal P
osit
ion
EX
-Se
rvic
em
an
/
Re
tire
d/P
en
sio
ne
d
Lab
ou
rers
Ho
us
eh
old
Ch
ore
s
Stu
de
nts
No
t W
ork
ing
To
tal
Pancheshwar MPDP (A)
1 Nisni 9 1 5 0 0 0 0 0 27 25 8 75
2 Gogana 76 22 68 1 0 0 6 0 162 76 60 471
3 Rarikhuti 9 3 3 0 0 0 1 0 10 14 14 54
4 Jamrari 21 1 32 0 0 0 0 0 64 51 18 187
5
Kharku
Bhalya 22 1 8 0 0 0 1 0 34 3 22 91
6 Matiyal/Chaka
wali
14 3 6 0 0 0 0 0 25 6 28 82
7 Bhalya 11 8 7 0 0 0 2 0 32 22 26 108
8 Upertola 16 6 8 0 0 1 4 0 50 9 44 138
9
Pati
Palchaura 10 5 2 0 0 0 3 0 22 22 12 76
10 Salla 5 2 5 0 0 0 0 0 10 15 4 41
11 Sail 14 1 13 0 0 0 1 0 36 16 35 116
12 Taremia 41 6 28 0 0 0 6 0 60 40 133 314
13 Haldu 49 3 21 0 0 0 1 0 84 86 19 263
14 Kwerali 4 0 0 0 0 0 0 0 3 9 6 22
15 Sakun 20 31 32 0 0 1 4 0 66 40 17 211
16 Dhyan 2 6 2 0 0 0 4 0 20 8 5 47
17 Kuteri 12 6 17 0 0 0 4 0 5 7 51
18 Tarigaon 25 3 7 0 0 0 3 0 4 1 173 216
19 Gyal Pipli 7 0 0 0 0 0 0 0 14 3 10 34
20 Baunakot 6 3 3 0 0 0 1 0 31 13 5 62
21 Baltari 78 13 90 1 1 0 6 0 4 5 4 202
22 Gaurihat 14 8 5 0 0 0 6 0 25 14 99 171
23 Rajyoura 15 6 9 0 0 0 2 0 19 15 49 115
24 Kanari 19 11 37 1 0 0 0 0 140 90 7 305
25 Majirkanda 30 12 18 0 0 0 9 0 2 1 322 394
26 Getigada 40 12 28 0 0 0 2 0 23 12 7 124
27 Bhateri 1 0 0 0 0 0 0 0 3 11 15
28 Amtari 28 11 30 1 0 0 2 0 103 23 8 206
29 Ranuwa 9 5 8 0 0 0 1 0 40 17 1 81
30 Bathauli 2 0 0 0 0 0 0 0 3 1 6
31 Dyora 26 4 23 0 0 0 4 0 35 14 7 113

PANCHESHWAR MULTIPURPOSE PROJECT SIA Study Report
Chapter 4: Data Analysis of Socio-Economic Survey Page 35
S. No Village Name
Farm
er
Go
ve
rnm
en
t J
ob
Pri
vate
Jo
b
Se
lf E
mp
loye
d/
Bu
sin
es
s
Art
isan
s
Po
liti
cal P
osit
ion
EX
-Se
rvic
em
an
/
Re
tire
d/P
en
sio
ne
d
Lab
ou
rers
Ho
us
eh
old
Ch
ore
s
Stu
de
nts
No
t W
ork
ing
To
tal
32 Sunkholi 4 0 12 0 0 0 1 0 6 11 1 35
33 Pantsera 3 0 3 2 0 0 2 0 5 1 1 17
34 Syuwan 4 1 3 1 0 0 0 0 6 3 3 21
35 Dwali Sera 44 17 6 0 0 1 8 0 61 48 68 253
36 Ghighrani 28 7 12 1 0 0 8 0 39 38 96 229
37 Sailoni 0 4 9 0 0 0 4 0 45 6 1 69
38 Chamtoli 4 7 7 0 0 1 3 0 15 10 17 64
39 Titri 51 21 56 2 0 0 1 0 50 14 6 201
40 Bagadihat 33 19 48 1 0 2 3 0 103 91 50 350
41 Bheliya 0 0 2 0 0 0 0 0 2 3 4 11
42 Jogyoura 14 3 12 0 0 0 0 0 30 28 30 117
43 Garjiya 12 9 9 0 0 0 0 1 40 38 24 133
44 Jamtari 10 0 0 0 0 0 0 0 3 6 17 36
45 Oltari 12 18 23 0 0 0 4 0 15 8 5 85
46 Daulani 12 0 12 0 0 0 0 0 3 27
47 Tham 4 4 2 1 0 0 0 0 8 13 9 41
48 Duti Bagar 69 7 23 10 0 0 6 0 66 35 113 329
49 Dungatoli 16 7 2 0 0 0 1 0 24 18 11 79
50 Kimkhola 18 7 8 1 0 0 1 2 37 59 43 176
51 Bokata 10 0 2 0 0 0 0 0 2 55 69
52 Bungli 23 3 0 0 0 0 0 0 19 1 18 64
53 Bursum Bari 28 0 5 0 0 0 2 0 30 31 10 106
54 Dandadhar 1 0 0 0 0 0 0 0 9 10
55 Dubola Birtola 20 5 9 0 0 0 0 0 39 30 7 110
56 Kuntola 1 1 8 0 0 0 2 0 2 2 15 31
57 Tudil 14 0 0 0 0 0 0 0 5 1 66 86
58 Nali 16 6 9 0 0 0 1 0 4 1 120 157
59 Seraghara 7 0 5 0 0 0 0 0 7 3 32 54
60
Sinoli
Bhamalta 5 0 0 0 0 0 0 0 103 108
61 Jartola 1 0 0 0 0 0 0 0 1
62 Rasyun 51 23 27 0 0 0 10 0 146 96 37 390
63 Kharkoli 35 27 30 0 0 0 3 0 100 56 93 344
64 Askora 32 3 38 0 0 0 5 0 78 29 46 231
65 Pali 6 1 7 0 0 0 1 0 23 10 48
66 Raitola 24 2 17 0 0 2 5 0 33 22 72 177
67 Rautora 15 3 9 0 0 0 1 0 10 2 17 57
68 Timta 35 3 2 0 0 0 0 0 28 22 54 144

PANCHESHWAR MULTIPURPOSE PROJECT SIA Study Report
Chapter 4: Data Analysis of Socio-Economic Survey Page 36
S. No Village Name
Farm
er
Go
ve
rnm
en
t J
ob
Pri
vate
Jo
b
Se
lf E
mp
loye
d/
Bu
sin
es
s
Art
isan
s
Po
liti
cal P
osit
ion
EX
-Se
rvic
em
an
/
Re
tire
d/P
en
sio
ne
d
Lab
ou
rers
Ho
us
eh
old
Ch
ore
s
Stu
de
nts
No
t W
ork
ing
To
tal
Chamdungra
69 Damde 28 1 3 0 0 0 0 0 21 5 76 134
70
Chaur
Ghurelli 4 1 5 0 0 0 0 0 11 8 3 32
71 Sibana 2 2 1 0 0 0 0 0 3 3 3 14
72 Busail 22 10 25 0 0 0 1 0 39 13 11 121
73 Garali 1 3 6 1 0 0 6 0 15 11 16 59
74
Anwala Talla
Malla 11 2 1 0 0 0 0 0 10 17 16 57
Sugar Mavla
75 Dhajari 5 1 11 0 0 0 3 0 9 7 9 45
76 Dyuri 4 2 9 0 0 0 1 0 31 9 1 57
77 Suwal 2 0 15 0 0 0 0 1 7 6 31
78 Tallisar 40 13 38 0 0 0 3 0 12 29 4 139
79 Khatigaon 5 5 11 0 0 0 4 0 30 3 58
80 Nali Malli 6 0 2 0 0 0 0 0 4 4 19 35
81 Umer 10 0 10 0 0 0 1 0 21 14 12 68
82
Bamori
Khalsa/Bamor
i
8 4 9 0 0 0 1 0 24 13 15 74
83 Ara Salphar 32 9 39 0 0 0 1 0 76 86 50 293
84 Kola 2 0 0 0 0 0 0 0 33 35
85 Kunj Kimola 34 27 32 0 0 0 1 0 41 14 4 153
86 Mayoli 2 4 2 0 0 0 0 0 5 1 14
87
Dasoli
Badiyar 16 0 3 1 0 0 2 0 15 1 38
88 Kuna Pokhri 13 2 3 0 0 0 2 0 8 2 5 35
89
Uncha
Beragunth 5 0 0 0 0 0 2 0 6 4 17
90 Nali Talli 0 0 0 0 0 0 0 0 21 21
91
Dhura Laga
Tank 5 2 18 0 0 0 2 0 25 20 20 92
92 Dhankana 10 0 6 0 0 0 0 0 17 20 13 66
93 Nayal Dhura 14 15 20 3 0 0 3 0 42 26 54 177
94 Padoli 17 0 0 0 0 0 0 0 17
95 Jingal 13 3 21 0 1 0 0 0 37 13 88
96 Chimkholi 27 0 6 3 0 0 0 0 50 18 104
97 Beta 5 0 1 0 0 0 0 0 4 8 18

PANCHESHWAR MULTIPURPOSE PROJECT SIA Study Report
Chapter 4: Data Analysis of Socio-Economic Survey Page 37
S. No Village Name
Farm
er
Go
ve
rnm
en
t J
ob
Pri
vate
Jo
b
Se
lf E
mp
loye
d/
Bu
sin
es
s
Art
isan
s
Po
liti
cal P
osit
ion
EX
-Se
rvic
em
an
/
Re
tire
d/P
en
sio
ne
d
Lab
ou
rers
Ho
us
eh
old
Ch
ore
s
Stu
de
nts
No
t W
ork
ing
To
tal
98 Sulan 6 0 0 0 0 0 0 0 2 31 39
99 Polap 1 0 1 0 0 0 1 0 7 2 4 16
100 Sugar Khal 13 5 12 0 0 0 4 0 31 2 4 71
101
Batauri Mug
Gunth 48 7 34 4 0 0 7 0 87 70 45 302
102 Kothere 23 2 11 0 0 0 5 0 37 11 13 102
Sigra 39 4 10 0 0 0 2 0 51 56 12 174
103 Bruyuri 5 0 4 0 0 0 1 0 11 4 7 32
Gaika Jyula 6 0 1 0 0 0 0 0 2 14 23
104 Khai Kot Talla 23 1 2 0 0 0 8 0 27 4 65
Bibil 24 0 0 0 0 0 0 0 85 109
105 Simalkhet 23 2 10 1 0 1 1 0 35 17 33 123
Khaikot Malla 2 0 0 0 0 0 0 0 16 32 50
106 Choolgaon 15 0 0 0 0 0 0 0 14 5 8 42
111 Raygaon 36 1 1 0 0 0 1 0 18 4 34 95
Subtotal(A) 1904 529 1315 36 2 9 208 4
313
6 1941 3102 12186
Rupaligad
RDP (B)
112 Netra 30 5 17 0 0 0 5 0 70 29 27 183
113 Bachkot 2 0 1 0 0 0 0 0 2 1 6
114 Nidil 17 6 0 0 0 0 7 0 42 16 88
115 Jindi Sorari 13 5 1 0 0 0 2 0 12 1 30 64
116 Bhagauti 2 0 0 0 0 0 0 0 1 3
117 Dungraleti 25 1 13 0 0 0 1 0 19 12 82 153
118 Pasam 18 0 1 0 0 0 0 0 53 72
119 Ashlad 3 0 0 0 0 0 0 0 3 2 16 24
120 Jamarso 18 1 9 0 0 0 2 0 31 26 25 112
121 Matiyali 10 1 12 0 0 0 0 0 23 29 16 91
122 Chilniya 20 0 0 0 0 0 0 0 15 1 15 51
Subtotal(B) 158 19 54 0 0 0 17 0 217 100 282 847
Grand Total
(A+B) 2062 548 1369 36 2 9 225 4 3353 2041 3384 13033
Source: Primary Survey

PANCHESHWAR MULTIPURPOSE PROJECT SIA Study Report
Chapter 4: Data Analysis of Socio-Economic Survey Page 38
h) Economic Profile
The maximum number of PAFs are cultivators. A large number of the survey of
affected population are engaged in various government and private jobs, yet
they are still dependent on cultivation. Agriculture not only provides vocation
and food to the PAFs, but it’s a way of life. Farming is mainly done along
terraces.
The main crops grown in the area includes wheat, paddy, maize, maduwa,
pulses, and green vegetables. Farmers use both chemical fertilizers and
cow dung as manure to increase productivity of their plots of land. In villages
which are abundant with water or have streams flowing through the village,
there the farmers constructed contour canals (kiuls) to provide irrigation. Most
of the farmers depend on the rains for irrigation. The produce was used by the
farmers for subsistence, which lasted them anywhere between 6 to 8 months
in a year. Thereafter, they purchased food grains and vegetables from the
market.
i) Livestock Rearing Pattern
Cultivation is the main livelihood that sustains people in the project area. Apart
from cultivation, livestock rearing is the major occupation. Livestock are
reared for milk, meat, eggs and labour. Goats are the dominant livestock by
the affected population, as these are less expensive to maintain and provide
milk and meat. Cows and buffaloes together are the second dominant livestock
reared by the PAFs, which is essentially for its milk and progeny. On an
average, there are about 2 milch animals per family among the surveyed PAFs.
Bullocks and he-buffaloes are reared as beasts of burden, mainly utilized in
farm activities e.g. ploughing, leveling and threshing of crops; they account for
about 12% of the total livestock. Other beasts of burden, viz., horse and
mules are reared by a few PAFs that account for 1.3% of the total livestock
heads. Pigs are also reared, albeit by very few PAFs. Chicken and other
poultry birds were reared by almost all PAFs.
j) Housing Details
Information regarding Housing details was also collected from the affected
families during the socio-economic survey. It was found that no family was
house-less. Mixed layout of housing was observed in the villages. The
settlements ranged from dispersed to compact. Linear settlement (on either
sides of a village lane) was observed in few villages. This residential unit
served the purpose of housing families of sons and grandsons, shelter for
cattle, storage areas for fuel wood, and other material possessions of these
families.

PANCHESHWAR MULTIPURPOSE PROJECT SIA Study Report
Chapter 4: Data Analysis of Socio-Economic Survey Page 39
It was observed that the houses on an average had about 4 rooms. Stone,
brick and mud were used to build the walls of the houses, while the roof was
mostly made of wood and tiles.
It was observed that about 60% of the houses had a defined space for housing
cattle. About 4.6% of the cattle sheds were electrified. On an average,
there is about one room for housing cattle.
A small percentage of the houses had provision for separate bath room and
toilet facilities. Otherwise, it was observed that most of the residents used
village ponds or river for bathing, washing and cleaning purposes. Most of the
villages did not have drainage system.
k) Sources of Drinking Water
Tap water supply forms the largest source for the surveyed PAFs. Usually, a
storage tank is constructed near a source, generally on a height and
distributed under gravity through pipeline. Taps are installed at vantage points
to supply water for meeting drinking and other uses. Apart from tapped water
supply, the other sources of water include hand pumps, and tanks/ ponds. The
residents of the project area also depend on the river for water. Springs also
are sources of water for various uses. The main source of water for the affected
population is depicted in Figure-4.8.
Large majority of the sources of water are located near homesteads that served
a few to several homesteads in the village. About 36% of the sources of water
supply were within the homestead premises. A few of the sources were located
within the village, but at a common place, from where residents could use it.
The sources of drinking water for surveyed PAFs are depicted in Figure-4.7.
The distance of the source of water for surveyed PAFs is depicted in Figure-
4.8.

PANCHESHWAR MULTIPURPOSE PROJECT SIA Study Report
Chapter 4: Data Analysis of Socio-Economic Survey Page 40
Figure-4.7: Source of Drinking Water amongst PAFs
Figure-4.8: Distance for Source of Drinking Water
l) Power Supply
The surveyed project affected Families use various energy sources for power
supply in the homestead. The main source of power supply for lighting in
the homesteads is electricity. A large majority of the affected homesteads
are electrified. About 96% of the homesteads get electricity for lighting
purposes. In addition, the affected sample population also depends on
kerosene for lighting purposes. Other sources such as other oils and solar
lamps are also used.
m) Sources of fuel for Cooking
The project affected families are dependent on a number of sources of fuel for
cooking purposes. Firewood is the major source of fuel, and contributes about

PANCHESHWAR MULTIPURPOSE PROJECT SIA Study Report
Chapter 4: Data Analysis of Socio-Economic Survey Page 41
98% of the all fuels used by the project affected population. Other sources
such as electricity, kerosene, coal, cow dung cakes and fodder stalks from their
own fields contribute together to a small proportion of 2% of all sources.
n) Physical Health
A vast majority of the project affected surveyed population, i.e., 99.84% is in
good health and is physically fit and normal. However, there are about 21
individuals (one each in villages Kanari, Amtari, Ranuwa and Daulani, 2 each
in villages Sailoni and Tallisar, 3 each in villages Titri and Bagrihat, and 6 in
village Askora), i.e, 0.16% of the total surveyed population who are physically
challenged. All these physically challenged persons were enumerated in the
Pancheshwar MPDP.
o) Material Assets
The socio-economic assessment covered overall socio-economic status of the
surveyed project affected population vis-à-vis ownership of material assets,
which is an indicator of well- being. It is clear that many of the surveyed
PAFs, if not all, own material assets, which include farm equipment, modes of
transportation and consumer durables and electronic household gadgets.
Farm equipment
Traditional farm equipment such as wooden and iron ploughs and wooden
planks for leveling are owned by most of the farmers in the project area.
However, specialized and mechanized equipment such as pump set, tractor,
thresher, seed drill, cultivator, leveler, sprayer, etc are owned by very few
farmers. Two tractors, 6 cultivators, 1 leveler and 6 sprayers were observed by
PAFs covered as a part of survey in the Pancheshwar MPDP area. In the
Rupaligad RDP area, farmers did not own farm equipment.
Mode of transportation
PAFs in the project affected villages own various modes of transportation,
either used by themselves or operated by them for commercial purposes.
Motor-cycles and passenger cars are the most common mode of
transportation owned by the surveyed PAFs. Second most common mode was
bicycle. Commercial vehicles such as truck and buses are also owned by some
of the PAFs.

PANCHESHWAR MULTIPURPOSE PROJECT SIA Study Report
Chapter 4: Data Analysis of Socio-Economic Survey Page 42
Consumer durable electronic household gadgets
Ownership of consumer durables is a clear indicator of well-being,
consumerism and purchasing power among the surveyed PAFs. The most
commonly owned and used electronic gadget is the Mobile phone. Fans and
watches were also owned by a large number of PAFs. Other common gadgets
include television sets with dish antenas, refrigerators, and compact disc
players. A few families own sewing machines and coolers for air conditioning
their homesteads.
p) Rearing of Trees
The project affected families rear fruit bearing trees around and within their
homesteads and agricultural fields. Fruit bearing trees are raised by the PAFs
for sustenance, although surpluses are usually sold to middle-men, traders and
in the market directly by the surveyed PAFs. The most commonly raised fruit
bearing trees include mango, citrus such as lemon, orange, kinu, sweet lime,
malta, banana, apricot, guava, papaya, pear, peach, pomegranate, etc. Other
fruits such as apple, grapes, jamun, lichi, walnut, tamarind, jack-fruit, are raised,
albeit in smaller numbers by a few PAFs as well.
Rearing of Trees
Almost all the project affected families are engaged in agricultural activities and
growing and rearing of trees, both fruit bearing trees are quite common among
the villagers. Trees such as Jackfruit, Lemon, Orange, Papaya and
Cinnamomum are cultivated and reared by the surveyed population.
q) Types of Households
The survey was conducted in 49 families for the status of houses owned by
them. It was observed from the survey that 100% of the population owns
homestead. Walls were made from Galvanized form, Bricks, Stone or Concrete.
The commonly used wall materials were Cement, Wood and Mortar. The
maximum number of homesteads had Concrete walls followed by wood. The
material used for roof in the surveyed area homestead is CGI sheet, Concrete,
GI sheet, HN sheet, RCC and Tin shed; maximum households amongst the
surveyed population have Tin shed roof followed by CGI sheet. None of the
households amongst the surveyed population have LPG connection. The fuel
used for cooking in the area is firewood. It is further observed that almost all the
surveyed households were electrified.

PANCHESHWAR MULTIPURPOSE PROJECT SIA Study Report
Chapter 4: Data Analysis of Socio-Economic Survey Page 43
r) Skill Mapping
As mentioned earlier, in all there are 134 project affected villages; viz., 21 in
district Almora, 26 is district Champawat and 87 in district Pithoragarh. A total
of 31023 families are losing land and 1308 families are losing homestead. As a
part of the study, socio-economic survey was conducted for 11776 Project
Affected Families for Pancheshwar Multipurpose Project. In addition, 120
families from 11 affected villages were surveyed for Rupaligad Project. Thus a
total of (11776+120) 11896 families in 122 project affected villages were
covered as part of the stratified random sample survey.
As per the data collected from the surveyed population it was observed that
about 31% of the surveyed population is gainfully engaged in an economic
activity. This group consists of persons engaged in cultivation (15.82%),
government jobs (4.20%), private jobs (10.50), self-employment/ business
(0.28%), artisans (0.02%), political position (0.07%), and labourers (0.03%). As
per the analysis of the occupational profile of the surveyed population it is
observed that most of the project affected persons are engaged in the
agricultural activities. The, summary of Occupational Profile of the project
affected surveyed population is given in Table-4.9.
Table-4.9: Summary of Occupational Profile of the Surveyed Project
Affected Families
S.
No
Village
Name
Fa
rme
r
Go
ve
rnm
en
t J
ob
Pri
va
te J
ob
Se
lf
Em
plo
ye
d/
Bu
sin
ess
Art
isa
ns
Po
liti
ca
l P
os
itio
n
EX
-Se
rvic
em
an
/
Reti
red
/Pe
nsio
ne
d
La
bo
ure
rs
Ho
us
eh
old
Ch
ore
s
Stu
de
nts
No
t W
ork
ing
To
tal
1
Pancheshwar
MPDP (A) 1904 529 1315 36 2 9 208 4 3136 1941 3102 1904
2
Rupaligad
RDP (B) 158 19 54 0 0 0 17 0 217 100 282 847
Total(A+B) 2062 548 1369 36 2 9 225 4 3353 2041 3384 13033
It was observed that the resident population accounts for about 84.32% of the
total population, and the remaining (15.68%) is non-resident/migrated
population. There are several reasons stated for the migration of the people
from the project area. Of the total migrated population it is observed that the
population migrated for training purpose only accounts for 0.1% (Engineer,
MBA, LLB, etc).

PANCHESHWAR MULTIPURPOSE PROJECT SIA Study Report
Chapter 4: Data Analysis of Socio-Economic Survey Page 44
It has been observed from the survey that there are no professional institutes
like Medical College, MBA College, and Engineering College in the study area.
Hence, project affected families have Traditional Skills like agriculture, dairy
farming and Horticulture. Although a large number of the survey of affected
population are engaged in various government and private jobs, still major
portion the surveyed population is dependent on cultivation. Agriculture not
only provides vocation and food to the PAFs, but it’s a way of life. Livestock
rearing is the next major occupation adopted by the study area population
Livestock are reared for milk, meat, eggs and labour.
Agriculture is the main occupation in the PAVs. On an average, 76.8%
(63.1% among main workers and 36.9% among marginal workers) of the total
working population is engaged in cultivation. A very minuscule proportion, i.e.
2.9% of the working population is engaged as agricultural labourer. Only a
small proportion of the working population is engaged in household industry
work/vocations. However, a considerable proportion, i.e., about 18.1% of the
working population is engaged as other workers. It appears that a vast majority
of this class is engaged in tertiary economic vocations such as private and
government jobs, self-employment and business, etc.
About 16% of the total sample population is illiterate, while the remaining
84% populations are either literate or are presently continuing with their
education. Amongst the sample surveyed population, 22.38% are either
educated upto or pursuing primary school level. The percentage of sample
population educated or undergoing their education in middle school,
secondary school is of the order of 18.35% and 36.14% respectively.
Individuals who are presently undergoing/ have completed graduate (includes
BA, BCom, BSc) or post graduate (MA, MCom, MSc, PhD) level
comprise 4.63% and 1.66% of the total population respectively. Further,
only 0.1% of the surveyed population has taken-up or completed professional
courses such as engineering, MBA, LLB, etc.,
Cultivation is the main livelihood that sustains people in the project area. Apart
from cultivation, farmers and other PAFs rear cattle for milk, meat, eggs and
labour.
Goats, account for 58.4% of the total livestock population, are by-far the most
common livestock reared by the PAFs, as these are less expensive to maintain
and provide milk and meat. Cows and buffaloes together are the second
dominant livestock reared by the PAFs, which is essentially for its milk and
progeny; they account for 19.5% of the total livestock owned. On an average,
there are about 2 milch animals per family among the sample PAFs. Bullocks
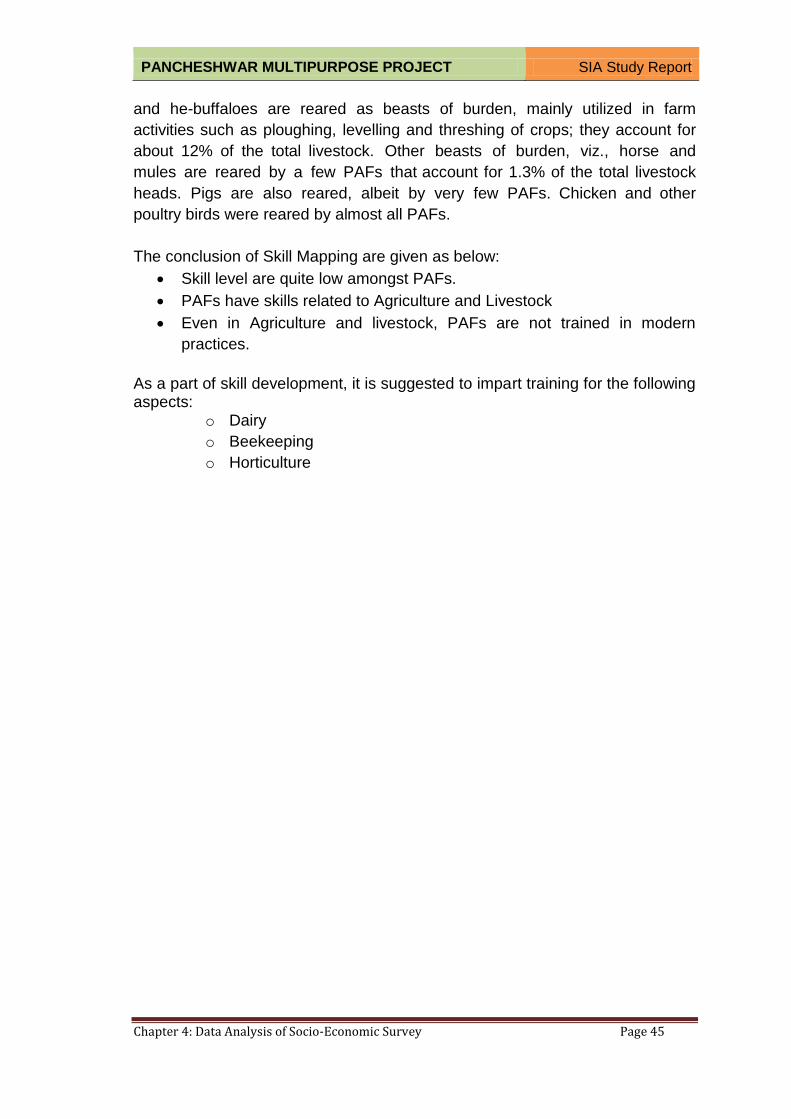
PANCHESHWAR MULTIPURPOSE PROJECT SIA Study Report
Chapter 4: Data Analysis of Socio-Economic Survey Page 45
and he-buffaloes are reared as beasts of burden, mainly utilized in farm
activities such as ploughing, levelling and threshing of crops; they account for
about 12% of the total livestock. Other beasts of burden, viz., horse and
mules are reared by a few PAFs that account for 1.3% of the total livestock
heads. Pigs are also reared, albeit by very few PAFs. Chicken and other
poultry birds were reared by almost all PAFs.
The conclusion of Skill Mapping are given as below:
Skill level are quite low amongst PAFs.
PAFs have skills related to Agriculture and Livestock
Even in Agriculture and livestock, PAFs are not trained in modern
practices.
As a part of skill development, it is suggested to impart training for the following aspects:
o Dairy
o Beekeeping
o Horticulture

CHAPTER-5
PROPERTY SURVEY

PANCHESHWAR MULTIPURPOSE PROJECT SIA Study Report
Chapter 5: Property Survey Page 1
CHAPTER-5
PROPERTY SURVEY
5.1 GENERAL
The main aim of the assignment is to carry-out the property survey –
enumeration of properties likely to be impacted due to the proposed
project. This chapter outlines the study approach and methodology adopted to
carry-out the property enumeration the project affected families.
5.2 OBJECTIVES OF THE STUDY
The scope of work for the Property Survey, the study encompassed desk
research, devising survey tools, Interaction and consultations with district
revenue authorities and staff, field investigation, and consultations with local
key personnel such as village-headman and senior citizen and prominent
citizens, etc to gain an insight of the baseline conditions. The main objectives
of this assessment are to:
Collate revenue records and maps for the project affected villages.
Superimposition of submergence area map on khasra maps
Superimposition of Submergence Area and other project appurtenances
on Khasra Map
Identification of the Khasra numbers to be acquired for various project
affected families.
Identification and collate project affected families (PAFs) from Revenue
records.
Conduct a property survey of the 100% of the project affected families
(PAFs), through field investigations
Estimation of the project affected families losing only land, only
households and both land and households.
Inventory of the properties owned by the project affected families,
common property resources like religious places, community centres,
etc.
5.3 STUDY APPROACH AND METHODOLOGY
Information that was required for property enumeration was collated from both
secondary as well as primary sources. Secondary data was collected from the
revenue department in the form of Right of Records (RoRs) and Khasra
(Cadastral) maps. Primary data and information was collected through

PANCHESHWAR MULTIPURPOSE PROJECT SIA Study Report
Chapter 5: Property Survey Page 2
consultations with village head-man, village elders and prominent citizens of
the affected villages along with the submergence area maps. Thereafter,
through desk research and review of maps, a comprehensive list of probable
affected villages was prepared with the help of Administrative Atlas of
Uttarakhand. Subsequently, during the reconnaissance visit to the project
area, this list of probable affected villages was verified and updated with the
able assistance from officials of the Revenue department. This preliminary list
of probable affected villages comprised of 134 villages spread across districts
Almora, Champawat and Pithoragarh.
Meeting was held with District Magistrates/ Collectors (DM/ DC) of districts
Pithoragarh, Champawat and Almora, and appraised them about the
proposed project, the property, Subsequently, the respective DMs directed
their officers and concerned staff to extend all possible support and
assistance. Thus, on the directions of the respective DMs, meeting was
held with respective Sub-Divisional Magistrates (SDM), Tehsildars, Pawaris,
Land Record Section Officers and Staff, to collect revenue maps for the
affected villages.
At headquarters, the khasra maps collected from the revenue department and
project area maps were scanned; scanned revenue maps were superimposed
on the submergence area maps. This exercise was carried-out with the help
of GIS computer software, which aided in jigsaw fit the revenue maps on the
submergence area map. This process helped in adding or eliminating villages
along the submergence area, based on jigsaw fit, and also to delineate the
affected/ impacted zone, i.e., areas within the revenue maps falling within the
full reservoir levels. Thereafter, a list of all the plots/ khasra, likely to be
acquired/ impacted was prepared, which was extensively used to gather the
Right of Records (RoRs). The State of Uttarakhand has computerized and
uploaded RoRs on their website: www.devbhumi.uk.gov.in which was to
collate RoRs of the affected villages. This information although was
downloadable but it was not editable; thus it was re-computerised for the
purpose of analysis and drawing inferences. These analyses lead to
enumeration of affected persons/ families/ land titleholders likely to lose land,
land and homesteads and homesteads only.
A list was prepared for affected persons/ families/ land titleholders, which was
used to identify them in the field for conducting socio-economic survey and
property enumeration in the affected villages. Thus, for the purpose of
enumeration of affected properties within the FRL, this list of affected
persons/ families/ land titleholders was used to enumeration affected private
properties of 100% affected families. A checklist was devised to gather and

PANCHESHWAR MULTIPURPOSE PROJECT SIA Study Report
Chapter 5: Property Survey Page 3
enumerate affected/ impacted properties.
At the completion of this exercise, final list of 134 affected villages spread in
districts Pithoragarh, Champawat and Almora.
5.4 FIELD WORK
For the purpose of primary data collection, survey coordinator put-together a
survey team, comprising of local educated youths. While engaging them, the
coordinator ensured that the team members (investigators/ surveyors) were
educated, well acquainted with Hindi language (as the schedules were to be
filled-in this language), well versed with the local customs and dialect, etc.
Training was imparted to the members of the survey team, wherein they were
appraised about the purpose of the survey and on the method of
consultations with the affected families/ persons and how to use GPS and
filled-in the survey checklist.
The survey team traversed the submergence area and dam alignment and
visited the affected villages for enumeration of properties. A considerable time
was spent in reaching many of these villages, as these were remotely located
and trekking from the nearest road-head was the only means of reaching
these villages. Upon reaching the affected villages, they contacted the Village
Panchayat/ Panchayat member or secretary and appraised them about the
survey work and required information. Thereafter, the survey team along-
with the village leders, emminant citizens and affected families of the villages
located themselves within the village at an elevation of 680 m MSL for
Pancheshwar MPDP and 420 m MSL for Rupaligad RDP using GPS. From
that location, they conducted consultations and physically enumerated
affected properties and structures.
5.5 DATA COMPILATION, ANALYSIS AND REPORTING
At the end of each day’s work the filled-in data checklists were cleaned for
internal discrepancies. The survey team coordinator ensured that the survey
team members eliminated the internal discrepancies and filled-in the missing
information in the survey schedules. The gathered information was thereafter
computerized. This keyed-in information/data was then analysed and
inferences were drawn using Microsoft Excel computer software.
The Property Survey/ Enumeration Report has been prepared for 134
surveyed villages. As per the property survey conducted in the area a total of
14,047.05 ha of land from both nations would be required for construction of

PANCHESHWAR MULTIPURPOSE PROJECT SIA Study Report
Chapter 5: Property Survey Page 4
various project appurtenances. Thus, land of the order of 9,058.25 ha and
4,988.8 ha are likely to be acquired from India and Nepal respectively, for
various purposes. The present chapter outlines the Property Survey Report
for submergence area in Indian Portion.
It was assessed that in all there are 1308 affected persons/ families that are
likely to be displace from their homesteads. Project-wise, there are 1283 PAFs
from 59 villages and 25 PAFs from 3 villages in Pancheshwar MPDP and
Rupaligad RDP respectively details are given in Table-5.1.
Table-5.1: List of PAFs losing land, land & homesteads and homesteads only
S.No Project Site Land &Homestead Only Land
1. Pancheshwar 1283 28153
2. Rupaligad 25 1562
Total 1308 29715
Source: Primary Survey
5.6 LAND REQUIREMENT FOR THE PROJECT AND PROPOSED
ACTIVITIES
The Pancheshwar MPDP and Rupaligad RDP involves land acquisition in India
and Nepal. About land of the order of 9100 ha and 5000 ha of land are likely to
be acquired in India and Nepal respectively, for various project appurtenance.
Hence, a total of 14100 ha of land from both nations would be required for
construction of various project appurtenances. About 8780 ha of land is to be
acquired for Pancheshwar Multipurpose Project and 320 ha for Rupaligad RDP
respectively. Table-5.2 provides the break-up of total land, project
appurtenance-wise, required in both the Nations for the construction or location
of various project appurtenances and/or components.
Table-5.2: Break-up of land requirement for the Project
S. No. Description of Area’s Pancheshwar (ha) Rupaligad (ha) Total (ha) India Nepal India Nepal
1 Muck Disposal Area 50 17 20 5 92
2 Quarry site Area
a) Clay 500 0 0 0 500
b) Shell Material 150 210 0 0 360
c) Coarse Aggregate 0 0 30 0 30
3 Infrastructure facilities 310 295 20 20 645
4 Project components 100 150 30 30 310
5 Road & stockpiling 70 55 20 10 155
6 Reservoir Area 7,600 4,000 200 208 12008
Total 8,780 4,727 320 273 14,100

PANCHESHWAR MULTIPURPOSE PROJECT SIA Study Report
Chapter 5: Property Survey Page 5
5.7 ASSESSMENT OF LOSS OF PRIVATE PROPERTIES
As part of the property survey the total number of PAFs/ land titleholder/
shareholders and the quantum of land each PAFs is likely to lose, enumeration
of private assets was also conducted in each of the affected villages. As
already mentioned, there are 1308 PAFs who are likely to be evicted from their
homesteads. As per the survey shall 1308 PAFs lose homesteads, process of
land acquisition. A total 1563 homestead structures would be affected, of
which, 1537 homestead structures would get impacted due to the Pancheshwar
MPDP while 26 of them would get impacted due to the Rupaligad RDP.
It was observed during survey that some of the PAFs have more than one
homestead structure which is likely to get impacted. Besides, other private
assets were also enumerated, such as lavatories, kitchens, cattlesheds, shops,
tanks, etc. As per the survey, 959 separate toilets, 252 separate kitchens
(Separate kitchens and toilets means that a separate structure is constructed
for these respective purposes, which are located within the homestead plot, but
they are not part of the main homestead structure) and 166 cattle sheds and
likely to be affected. The details are given in Table-5.3.
Table-5.3: Details of the homestead and being affected
S. No. District Name Village Name H
ou
se
To
ilet
Kit
ch
en
Ca
ttle
Sh
ed
PANCHESHWAR MPDP
1 Pithoragarh Nishani 20 15 1 0
2 Pithoragarh Gogana 49 39 7 1
3 Pithoragarh Rarikhunti 0 0 0 0
4 Pithoragarh Jamrari 22 18 0 1
5 Pithoragarh Kharku-Bhalya 59 13 0 0
6 Pithoragarh Matyal/ Matyal Chakawali 56 12 0 2
7 Pithoragarh Bhalya 37 9 0 1
8 Pithoragarh Upertola 14 2 4 3
9 Pithoragarh Pati Palchura 0 0 0 0
10 Pithoragarh Salla 5 2 1 1
11 Pithoragarh Sail 0 0 0 0
12 Pithoragarh Tade Miya 74 21 13 1
13 Pithoragarh Haldu 20 15 12 11
14 Pithoragarh Kwerali 1 2 1 0
15 Pithoragarh Sakun 0 0 0 0
16 Pithoragarh Dhyan 0 0 0 0
17 Pithoragarh Kutheri 0 0 0 0

PANCHESHWAR MULTIPURPOSE PROJECT SIA Study Report
Chapter 5: Property Survey Page 6
S. No. District Name Village Name
Ho
us
e
To
ilet
Kit
ch
en
Ca
ttle
Sh
ed
18 Pithoragarh Tarigaon 32 18 9 10
19 Pithoragarh Gyal Pipali 4 1 1 3
20 Pithoragarh Baunakot 6 1 1 0
21 Pithoragarh Basaur Mainan 0 0 0 0
22 Pithoragarh Baltari 69 48 0 4
23 Pithoragarh Gaurihat 0 0 0 0
24 Pithoragarh Rajyoura 11 5 1 2
25 Pithoragarh Kanari 47 41 6 0
26 Pithoragarh Majirkanda 94 48 14 6
27 Pithoragarh Getigara 37 21 3 12
28 Pithoragarh Bateri 0 0 0 0
29 Pithoragarh Amtari 35 30 0 14
30 Pithoragarh Renuwa 15 15 0 5
31 Pithoragarh Bathauli 0 0 0 0
32 Pithoragarh Dyora 55 41 0 0
33 Pithoragarh Sunkholi 13 16 0 0
34 Pithoragarh Panthsera 0 0 0 0
35 Pithoragarh Syuwan 0 0 0 0
36 Pithoragarh Dwalisera 92 69 11 3
37 Pithoragarh Ghigharani 0 0 0 0
38 Pithoragarh Sailoni 24 19 0 4
39 Pithoragarh Chamtoli 0 0 0 0
40 Pithoragarh Titri 60 46 0 5
41 Pithoragarh Bagadihat 28 23 18 1
42 Pithoragarh Bheliya 0 0 0 0
43 Pithoragarh Jogyoura 14 13 11 0
44 Pithoragarh Garjiya 0 0 0 0
45 Pithoragarh Jamtari 1 1 0 0
46 Pithoragarh Oltari 0 0 0 0
47 Pithoragarh Daulani 13 9 0 0
48 Pithoragarh Toli 0 0 0 0
49 Pithoragarh Tham 0 0 0 0
50 Pithoragarh Duti Bhagarh 0 0 0 0
51 Pithoragarh Dungatoli 7 4 0 0
52 Pithoragarh Kimkhola 16 12 11 2
53 Pithoragarh Bokata 0 0 0 0
54 Pithoragarh Bungli 4 1 0 0
55 Pithoragarh Bursum Bari 7 12 5 3
56 Pithoragarh Dhandadhar 2 2 1 0

PANCHESHWAR MULTIPURPOSE PROJECT SIA Study Report
Chapter 5: Property Survey Page 7
S. No. District Name Village Name
Ho
us
e
To
ilet
Kit
ch
en
Ca
ttle
Sh
ed
57 Pithoragarh Dubola-Birtola 26 12 0 0
58 Pithoragarh Kuinar 0 0 0 0
59 Pithoragarh Kuntola 0 0 0 0
60 Pithoragarh Tudli 0 0 0 0
61 Pithoragarh Nali 0 0 0 0
62 Pithoragarh Seraghat 22 15 6 5
63 Pithoragarh Sinoli Bhamalta 10 5 1 1
64 Pithoragarh Jartola 20 15 10 1
65 Pithoragarh Rasyun 0 0 0 0
66 Pithoragarh Kharkoli 10 0 1 0
67 Pithoragarh Askora 33 5 10 0
68 Pithoragarh Pali 0 0 0 0
69 Pithoragarh Raitoli 32 25 6 3
70 Pithoragarh Raitora 0 0 0 0
71 Pithoragarh Timta Chamdungra 8 14 7 7
72 Pithoragarh Damde 0 0 0 0
73 Pithoragarh Duni 0 0 0 0
74 Pithoragarh Chaurghurali 0 0 0 0
75 Pithoragarh Tulkhand 0 0 0 0
76 Pithoragarh Sibna 1 1 0 0
77 Pithoragarh Sugari 0 0 0 0
78 Pithoragarh Busial 0 0 0 0
79 Pithoragarh Garali 0 0 0 0
80 Pithoragarh Anwala Talla Malla Sugar Naula 0 0 0 0
81 Pithoragarh Dhajari 0 0 0 0
82 Pithoragarh Diyuri 0 0 0 0
83 Pithoragarh Suwal 0 0 0 0
84 Pithoragarh Tallisar 0 0 0 0
85 Pithoragarh Khetigaon 0 0 0 0
86 Pithoragarh Garali 0 0 0 0
87 Almora Malli Nalli 0 0 0 0
88 Almora Umer 0 0 0 0
89 Almora Bamori 28 20 8 0
90 Almora Aara Salpar 26 21 9 6
91 Almora Kola 8 0 0 0
92 Almora Kunj Kimola 0 0 0 0
93 Almora Mayoli 0 0 0 0
94 Almora Dwali Siddi 0 0 0 0
95 Almora Dasoli Badiyar 0 0 0 0

PANCHESHWAR MULTIPURPOSE PROJECT SIA Study Report
Chapter 5: Property Survey Page 8
S. No. District Name Village Name
Ho
us
e
To
ilet
Kit
ch
en
Ca
ttle
Sh
ed
96 Almora Kuna Phokri 0 0 0 0
97 Almora Uncha Bera 0 0 0 0
98 Almora Balikhet 0 0 0 0
99 Almora Talli Nalli 0 0 0 0
100 Almora Dhura Laga Taak 0 0 0 0
101 Almora Birkola 0 0 0 0
102 Almora Dhankana 13 6 0 0
103 Almora Melta 0 0 0 0
104 Almora Nayal Dhura 34 35 10 7
105 Almora Padoli 0 0 0 0
106 Almora Jingal 7 10 0 0
107 Almora Chimkholi 0 0 0 0
108 Champawat Betta 7 7 0 0
109 Champawat Salan 19 16 0 0
110 Champawat Netra 68 26 17 2
111 Champawat Sugarkhal 0 0 0 0
112 Champawat Bautari 67 64 15 38
113 Champawat Kuthere 0 0 0 0
114 Champawat Singda 9 2 1 1
115 Champawat Bruyuri 16 8 0 0
116 Champawat Gaika Jula 6 6 0 0
117 Champawat Khai Kot Thall 0 0 0 0
118 Champawat Vivel 24 2 20 0
119 Champawat Simalkhet 0 0 0 0
120 Champawat Khai Kot Malla 0 0 0 0
121 Champawat Choolagaon 0 0 0 0
122 Champawat Raygaon 0 0 0 0
Sub-total 1537 959 252 166
Rupaligad Project
123 Champawat Bachkot 0 0 0 0
124 Champawat Polap 0 0 0 0
125 Champawat Nidil 0 0 0 0
126 Champawat Jindi Sorari 0 0 0 0
127 Champawat Bagauti 0 0 0 0
128 Champawat Dungraleti 3 4 0 0
129 Champawat Pasam 11 11 0 0
130 Champawat Ashlad 0 0 0 0
131 Champawat Jamar Sau 0 0 0 0
132 Champawat Matiyani 0 0 0 0

PANCHESHWAR MULTIPURPOSE PROJECT SIA Study Report
Chapter 5: Property Survey Page 9
S. No. District Name Village Name
Ho
us
e
To
ilet
Kit
ch
en
Ca
ttle
Sh
ed
133 Champawat Chilniya 12 16 0 0
Sub-total 26 31 0 0
Total 1563 990 252 166
Source: Primary Survey
3 shops and 4 tanks ( These tanks are constructed by individual families to
store drinking water. The tanks are connected with the help of pipeline and
faucet to dispense water.) for storing drinking water are likely to be impacted
due to the Pancheshwar MPDP. It has been observed from the survey that
there are privately owned fish ponds; in all there 4 fish ponds in the project area
of Pancheshwar MPDP. Table-5.4 depicts village wise details of the other
private property to affected due to the project.
Table-5.4: List of other properties affected
S. No. District Name Village Name Shop Tank Fish Pond
1 Pithoragarh Kharku-Bhalya 2 4 0
2 Pithoragarh Matyal/ Matyal Chakawali 0 0 0
3 Pithoragarh Bhalya 1 0 0
4 Pithoragarh Haldu 0 0 0
5 Pithoragarh Baltari 0 0 0
6 Pithoragarh Kanari 0 0 0
7 Pithoragarh Amtari 0 0 1
8 Pithoragarh Renuwa 0 0 0
9 Pithoragarh Bathauli 0 0 0
10 Pithoragarh Sunkholi 0 0 0
11 Pithoragarh Ghigharani 0 0 0
12 Pithoragarh Chamtoli 0 0 0
13 Pithoragarh Titri 0 0 0
14 Pithoragarh Jogyoura 1 0 0
15 Pithoragarh Seraghat 0 0 0
16 Pithoragarh Jartola 0 0 0
17 Almora Aara Salpar 0 0 0
18 Almora Kunj Kimola 0 0 0
19 Almora Uncha Bera 0 0 0
20 Almora Dhura Laga Taak 0 0 0
21 Champawat Netra 0 0 3
22 Champawat Simalkhet 0 0 0
Total 3 4 4
Source: Primary Survey

PANCHESHWAR MULTIPURPOSE PROJECT SIA Study Report
Chapter 5: Property Survey Page 10
5.8 COMMUNITY PROPERTIES AND ASSETS
As per the data collected from the property survey of community owned
properties and assets. A consultation was held with the village headman,
village elders and prominent citizens to assess and enumerate community
assets located within the earmarked elevation for the respective projects. An
inventory of all such private assets was prepared which are likely to get
affected due to the process of land acquisition within 680m and 420m MSL
elevations. The village-wise details of community properties is depicted Table-
5.5.
As per the findings of the property survey. It is observed that the community
properties such as Panchayat buildings, temples/ places of worship will be
affected. A total of 115 community buildings and structures were enumerated,
which are likely to be impacted due to the submergence area of both the
projects. Of these, 21 are Panchayat buildings and 94 temples or places of
worship.
Table-5.5: Details of community property being affected in fully affected villages
S. No. District Village Name Panchayat Buildings
Temples/Other places of worship
1 Pithoragarh Kharku Bhalya 1 5
2 Pithoragarh Matyal/ Matyal Chakawali 5
3 Pithoragarh Bhalya 1 8
4 Pithoragarh Haldu 3 2
5 Pithoragarh Baltari 1 7
6 Pithoragarh Kanari 1 8
7 Pithoragarh Amtari 1 4
8 Pithoragarh Renuwa 1 5
9 Pithoragarh Bathauli
10 Pithoragarh Sunkholi 1 5
11 Pithoragarh Ghigharani 1 8
13 Pithoragarh Chamtoli 1 3
14 Pithoragarh Titri 1
15 Pithoragarh Jogyoura 1 2
16 Pithoragarh Seraghata 1 5
17 Pithoragarh Jatrola 1 5
18 Almora Dhura Laga Taak 1 8
19 Almora Ara Salpar 2 4
20 Almora Uncha Bera 1
21 Champawat Netra 1 5
22 Champawat Simalkhet 1 4
Total 21 94
Source: Primary Survey

PANCHESHWAR MULTIPURPOSE PROJECT SIA Study Report
Chapter 5: Property Survey Page 11
5.9 GOVERNMENT BUILDING, STRUCTURE AND SPACES
As per the property survey, a total of 98 government buildings/ structures and
293 installations were enumerated, which are likely to be impacted due to the
submergence area of the both the projects. A total of 3 post offices, 5 primary
health centres, 29 primary schools and 14 secondary schools are likely to be
affected. In addition, there are 1 dug well, 44 water tanks and 2 hand pumps
will also be affected. The details are given in Table-5.6.
Table-5.6: Village-wise details of Government Building, Structure and
Spaces in the fully affected villages
S. No. District Village Name P
ost
Off
ice
Pri
mary
He
alt
h
Ce
ntr
e
Pri
mary
Sc
ho
ol
Se
co
nd
ary
Sc
ho
ol
Du
g W
ell
Wa
ter
Tan
k
Ha
nd
Pu
mp
1 Pithoragarh Kharku Bhalya 1 2
2 Pithoragarh Matyal/Matyal Chakwali
3 Pithoragarh Bhalya 2 2
4 Pithoragarh Haldu 1 5 1 4
5 Pithoragarh Baltari 1 1 1 2
6 Pithoragarh Kanari 1 1 2
7 Pithoragarh Amtari 1 1
8 Pithoragarh Renuwa 1 1 1
9 Pithoragarh Bathauli 1 3
10 Pithoragarh Sunkholi 1 1 2
11 Pithoragarh Ghigharani 1 2 1
12 Pithoragarh Chamtoli 1 1 4
13 Pithoragarh Titri 1 1 4
14 Pithoragarh Jogyoura 1 2
15 Pithoragarh Seraghata 1 1 3 2 2
16 Pithoragarh Jatrola 2 1 1 1
17 Almora Kunj Kimola 1 1 1
18 Almora Dhura Laga Taak
1 1 1
19 Almora Ara Salpar 1 2 2 3
20 Almora Uncha Beru
21 Champawat Netra 2 1 2
22 Champawat Simalkhet 1 1 1 3
Total 3 5 29 14 1 44 2
Source: Primary Survey

PANCHESHWAR MULTIPURPOSE PROJECT SIA Study Report
Chapter 5: Property Survey Page 12
5.10 SUMMARY
Subsequent to the delineation of the affected/ impacted zone, the survey team
prepared a list of all the affected khasra/ plot numbers that are within the
project area. A list was prepared for the affected khasra numbers. Thereafter,
the team collected land records, viz., Right of Records (RoRs) of all the
affected villages. Analyses of the RoRs lead to enumeration of affected
persons/ families/ land titleholders likely to lose land, land and homesteads
and homesteads only.
Project Affected Families
It was assessed that in all there are 1536 affected persons/ families that are
likely to be displace/ evicted from their homesteads. The same PAFs would
also lose their lands as well. Further, there are 29715 land titleholders/ project
affected persons/ families who are likely to lose only their lands.
In all there are 1563 homesteads structures, 990 separate lavatories, 252
separate kitchens, 166 cattle-sheds that would be impacted as a result of the
process of land acquisition. In addition, 3 shops, 4 tanks for storing drinking
water, 4 fish tanks will also be affected.
Community Properties
During the property enumeration, community properties such as Panchayat
buildings, temples, water tanks constructed by the irrigation department for
drinking water, hand pumps, etc were enumerated. As per our survey, a total of
21 Panchayat buildings and 94 temples and places of worship are likely to be
impacted due to the submergence area of the both the projects.
Government Buildings
As per the property survey, a total of 98 government buildings were
enumerated, which are likely to be impacted due to the submergence area of
both the projects. A total of 3 post offices, 5 primary health centres, 29 primary
schools, and 14 secondary schools were enumerated as likely to be impacted.
Water Supply Facilities
1 dug well, 14 water tanks and 2 hand pumps that are also likely to be affected.

CHAPTER-6
SOCIAL IMPACT ASSESSMENT

PANCHESHWAR MULTIPURPOSE PROJECT SIA Study Report
Chapter 6: Social Impact Assessment Page 1
CHATER-6
SOCIAL IMPACT ASSESSMENT
6.1 INTRODUCTION
A project of this magnitude is likely to entail both positive as well as negative
impacts on the socio-cultural fabric of the project area and its surroundings. At
present, most of the population is engaged in agriculture. During construction
and operation phases, a lot of allied activities will mushroom in the project area.
It is felt that most of the labour force would come from various parts of the
country. However, some of the locals would also be employed to work in the
project. The labour force would stay near to the project construction sites. Apart
from direct employment, opportunities for indirect employment will also be
generated which would provide great impetus to the economy of the local area.
Various types of business like shops, food-stall, tea stalls, etc. besides a variety
of suppliers, traders, transporters will concentrate here and benefit immensely
as demand will increase significantly for almost all types of goods and services.
The business community as a whole will be benefitted. The locals will avail
these opportunities arising from the project and increase their income levels.
With the increase in the income levels, there will be an improvement in the
infrastructure facilities in the area. The educational, health, social services,
communication, etc. are some of the sectors which will improve greatly as a
result of the upcoming project. The quality of life of the locals including women
will improve as a result of the project.
On the contrary the project will also lead to certain negative impacts. The most
important negative impact due to the commissioning of the project would be
that a number of families would be displaced from their lands, homesteads and
economic activity. Besides, certain impacts are likely to emerge due to inter-
mixing of the native population with the expatriate labour force. Differences in
social, cultural and economic conditions among the natives and labour force
may lead to some vices among the natives. However, most of the deleterious
impacts, which have been elaborated in the following sections, could be
prevented, if timely interventions are administered.
6.2 IMPACTS DURING CONSTRUCTION PHASE
It is expected that a lot of labour force will be deployed at the project site during
the construction phase and the total increase in population during peak
construction has been estimated to the tune of 22,600. Together with the work
force many business establishment will take place which will attract people from

PANCHESHWAR MULTIPURPOSE PROJECT SIA Study Report
Chapter 6: Social Impact Assessment Page 2
other places. Influx of labour population might lead to number of social, cultural,
economic and security related problems. However, it is evident that the local
residents will have an upper hand in the establishments of any business
ventures.
6.2.1 Local employment opportunities
A number of marginal activities and jobs would also be available to the local
population during construction phase. Marginal jobs such as those of unskilled
labour, drivers, cooks, peripheral shops, peons and messengers etc. would
open up for the locals. However, such opportunities would be limited.
The scope for a number of non-project activities, especially in business and
self-employment sector, job opportunities, will increase tremendously during
construction phase. Business opportunities such as tea stalls, eating joints and
restaurants, fruits and vegetables vending shops, hiring of vehicles, Photostat,
internet café, mechanic and repair shops (of electrical & mechanical types),
small hotels, boarding and lodging provisions, etc would boom. It is felt that a
large number of enterprising locals in the vicinity of the project area would reap
benefits of such business and self-employment opportunities.
6.2.2 Construction workforce related influence on social services
(Educational, Health, Communication, Water Supply, Consumer
Goods, and Sanitation etc.)
During construction phase a large labour force, including skilled, semi-skilled
and un-skilled labour force, is expected to immigrate into the project area Some
of the locals would also be employed to work in the project. The labour force
would stay near to the project construction sites. Education will receive a shot
in the arm. The advantages of education to secure jobs will quickly percolate
through all sections of the population and will induce people to get their children
educated. A sizeable amount of surplus generated through labour will be spent
on education.
The labour force that would work in the construction phase would settle around
the project site. They would temporarily reside there. This may lead to pollution,
due to generation of domestic wastewater, human waste, municipal solid waste
etc. Besides, other deleterious impacts are likely to emerge due to inter-mixing
of the local communities with the labour force. Differences in social, cultural and
economic conditions among the locals and labour force could also lead to
friction between the migrant labour population and the local population.

PANCHESHWAR MULTIPURPOSE PROJECT SIA Study Report
Chapter 6: Social Impact Assessment Page 3
6.2.3 Construction workforce related influence on law and order
Certain impacts are likely to emerge due to inter-mixing of the local
communities with the expatriate labour force. Differences in social, cultural and
economic conditions among the locals and labour population could become a
reason of friction between the migrant labour population and the local
population.
6.2.4 Construction related influence on occupational health, community
health, and Accidental risks
The labour would be vulnerable to accidents, if appropriate management
measures are not undertaken during project construction phase. The
construction phase of any project is rather an unsettled stage characterized by
uncertainties and often disorders. The basic problem relates to management of
large population which migrates to the construction area in search of jobs.
The labour population involved in construction activities may immigrate into the
project area is likely to have different cultural, ethnic and social backgrounds.
Such a mixture of population has its own advantages and disadvantages. The
advantages include exchange of ideas and cultures between various groups of
people which would not have been possible otherwise. Due to longer residence
of this population in one place, a new culture, having a distinct socio-economic
identity would develop which will have its own entity.
The benefits however, are always not a certainty and depend on several
factors. Often, they are directly related to the way construction phase is
handled by the project authorities and their sensitivity to various socio-
economic problems that could develop during this phase.
It is normally experienced that untreated sewage would find its way into natural
drainage system, and is likely to get collected as pools of sewage or it out-falls
into the nearest water body along natural drainage pattern. Thus, it is important
to provide appropriate sewage treatment facilities at the labour camp and at the
construction site prior to disposal on land or in water body. The garbage
comprising of waste materials, e.g. packaging, polythene or plastic materials
are likely to be generated during project construction and operation phase at
the power station. The same needs to be properly collected and disposed at
designated sites.

PANCHESHWAR MULTIPURPOSE PROJECT SIA Study Report
Chapter 6: Social Impact Assessment Page 4
6.2.5 Improved access facilities in the project area
Development of the proposed Pancheshwar Multi-purpose project will have
multifold beneficial impacts. The immediate beneficial impacts from the project
will be improved connectivity by the road. The improved road access will bring
an improvement of food security situation and overall economic and social
stability. The improved access road will also provide cheap, safe and fast
transport of goods and services from rural areas to urban centers and vice
versa. This will contribute significantly to improve the overall socio-economic
condition of the people.
6.2.6 Impacts on infrastructure
The availability of infrastructure is generally a problem during the initial
construction phase. Though the construction workers would be willing to pay for
certain facilities like health, education, etc., the facilities itself are often not
made available timely and of the desired quality. The adequacy of water supply,
sewage treatment, housing etc. should, therefore, be ensured before and
adequate measures would be taken at the very start of the project.
6.2.7 Impacts on public health due to migrant population
About 8500 labourers, technical staff and service providers will congregate in
the project area during peak construction phase. The total increase in
population is expected to be of the order of 22,600. Most of the labour would
come from various parts of the country. The labourer would live in dormitories
provided by the Contractor. Proper sanitary facilities are generally provided.
Hence, a proper surveillance and immunization schedule needs to be
developed for the labour population migrating into the project area.
6.2.8 Increased incidence of vector-borne diseases due to excavations
The excavation of earth from borrow pits etc. is one of the major factor for the
increase in prevalence of malaria. After excavation of construction material, the
depressions are generally left without treatment where water gets collected.
These pools of water, then serves as breeding grounds for mosquitoes.
However, in the present case, the borrow areas are within the river bed, which
in any case remain under water. Thus, no additional habitat for mosquito
breeding is created due to excavation. The flight of mosquito is generally limited
up to 1 to 2 km from the breeding sites. Since, no residential areas are located
within 1 km from the reservoir periphery, increased incidences of malaria are
not anticipated. However, labour camps, etc. could be vulnerable to increased

PANCHESHWAR MULTIPURPOSE PROJECT SIA Study Report
Chapter 6: Social Impact Assessment Page 5
incidence of malaria, if proper measures for drainage and mosquito control are
not undertaken.
6.2.9 Impacts on public health due to inadequate facilities in labour
camps
Improperly planned labour camps generally tend to become slums, with
inadequate facilities for potable water supply and sewage treatment and
disposal. This could lead to outbreak of epidemics of water-borne diseases.
Adequate measures for supply of potable water and sewage treatment have
been recommended as a part of Environmental Management Plan outlined in
Volume-II of this Report.
6.2.10 Loss of Historical and Cultural Monuments and Mineral Reserves
The reservoir so constructed as a result of construction of the dam will not
submerge any monument notified by Archaeological Survey of India (ASI).
However, about 89 temples are likely to be submerged. Among these
temples, three temples located at Pancheshwar, Rameshwar and
Taleshwar are the major temples which are revered not only by the locals but
also by the people in the surrounding areas. The main deity in these three
temples is Lord Shiva. The temple at Pancheshwar is located about 2.5 km
upstream of dam site at the confluence of rivers Sarju and Mahakali. The R.L.of
the temple is about 450 m. Thus, the depth of the reservoir water above this
temple will be 230 m. The temple at Rameshwar is situated at the confluence of
rivers Sarju and Ramganga. The R.L. at this site is 550 m. The depth of the
water above the temple will be about 130 m. The other major temple is at
Taleshwar along the banks of river Mahakali, about 10 km upstream of
Jhulaghat. The depth of water above this temple would be about 120 m. The
reservoir depth over the above mentioned temples sites are too high (120 m to
250 m) to be protected by engineering structures. Thus, these temples will
be submerged as a result of the projects.
6.2.11 Impacts on Mineral Resources
No mineral deposits are coming under submergence due to the reservoir. The
project and its surrounding areas have little or no mineral deposits.
6.3 IMPACTS DURING OPERATION PHASE
Although there are a number of positive impacts of the proposed project,
certain negative impacts will also be there, which are described in the following

PANCHESHWAR MULTIPURPOSE PROJECT SIA Study Report
Chapter 6: Social Impact Assessment Page 6
paragraphs.
6.3.1 Impacts due to acquisition of land and homesteads
It was assessed that in all there are 1536 affected persons/ families that are
likely to be displace/ evicted from their homesteads. The same PAFs would
also lose their lands as well. Further, there are 29715 land titleholders/ project
affected persons/ families who are likely to lose only their lands.
In all there are 1563 homesteads structures, 990 separate lavatories, 252
separate kitchens, 166 cattle-sheds that would be impacted as a result of the
process of land acquisition. In addition, 3 shops, 4 tanks for storing drinking
water, 4 fish tanks will also be affected.
The risks involved due to acquisition of land and homestead are given as below:
Expropriation of land removes the main foundation on which people build
productive systems, commercial activities, and livelihoods. Often land is
lost forever, sometimes it is partially replaced, and seldom is it fully
replaced or fully compensated. This is the principal form of de-
capitalization and pauperization of displaced people, as they lose both
natural and man-made capital
Loss of wage employment occurs on account of acquisition of agriculture
land, yet creation of new jobs is difficult and requires substantial
investment. Resulting unemployment or underemployment among
resettlers endures long after physical relocation has been completed.
Loss of housing and shelter may be only temporary for many displaced
families, but for some homelessness remains a chronic condition
Marginalization occurs when families lose economic power and slide on
a downward mobility path middle-income farm - households do not
become landless, they become small land holders, small shopkeepers’
and craftsmen downsize and slip below poverty thresholds. Relative
marginalization often begins long before actual displacement; for
instance when lands are identified for future flooding they are implicitly
devalued, as new public and private infrastructure investment are
prohibited and the expansion of social services is also not done

PANCHESHWAR MULTIPURPOSE PROJECT SIA Study Report
Chapter 6: Social Impact Assessment Page 7
6.3.2 Impoverishment Risk Assessment (IRA)
In project feasibility and preparation studies, the IRA performs two basic
functions. Foremost, it serves as a diagnostic and predictive tool, to anticipate
risks in resettlement and to assess their nature and their expected intensity.
Secondly, IRA is also used as a problem resolution and planning function, to
guide the incorporation of measures matching each main risk, either for
prevention or mitigation. The IRA identifies impoverishment not only in terms of
income, but also in terms of employment opportunities, health care, nutrition,
food security, common assets, education, shelter or social capital.
The IRA framework has been synthesized from the knowledge of past
experiences, which saves considerable time and effort in feasibility work by not
demanding general risk analysis to start afresh in each project, but rather by
ex-ante offering a well-tested starting point. The matrix of eight basic risks in
light of historical experience, predictable in most resettlement situations:
landlessness, joblessness, homelessness, marginalization, increased morbidity
and mortality, food insecurity, loss of access to common property, and social
(community) disarticulation. Each of these risks is discussed in Table-6.1.
Table-6.1: Impoverishment Risk Assessment
S. No. Risks
involved
Description of risks involved Details
1. Landlessness Expropriation of land removes
the main foundation on which
people build productive
systems, commercial activities,
and livelihoods. Often land is
lost forever, sometimes it is
partially replaced, and seldom is
it fully replaced or fully
compensated. This is the
principal form of de-
capitalization and pauperization
of displaced people, as they
lose both natural and man-
made capital.
The villagers depend on their
lands for their livelihood. In
addition, there are a number
of families that are
dependent on these lands
for their livelihood, who work
as agricultural labour work
force. Acquisition of lands
would invariably affect their
means of livelihood and
sustenance.
2. Joblessness Loss of wage employment
occurs on account of acquisition
of agriculture land, Yet creation
of new jobs is difficult and
requires substantial investment.
Resulting unemployment or
Loss of wage employment
occurs on account of
acquisition of agriculture
land, yet creation of new
jobs is difficult and requires
substantial investment.

PANCHESHWAR MULTIPURPOSE PROJECT SIA Study Report
Chapter 6: Social Impact Assessment Page 8
S. No. Risks
involved
Description of risks involved Details
underemployment among
resettlers endures long after
physical relocation has been
completed.
Resulting unemployment or
underemployment among
resettlers endures long after
physical relocation has been
completed. There are a
number of PAFs who are
dependent on agricultural
land. The submergence of
this land would adversely
affect the job opportunities in
the area.
3. Homelessness Loss of housing and shelter
may be only temporary for
many displaced families, but for
some homelessness remains a
chronic condition.
Homelessness would be an
issue for these families
losing homestead.
Villagers have a special
bonding with their land and
properties which they never
like to part with. The
submergence of the project
will cause displacement of
the Abadi population pushing
them towards forced
transition from one place to
another which may be a
strange place for them. This
transition will cause stress
and unnecessary pressure
on their day to day lives.
4. Marginalization Marginalization occurs when
families lose economic power
and slide on a downward
mobility path middle-income
farm - households do not
become landless, they become
small landholders, small
shopkeepers’ and craftsmen
downsize and slip below
poverty thresholds. Relative
marginalization often begins
long before actual
displacement; for instance when
lands are condemned for future
This aspect needs to be
carefully and sensitively
assessed, as the main
source of sustenance, ie.,
land would be acquired and
thus the main source of
income and livelihood is
gone; the possibility of many
of the PAFs would become
marginalized. As mentioned
there are land titleholders
that would lose land due to
the process of land
acquisition.

PANCHESHWAR MULTIPURPOSE PROJECT SIA Study Report
Chapter 6: Social Impact Assessment Page 9
S. No. Risks
involved
Description of risks involved Details
flooding they are implicitly
devalued as new public and
private infrastructure investment
are prohibited and the
expansion of social service is
undercut.
It is felt that only a few
families/ individuals that
would be able to bear the
brunt of land acquisition. For
the remaining the possibility
of sliding on a downward
mobility path would be
inevitable unless alternative
sources of livelihood are not
provided.
5. Increased
Morbidity and
Mortality
Serious decreases in health
levels result from displacement
caused social stress, insecurity,
psychological trauma and out-
break of relocation related
illnesses particularly water-
borne and vector-borne
diseases.
Unsafe water supply and poor
sewerage system increase
vulnerability to epidemic and
chronic diarrhea, dysentery etc.
The weakest segments of the
demographic spectrum, viz.,
infants, children and the elderly
are severely affected the most.
Fluctuations in morbidity and
mortality rates would depend
on the displacement related
social stress, insecurity,
psychological trauma. Out-
break of illnesses particularly
water-borne and vector-
borne diseases can be
envisaged. But these would
depend on the kind of civic
amenities provided at the
relocation or at the labour
camps, where the labour
would be housed.
Health indicators could also
fluctuate due to the presence
of labour colonies that have
come to work in the plant
construction. Thus it is
imperative to provide proper
civic amenities in these
colonies as well.
6.4 IMPACTS DUE TO COMMAND AREA DEVELOPMENT
6.4.1 Improvement in agriculture production
The project envisages irrigation over an area of 2.59 lakh ha. With the
introduction of irrigation, not only the irrigation intensity will improve, but also
the cropping intensity will improve. The introduction of irrigation will also lead to
improvement in agriculture productivity as well.

PANCHESHWAR MULTIPURPOSE PROJECT SIA Study Report
Chapter 6: Social Impact Assessment Page 10
The total agriculture production would increase resulting in increase in
agriculture production. The increase in crop production would also increase the
income level, which is a significant positive impact.
6.4.2 Improvement in livestock
The improvement in the socio-economic status of the population in the
command area will indirectly improve the quality of livestock. The main reasons
could be improvement in the supply and availability of the veterinary services
along with the betterment in the infrastructure facilities in the area.
During project operation phase, food grain production will increase significantly.
Assuming even 50% of agriculture by product is usable as fodder, hence, it
would satisfy the fodder requirements of large number of cattles. This will
reduce the pressure on the existing forests or vegetation of the area, which is a
significant positive impact. The project would also improve the water availability
for livestock. The coupled with improved fodder availability improve the
livestock status of the area. It has been observed in other Irrigation Projects the
number of livestock does not increase significantly. It is the quality of livestock
that show similar improvement. Similar impacts are envisaged in the proposed
Project as well.
6.4.3 Employment generation
The increase in the irrigation intensity in the command area would improve the
employment scenario to a large extent. The introduction of irrigation requires a
greater amount of labour in fields. This would improve the employment scenario
not only for the local farmers, but would also increase the demand for
agricultural labour. On average, labour demand in irrigated and unirrigated field
is 200 man-days/ year/ ha and 100 man-days/ha/year. The employment
potential in with out -project phase for a cropped area of 2, 45,000 ha have
about 24.5 million which will increase to 49.0 million man-days in project
operation phase. Thus, with the increase in the irrigation intensity, manpower
requirement in the agriculture sector would increase by 24.5 million man days
per year.
As per the general definition, a main worker is defined as one who is engaged
in any economically productive activity for at least for 183 days or six months in
a year. Thus, the increased irrigation intensity will ensure employment to about
1, 33,000 persons per year. This is a significant positive impact.

PANCHESHWAR MULTIPURPOSE PROJECT SIA Study Report
Chapter 6: Social Impact Assessment Page 11
6.4.4 Urbanization
The commissioning of the project will increase the gross money flow in the
command area. This will lead to significant impacts in the project area. The
area will have increased demands for services, such as sewerage system,
communication, transportation, medical and educational facilities, etc. It is
presumed that all these developments would result in generation of additional
employment. Thus, with the increased income level, there will be a greater
impact for urbanization in the command area.

CHAPTER-7
RESETTLEMENT AND REHABILITATION PLAN

PANCHESHWAR MULTIPURPOSE PROJECT SIA Study Report
Chapter: 7 Resettlement & Rehabilitation Plan Page 1
CHAPTER- 7
RESETTLEMENT AND REHABILITATION PLAN
7.1 INTRODUCTION
The Pancheshwar MPDP and Rupaligad RDP are located in the mountainous
state of Uttarakhand; many of the affected villages are remotely located and
accessed by footpath, by varying distances from the nearest road-head. A
project of this magnitude is likely to impact 123 villages by the Pancheshwar
MPDP and 11 villages by the Rupaligad RDP due to the process of land
acquisition for various purposes. The deleterious impacts would include
submergence and or acquisition of land, primarily cultivated lands and
orchards, eviction of families from their homesteads, acquisition of other private
properties, community property resources, and government assets. Thus, all
such assets and properties that are likely to be impacted would require to be
compensated. Therefore, it is essential to spell out the loss which is likely to be
incurred due to the process of land acquisition. This would enable project
planners to either look for less impacting options or to take appropriate
measures to devise suitable compensation and R&R package as a solace to
the PAFs.
This chapter details-out the enumeration of various properties and assets that
are likely to be affected due to the process of land acquisition for the
Pancheshwar MPDP and Rupaligad RDP. The Compensation shall be awarded
to the affected population on the guidelines of the “The Right to Fair
Compensation and Transparency in Land Acquisition, Rehabilitation and
Resettlement Act 2013”. The details of the private land been acquired is given
in Tables-7.1 and 7.2 summarize the Project wise PAFs losing land &
Homestead and only Land.
Table-7.1: Details of land to be acquired for the project
S. No. Parameter Total Private Land Acquired (ha)
1 Pancheshwar Fully Affected Villages 463.81
2 Pancheshwar Partially Affected Villages 3227.83
3 Rupalgadi Partially Affected Villages 44.16
Total 3735.8
Source: Property Survey

PANCHESHWAR MULTIPURPOSE PROJECT SIA Study Report
Chapter: 7 Resettlement & Rehabilitation Plan Page 2
Table-7.2: List of PAFs losing Homesteads & Land and Only Land
S. No. Project Name PAFs losing Land &
Homestead
PAFs losing
Land Only
Total
1 Pancheshwar MPDP 1283 28153 29436
2 Rupaligad RDP 25 1562 1587
Total PAFs 1308 29715 31023
Source: Property Survey
7.2 RESETTLEMENT AND REHABILITATION PLAN
For the purpose of this project, the R&R plan has been devised using the
norms and guidelines of the “Right to Fair Compensation and Transparency in
Land Acquisition, Rehabilitation and Resettlement Act, 2013”. The Consultant
based on past experiences in similar projects, in the area have
suggested/specified/ augmented/ enhanced the R&R provisions. The objective
of the R&R Plan is to enable project planners to take appropriate measures to
devise suitable compensation as a part of resettlement and rehabilitation
package for the PAFs.
7.2.1 MEASURES FOR COMPENSATION OF LOSS OF PRIVATE
PROPERTIES
7.2.1.1 Compensation for Land
Of the total land coming under submergence area, private irrigated land
accounts for 2822.43 ha. About 31023 families are likely to lose land in
submergence area of the project. The compensation for acquisition of private
land would be paid to the respective land owners/ land titleholders as per the
provisions of “Right to Fair Compensation and Transparency in Land
Acquisition, Rehabilitation and Resettlement Act, 2013”.
7.2.2 COMPENSATION FOR HOMESTEADS
It is envisaged that this proposed project is also likely to evict a number of
families from their homesteads as well. As per the assessment, in all there are
1563 homestead structures are likely to get affected as a result of land
acquisition.

PANCHESHWAR MULTIPURPOSE PROJECT SIA Study Report
Chapter: 7 Resettlement & Rehabilitation Plan Page 3
7.2.3 COMPENSATION OF OTHER PROPERTIES
Other properties such as trees, wells, ponds, temples, cremation grounds,
public utility buildings and spaces, electric and telephone poles and cables,
etc., would be assessed, evaluated and compensation rates would be fixed as
per the prevalent guidelines/norms. The compensation amount shall be
disbursed to the concerned department, agency, individuals, etc.
7.3 MEASURES FOR RESETTLEMENT
There are 1308 families that are likely to be evicted from their homesteads as a
result of the process of land acquisition due to construction of dam and
subsequent submergence area. These families would be eligible to receive
resettlement benefits, in addition to compensation of homestead plot and
structure. The provisions “Right to Fair Compensation and Transparency in
Land Acquisition, Rehabilitation and Resettlement Act, 2013” have been taken
into consideration. Further, it is suggested that these families be resettled/
relocated at one place as a group, in one or more of the existing nearby
villages. The provisions for Resettlement that would be extended to the families
losing homesteads are given in Table-7.3.
Table-7.3: Provisions for Resettlement Plan for families losing homestead
S. No. Description Unit Assumed Provision
Cost (Rs. lakh)
Housing Benefits and Compensation
1 a) If a house is lost in rural areas, a constructed house shall be provided as per the Indira Awas Yojana specifications.
b) If a house is lost in urban
areas, a constructed house shall be provided, which will be not less than 50 sqmts in plinth area
c) In case family in urban
areas does not opts to take the house offered, one-time financial assistance of not less than Rs. 150,000/- for house construction
d) If any affected family in rural
areas so prefers, the
Resettlement benefits shall be extended to 1308 PAFs who are likely to be evicted from their homesteads. Thus, a provision of 32.7 ha (1308 PAFs x 250sqm x 10-4) is required for providing housing plots to the displaced families. In addition, about 25% of the plot size would be required for providing civic amenities and
72300.28

PANCHESHWAR MULTIPURPOSE PROJECT SIA Study Report
Chapter: 7 Resettlement & Rehabilitation Plan Page 4
S. No. Description Unit Assumed Provision
Cost (Rs. lakh)
equivalent cost of the house may be offered in lieu of the constructed house
about 25% of the plot size for providing infrastructure facilities (amounting to 36.96 ha) are also required to be provided in the resettlement site. Thus, the total land required for the resettlement site: ( + 36.96) 110.89 ha Cost of land for Rehabilitation has been taken 4 times of the maximum circle rate of Pithoragarh i.e. (1.63 x 4) Rs. 6.52 crore/ha
2. House Building Assistance @ Rs. 1,50,000/ha +. Escalation Factor of 20.9% for Pitoragarh District
Per family
1308 PAFs x Rs. 150,000/PAF x 1.209
2372.06
3. Cattle Shed
One-time financial assistance of a minimum of Rs. 25,000/- or as the appropriate Government may, by notification specify, for construction of cattle shed + Escalation Factor of 20.9% for Pitoragarh District
Per family
1308 PAFs x Rs. 25,000/PAF x 1.209
395.34
4. Transportation Grant
One time financial assistance of Rs. 50,000/-for each displaced family for shifting of the family, building materials, belongings and cattle.
Per family
1308 PAFs x Rs. 50,000/PAF
654.00
5. Subsistence Allowance
a) Each affected family, losing land, will be given a monthly subsistence allowance equivalent to Rs. 3000/
Per family
1308 PAFs x Rs. 50,000/PAF
654.00

PANCHESHWAR MULTIPURPOSE PROJECT SIA Study Report
Chapter: 7 Resettlement & Rehabilitation Plan Page 5
S. No. Description Unit Assumed Provision
Cost (Rs. lakh)
month for a period of one year from the date of award. Scheduled Castes and the Scheduled Tribes displaced from Scheduled Areas shall receive an amount equivalent to Rs. 50,000/-, in addition to subsistence allowance
6. One time Resettlement Allowance
Each affected family shall be given a one time “Resettlement Allowance” of Rs. 50,000/
1308 PAFs x Rs. 50,000/PAF
654.00
7. Stamp Duty and Registration
a) The stamp duty and the other fees payable for registration of the land of the house allotted to the affected families shall be borne by the requiring body
b) The land for house allotted to the affected families shall be free from all encumbrance
c) The land and the house allotted may be in the joint names of wife and husband of the affected family.
To be decided by the District Administration
TOTAL 77029.68 Note: Escalation factor for construction has been taken as 20.9%, which is highest among the
three project affected districts, i.e. Pithoragarh, Almora and Champawat.
7.4 AMENITIES AND INFRASTRUCTURAL FACILITIES TO BE
PROVIDED AT RESETTLEMENT SITES
In addition to the resettlement benefits that would be extended to the PAFs, the
following Amenities and Infrastructural Facilities are proposed to be provided at
Resettlement sites.

PANCHESHWAR MULTIPURPOSE PROJECT SIA Study Report
Chapter: 7 Resettlement & Rehabilitation Plan Page 6
Internal Village Road Network
For easy movement of people and vehicular traffic within the proposed
resettlement sites, it is suggested to construct a 4.5 m wide internal
village road within each of the resettlement sites. These internal village
roads would be connected to an access road which connects villages. It
is proposed to construct about 25 km of internal road network. An
amount of Rs.1000 lakh is being earmarked for construction of 50 km
metalled Internal Village Roads, which includes all costs, such as
cutting, Leveling, Aggregates, black top, labor, etc.
Drainage Network within the Resettlement site
It is proposed to construct Drainage network in each of the resettlement
colonies. The main purpose of this drainage network is to clear storm
water and domestic waste water from kitchens and bathrooms. It is also
proposed that the drainage networks will consisting of a lined drain and
covered with RCC slabs. These drains will traverse parallel along
internal village road, and finally culminate into a collection tank, before it
is screened and filtered and thereafter either stored in an underground
storage tank to be utilized for irrigation purposes in the Green belt areas,
or discharged for the purpose of ground water recharge. An amount of
Rs. 1000 lakh is being earmarked for providing drainage network in the
resettlement sites, which will include costs towards excavation, brick
work, cementing, RCC cover, labor, etc.
Sanitation Network within the Resettlement site
Sanitation network is proposed to be laid within each resettlement site.
The main purpose of this network will be to transport domestic waste
(night soil waste from lavatories). In addition, the sanitation network will
also carry waste from schools, health care facility and other complexes
within the resettlement sites. An amount of Rs. 400 lakh is earmarked to
create a network of sewer pipeline emanating from each source, running
parallel along the internal village road. The cost for establishment of
sewer network, including all expenses [(excavation, length of pipe, man-
holes, labor, cover-up, etc. with specification (Dia. 150 mm, RCC NP2
Pipe, 1.5 m depth)]. It is proposed to treat the sewage through septic
tanks. The treated sewage will be disposed in absorption trenches.
Thus, a total provision of Rs. 300 lakh needs to be earmarked for
creation of sanitation network within the resettlement site.
Safe drinking water
Safe drinking water @ 135 lpcd is proposed to be provided to the PAFs
by constructing an overhead storage tank and distributed through a

PANCHESHWAR MULTIPURPOSE PROJECT SIA Study Report
Chapter: 7 Resettlement & Rehabilitation Plan Page 7
network of pipelines. It is suggested to lay underground drinking water
pipeline along the internal village road, on the opposite side of the
corridor for drainage and sanitation network. The network would involve
100 mm dia DI pipeline along the internal village roads at various
resettlement sites. The cost for laying this network including digging,
pipes, jointing, labor, etc is about Rs. 500 lakh.
Further, cost towards extending house connections (15 mm dia GI pipe)
from the above-mentioned network would be about Rs. 10 lakh. Thus,
total cost for laying drinking water network is Rs. 610 lakh. It is
suggested that the Project Developer makes arrangement for making
water potable before it is supplied into the resettlement colonies. In this
regard, cost for construction of Conventional Water Treatment Plant has
been earmarked. A total provision of Rs. 250 lakh may be earmarked for
this purpose. Thus, a total amount of Rs. 760 lakh has been earmarked
for providing water supply in the resettlement sites.
Footpath
It order to ensure safe movement of residents within the resettlement
sites, it is proposed to construct 1 m corridor on either sides of the
internal village road for footpath. A lump-sum amount of about Rs. 50
lakh has been earmarked for laying footpath (including leveling, tiling,
labor, etc.).
Drinking water trough for cattle
For families that wish to rear livestock, it is proposed to construct about 4
drinking water troughs for cattle in various resettlement sites. A lump-
sum amount of Rs. 10 lakh is being earmarked for construction of
drinking water troughs for cattle in various resettlement sites.
Place of Worship
A plot size measuring 0.5 ha is suggested to be earmarked for
construction of place of worship in resettlement site. A lump-sum amount
of Rs. 50 lakh has been earmarked for providing place of worship.
Cremation grounds
It is proposed to earmark an area of 1.0 ha of land plot for establishment
of Cremation ground and/or burial ground. A total lump-sum amount of
Rs. 50 lakh may be earmarked for construction of cremation ground in
various resettlement sites.

PANCHESHWAR MULTIPURPOSE PROJECT SIA Study Report
Chapter: 7 Resettlement & Rehabilitation Plan Page 8
Fair Price shops and other shops
It is suggested to provide a constructed space for 1 Fair Price shop and
4 other shops in each of the Resettlement colonies. An area of 0.005 ha
[(4m x 2.5m) x 5 shops] may be earmarked in each resettlement site. A
lump-sum amount of Rs. 50 lakh may be earmarked for providing fair
price shop in various resettlement colonies.
Post Office
A plot size measuring 10 m long x 5 m wide is suggested to be
earmarked for the construction of post office, in various resettlement
sites. It is suggested to provide one drinking water post and one WC in a
building. A lump-sum amount of Rs. 25 lakh has been earmarked for
providing post office in various resettlement colonies.
Panchayat Ghar
A plot size measuring 0.25 ha is suggested to be earmarked for the
construction of panchayat ghar. It is suggested to construct the building
over an area of 20m x 15m with one drinking water post and one WC
facility. A lump-sum amount of Rs. 50 lakh may be earmarked for
providing Panchayat ghar in various resettlement colonies.
Community Hall
A plot size measuring 0.25 ha is suggested to be earmarked for the
construction of community hall in various resettlement sites. Further, it is
suggested to construct a two storey building over an area of 20m x 15m.
It is also suggested to provide a drinking water post and two WC on the
ground floor. A lump-sum amount of Rs. 120 lakh may be earmarked for
providing community hall in various resettlement colonies.
Health Care Facility
It is suggested to construct 1 PHCs in the resettlement site to be shared
by all the PAFs and other residents in the vicinity. It is suggested to have
2 ambulances that will be well equipped with medical aid and
paramedical staff.
A plot size measuring 0.25 ha is suggested to be earmarked for the
construction of a Primary Health Center (PHC) in the resettlement site.
In these plots, it is suggested to construct building with covered area of
1250sqm (50m x 25m). Further, it is also suggested to provide a drinking
water post and two WC within the PHC. A lump-sum amount of Rs. 50
lakh may be earmarked for providing the PHC building and Rs. 400 lakh
earmarked for purchase of various furniture and equipment including
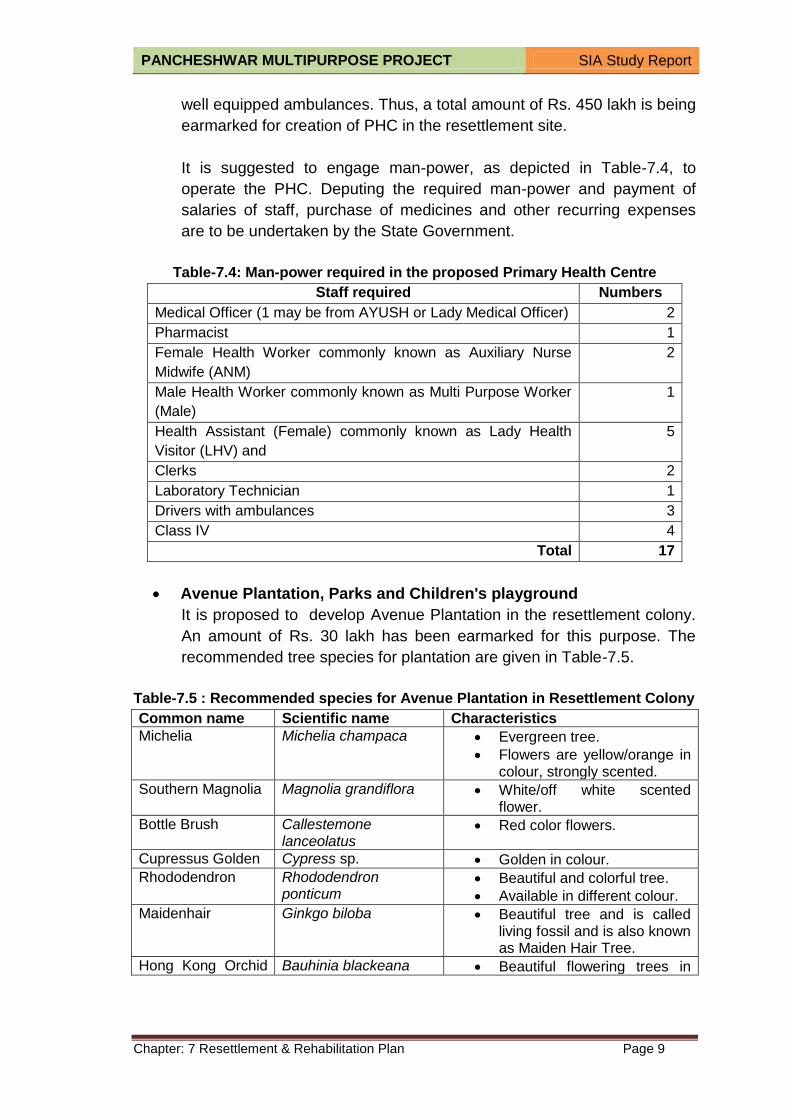
PANCHESHWAR MULTIPURPOSE PROJECT SIA Study Report
Chapter: 7 Resettlement & Rehabilitation Plan Page 9
well equipped ambulances. Thus, a total amount of Rs. 450 lakh is being
earmarked for creation of PHC in the resettlement site.
It is suggested to engage man-power, as depicted in Table-7.4, to
operate the PHC. Deputing the required man-power and payment of
salaries of staff, purchase of medicines and other recurring expenses
are to be undertaken by the State Government.
Table-7.4: Man-power required in the proposed Primary Health Centre
Staff required Numbers
Medical Officer (1 may be from AYUSH or Lady Medical Officer) 2
Pharmacist 1
Female Health Worker commonly known as Auxiliary Nurse
Midwife (ANM)
2
Male Health Worker commonly known as Multi Purpose Worker
(Male)
1
Health Assistant (Female) commonly known as Lady Health
Visitor (LHV) and
5
Clerks 2
Laboratory Technician 1
Drivers with ambulances 3
Class IV 4
Total 17
Avenue Plantation, Parks and Children's playground
It is proposed to develop Avenue Plantation in the resettlement colony.
An amount of Rs. 30 lakh has been earmarked for this purpose. The
recommended tree species for plantation are given in Table-7.5.
Table-7.5 : Recommended species for Avenue Plantation in Resettlement Colony
Common name Scientific name Characteristics
Michelia Michelia champaca Evergreen tree.
Flowers are yellow/orange in colour, strongly scented.
Southern Magnolia Magnolia grandiflora White/off white scented flower.
Bottle Brush Callestemone lanceolatus
Red color flowers.
Cupressus Golden Cypress sp. Golden in colour.
Rhododendron Rhododendron ponticum
Beautiful and colorful tree.
Available in different colour.
Maidenhair Ginkgo biloba Beautiful tree and is called living fossil and is also known as Maiden Hair Tree.
Hong Kong Orchid Bauhinia blackeana Beautiful flowering trees in

PANCHESHWAR MULTIPURPOSE PROJECT SIA Study Report
Chapter: 7 Resettlement & Rehabilitation Plan Page 10
Common name Scientific name Characteristics
Tree purplish red colour.
Deodar Tree Cedrus deodara Tree is known as Himalayan Cedar.
Tall evergreen coniferous tree.
Silver Oak Grevillia robusta Beautiful flowering tree of orange colour flower.
Ritha Sapindus mukorossi Natural remedy for many health problems and natural cleansing properties.
Pomegranate Punica granatun Frequently described as an ingredient in remedies, excellent source of dietary fibre.
Apricot Prunus armeniaca Apricot seeds, apricot oil is used against tumor, swelling, ulcers.
It is proposed to develop parks in resettlement colony. In addition, it is
also suggested that this playground is located in the vicinity of the
school. This would enable school children could also make use of this
playground during recess.
It is suggested to install swings, benches and other items in the garden
and install goal posts and make provision for racing track in the
playground. A lump-sum cost of Rs. 50 lakh is being kept for creation
and beautification of garden and playground.
Two gardeners per resettlement site could be engaged for taking care
and maintenance of these facilities. The recurring expenses towards
salaries, plants & trees, manures, benches, and other equipment is
suggested to be borne by the project developer or by the State
government.
Educational institutions (schools) in resettlement sites
It is suggested to construct a primary school, along-with Anganwadi in
the resettlement site. For this purpose, a plot of about 250 sqm with a
built-up area of 200 sqm could be allocated for the school building in
each site. An amount of Rs. 100 lakh is being earmarked for construction
of primary school along-with anganwadi building in the resettlement site.

PANCHESHWAR MULTIPURPOSE PROJECT SIA Study Report
Chapter: 7 Resettlement & Rehabilitation Plan Page 11
Space for weekly market
It is also proposed to allocate 0.15 ha of land in each of the resettlement
colonies for weekly markets. This area will remain un-developed, where
vender could come-in on a weekly basis, set-up their temporary shops to
sell local produce. An amount of Rs. 20 lakh can be earmarked for this
purpose.
An amount of Rs. 3595.0 lakh has been kept for providing civic amenities and
infrastructure facilities in the resettlement sites. The summary of amenities and
facilities to be provided in resettlement sites are summarized in Table-7.6.
Table-7.6: Summary of amenities and facilities to be provided in resettlement
sites
S. No. Amenities & Infrastructure facilities
to be provided in resettlement sites
Cost
(Rs. lakh)
1 Internal village roads 1000.0
2 Drainage network 100.0
3 Sanitation network 700.0
5 Drinking water supply 760.0
6 Footpath 50.0
7 Drinking water trough for cattle 10.0
8 Place of worship 50.0
9 Cremation ground 50.0
10 Fair price shop and other shops 50.0
11 Construction of Post office 25.0
12 Construction of Panchayat Ghar 50.0
13 Construction of Community Hall 120.0
14 Primary Health Centre 450.0
15 Horticulture/Avenue Plantation 30.0
16 Garden and children’s playground 30.0
17 Primary school along-with anganwadi building 100.0
18 Space for weekly market 20.0
Total 3595.0
7.5 MEASURES FOR REHABILITATION
In the proposed project, majority of the population depends on land for their
livelihood. Privately owned land is also expected to be acquired. The
rehabilitation plan would be formulated in line with the norms of “Right to Fair
Compensation and Transparency in Land Acquisition, Rehabilitation and
Resettlement Act, 2013”.

PANCHESHWAR MULTIPURPOSE PROJECT SIA Study Report
Chapter: 7 Resettlement & Rehabilitation Plan Page 12
As a part of the study, Land circle rates for project affected villages in each
district was collected. As per the norms of “Right to Fair compensation and
Transparency in Land Acquisition, Rehabilitation and Resettlement Act, 2013”,
solatium of 100% to be paid. In addition, the land value is also to be multiplied
by a factor of 1.0 and 2.0, based on the distance of project from urban area, as
may be notified by the appropriate government.
As per Government of Uttarakhand Rajaswa Anubhag -3
No.587/XVIII(III)/2016-02(06)/2016 Dated Dehradun, October 10,2016
Notification State Government notify that in rural area, the multiplying factor of
the market value will be two (2.00). Alongwith, according to Section 30(1) of
“The Right to Fair Compensation and Transparency in Land Acquisition,
Rehabilitation and Resettlement Act,2013”. The collector having determined the
total compensation to be paid shall impose an extra “Solatium” amount
equivalent to one hundred percent of the compensation amount. Thus, land
compensation is taken as 4 times the circle rate finalized by the District
Administration.
The Right to Fair compensation and Transparency in Land Acquisition,
Rehabilitation and Resettlement Act, 2013 and Uttarakhand Gazette
Notification are enclosed as Annexure-I and Annexure-II respectively
The compensation rate for land acquisition as per the norms of “Right to Fair
Compensation and Transparency in Land Acquisition, Rehabilitation and
Resettlement Act, 2013” for each project affected village is estimated in in
Table-7.7. The budget proposed to be earmarked for Rehabilitation Plan is
estimated as Rs.8239.48 crore. The details are given in Table-7.8.

PANCHESHWAR MULTIPURPOSE PROJECT SIA Study Report
Chapter: 7 Resettlement & Rehabilitation Plan Page 13
Table-7.7 Entitlement Matrix for the Private Land Acquisition
S.No District Tehsil Village Name Culturable
Land (ha)
Circle
Rate of
Land (A)
(Rs. lakh)
Compensation
after
considering
factor to be
multiplied in
rural areas
B=(A*2)
Solatium
(C)
(Rs. lakh)
Final
Award
(B+C)
(Rs. lakh)
PANCHESHWAR MPDP
1 Almora Almora Padoli 3.76 37.6 75.2 75.2 150.4
2 Almora Almora Talli Nalli 15.30 153.0 306.0 306.0 612.0
3 Almora Almora M.Nali 23.24 232.4 464.8 464.8 929.7
4 Almora Almora Umer 989.40 9894.0 19788.0 19788.0 39576.0
5 Almora Almora Bamori 12.75 127.5 255.1 255.1 510.2
6 Almora Bhanoli Kunj Kimola Chak 3.93 39.3 78.5 78.5 157.0
7 Almora Bhanoli Birkola 2.29 13.7 27.4 27.4 54.9
8 Almora Bhanoli Deol Sedi 3.14 18.9 37.7 37.7 75.5
9 Almora Bhanoli Dhankana 5.90 35.4 70.8 70.8 141.6
10 Almora Bhanoli Ucha Beda 9.30 55.8 111.6 111.6 223.3
11 Almora Bhanoli Nayal Dhura 13.67 82.0 164.1 164.1 328.1
12 Almora Bhanoli Kuna Pokhari 3.27 19.6 39.2 39.2 78.4
13 Almora Bhanoli Bali Khet 24.14 144.8 289.6 289.6 579.3
14 Almora Bhanoli Dashola Badiyar 25.79 154.8 309.5 309.5 619.0
15 Almora Bhanoli Dhura Lagga Kata 16.26 97.6 195.1 195.1 390.3
16 Almora Bhanoli Kola 10.07 60.4 120.8 120.8 241.6
17 Almora Bhanoi Chamkholi 10.69 64.2 128.3 128.3 256.6
18 Almora Bhanoli Ara Salpar 32.32 193.9 387.8 387.8 775.6

PANCHESHWAR MULTIPURPOSE PROJECT SIA Study Report
Chapter: 7 Resettlement & Rehabilitation Plan Page 14
S.No District Tehsil Village Name Culturable
Land (ha)
Circle
Rate of
Land (A)
(Rs. lakh)
Compensation
after
considering
factor to be
multiplied in
rural areas
B=(A*2)
Solatium
(C)
(Rs. lakh)
Final
Award
(B+C)
(Rs. lakh)
19 Almora Bhanoli Mayoli 1.40 8.4 16.8 16.8 33.7
20 Almora Almora Melta 0.00 0.0 0.0 0.0 0.0
21 Almora Almora Jingal 7.54 75.4 150.8 150.8 301.6
Subtotal (A) 230.5 11508.7 23017.4 23017.4 46034.8
22 Champawat Lohagaht Vivel 51.2 374.0 747.9 747.9 1495.9
23 Champawat Lohagaht Khaykot Talla 10.4 66.5 133.0 133.0 266.1
24 Champawat Lohagaht Khaykot Malla 18.0 80.8 161.6 161.6 323.1
25 Champawat Barakot Botadi 37.5 1659.9 3319.8 3319.8 6639.5
26 Champawat Barakot Singda 0.4 16.3 32.6 32.6 65.2
27 Champawat Barakot Raygaon 1.4 16.7 33.3 33.3 66.6
28 Champawat Barakot Sungarkhal 9.7 116.5 233.1 233.1 466.2
29 Champawat Barakot Choolgaon 13.9 167.0 334.0 334.0 668.0
30 Champawat Barakot Betta 5.2 23.3 46.6 46.6 93.3
31 Champawat Barakot Kothera 13.3 60.0 120.0 120.0 240.0
32 Champawat Barakot Salaan 15.8 71.1 142.1 142.1 284.3
33 Champawat Barakot Netra 13.0 58.6 117.2 117.2 234.5
34 Champawat Barakot Gayakajula 1.2 5.6 11.2 11.2 22.5
35 Champawat Barakot Bruyuri 0.4 2.0 4.0 4.0 8.1
36 Champawat Pati Simalkhet 9.3 211.5 423.1 423.1 846.2
Subtotal (B) 200.7 2929.8 5859.7 5859.7 11719.3

PANCHESHWAR MULTIPURPOSE PROJECT SIA Study Report
Chapter: 7 Resettlement & Rehabilitation Plan Page 15
S.No District Tehsil Village Name Culturable
Land (ha)
Circle
Rate of
Land (A)
(Rs. lakh)
Compensation
after
considering
factor to be
multiplied in
rural areas
B=(A*2)
Solatium
(C)
(Rs. lakh)
Final
Award
(B+C)
(Rs. lakh)
37 Pithoragarh Pithoragarh Garali 0.7 7.3 14.6 14.6 29.2
38 Pithoragarh Pithoragarh Dhyan 0.7 53.6 107.3 107.3 214.5
39 Pithoragarh Pithoragarh Sakun 16.4 1356.3 2712.6 2712.6 5425.2
40 Pithoragarh Pithoragarh Gaurihat 4.3 355.6 711.2 711.2 1422.3
41 Pithoragarh Pithoragarh Rajyoura 6.5 539.6 1079.1 1079.1 2158.2
42 Pithoragarh Pithoragarh Majirkanda 1279.2 105534.8 211069.7 211069.7 422139.3
43 Pithoragarh Pithoragarh Bhateri 0.0 2.5 5.0 5.0 9.9
44 Pithoragarh Pithoragarh Geti gadha 24.2 1997.3 3994.7 3994.7 7989.3
45 Pithoragarh Pithoragarh Gogana 11.7 965.3 1930.5 1930.5 3861.0
46 Pithoragarh Pithoragarh Jamradi 11.2 927.3 1854.6 1854.6 3709.2
47 Pithoragarh Pithoragarh Radikhuti 29.1 2400.8 4801.5 4801.5 9603.0
48 Pithoragarh Pithoragarh Khadku Bhulya 26.6 2190.4 4380.8 4380.8 8761.5
49 Pithoragarh Pithoragarh Upartola 21.5 1773.8 3547.5 3547.5 7095.0
50 Pithoragarh Pithoragarh Khatigaon 2.6 212.5 425.0 425.0 850.1
51 Pithoragarh Pithoragarh Toli 0.0 0.0 0.0 0.0 0.0
52 Pithoragarh Pithoragarh Salla 17.9 1480.1 2960.1 2960.1 5920.2
53 Pithoragarh Pithoragarh Kanari 3.9 38.6 77.2 77.2 154.4
54 Pithoragarh Pithoragarh Baunkota 4.8 48.4 96.8 96.8 193.6
55 Pithoragarh Pithoragarh Tadigaon 24.0 240.0 480.0 480.0 960.0
56 Pithoragarh Pithoragarh Gayal Pipali 4.3 43.2 86.4 86.4 172.8

PANCHESHWAR MULTIPURPOSE PROJECT SIA Study Report
Chapter: 7 Resettlement & Rehabilitation Plan Page 16
S.No District Tehsil Village Name Culturable
Land (ha)
Circle
Rate of
Land (A)
(Rs. lakh)
Compensation
after
considering
factor to be
multiplied in
rural areas
B=(A*2)
Solatium
(C)
(Rs. lakh)
Final
Award
(B+C)
(Rs. lakh)
57 Pithoragarh Pithoragarh Basaur Manain 8.5 84.5 169.0 169.0 338.0
58 Pithoragarh Pithoragarh Kutheri 7.5 75.2 150.4 150.4 300.8
59 Pithoragarh Pithoragarh Haldu 41.9 419.0 838.0 838.0 1676.0
60 Pithoragarh Pithoragarh Kwerali 1.6 16.1 32.2 32.2 64.4
61 Pithoragarh Pithoragarh Baltadi 43.5 435.1 870.2 870.2 1740.4
62 Pithoragarh Pithoragarh Nisni 2.7 27.1 54.2 54.2 108.4
63 Pithoragarh Pithoragarh Matiyal 14.6 145.9 291.8 291.8 583.6
64 Pithoragarh Pithoragarh Bhalya 19.3 192.8 385.6 385.6 771.2
65 Pithoragarh Pithoragarh Tallisar 9.4 94.3 188.6 188.6 377.2
66 Pithoragarh Pithoragarh Sail 11.7 116.6 233.2 233.2 466.4
67 Pithoragarh Pithoragarh Tedemiya 49.8 498.0 996.0 996.0 1992.0
68 Pithoragarh Pithoragarh Pati Palchaura 3.7 36.8 73.6 73.6 147.2
69 Pithoragarh Dharchula Dutibagar 13.0 2138.4 4276.8 4276.8 8553.6
70 Pithoragarh Dharchula Kimkhola 23.4 3856.1 7712.1 7712.1 15424.2
71 Pithoragarh Dharchula Dungatoli 7.1 1176.5 2352.9 2352.9 4705.8
72 Pithoragarh Dharchula Tham 0.7 6.9 13.8 13.8 27.6
73 Pithoragarh Didihat Jogyoura 23.4 3092.8 6185.5 6185.5 12371.0
74 Pithoragarh Didihat Jamtari 2.4 24.0 48.0 48.0 96.0
75 Pithoragarh Didihat Garjiya 18.8 188.2 376.4 376.4 752.8
76 Pithoragarh Didihat Bagdihat 25.8 3406.1 6812.3 6812.3 13624.5

PANCHESHWAR MULTIPURPOSE PROJECT SIA Study Report
Chapter: 7 Resettlement & Rehabilitation Plan Page 17
S.No District Tehsil Village Name Culturable
Land (ha)
Circle
Rate of
Land (A)
(Rs. lakh)
Compensation
after
considering
factor to be
multiplied in
rural areas
B=(A*2)
Solatium
(C)
(Rs. lakh)
Final
Award
(B+C)
(Rs. lakh)
77 Pithoragarh Didihat Bheliya 1.0 128.0 256.1 256.1 512.2
78 Pithoragarh Didihat Titri 53.8 1774.7 3549.5 3549.5 7099.0
79 Pithoragarh Didihat Chamtoli 26.4 871.2 1742.4 1742.4 3484.8
80 Pithoragarh Didihat Sailoni 23.1 761.3 1522.6 1522.6 3045.2
81 Pithoragarh Didihat Oltari 9.7 96.7 193.4 193.4 386.8
82 Pithoragarh Didihat Ghingrani 26.3 866.3 1732.5 1732.5 3465.0
83 Pithoragarh Kanalichina Syuwan 1.9 61.4 122.8 122.8 245.5
84 Pithoragarh Kanalichina Dwalisera 35.4 1168.2 2336.4 2336.4 4672.8
85 Pithoragarh Kanalichina Daulani 2.3 74.9 149.8 149.8 299.6
86 Pithoragarh Kanalichina Pantsera 30.2 996.3 1992.5 1992.5 3985.1
87 Pithoragarh Kanalichina Bathauli 6.9 68.7 137.4 137.4 274.8
88 Pithoragarh Kanalichina Dyora 40.1 397.2 794.4 794.4 1588.8
89 Pithoragarh Kanalichina Ranwa 23.0 227.4 454.8 454.8 909.6
90 Pithoragarh Kanalichina Sunkholi 12.2 120.5 241.0 241.0 481.9
91 Pithoragarh Kanalichina Amtari 24.0 237.6 475.2 475.2 950.4
92 Pithoragarh Gangolihat Diyuri 1.3 13.1 26.2 26.2 52.4
93 Pithoragarh Gangolihat Bokata 7.8 686.4 1372.8 1372.8 2745.6
94 Pithoragarh Gangolihat Duni 0.0 0.0 0.0 0.0 0.0
95 Pithoragarh Gangolihat Dubola Birtola 17.7 1556.7 3113.4 3113.4 6226.9
96 Pithoragarh Gangolihat Timtachamdugra 0.9 81.5 163.0 163.0 326.0

PANCHESHWAR MULTIPURPOSE PROJECT SIA Study Report
Chapter: 7 Resettlement & Rehabilitation Plan Page 18
S.No District Tehsil Village Name Culturable
Land (ha)
Circle
Rate of
Land (A)
(Rs. lakh)
Compensation
after
considering
factor to be
multiplied in
rural areas
B=(A*2)
Solatium
(C)
(Rs. lakh)
Final
Award
(B+C)
(Rs. lakh)
97 Pithoragarh Gangolihat Nali 4.6 406.6 813.1 813.1 1626.2
98 Pithoragarh Gangolihat Palli 1.7 57.1 114.2 114.2 228.4
99 Pithoragarh Gangolihat Sibana 3.0 99.3 198.7 198.7 397.3
100 Pithoragarh Gangolihat Sugadi 0.0 0.0 0.0 0.0 0.0
101 Pithoragarh Gangolihat Damde 0.0 0.0 0.0 0.0 0.0
102 Pithoragarh Gangolihat Bursumbari 3.5 114.5 229.0 229.0 458.0
103 Pithoragarh Gangolihat Chaurghurauli 2.2 73.3 146.5 146.5 293.0
104 Pithoragarh Gangolihat Kharkoli 7.7 254.8 509.5 509.5 1019.0
105 Pithoragarh Gangolihat Askoda 1.6 54.1 108.2 108.2 216.5
106 Pithoragarh Gangolihat Tulkhand 0.0 0.0 0.0 0.0 0.0
107 Pithoragarh Gangolihat Rautora 1.8 59.4 118.8 118.8 237.6
108 Pithoragarh Gangolihat Bungali 5.0 164.0 328.0 328.0 656.0
109 Pithoragarh Gangolihat
Amla Talla Malla
Sugarmavla 0.6 6.1 12.2 12.2 24.4
110 Pithoragarh Gangolihat Suwal 6.2 61.8 123.6 123.6 247.2
111 Pithoragarh Gangolihat Sauli 0.0 0.0 0.0 0.0 0.0
112 Pithoragarh Gangolihat Dhajari 0.6 5.7 11.4 11.4 22.8
113 Pithoragarh Gangolihat Garali 3.1 31.0 62.0 62.0 124.0
114 Pithoragarh Gangolihat Seragada 9.1 91.3 182.6 182.6 365.2
115 Pithoragarh Gangolihat Kuntola 9.8 98.2 196.4 196.4 392.8

PANCHESHWAR MULTIPURPOSE PROJECT SIA Study Report
Chapter: 7 Resettlement & Rehabilitation Plan Page 19
S.No District Tehsil Village Name Culturable
Land (ha)
Circle
Rate of
Land (A)
(Rs. lakh)
Compensation
after
considering
factor to be
multiplied in
rural areas
B=(A*2)
Solatium
(C)
(Rs. lakh)
Final
Award
(B+C)
(Rs. lakh)
116 Pithoragarh Gangolihat Raitoli 6.7 67.0 134.0 134.0 268.0
117 Pithoragarh Gangolihat Tudil 2.8 27.8 55.6 55.6 111.2
118 Pithoragarh Gangolihat Dandadhar 9.1 91.4 182.8 182.8 365.6
119 Pithoragarh Gangolihat Jartola 25.0 249.5 499.0 499.0 998.0
120 Pithoragarh Gangolihat Rasyun 8.1 80.7 161.4 161.4 322.8
121 Pithoragarh Gangolihat Sinolibhmalta 2.2 22.1 44.3 44.3 88.6
122 Pithoragarh Gangolihat Busail 0.0 0.0 0.0 0.0 0.0
123 Pithoragarh Gangolihat Kuinar 0.0 0.0 0.0 0.0 0.0
Subtotal (C ) 2276.7 148501.2 297002.5 297002.5 594004.9
RUPALIGAD RDP
124 Champawat Lohagaht Bagauti 1.47 10.7 21.4 21.4 42.9
125 Champawat Lohagaht Jindi suradi 6.67 48.7 97.3 97.3 194.7
126 Champawat Lohagaht Matiyani 3.20 23.4 46.7 46.7 93.4
127 Champawat Lohagaht Dungraleti 4.86 35.4 70.9 70.9 141.8
128 Champawat Lohagaht Jamrosa 1.93 12.3 24.6 24.6 49.3
129 Champawat Lohagaht Nidil 17.27 110.5 221.1 221.1 442.2
130 Champawat Lohagaht Pasam 6.65 42.6 85.2 85.2 170.3
131 Champawat Lohagaht Aslad 0.99 6.3 12.7 12.7 25.4
132 Champawat Champawat Bachkot 0.09 3.3 6.6 6.6 13.2
133 Champawat Champawat Polap 0.01 0.2 0.4 0.4 0.9

PANCHESHWAR MULTIPURPOSE PROJECT SIA Study Report
Chapter: 7 Resettlement & Rehabilitation Plan Page 20
S.No District Tehsil Village Name Culturable
Land (ha)
Circle
Rate of
Land (A)
(Rs. lakh)
Compensation
after
considering
factor to be
multiplied in
rural areas
B=(A*2)
Solatium
(C)
(Rs. lakh)
Final
Award
(B+C)
(Rs. lakh)
134 Champawat Pati Chilniya 1.03 19.6 39.3 39.3 78.6
Subtotal (D ) 44.16 313.14 626.28 626.28 1252.55
Total(A+B+C+D) 2752.1 163252.9 326505.8 326505.8 653011.6
Source : Land Circle Rates, District Administration

PANCHESHWAR MULTIPURPOSE PROJECT SIA Study Report
Chapter: 7 Resettlement & Rehabilitation Plan Page 21
Table-7.8: Provisions for Rehabilitation Plan for families losing land
S. No
Description Unit Assumed Provision#
Cost (Rs. lakh)
1. Land compensation ha Refer Table-7.6 653011.6
2. Rural artisans / Self-employed
One-time financial assistance of a minimum of Rs. 25,000/- to each affected family of an artisan, small trader or self-employed person or an affected family which owned non-agricultural land or commercial, industrial or institutional structure in the affected area, and which has been involuntarily displaced from the affected area due to land acquisition
31023
31023PAFs x Rs.25000/PAF
7755.75
3. Choice of Annuity or Employment
a) At least one member per affected family will be provided job (either in the project or arrange for a job in such other project), after providing suitable training and skill development in the required field Or
b) Onetime payment of Rs. 500,000 per affected family Or
c) Annuity policies that shall pay not less than Rs. 2000 per month per family for 20 years, with appropriate indexation to the Consumer Price Index for Agricultural Labourers
31023
Rs.4.8 lakh/PAF
148910.40
4. Training/Skill Development of the affected persons, so as to enable such persons to take on suitable jobs
31023
31023PAFs x Rs.1000/month x 12 months for each PAF
3722.76
5. Affected persons shall be offered the necessary training facilities for development of entrepreneurship, technical and professional skills for self-employment
31023
31023 PAFs x Rs.2000/month x 12 months for each PAF
7445.52
6. Provision of Rs. 10,000 per PAFs as one time financial assistance
31023 Rs. 10,000/PAF 3102.30
Total 823948.3
7.6 COMMUNITY PROPERTIES
During the survey it was observed that some community properties like Shops,
Tanks, Temples, and Schools etc. will be affected due to the project. Details of

PANCHESHWAR MULTIPURPOSE PROJECT SIA Study Report
Chapter: 7 Resettlement & Rehabilitation Plan Page 22
the Community properties affected due to the implementation of the project is
elucidated in Table-7.9.
Table-7.9: Community Properties affected due to the project
S.No Community properties
Pithoragarh Almora Champawat Total
1. Shops 43 3 12 58
2. Tank 7 0 0 7
3. Fish pond 23 2 6 31
4. Water mill 1 0 0 1
5. Panchayat buildings 88 22 26 136
6. Temples 511 122 137 770
7. Post office 23 0 3 26
8. PHC 18 1 1 20
9. Primary school 129 23 27 179
10. Secondary school 60 12 22 94
11. Dug well 7 3 1 11
12. Water tank 190 33 49 272
13. Handpump 6 0 4 10
Table-7.10 elucidates the total compensation earmarked for the community
properties affected due to the implementation of the project. The total land cost
of the affected properties is 8202.81 lakhs. Whereas total cost earmarked for
construction of the Community Structures is Rs.26173 lakhs. The total cost
estimated for the Community Properties is 34375.8 lakhs.
Table-7.10: Provision for Community Properties
S.No
Types of Community properties
to be acquired
To
tal
Nu
mb
er
Are
a(m
2)/
Co
mm
un
ity
Pro
pert
y
To
tal A
rea
(m2
)
Lan
d C
ost
(Rs
.La
kh
)(A
)
Co
st
for
Co
ns
tru
cti
on
/Co
mm
un
ity
Str
uc
ture
(Rs
.
Lakh
)
Co
st
for
To
tal
co
nstr
uc
tio
n
(la
kh
) (B
)
To
tal
co
st(
lakh
)
1 Shops 58 25 1450 94.54 1 58 152.54
2 Tank 7 20 140 9.128 1 7 16.128
3 Fish pond 31 20 620 40.424 1 31 71.424
4 Water mill 1 0 0 10 10 10
5 Panchayat buildings
136 100 13600 886.72 10 1360 2246.72
6 Temples 770 50 38500 2510.2 10 7700 10210.2
7 Post office 26 30 780 50.856 5 130 180.856
8 PHC 20 200 4000 260.8 50 1000 1260.8
9 Primary school
179 200 35800 2334.16 50 8950 11284.2
10 Secondary 94 300 28200 1838.64 70 6580 8418.64

PANCHESHWAR MULTIPURPOSE PROJECT SIA Study Report
Chapter: 7 Resettlement & Rehabilitation Plan Page 23
S.No
Types of Community properties
to be acquired
To
tal
Nu
mb
er
Are
a(m
2)/
Co
mm
un
ity
Pro
pert
y
To
tal A
rea
(m2
)
Lan
d C
ost
(Rs
.La
kh
)(A
)
Co
st
for
Co
ns
tru
cti
on
/Co
mm
un
ity
Str
uc
ture
(Rs
.
Lakh
)
Co
st
for
To
tal
co
nstr
uc
tio
n
(la
kh
) (B
)
To
tal
co
st(
lakh
)
school
11 Dug well 11 0 0 5 55 55
12 Water tank 272 10 2720 177.344 1 272 449.344
13 Handpump 10 0 0 2 20 20
Total cost 8202.81 26173 34375.8
7.7 BUDGET
The total budget for implementation of the Rehabilitation and Resettlement Plan
is Rs. 938348.81 lakh. The details are given in Table-7.11.
Table-7.11: Budget for implementation of the Rehabilitation and Resettlement Plan
S. No. Components of R&R Cost (Rs. lakh)
A Resettlement Plan
1. Land required for providing Housing plots @ 250 sqm to 1308 house losers = 110 ha
72300.28
2. House building assistance 2372.06
3. Financial assistance for construction of cattle-shed 395.34
4. Financial assistance for shifting of the family, building materials, belongings and cattle
654.00
5. Subsistence allowance 654.00
6. One time Resettlement allowance 654.00
Sub-Total [A] 77029.68
B Amenities and Infrastructure Facilities in Resettlement Area (Refer Table-7.6)
3595.0
Sub-Total [B] 3595.0
C Rehabilitation Plan
1. Compensation for Land 653011.6
2. Grant to Rural Artisans 7755.75
3. Annuity payment 148910.40
4. Training/Skill Development to take on suitable jobs 3722.76
5. Training facilities for development of entrepreneurship, technical and professional skills for self-employment
7445.52
6. One time Resettlement allowance 3102.30
Sub-Total [C] 823948.33
D. Community Properties(Refer Table-7.10) 34375.8
Subtotal (D ) 34375.8
Total(A+B+C+D) 938948.81 lakhs say 9389.48 crore

PANCHESHWAR MULTIPURPOSE PROJECT SIA Study Report
Chapter: 7 Resettlement & Rehabilitation Plan Page 24
An amount of Rs.165550 lakh has already been earmarked in project cost under B-
land cost. The details are given in Table-7.12.
Table-7.12: Budget earmarked in DPR for Private Land Acquisition
S. No.
Description Unit (ha) Rate (Rs./ha)
Cost (Rs.lakh)
1 Cultivable irrigation land 1078 4200000 45280
2 Cultivated unirrigated land 1117 3200000 35740
Subtotal (A) 2195 160000 81020
3 Crop Compensation (B) 3510
4 Solatium charges on account of compulsory acquisition of private land@ 100% cost for A(C )
160240
Total (B+C ) 165550
Thus, an additional of (Rs. 938948.81 - Rs.165550) Rs.773398.81 lakh needs to be
earmarked for implementation of Resettlement and Rehabilitation Plan.

CHAPTER-8
LIVELIHOOD PLAN FOR PAFS WHO ARE LIKELY TO LOSE ENTIRE LANDS

PANCHESHWAR MULTIPURPOSE PROJECT SIA Study Report
Chapter 8: Livelihood Plan Page 1
CHAPTER – 8
LIVELIHOOD PLAN FOR PAFS WHO ARE LIKELY TO LOSE
ENTIRE LANDS
8.1 INTRODUCTION
The livelihood Plan shall be given to those PAFs who are likely to be loose
major proportion of their land holdings. The families loosing land under
reservoir submergence shall be covered under Livelihood Plan. A total of 1308
PAF are likely to lose homestead and 31023 PAFs are likely to lose land under
reservoir submergence. As part of Income generating activities, following
activities are proposed.
Livestock rearing
Horticulture
Bee Keeping
Eco-tourism
Training for skill development
8.2 LIVESTOCK REARING
Livestock requiring is quite common in the project affected families. It is
proposed that for about 1308 PAFs, 4 cows/buffalos shall be given to each
family. Thus, about 1600 cows / buffaloes shall be purchased. The cost of a
cow/buffalo has been taken as Rs.25,000/-. Thus, total amount spent on each
PAFs shall be Rs.1.0 lakh. In addition, an amount of Rs.25,000/- can be given
to each PAFs for construction of cattle shed and initial inputs. It is proposed to
conduct following training programmes:
Fodder Demonstration
Demonstrations of use of mineral mixture in daily diet of milch animals
Artificial Insemination and natural Breeding in Cow and Buffalo
Training and Exposure of PAFs
Technical Training of Veterinarians instrumental in implementation of
various activities.
Fodder plays a vital role in livestock production. The health and productivity is
directly proportional to quality and balance feeding. The main purpose of this
activity is to educate the farmers about the need of feeding green fodder to
cattle. There are two ways of fodder production i.e. overlapping cropping and
Relay cropping. In overlapping cropping a fodder is introduced in the field
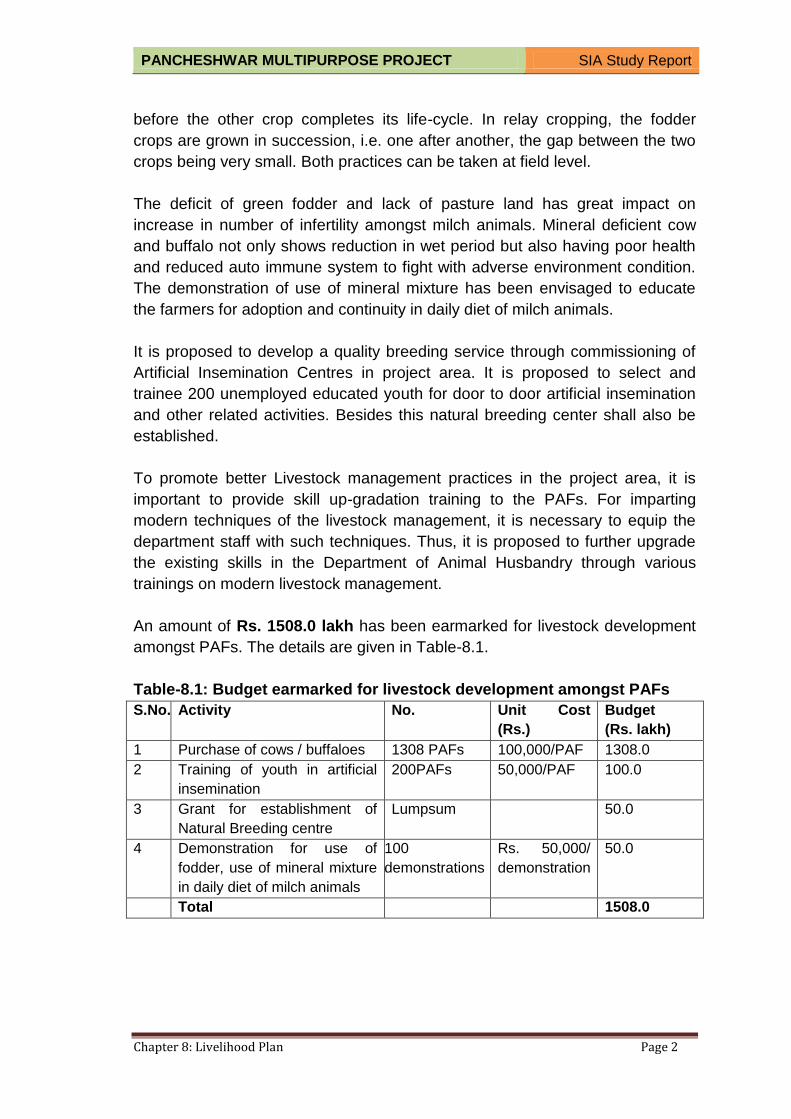
PANCHESHWAR MULTIPURPOSE PROJECT SIA Study Report
Chapter 8: Livelihood Plan Page 2
before the other crop completes its life-cycle. In relay cropping, the fodder
crops are grown in succession, i.e. one after another, the gap between the two
crops being very small. Both practices can be taken at field level.
The deficit of green fodder and lack of pasture land has great impact on
increase in number of infertility amongst milch animals. Mineral deficient cow
and buffalo not only shows reduction in wet period but also having poor health
and reduced auto immune system to fight with adverse environment condition.
The demonstration of use of mineral mixture has been envisaged to educate
the farmers for adoption and continuity in daily diet of milch animals.
It is proposed to develop a quality breeding service through commissioning of
Artificial Insemination Centres in project area. It is proposed to select and
trainee 200 unemployed educated youth for door to door artificial insemination
and other related activities. Besides this natural breeding center shall also be
established.
To promote better Livestock management practices in the project area, it is
important to provide skill up-gradation training to the PAFs. For imparting
modern techniques of the livestock management, it is necessary to equip the
department staff with such techniques. Thus, it is proposed to further upgrade
the existing skills in the Department of Animal Husbandry through various
trainings on modern livestock management.
An amount of Rs. 1508.0 lakh has been earmarked for livestock development
amongst PAFs. The details are given in Table-8.1.
Table-8.1: Budget earmarked for livestock development amongst PAFs
S.No. Activity No. Unit Cost
(Rs.)
Budget
(Rs. lakh)
1 Purchase of cows / buffaloes 1308 PAFs 100,000/PAF 1308.0
2 Training of youth in artificial
insemination
200PAFs 50,000/PAF 100.0
3 Grant for establishment of
Natural Breeding centre
Lumpsum 50.0
4 Demonstration for use of
fodder, use of mineral mixture
in daily diet of milch animals
100
demonstrations
Rs. 50,000/
demonstration
50.0
Total 1508.0

PANCHESHWAR MULTIPURPOSE PROJECT SIA Study Report
Chapter 8: Livelihood Plan Page 3
8.3 HORTICULTURE
It is proposed to develop horticulture in each of household to be resettlement
colony. It is proposed to provide saplings of horticulture trees to each
household as per the details given in Table-8.2.
Table-8.2: Details of horticulture trees and land requirement
S. No.
Plant No. of trees/ household
No. of households
Total number of trees
Plantation distance (m)
Total Area (m2)
Land requirement (m2)
1. Rithe 2 300 600 10 128 38400
2. Pomegranate 16 300 4800 4 256 76800
3. Apricot 16 300 4800 4 256 76800
4. Peach 16 200 3200 4 256 51200
5. Citrus 16 208 3328 4 256 53248
Total 16728 296448 say 30 ha
The plantation cost per tree is given in Table-8.3. The total cost for horticulture
shall be Rs. 197 crore. The details are given in Tables – 8.3 to 8.5. The
revenue generation per tree is given in Table-8.6.
Table-8.3: Cost of Plantation
S. No Name of Fruit Tree Fruiting Time (Year)
Expenditure on plantation (Each Tree)
1 Ritha (Sapindus Mukorossi)
5 I. Digging of holes 1.2 x 1.2 Mtt. = 236.75
II. Providing and planting of trees @ 50.00 III. Fertilizer and Pesticides @ Rs.
100/year for 4 years = 400 Total= 686.75, say Rs. 700/tree
2 Pomegranate (Punica Granatun)
4 I. Digging of holes 1.2 x 1.2 Mtt. = 236.75
II. Providing and planting of trees @100.00 III. Fertilizer and Pesticides @ Rs.
100/year for 4 years = 400 Total= 736.75, say Rs. 750/tree
3
Apricot (Prunus Armeniaca)
5 I. Digging of holes 1.2 x 1.2 Mtt. = 236.75
II. Providing and planting of trees @100.00 III. Fertilizer and Pesticides @ Rs.
100/year for 4 years = 400

PANCHESHWAR MULTIPURPOSE PROJECT SIA Study Report
Chapter 8: Livelihood Plan Page 4
S. No Name of Fruit Tree Fruiting Time (Year)
Expenditure on plantation (Each Tree)
Total= 736.75, say Rs. 750/tree
4 Peach (Prunus Persica)
5 I. Digging of holes 1.2 x 1.2 Mtt. = 236.75
II. Providing and planting of trees @100.00 III. Fertilizer and Pesticides @ Rs.
100/year for 4 years = 400 Total= 736.75 say Rs. 750/tree
5 Citrus Varieties 4 I. Digging of holes 1.2 x 1.2 Mtt. = 236.75
II. Providing and planting of trees @100.00 III. Fertilizer and Pesticides @ Rs.
100/year for 4 years = 400 Total= 736.75, say Rs. 750/tree
Table-8.4: Cost for Horticulture Development
S.No. Tree Cost (Rs./tree) Unit Rate (Rs./tree)
Total cost (Rs. lakh)
1. Ritha 600 700 4.20
2. Pomegranate 4800 750 36.00
3. Apricot 4800 750 36.00
4. Peach 3200 750 24.00
5. Citrus varieties 3328 750 24.96
Total 16,728 125.16
Table-8.5: Summary of costs for horticulture development
S.No. Item Cost (Rs. lakh)
1. Land cost, compensation for 30 ha of land @ Rs. 6.52 crore/year
19560.00
2. Horticulture Development 125.16
Total 19685.16, Say Rs. 197 crore
Table-8.6: Revenue Generation by Fruit Trees
S. No Name of Fruit Tree
Time required for fruiting (In Years)
Fruit Production after plantation (kg/Year)
Sale Rate Rs./kg
Amount (Rs.)
1 Ritha (Sapindus Mukorossi)
5th 6th 7th
80 120 150
80 80 80
6400.00 9600.00 12000.00

PANCHESHWAR MULTIPURPOSE PROJECT SIA Study Report
Chapter 8: Livelihood Plan Page 5
S. No Name of Fruit Tree
Time required for fruiting (In Years)
Fruit Production after plantation (kg/Year)
Sale Rate Rs./kg
Amount (Rs.)
8th 200 80 16000.00
2 Pomegranate (Punica Granatun)
5th 6th 7th 8th
25 40 60 80
80 80 80 80
2000.00 3200.00 4800.00 6400.00
3
Apricot (Prunus Armeniaca)
5th 6th 7th 8th
25 40 60 80
30 30 30 30
750.00 1200.00 1800.00 2400.00
4 Peach (Prunus Persica)
5th 6th 7th 8th
25 40 60 80
30 30 30 30
750.00 1200.00 1800.00 2400.00
5 Citrus Varieties 5th 6th 7th 8th
25 40 60 80
30 30 30 30
750.00 1200.00 1800.00 2400.00
8.4 BEE-KEEPING
Bee keeping will be promoted through conducting demonstrations. It is
proposed to mobilize 500 bee keeping groups. Each group will comprise 10
members so a total 5000 units will be established. Selection of villages and
group members will be based on the potential of this enterprise and the interest
of PAFs. Project will provide a box to each individual member of bee keeping
groups and a churning machine to each group of 10 members. All the members
of the group will share the services of churning machine provided by the
project. Bee keeping groups will also be provided appropriate training.
An amount of Rs 15,000/group including infrastructure and training has been
proposed as project support. Thus, a total amount of Rs. 75 lakh has been
earmarked for this purpose.
8.5 TRAINING FOR SKILL DEVELOPMENT
One member of each family shall give training for skill development. This could
be either male or female member of family. This will be in addition to the
income generating activities mentioned in this plan. The budget for the Training
and Skill development has been earmarked as a part of R&R Plan.

PANCHESHWAR MULTIPURPOSE PROJECT SIA Study Report
Chapter 8: Livelihood Plan Page 6
8.6 TOURISM DEVELOPMENT
The reservoir will have great tourism potential and it can create many income
generating resources to the local people in many ways viz ; boating, angling
competition, guide, creation of the paying guest houses, travelers’ tour
packages to the nearby sight-seeing places, development of camping sites,
birds watching etc. This must be linked with the ecology environment of the
reservoir. For the development of the tourism, brochures, pamphlets, signage,
models, opening of the tourism information centers, Telescopes, Binoculars,
computerized data, trekking routes and their stay arrangements etc shall be
required.
The following activities are proposed for the development of the eco-tourism
zone:
Create interest for birds by Bird watching.
Develop infrastructure for perform various water sports activities
such as Boating etc.
Infrastructure for stay of tourists
Provision of house boats, paddle boats
Distribution of plants for plantation on community and private
lands.
Distribution of fruit tray for planting on private lands.
Training to locals, viz. Bird Watching, Boating, Catering, Tourist
guides, etc. etc.
The budget required for implementation of Eco-tourism in the area has been
earmarked in the Tourism Development Plan outlined in Volume-III
(Environmental Management Plan) of this Report.
A Committee for implementation of Eco-tourism can be set up by the State
Government of Uttarakhand. The Committee shall have the following members:
Representative of State Tourism Department
Representative of State Irrigation Department
Superintending Engineer of the Project
Representatives of nearby Gram Panchayat
Representatives of women of the nearby villages.
Representatives of Local NGOs
MLA/MP of the Area

PANCHESHWAR MULTIPURPOSE PROJECT SIA Study Report
Chapter 8: Livelihood Plan Page 7
The Committee shall review and oversee the conservation work to be undertaken
8.7 WOMEN SELF HELP GROUPS
The livelihood plan will be implemented through Women Self Help Groups. This
will enable PAFs, to form their own SHG, link them to credit access and
sustainable livelihoods opportunities.
The SHGs shall follow the standard SHG parameters of forming around some
social affinity and mutual trust basis; same gender, regular savings, and inter-
loaning. A SHG shall have around 10-15 members. These SHGs will be
provided support for mobilization, nurturing and SHG formation, financial
management, and development of group solidarity and access skills. As the
SHGs attain certain maturity and became capable of handling key management
issues within the SHG, they will be developed to formulate their own livelihood
plan. The SHGs shall initially start off with thrift and credit through rotation of
the SHG members’ fund, promoted to adopt specific livelihood activities in
gradual phase.
The SHG serves the purpose of providing women members’ space for self-
help, mutual cooperation and collective action for social and economic
development. It promotes savings, build own funds and becomes the local
financial institution to provide a range of financial services including providing
credit for debt-swapping and livelihoods.
The key elements of the SHGs strategy are:
Self-determined group membership and group norms;
Homogeneity in group membership;
Group determined savings and inter-loaning norms;
Initial inter-loaning from own savings for easing consumption
Social capital for providing support services;
CCL from banks to augment capital to meet various credit needs of
the members.
Utilization of Livelihood Support Fund (LSF)
The Self Help Groups shall be implemented in a phased manner. The first
phase included formation and capacity building of self-managed primary
institutions known as SHGs. During the second phase, some of these mature
primary level institutions (SHGs) were promoted to adopt livelihood
enhancement and income generation activities in the cluster. For
implementation of livelihoods and income generation activities amongst the

PANCHESHWAR MULTIPURPOSE PROJECT SIA Study Report
Chapter 8: Livelihood Plan Page 8
SHG members of project villages, the approach adopted is based on various
development milestones of SHGs, which are as follows:
Pre-formation (2-3 months): Profiling and assessment of the poor women;
initial interactions
Formation (6 months): Organizing and nurturing, developing norms,
Practicing Panchasutra (Regular meetings; Regular savings; Regular inter-
loaning; Timely repayment; and Up-to-date books of accounts), Developing
Micro Credit Plan, Leadership development
Linkages (6-24 months): Capacity Building, Micro Credit Plan, Linkages
with Banks
Beyond (2nd year onwards): Visioning/Plan, Livelihoods, New Products,
Social Capital
After completion of first phase, skill based market-led training will be imparted
to the members of SHG during the second phase based on skill assessment of
members of SHG. For implementation of livelihoods development program
amongst women beneficiaries of project villages, a multi pronged strategy will
be adopted for identification of good training institutes, which are capable to
impart necessary skill based market-led training to the members of SHG at their
own doorstep.
In the second phase, for implementation of livelihoods development program on
large scale amongst the SHGs of the project villages, it has been planned to
provide Livelihood Support Fund (LSF) of Rs.45000/- to the SHGs, which have
qualified the credit rating as per maturity index and prepared their own
livelihoods development plan in two tranches:
LSF- 1:- First tranche of Rs. 15,000/- to be provided to those WSHG, which
have qualified in A or B category in the WSHG assessment and have
developed their Micro Credit Plan.
LSF-2:- Second tranche of Rs. 30,000/- to be provided to those WSHG, which
have utilized LSF-1 grant within 3 months and members have refunded the
same to the WSHG and / or the CCL has been sanctioned by the Bank.
It is proposed to develop 3,000 SHGs. An amount of Rs. 1350 lakh has been
earmarked for this purpose.
The self-help groups will have to exhibit adequate maturity in order to receive
cost support from the project. The maturity status/level will be assessed on the
basis of maturity index/indicators summarized in Table-8.7.

PANCHESHWAR MULTIPURPOSE PROJECT SIA Study Report
Chapter 8: Livelihood Plan Page 9
Table-8.7: Maturity Index/Indicators to assess the maturity of Self-Help Groups
S. No.
Indicator Definition and description Maturity level
1. 1 Retention of members
Percentage of members remaining as member
Retention level of at least 90 percent
2. 2 Regular meeting Percentage of scheduled meetings held
Regularity level of at least 80%
3. 3 Regular saving Percentage of members regularly saving
Regularity level of at least 80%
4. 4 Internal loaning and repayment
Percentage of loans timely repaid back
Repayment of at least 90%
5. 5 Turnover of available funds/credit limit
Credit-deposit ratio Minimum ratio of 4:1
6. 6 Identification of Income Generating Activities
Number of activities identified %age of members willing to take up the identified activities
70% of members willing to take up at least 1 activity
8.8 BUDGET FOR LIVELIHOOD PLAN FOR PAFS
An amount of Rs.22618.16 lakh has been earmarked for implementation of
plan for income generating activities, which is in addition to the cost earmarked
for implementation of Resettlement and Rehabilitation Plan. The details are
given in Table-8.8.
Table-8.8: Budget earmarked for implementation of plan for income generating
activities
S. No. Activity Budget
(Rs. lakh)
1 Livestock Rearing (Refer Table-8.1) 1508.00
2 Horticulture (Refer Table-8.5) 19685.16
3. Bee Keeping 75.00
4. Self Help Groups 1350.00
Total 22618.16

CHAPTER-9 LOCAL AREA DEVELOPMENT PLAN

PANCHESHWAR MULTIPURPOSE PROJECT SIA Study Report
Chapter 9: Local Area Development Plan Page 1
CHAPTER–9
LOCAL AREA DEVELOPMENT PLAN
9.1 INTRODUCTION
The present chapter outlines the Local Area Development Plan (LADP) for
Pancheshwar Project. The objective of the plan is to empower the families of
the study area villages. Contrarily, it is the project affected families residing in
affected who are not likely to benefit from the proposed project except for
compensation of their acquired properties, which would be mostly part of their
lands. Thus, LADP is being framed to extend benefits to not only the residents
of the affected villages, but also to residents of the villages adjoining to project
area which are also within the study area villages.
The following aspects have been covered under the Local Area Development
Plan:
Educational Facilities
Health Care and Medical Facilities
Infrastructure Development
Economic Development
Social and Cultural Development
A budget of 0.5% of the project cost has been earmarked for implementation of
Local Area Development Plan (LADP) which is 168 Crore.
9.2 LOCAL AREA DEVELOPMENT PLAN
9.2.1 Up gradation of Educational Facilities
It is proposed to upgrade the primary schools in 25 villages in the periphery of
the affected villages. The following activities are proposed under LADP
activities:
Up-gradation of school fixtures, equipment
Improvement of drinking water facilities
School bus service
It is suggested to upgrade school fixtures, equipment, etc., and to improve
drinking water facilities in one primary school in 25 study area villages. A lump-
sum amount of Rs. 15.0 lakh per primary school is being made for this purpose.

PANCHESHWAR MULTIPURPOSE PROJECT SIA Study Report
Chapter 9: Local Area Development Plan Page 2
Since 25 primary schools are to be upgraded, an amount of Rs.362.5 lakh
needs to be earmarked for this purpose. In addition, an amount of Rs.200 lakh
has been earmarked for purchase of 10 school vans/mini-buses. Thus, total
lump-sum amount of Rs.562.5 lakh needs to be earmarked for this purpose.
The breakup of cost required for up-gradation of existing primary schools is
given in Table–9.1. The list of villages in which existing primary schools are to
be upgraded is enclosed as Table-9.2.
Table 9.1: Break up of cost required for up-gradation of existing primary schools
S. No. Particular Amount
(Rs. lakh)
/school
Amount
(Rs. lakh) for
25 schools
1 Furniture & fixtures and equipment 5.0 125.0
2 Improvement of drinking water facilities 5.0 125.0
3 Toilets with biodigested to be
constructed in each school
4.5 112.5
Sub-Total (A) 15.0 362.5
3 Purchase of school vans/mini-buses x
10 Nos.
20.0 200.0
Sub-Total (B) 200.0
Total (A + B) 562.5
Table-9.2: List of Villages for Up-gradation of Primary Schools
S. No. Village Name Primary School
District Pithoragarh
1 Kimkhola 1
2 Tham 1
3 Duti Bagad 1
4 Raitoli 1
5 Kunlta 1
6 Busail 1
7 Pant Sera 1
8 Sunkholi 1
9 Dyora 1
10 Bathauli 1
11 Ranuwa 1
12 Oltari 1
13 Bheliya 1
14 Garali 1
15 Jamtari 1
District Almora
1 Kola 1

PANCHESHWAR MULTIPURPOSE PROJECT SIA Study Report
Chapter 9: Local Area Development Plan Page 3
S. No. Village Name Primary School
2 Chimkholi 1
3 Mayoli 1
4 Birkola 1
5 Jingal 1
District Champawat
1 Bachkot 1
2 Polap 1
3 Simalkhet 1
4 Nidil 1
5 Aslad 1
It is further suggested to construct 22 new schools in partially affected as well
as in nearby periphery villages. It is to be noted that the cost of land required
for the construction of the new Primary Schools is not included in the assumed
provision earmarked. The land and the village has to be decided by the District
Administration for construction of the new Primary School. The breakup of cost
required for construction of new primary schools is given in Table–9.3.
Table 9.3: Break up of cost required for construction of new primary schools
S. No. Particular Amount
(Rs. lakh)
/school
Amount
(Rs. lakh) for
20 schools
1 Construction of new schools 30.0 600.0
2 Furniture & fixtures and equipment 15.0 300.0
3 Drinking Water Facilities 10.0 200.0
4 Toilets with biodigested to be
constructed in each school
4.5 90.0
5 Purchase of school vans/mini-
buses x 22 Nos.
20.0 400.0
Total 79.5 1590.0
9.2.2 Scholarships for Students
It is suggested to provide scholarships for local students. For all those students
who are presently studying between Class–I to college, about 100 scholarships
are suggested for them. It is proposed that an amount of Rs. 1000 per month
for a period of 12 years may be extended as scholarship to about 10 students
in each of the 50 Study Area Villages. Thus, a total of 500 students will be
covered under this scheme. These students will then be supported in their
college education as well. Each student will get Rs. 20,000 for meeting their fee
and study material requirement. In addition, they will get Rs. 3000 per month for

PANCHESHWAR MULTIPURPOSE PROJECT SIA Study Report
Chapter 9: Local Area Development Plan Page 4
meeting their hostel requirements, as they will have to move out of their areas
for higher studies.
In addition, there are youths who have completed school level at present as
well. It is suggested to give an impetus to such youths who wish to pursue
college or higher education. These students will also be supported for college
education. About 500 such students (10 students in each of the 50 Study Area
villages) will be supported by the project. Thus, a total of 1000 students will be
supported for college education.
A total amount of Rs. 2576.0 lakh say Rs. 25.76 Crore may be earmarked for
providing scholarships, as part of local area development plan. The details are
given in Table–9.4.
Table – 9.4: Details of scholarships
S. No. Activities Amount
(Rs. lakh)
1 School education (Rs. 1500/month for 144 months
for 600 students)
1296.0
2 College education
a) Fees/course material (@ Rs. 20000/ student
for 1000 students)
b) Hostel expenses (@ Rs. 3000/month for 36
months for 1000 students)
200.0
1080.0
Total 2576.0
9.2.3 Improvement of Public Health Facilities
It is proposed up-grade existing Primary Health Sub-Centers as part of the
LADP of the area. Up-gradation of this health care facility would involve
renovation of existing structure/ construction of new wing, if required. Provision
of new and/or latest gadgets and instruments, such as furniture, beds,
laboratory equipment/instruments, computers wherever possible, installation of
new floorings and ceilings, up-gradation/ construction of new of lavatories,
electrification and adequate and proper lighting in rooms, facilities for cold
storage of essential medicines, provision of drinking water facilities, etc. An
amount of Rs. 150 lakh is being made for up-gradation of the existing PHSCs at
villages Askora (tehsil Gangolihat) and Majirkanda (tehsil Pithoragargh) in
district Pithoragarh. The details are given in Table-9.5.
In addition, it is suggested to purchase 4 vans fitted with life saving equipment
and stocked with medicines, which will function as a mobile clinics. It is further

PANCHESHWAR MULTIPURPOSE PROJECT SIA Study Report
Chapter 9: Local Area Development Plan Page 5
suggested to attach these mobile clinics to any of the above mentioned PHSCs
from where these mobile units will operate. A lump-sum amount of Rs. 160 lakh
is being earmarked for this purpose.
A total amount of Rs. 310.0 lakh is being earmarked for extending health
facilities under LADP. The details are given in Table 8.4. Whereas Table-8.5
elucidates the proposed new Primary Health Centre in the partially affected
villages as well as nearby periphery villages. It is seen that the assumed cost
for construction of one PHC is 140.0 lakhs. Hence it is proposed to construct 22
new PHC in the area and assumed assumption for the same is 3080.00 lakhs.
It is to be noted that the land and the villages where these new proposed PHCs
shall be constructed will be decided by the District Administration.
Table-9.5: Budget for up-gradation of PHSCs
S. No. Item Cost
(Rs. lakh)
Cost for 2
PHSCs
(Rs. lakh)
1 Furniture, Beds and other items 15.0 30.0
2 Up-gradation of Pathological laboratory 30.0 60.0
3 Up-gradation of operation theater (labor
room)
30.0 60.0
Sub-Total (A) 50.0 150.0
4 Purchase of 4 mobile clinic vans 40.0 160.0
Sub-Total (B) 160.0
Total (A+B) 310.0
Table-9.6: Budget for construction of new PHSCs
S. No. Item Cost
(Rs. lakh)
Cost of 22
new PHC
(in lakhs)
1 Construction of new Primary
Health Centre
50.0 1100.00
2 Furniture, Beds and other items 15.0 330.0
3 Up-gradation of Pathological
laboratory
25.0 550.0
4 Up-gradation of operation theater
(labor room)
25.0 550.0
5 Purchase of mobile clinic vans 25.0 550.0
Total 140 3080
Land Cost for the Construction of the proposed new PHC is not included

PANCHESHWAR MULTIPURPOSE PROJECT SIA Study Report
Chapter 9: Local Area Development Plan Page 6
9.2.4 Construction of Community Toilets
It is proposed to construct community toilets with bio-digestors along with Reed
Bed in various study area villages. It is proposed to construct 8 seater
community toilets with bio-digestors along with Reed Bed in 112 Villages which
are partially affected by the project. The cost of 8 seaters community toilet with
bio-digester alongwith Reed Bed in each village will be Rs. 18.0 lakh. The cost
of community toilet 8 seater is given in Table-9.7. The cost includes provision
for development of water supply facilities for toilets. Thus, total costs earmarked
for community toilets shall be Rs. 2016 lakh say Rs.20.16 Crore.
Table-9.7: Budget for construction of community toilets in study area villages
S. No. Item Cost
(Rs. lakh)
Cost of 112 new
community toilets
(Rs. lakh)
1 Civil works 11.70 1310.4
2 Electric works 1.10 123.2
3 Plumbing Works 1.0 112.0
4 Bio-digestor of capacity 5000 litres
alongwith Reed Bed for all 8 seats
4.20 470.4
Total 18.00 2016
9.2.5 Industrial Training Institute (ITI)
It is proposed to develop Industrial Training Institute (ITI) for imparting technical
skills to local people. The location of ITI will be decided in consultation with
State Government and the land will be provided by District Administration. The
project proponent proposes to contribute an amount of Rs.600.0 lakh.
9.2.6 Upgradation of Existing Hospitals
It is proposed that the government hospital at Champawat, Pithoragarh and
Almora shall be upgraded by the project proponent. It is suggested that the
existing infrastructure facilities could be improved wherever possible or newly
created/ augmented if required.
Up-gradation of health care facility would involve renovation of existing
structure/ construction of new wing, if required. Provision of new and/or latest
gadgets and instruments, such as furniture, beds, laboratory
equipment/instruments, computers wherever possible, etc painting of walls,
installation of new floorings and ceilings, beautification of premises with lawns

PANCHESHWAR MULTIPURPOSE PROJECT SIA Study Report
Chapter 9: Local Area Development Plan Page 7
and flower-beds, up-gradation/ construction of new of lavatories, electrification
and adequate and proper lighting in room, facilities for cold storage of essential
medicines, provision of drinking water facilities, etc.
An amount of Rs. 5940 lakh say 59.40 Crore is being made for up-gradation of
the existing one each government hospital at Champawat, Pithoragarh and
Almora. The details are given in Table-9.8.
Table-9.8: Cost for up-gradation of Government hospital
S. No. Item Cost
(Rs. Lakh/per
hospital)
Cost of up gradation
of 3 existing
hospitals in project
area districts
(Rs. lakh)
1. Hospital building 20,000 sq.ft.@
Rs. 2000/sq.ft.
400.00 1200.00
2. Land cost 500.00 1500.00
3. Furniture, Beds and other items 100.00 300.00
4. Up gradation of Pathological
laboratory
300.00 900.00
5. X-ray machines 60.00 180.00
6. ECG machines 60.00 180.00
7. Up-gradation of operation
theater
300.00 900.00
8. Ventilator/ Defoliator 200.00 600.00
9 Purchase of one van 30.00 90.00
10. Purchase of two vans with
medical facilities
60.00 180.00
11. Computer, printers, UPS, etc. 20.00 60.00
Total 1980 5940
9.3 BUDGET FOR LADP
An amount of Rs. 16833.5 lakh say Rs. 168.4 Crore is being made for
implementation of the LADP Activities. The details are shown in Table-9.9.
Table-9.9: Budget for implementation of Local Area Development Plan
S. No. Items Budget
(Rs. lakh)
1 Upgradation of Educational Facility 562.5
2 Construction of new Primary School 1749.0
3 Scholarships for Students 2576.00

PANCHESHWAR MULTIPURPOSE PROJECT SIA Study Report
Chapter 9: Local Area Development Plan Page 8
S. No. Items Budget
(Rs. lakh)
4 Upgradation of existing PHCs 310.0
5 Construction of new Primary School 3080.00
6 Construction of new Community Toilets 2016.00
7 Industrial Training Institute 600.00
8 Upgardation of Existing Hospitals 5940.00
Total 16833.5
Say Rs. 168.4 Crore

CHAPTER-10
MONITORING AND EVALUATION

PANCHESHWAR MULTIPURPOSE PROJECT SIA Study Report
Chapter 10: Monitoring & Evaluation Page 1
CHAPTER-10
MONITORING AND EVALUATION
10.1 INTRODUCTION
Monitoring is an essential component for sustainability of any water resources
project. It is an integral part of any environmental assessment process. Any
water resources development project introduces complex inter-relationships in
the project area between people, various natural resources, biota and the
developing forces. Thus, a new environment is created. It is very difficult to
predict with complete certainty the exact post-project environmental scenario.
Hence, monitoring of critical parameters is essential in the project operation
phase.
Monitoring of social indicators signal potential problems and facilitate timely
prompt implementation of effective remedial measures. The data so generated
can serve as a data bank for prediction of post-project scenarios in similar
projects.
10.2 INSTITUTIONAL/ADMINISTRATIVE ARRANGEMENT FOR
IMPLEMENTATION OF R&R MEASURES
Appointment of Administrator at State Level
State Government of Uttarakhand shall appoint an officer not below the
rank of Joint Collector or Additional Collector or Deputy Collector or
equivalent official of Revenue Department, who will be responsible for
R&R Plan at the State Level.
Administrator shall, with a view to enable him to function efficiently and
to meet the special time-frame, be provided with such powers, duties
and responsibilities as may be prescribed by the appropriate
Government and provided with office infrastructure and be assisted by
such officers and employees who shall be subordinate to him as the
appropriate Government may decide.
Subject to the superintendence, directions and control of the appropriate
Government and the Commissioner for Rehabilitation and Resettlement,
the formulation, execution and monitoring of the Rehabilitation and
Resettlement Scheme shall vest in the Administrator.

PANCHESHWAR MULTIPURPOSE PROJECT SIA Study Report
Chapter 10: Monitoring & Evaluation Page 2
Commissioner for Rehabilitation and Resettlement
The State Government of Uttarakhand shall appoint an officer of the rank
of Commissioner or Secretary of that Government for rehabilitation and
resettlement of affected families under this Act, to be called the
Commissioner for Rehabilitation and Resettlement.
The Commissioner shall be responsible for supervising the formulation
of rehabilitation and resettlement schemes or plans and proper
implementation of each schemes or plans.
The Commissioner shall be responsible for the post implementation
social audit in consultation with the Gram Sabha in rural areas and
municipality in the urban areas.
Rehabilitation and Resettlement Committee at Project Level
Where land proposed to be acquired is equal to or more than one
hundred acres, the appropriate Government shall constitute a
Committee under the chairmanship of the Collector to be called the
Rehabilitation and Resettlement Committee, to monitor and review the
progress of implementation of the Rehabilitation and Resettlement
scheme and to carry out post-implementation social audits in
consultation with the Gram Sabha in rural areas and municipality in
urban areas.
The Rehabilitation and resettlement Committee shall include ,apart from
officers of the appropriate Government, the following members, namely:-
- representative of women residing in the affected area;
- a representative of each schedule caste and schedule tribe residing
in the affected area
- a representative of a voluntary organization working in the area
- a representative of a nationalized bank the land acquisition officer of
the project
- the chairperson of the panchayats or municipalities located in the
affected area or their nominees
- the chairperson of the district planning committee or his nominee
- the Member of Parliament and Member of Legislative assembly of the
concerned area or nominees
- a representative of the requiring body
- Administrator for Rehabilitation and Resettlement as the member
Convener.
The procedure regulating the discharge of the process given in this
section and other matters connected thereto of the Rehabilitation and
Resettlement Committee shall be such as may be prescribed by the

PANCHESHWAR MULTIPURPOSE PROJECT SIA Study Report
Chapter 10: Monitoring & Evaluation Page 3
appropriate Government.
10.3 MONITORING AND EVALUATION
Monitoring and Evaluation (M&E) must be simultaneous with the
implementation of Rehabilitation Plan. It requires specialized skill for application
of general project monitoring procedures to the process of land acquisition and
rehabilitation. Conventional monitoring, normally carried out by the Government
machinery, often misses focus on certain vital aspects and does not identify
certain shortcomings, which may otherwise prove very important. While the
conventional government monitoring will continue, an external M&E agency will
also be engaged to help in proper monitoring of land acquisition and
rehabilitation programs. The main purpose of involving such an agency is to
bring the problems and difficulties faced by the PAFs to the notice of
Administrator R&R on a regular basis for their redressal as well as to help in
formulating and undertaking corrective measures. The external Monitoring and
Evaluation (M&E) agency can submit half yearly reports on the progress of
implementing Rehabilitation Master Plan (RMP) along with suggestions and
corrective measures required for improvement in the implementation of
Rehabilitation Plan.
For Land Acquisition and rehabilitation program, M&E system will consist of:
i) Administrative monitoring;
ii) Socio-economic performance, and
iii) Impact evaluation.
Administrative monitoring will be conventionally carried out by SLAO, project
authorities, Resettlement Commissioner and other concerned government
agencies/departments. The focus will be on physical (like number of land
holders affected and land based resettlement, area identified for allotment to
Village Level Committee, etc.) and financial (like compensation paid, payment
to M&E agency, office establishment cost, etc.) parameters.
The socio-economic monitoring which will be carried out concurrently is the
crux of M&E exercise to provide interim measures based on the field level
situations. This along-with impact evaluation at the end of plan period will be
carried out by the M&E agency. While covering the affected community,
monitoring will focus on the vulnerable groups like women, physically
handicapped, etc. The household information collected through the socio-
economic survey will form the benchmarks for comparison. However, these
benchmarks will be supplemented in order to create new reference points
against performance, effects and objectives.

PANCHESHWAR MULTIPURPOSE PROJECT SIA Study Report
Chapter 10: Monitoring & Evaluation Page 4
10.3.1 Monitoring and Evaluation Guidelines
Monitoring of the progress of R&R is important because of the sensitivity of
these issues. The objective of monitoring is to assess the progress of
resettlement activity, to identify difficulties, ascertain problem areas, and
provide indication for the need of calling attention to some specific issues at an
early stage. Following tasks have to be performed by the group at different
stages of the project:
Establish baseline information on individual PAFs and their pre-
project standards of living, health conditions, nutritional patterns, etc.
This should precede resettlement in general by a year.
The planning of the resettlement monitoring studies could cover
disbursement of compensation and grants.
Monitoring of resettlement sites regarding, preparation of land,
construction activities, water and other facilities required before the
actual resettling of PAFs.
The resettlement monitoring system could cover transport of people,
belongings and allocation of replacement assets. Their report should
also include information on performance of field staff and concerned
official’s participation of the PAFs and host community reactions.
After resettlement, a few sensitive indicators using sample survey
techniques should be measured, mainly to understand how effective
the R&R plan has been in reality.
The monitoring and evaluation can continue for several years after
actual relocation. The frequency of monitoring can be reduced after
the completion of R&R work. The monitoring reports need to be
submitted periodically to assess progress of resettlement and its
effects compared with established policy and specific timetables and
benchmarks at each phase.
10.3.2 Post-Project Monitoring
Status of availability of alternative homestead for project affected persons,
development of infrastructural facilities such as schools, sewer networks, roads,
etc. are some of the aspects which could be considered for monitoring and
modifications may be suggested if required. It needs to be appreciated that
R&R issues are politically and socially sensitive issues and need timely
attention. For such reasons, it is suggested that the monitoring be conducted by
an independent agency not connected with the project. Therefore, an
independent Consultant having experience in monitoring & evaluation of
implementation of Resettlement & Rehabilitation Plans in similar areas and not

PANCHESHWAR MULTIPURPOSE PROJECT SIA Study Report
Chapter 10: Monitoring & Evaluation Page 5
connected with the project can be appointed for monitoring the project. The
Consultant will review the rehabilitation and resettlement programme after 2nd,
4th and 6th year from the completion of the R&R activity.
10.3.3 Participation of PAFs
Involvement of affected communities in planning and implementation of
rehabilitation programs according to their felt needs and socio-economic
conditions are of vital importance. To obtain co-operation, participation and
feedback, PAFs need to be systematically informed and consulted during
preparation and implementation of resettlement plan about their options and
rights. In the proposed project, co-operation and participation of PAFs in the
resettlement process could be ensured through their involvement in each of the
following stages.
Involvement in preparation of Rehabilitation Master Plan
As a part of participatory planning, community meetings should be held on a
routine basis to explain about the project and the R&R policy of the project.
Direct communication with the PAFs will negate the politicization of the R&R
Process. The communication with the PAFs can be through the Village Level
Committee.
Involvement of PAFs in implementation process
The Village Level Committee can be involved in the implementation of
Rehabilitation Plan particularly during the identification of forest land to be
allotted to Village Level Committee. They shall also be consulted in finding out
alternative economic opportunities to supplement their household income.
However, some NGO groups can also be associated which can interact directly
with the project authorities and the affected population.
10.3.4 Parameters for Monitoring and Evaluation of R&R Plan
Once the R&R Plan is implemented, affected families should not be forgotten.
Their progress should be monitored, evaluated and recorded. This would
greatly help the government or other organizations for further improving the
Rehabilitation and Resettlement guidelines. It would form a basis of evaluating
whether the resettlement has been a success or not. If the resettlement has not
been successful, the answers would come out at this stage and the same
mistakes can be avoided for other resettlement schemes.
Priorities that would have to be monitored and evaluated are; is the family's

PANCHESHWAR MULTIPURPOSE PROJECT SIA Study Report
Chapter 10: Monitoring & Evaluation Page 6
income more or less in their new location? Do they inter-mingle with the host
population? If not, why? Has their standard of living increased or decreased?
Are health and education facilities more accessible to them? Have new
opportunities come their way or have they stagnated? etc. Such questions
would prove invaluable in assessing the success of the resettlement scheme.
Progress report of their resettlers should be maintained. The progress report
format should include among others the following:
Total household covered under the R&R plan:
(1) No of families
(2) Population
Birth and Death information:
(1) No. of children born
(2) No. of deaths
Income and expenditure (monthly) pattern of the resettlers
(1) Average monthly income (with its break up)
(2) Average monthly expenditure (with its break-up)
House constructions:
(1) No. of constructions under progress
(2) Constructions completed
(3) Materials used
(4) Size of construction
Credit facilities availed:
(1) No. of resettled families that have availed of credit
(2) Purpose for credit availed
(3) Sizes of credit availed
Loan Recovery:
(1) Excellent (100%)
(2) Good (over 50%)
(3) Bad (below 20%)
Agricultural inputs;
(1) Seeds (kg)
(2) Fertilizers (kg)
(3) Pesticides (kg)

PANCHESHWAR MULTIPURPOSE PROJECT SIA Study Report
Chapter 10: Monitoring & Evaluation Page 7
Agricultural Production:
(1) Annual cereal productions (kg)
(2) Cash crop productions (kg)
(3) Other farm produces (kg)
Education facilities:
(1) Primary School
(2) Community School
(3) Junior High School
(4) Others
(5) No. of students enrolled
Medical facilities:
(1) BHU (Basic Health Unit)
(2) Dispensaries
(3) Others
Communication:
(1) Distance from motorable road
(2) Distance from telephone
(3) Distance from Post office
(4) Distance from Bus stop
Drinking water:
(1) Piped water
(2) Natural stream water
(3) Other sources of water
Rural electrification:
(1) No. of houses covered
If such a format was included the progress of the resettled families can be
easily monitored and evaluated. However, such a formatted progress report
would have to be up dated annually for a minimum of five years in order to get
an accurate picture.
10.4 BUDGET
An amount of Rs.250 lakh has been earmarked for conducting Monitoring &
Evaluation Studies for implementation of Resettlement and Rehabilitation Plan.

CHAPTER-11
COST ESTIMATES

PANCHESHWAR MULTIPURPOSE PROJECT SIA Study Report
Chapter 11: Cost Estimates Page 1
CHAPTER-11
COST ESTIMATES
11.1 COST FOR IMPLEMENTING MANAGEMENT PLAN FOR SOCIAL
ASPECTS
The total amount to be spent for implementation of Management Plan for Social
Aspects is Rs. 813100.47 lakh or Rs.8131.00 crore. The details are given in Table-
11.1.
Table-11.1: Cost for Implementing Social Management Plan
S. No. Item Cost
(Rs. lakh)
1. Rehabilitation & Resettlement Plan 773398.81
2. Livelihood Plan for PAFs (Refer Table-8.8) 22618.16
3. Local Area Development Plan (Refer Table-9.9) 16833.5
4. Monitoring and Evaluation Aspects (Refer Section-9.4) 250.00
Total 813100.47

ANNEXURE


Consultant:
76-C, Institutional Area, Sector – 18, Gurgaon – 122015, Haryana (INDIA)
Telephone: 0124-2342576, Fax: 0124-2349187 [email protected]
Website: http://www.wapcos.co.in JUNE 2017


![ODOT- PDA intro.ppt [Read-Only] · PDA ConclusionsPDA Conclusions • PDA with CAPWAP evaluates capacity at low cost for driven piles, drilled shafts, & augercast piles • PDA gives](https://static.fdocuments.net/doc/165x107/5e80a08e0838cb51cc1301e3/odot-pda-introppt-read-only-pda-conclusionspda-conclusions-a-pda-with-capwap.jpg)