Page 1 PERFORMANCE HIGHLIGHTS DECEMBER 2013.
58
Page 1 www.canarabank.com PERFORMANCE HIGHLIGHTS DECEMBER 2013
-
Upload
everett-rich -
Category
Documents
-
view
218 -
download
3
Transcript of Page 1 PERFORMANCE HIGHLIGHTS DECEMBER 2013.
Page 1www.canarabank.com
PERFORMANCE
HIGHLIGHTS
DECEMBER 2013

Page 2www.canarabank.com
HIGHLIGHTS – Dec’2013
Major Highlights
Operating Profit for 9 months at `4914 Crore, up by 17.2% y-o-y.
Net profit for 9 months at `1827 Crore
Total provision made for the quarter was at ` 1182 crore compared to ` 799 crore for Q2FY14 and ` 1106 crore for Q1FY14. The provision for NPAs during the quarter was `543 crore and provisions made for depreciation on investments was ` 157 crore.
Total income for Q3FY14 rose to `10935 crore, with a y-o-y growth of 16.4%.
Gross NPA Ratio at 2.79% compared to 2.77% as at Dec’12, despite spike in stressed assets at the industry level.
Upgradation was of `2061 crore in 9 months of this year compared to `779 crore same period last year.
Record Cash Recovery at `3135 crore compared to `2477 crore as at Dec’12.
Page 3www.canarabank.com
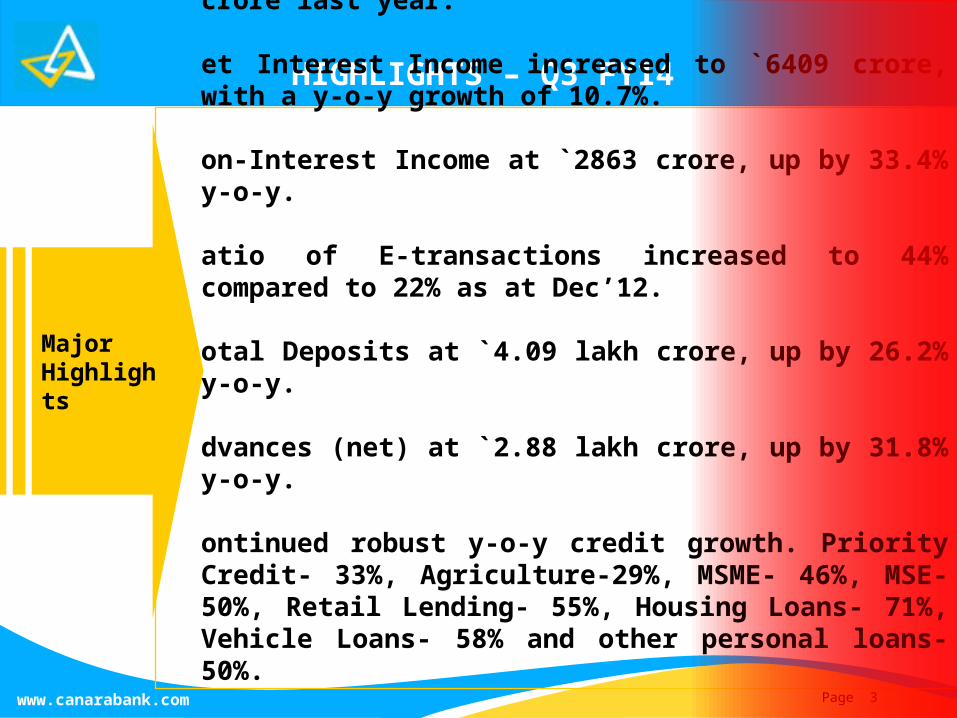
HIGHLIGHTS – Q3 FY14
Major Highlights
Recovery from technically written off accounts plus bad debts at `351 crore compared 185 crore last year.
Net Interest Income increased to `6409 crore, with a y-o-y growth of 10.7%.
Non-Interest Income at `2863 crore, up by 33.4% y-o-y.
Ratio of E-transactions increased to 44% compared to 22% as at Dec’12.
Total Deposits at `4.09 lakh crore, up by 26.2% y-o-y.
Advances (net) at `2.88 lakh crore, up by 31.8% y-o-y.
Continued robust y-o-y credit growth. Priority Credit- 33%, Agriculture-29%, MSME- 46%, MSE- 50%, Retail Lending- 55%, Housing Loans- 71%, Vehicle Loans- 58% and other personal loans-50%.
876 New Branches and 1262 ATMs added y-o-y and 829 branches and 1017 ATMs added during the year.
The Bank has declared an interim dividend of 65%.
Page 4www.canarabank.com
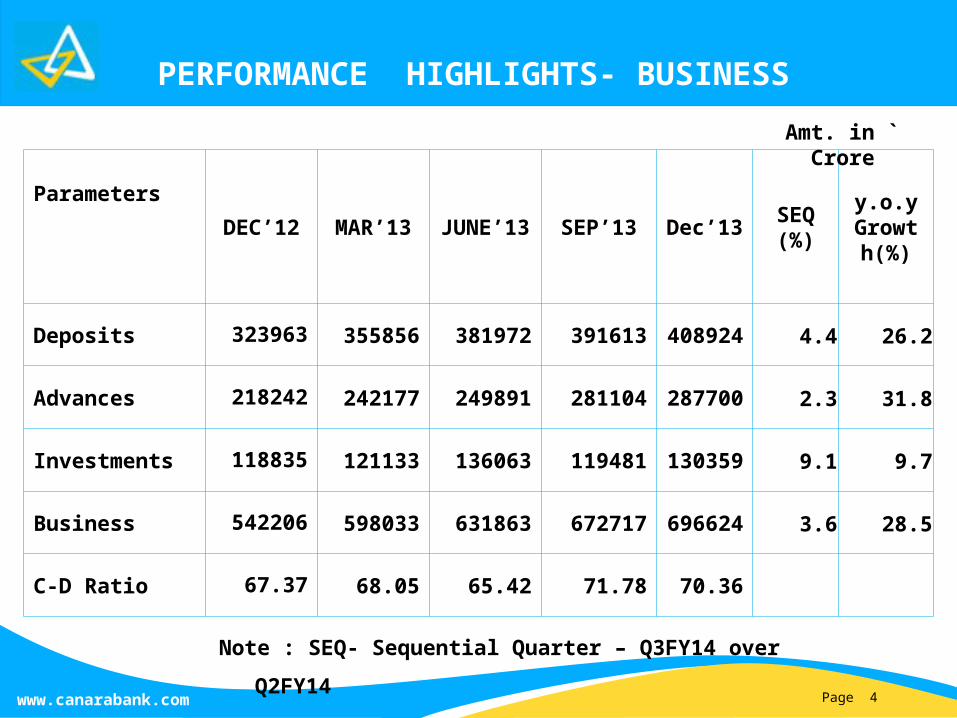
PERFORMANCE HIGHLIGHTS- BUSINESS
Parameters
DEC’12 MAR’13JUNE’1
3SEP’13
Dec’13
SEQ(%)
y.o.yGrowth(%)
Deposits32396
3 355856 381972 39161340892
4 4.4 26.2
Advances 218242 242177 249891 28110428770
0 2.3 31.8
Investments 118835 121133 136063 11948113035
9 9.1 9.7
Business54220
6 598033 631863 67271769662
4 3.6 28.5
C-D Ratio 67.37 68.05 65.42 71.78 70.36
Amt. in ` Crore
Note : SEQ- Sequential Quarter – Q3FY14 over
Q2FY14
Page 5www.canarabank.com
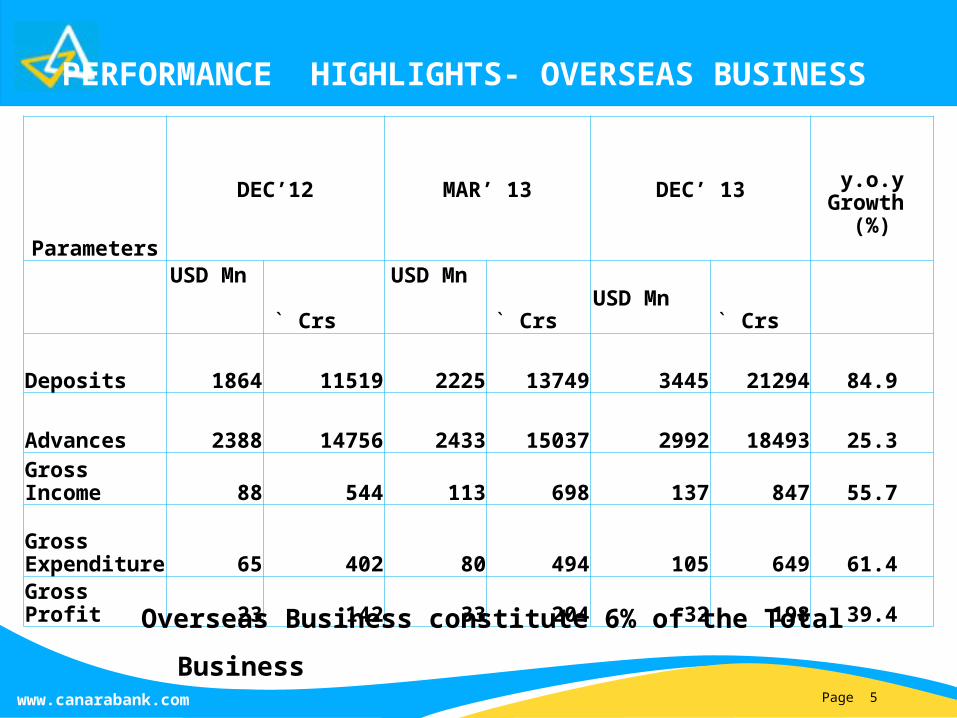
PERFORMANCE HIGHLIGHTS- OVERSEAS BUSINESS
Parameters
DEC’12 MAR’ 13 DEC’ 13 y.o.yGrowth
(%)
USD Mn ` Crs
USD Mn ` Crs
USD Mn ` Crs
Deposits 1864 11519 2225 13749 3445 21294 84.9
Advances 2388 14756 2433 15037 2992 18493 25.3Gross Income 88 544 113 698 137 847 55.7Gross Expenditure 65 402 80 494 105 649 61.4Gross Profit 23 142 33 204 32 198 39.4
Overseas Business constitute 6% of the Total
Business

Page 6www.canarabank.com
PERFORMANCE HIGHLIGHTS- PROFITABILITY-Q3 FY14
Parameters Q3 FY13 Mar’13 Q2 FY14 Q3FY14SEQ(%)
y.o.yGrowth
(%)
Total Income 9390 37231 10427 10935 4.9 16.5
Total Expenses 7874 31341 9003 9344 3.8 18.7
Operating Profit 1516 5890 1425 1591 11.6 4.9
Net Profit 711 2872 626 409 -- --
NIM (%) 2.36 2.40 2.22 2.21 -- --
Amt. in ` Crore

Page 7www.canarabank.com
PERFORMANCE HIGHLIGHTS- PROFITABILITY-9M FY14
Parameters 9M FY13 Mar’13 9M FY14y.o.y
Growth(%)
Total Income 27759 37231 31871 14.8
Total Expenses 23567 31341 26957 14.4
Operating Profit 4192 5890 4914 17.2
Net Profit 2147 2872 1827 --
NIM (%) 2.36 2.40 2.21
Amt. in ` Crore

Page 8www.canarabank.com
PERFORMANCE HIGHLIGHTS- PRODUCTIVITY RATIOS
Parameters DEC’12 MAR’13 DEC’13
Business Per Employee (` Crore) 12.70 14.20 14.34
Business Per Branch (` Crore) 147.30 160.40 152.87
Gross Profit Per Employee (` Lakh) 14.48 14.28 13.85
Net Profit per Employee (` Lakh) 6.83 6.96 5.15

Page 9www.canarabank.com
PERFORMANCE HIGHLIGHTS- EXPANDING THE REACH
Dec’12 Mar’13 Dec’13Y-o-Y in
crBranch Network 3681 3728 4557 876ATM Strength 3281 3526 4543 1262Debit Card (In Lakh) 84.1 95.52 133.21 49.11
4552 domestic Branches
5 overseas branches at London, Leicester, Shanghai, Manama & Hong Kong
Rural 1363 29.94%
Semi-Urban 1429 31.39%
Urban 890 19.55%
Metro 870 19.11%

Page 10www.canarabank.com
BUSINESS
SEGMENTS

Page 11www.canarabank.com
SEGMENT WISE DEPOSITS
Parameters DEC’12
MAR’13
JUN’13 SEP’13DEC’1
3SEQ (%)
y.o.yGrowth(%)
Total Deposits32396
335585
638197
2391613
408924 4.4 26.2
Current 12473 14893 14374 15208 14793 -2.7 18.6
Saving 68689 71168 73938 80070 79671 -0.5 16.0
CASA 81161 86061 88312 95278 94465 -0.9 16.4
CASA (%)Dom 25.9% 25.1% 24.2% 25.6%24.3
% -- --
Term Deposits
242802
269795
293659 296335
314460 6.1 29.5
- High Cost Deposits
75184 53223 36254 33111 32814 -0.9 -56.4
Amt. in ` Crore

Page 12www.canarabank.com
ROBUST GROWTH IN ADVANCES SEGMENTS
Credit Segments DEC’12 Mar’13 DEC’13
Priority Sector 9% 17% 33%
Agriculture 27% 28% 29%
MSME -16% 6% 46%
MSE -7% 11% 50%
Retail -15% -7% 55%
Housing -26% -17% 71%
Vehicle 14% 17% 58%
Other Personal Loans -4.16 13% 50%

Page 13www.canarabank.com
LOANS & ADVANCES SEGMENT
Parameters DEC’12 MAR’13 JUN’13 SEP’13DEC’1
3SEQ(%)
y.o.yGrowth (%)
Advances (Net) 218242 242177
249891
281104
287700 2.3 31.8
Total Priority 69700 78998 83085 88280 93018 5.4 33.5
Agriculture 35365 40786 43292 44042 45703 3.8 29.2
- Direct Agriculture
32802 37984 40195 39995 41787 4.5 27.4
- Indirect Agriculture
2563 2802 3097 4047 3916 -3.2 52.8
Other Priority 11078 11804 12100 12603
12848 1.9 16.0
MSME 32603 37017 37173 43464 47678 9.7 46.2
MSE 23257 26612
27873
31773
34773 9.4 49.5
Retail Credit 21259 23084 25231 30274 32847 8.5 54.5
Amt. in ` Crore

Page 14www.canarabank.com
ACHIEVEMENT UNDER MANDATED TARGETS – PRIORITY SECTOR
Achieved the mandated targets in respect of
Total priority credit (40.46% against 40% norm)
Agriculture (19.88% against 18% norm)
Direct agriculture ( 18.18% against 13.5% norm)
Credit to specified minority communities (17.54% against 15% norm)
Weaker Section (12.39% against 10% norm)
M&SE (50% y.o.y growth against 20% norm)
Number of Micro Enterprises accounts (92.7% growth against 10% norm)
Mandated Targets under Priority Sector
Page 15www.canarabank.com
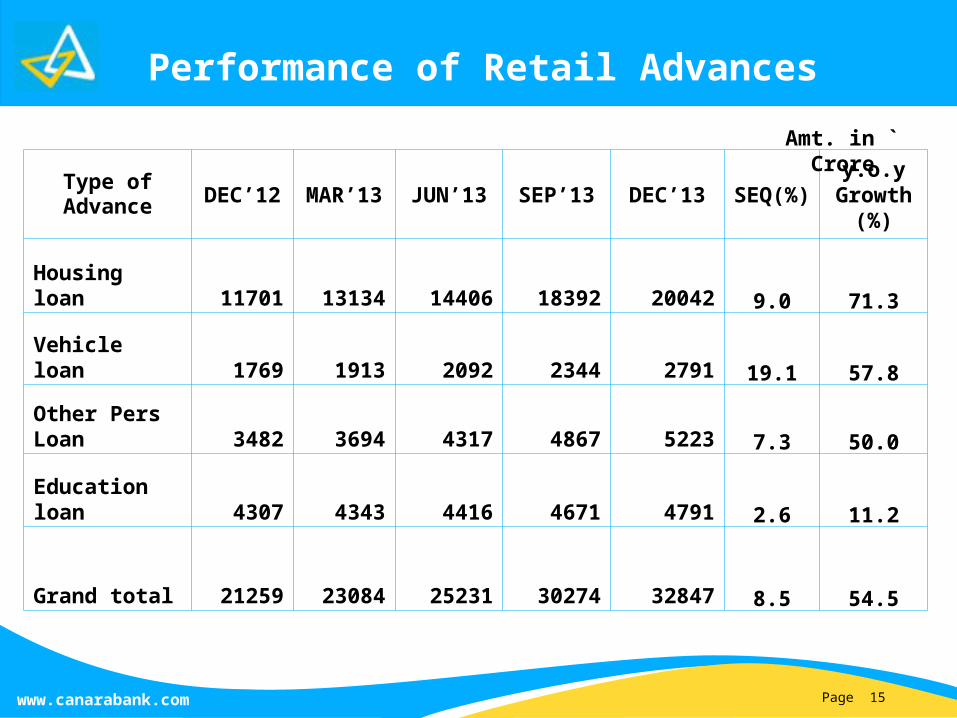
Performance of Retail Advances
Type of Advance
DEC’12
MAR’13
JUN’13 SEP’13 DEC’13SEQ(%)
y.o.yGrowth
(%)
Housing loan 11701 13134 14406 18392 20042 9.0 71.3
Vehicle loan 1769 1913 2092 2344 2791 19.1 57.8
Other Pers Loan 3482
3694 4317 4867 5223 7.3 50.0
Education loan
4307 4343 4416 4671 4791 2.6 11.2
Grand total 21259 230842523
13027
43284
7 8.5 54.5
Amt. in ` Crore

Page 16www.canarabank.com
EXPOSURE - INFRASTRUCTURE
Parameters DEC’12
MAR’13
SEPT’13
DEC’13
% Share Total Adv
SEQ(%)
y.o.yGrowth (%)
Roads 5594 5726 5271 6529 2.3 23.9 16.7Ports 635 619 597 1112 0.4 86.3 75.1Airports 1479 1507 1355 1380 0.5 1.8 -6.7Power (Generation, Transmission & Distribution)
30450 32076 38707 38414 13.4 -0.8 26.2
Telecom 6162 6512 6960 7190 2.5 3.3 16.7Other Infrastructure
2106 2086 3431 2849 1.0 -17.0 35.3
Total Infrastructure
46426 48525 56322 57474 20.0 2.0 23.8
Amt. in ` Crore

Page 17www.canarabank.com
Parameters DEC’12
MAR’13
SEPT’13
DEC’13
% Share Total Adv
SEQ(%)
y.o.yGrowth
(%)
-Power Generation 12134
14234
18754 19334 6.7 3.1 59.3
-Power Transmission
1113 1280 2171
2286 0.8 5.3 105.4
-Power Distribution 17203
16562
17782 16794 5.8 -5.6 -2.4
Total Power 304503207
63870
7 38414 13.4 -0.8 26.2Of which SEBs 18719
21454
28317 23927 8.3 -15.5 27.8
Amt. in ` Crore
EXPOSURE - POWER SECTOR & AVIATION
Exposure to Aviation
1479
1907 1862 1833
0.6 -1.6 23.9
Page 18www.canarabank.com
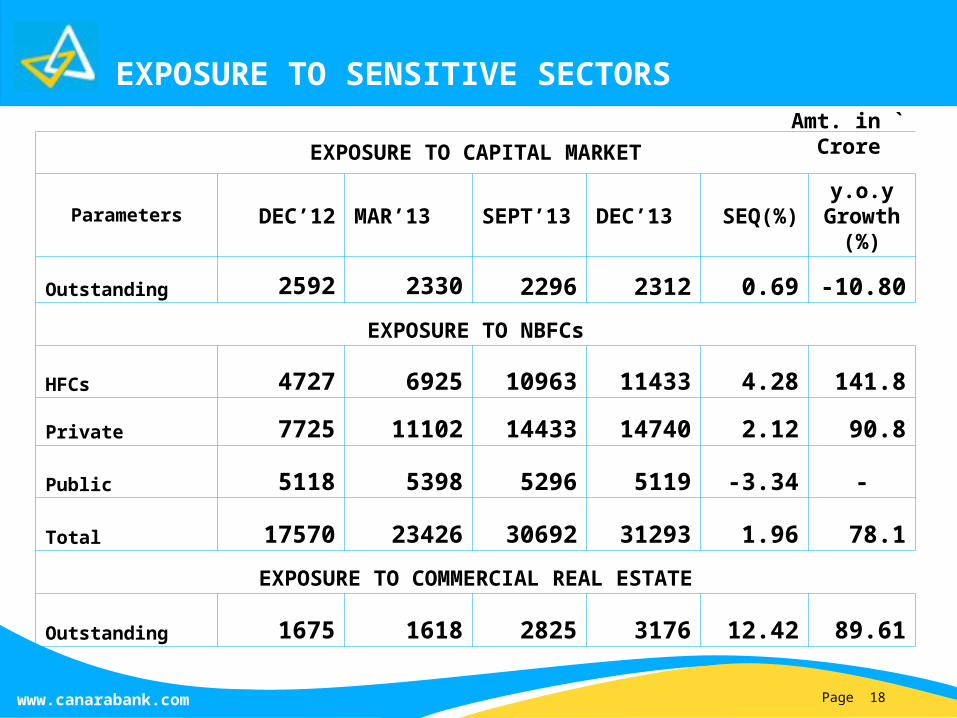
EXPOSURE TO CAPITAL MARKET
Parameters DEC’12 MAR’13SEPT’13
DEC’13 SEQ(%)y.o.y
Growth (%)
Outstanding 2592 2330 2296 2312 0.69 -10.80
EXPOSURE TO NBFCs
HFCs 4727 6925 10963 11433 4.28 141.8
Private 7725 11102 14433 14740 2.12 90.8
Public 5118 5398 5296 5119 -3.34 -
Total 17570 23426 30692 31293 1.96 78.1
EXPOSURE TO COMMERCIAL REAL ESTATE
Outstanding 1675 1618 2825 3176 12.42 89.61
Amt. in ` Crore
EXPOSURE TO SENSITIVE SECTORS

Page 19www.canarabank.com
FINANCIALS

Page 20www.canarabank.com
PROFITABILITY- Q3 FY14
Parameters Q3 FY13
Mar’13
Q1FY14
Q2 FY14
Q3 FY14
SEQ (%)
y.o.yGrow
th (%)
Total Income 9390 37231 10508 10427 10935 4.9 16.5
Total Expenses 7874 31341 8610 9003 9344 3.8 18.7
Operating Profit 1516 5890 1898 1425 1591 11.6 4.9
Provisions 806 3018 1106 799 1182 47.9 46.7
Net Profit 711 2872 792 626 409 -- --
Net Int. Income 1988 7879 1991 2191 2227 1.6 12.0
Non Int. Income 846 3153 1238 773 851 10.2 0.7
Amt. in ` Crore

Page 21www.canarabank.com
PROFITABILITY – 9 M FY14
Parameters 9M FY13 Mar’13 9M FY14y.o.y
Growth (%)
Total Income 27759 37231 31871 14.8
Total Expenses 23567 31341 26957 14.4
Operating Profit 4192 5890 4914 17.2
Provisions 2046 3018 3087 50.9
Net Profit 2147 2872 1827 --
Net Int. Income 5788 7879 6409 10.7
Non Int. Income 2146 3153 2863 33.4
Amt. in ` Crore

Page 22www.canarabank.com
BREAK-UP : INCOME – Q3 FY14
Parameters Q3 FY13
Mar’13
Q1 FY14
Q2 FY14
Q3 FY14
SEQ (%)
y.o.yGrowth (%)
Interest onAdvances 5958
24380 6450 6964 7360 5.7 23.5
Interest onInvestments 2460 9112 2482 2597 2575 -0.8 4.7
Other InterestIncome 127 586 338 93 149 60.2 17.1
Total InterestIncome 8544
34078 9270 9654 10084 4.4 18.0
Non – Interest Income 846 3153 1238 773 851 10.1 0.7
Total Income 93903723
1 10508 10427 10935 4.9 16.4
Amt. in ` Crore
Page 23www.canarabank.com
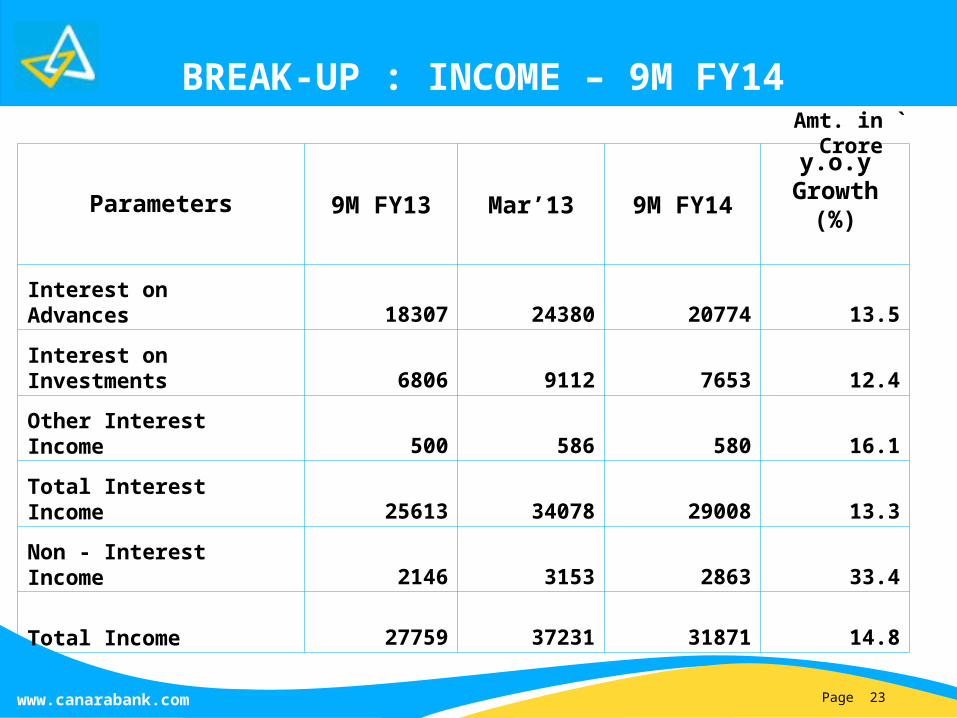
BREAK-UP : INCOME – 9M FY14
Parameters 9M FY13 Mar’13 9M FY14
y.o.yGrowth
(%)
Interest onAdvances 18307 24380 20774 13.5
Interest onInvestments 6806 9112 7653 12.4
Other InterestIncome 500 586 580 16.1
Total InterestIncome 25613 34078 29008 13.3
Non - Interest Income 2146 3153 2863 33.4
Total Income 27759 37231 31871 14.8
Amt. in ` Crore
Page 24www.canarabank.com
BREAK-UP : EXPENDITURE – Q3 FY14
Parameters Q3 FY13
Mar’13Q1
FY14Q2
FY14Q3
FY14SEQ (%)
y.o.yGrowth (%)
Interest Expenses 6556 26199 7278 7463 7857 5.3 19.8
Interest onDeposits 6307 25250 6948 6923 7311 5.6 15.9
Staff Expenses 831 3254 887 933 873 -6.4 5.1
Other Op Exp 486 1888 444 606 614 1.3 26.3
Total Op Exp 1317 5142 1331 1539 1488 -3.4 12.9
Total Expenses 7874 31341 8610 9003 9344 3.8 18.7
Amt. in ` Crore

Page 25www.canarabank.com
BREAK-UP : EXPENDITURE – 9M FY14
Parameters 9M FY13 Mar’13 9M FY14
y.o.yGrowth
(%)
Interest Expenses 19825 26199 22599 14.0
Interest onDeposits 19115 25250 21181 10.8
Staff Expenses 2365 3254 2693 13.9
Other Op Exp 1377 1888 1665 20.9
Total Op Exp 3743 5142 4358 16.4
Total Expenses 23567 31341 26957 14.4
Amt. in ` Crore

Page 26www.canarabank.com
BREAK-UP: NON-INTEREST INCOME
Parameters9M FY13 Mar’13 9M FY14
y.o.yGrowth
(%)
Non Int. Income 2146 3153 2863 33.4 Of which Com & Exchange 595 798 656 10.3 -Govt. Business 56 72 48 -14.3 -Bancassurance 28 43 26 -7.1Profit from Exch. Transactions 329 464 444 35.0Trading Profit 423 661 589 39.2Rent – Lockers 56 59 65 16.1Dividend Income 38 57 51 34.2
Recovery in W/Off A/cs 167 301 314 88.0Service Charges & Oth. Msc Inc 538 813 744 38.3
Amt. in ` Crore

Page 27www.canarabank.com
BREAK-UP : PROVISIONS- Q3FY14
Provisions for Q3 FY13
Q4 FY13 Q1 FY14 Q2 FY14 Q3 FY14
NPAs 594 346 443 347 543
Restructured Assets /Diminution in Fair value
45 156 193 (55) 25
Standard Assets 100 91 90 183 93
Provisions onInvestments
(129) 84 88 85 157
Tax 180 220 190 125 130
Others 17 76 102 114 233
Total Provision &Contingency
806 972 1106 799 1182
Amt. in ` Crore
Page 28www.canarabank.com
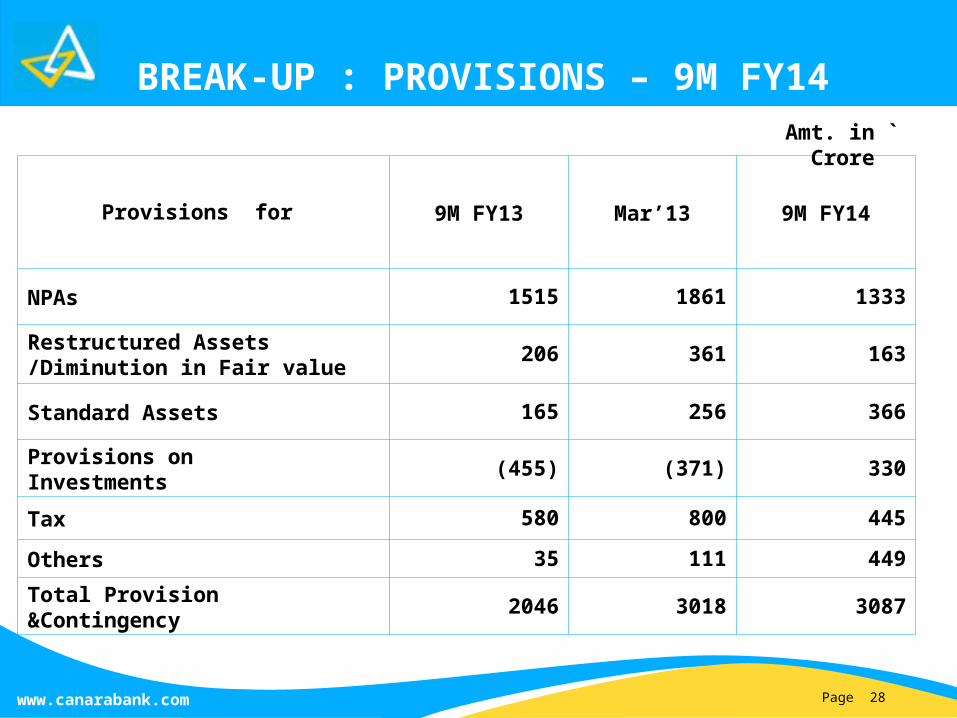
BREAK-UP : PROVISIONS – 9M FY14
Provisions for 9M FY13 Mar’13 9M FY14
NPAs 1515 1861 1333
Restructured Assets /Diminution in Fair value
206 361 163
Standard Assets 165 256 366
Provisions onInvestments
(455) (371) 330
Tax 580 800 445
Others 35 111 449
Total Provision &Contingency
2046 3018 3087
Amt. in ` Crore

Page 29www.canarabank.com
EARNINGS PROFILE
In %
Parameters Q3FY13 Q4FY13 Q1FY14 Q2FY14 Q3FY14
NIM 2.36 2.40 2.21 2.22 2.21
ROAA 0.82 0.77 0.75 0.58 0.37
EPS (`) (not Annualized) 16.04 16.37 17.88 14.13 9.24
Book Value (`) 486.55 490.56 509.48 524.94 518.61
ROE (Annualized) 14.04 14.03 14.21 12.51 10.81
Cost-Income Ratio (Cumulative) 47.17 46.61 41.22 46.34 47.0

Page 30www.canarabank.com
TREND IN COST AND YIELD (%)
Dec’12 Mar’13 Jun’13 Sep’13 Dec’13
Cost of Deposits 7.81 7.72 7.54 7.50 7.48
Cost of Funds 7.03 6.96 6.91 6.86 6.82
Yield on Advances 11.12 11.13 10.74 10.63 10.55
Yield on Funds 9.09 9.05 8.80 8.81 8.75
Yield on Investments 8.13 8.12 8.00 7.99 7.99
In %

Page 31www.canarabank.com
Investment classification
Parameters DEC’12% Share in Total Portfolio
MAR’13 DEC’13
% Share in Total Portfolio
SLR 102738 87 102003 112003 86Non SLR 15661 13 18700 18279 14Total (Domestic) 118399 100
120703 130282 100
Held For Trading 1250 1. 741 720 1Available For Sale 42041 36 47105 38704 30Held To Maturity 74967 63 72699 90105 69
M.DURATION 4.81 yrs --4.73
yrs4.65
yrs --
Total (Global) 118835 --12113
3 130359 --
Amt. in ` Crore

Page 32www.canarabank.com
ASSET
QUALITY

Page 33www.canarabank.com
ASSET QUALITY
Dec’12 Mar’13June’1
3Sep’13 Dec’13
Gross NPA 6090 6260 7329 7475 8074
Gross NPA Ratio (%) 2.77 2.57 2.91 2.64 2.79
Net NPA 5134 5278 6209 6459 6870
Net NPA Ratio (%) 2.35 2.18 2.48 2.30 2.39
Cash Recovery (cumulative) 2477 4006 888 1923 3135
Cash Recovery of ` 1212 crore during the Quarter
Amt. in ` Crore
Page 34www.canarabank.com
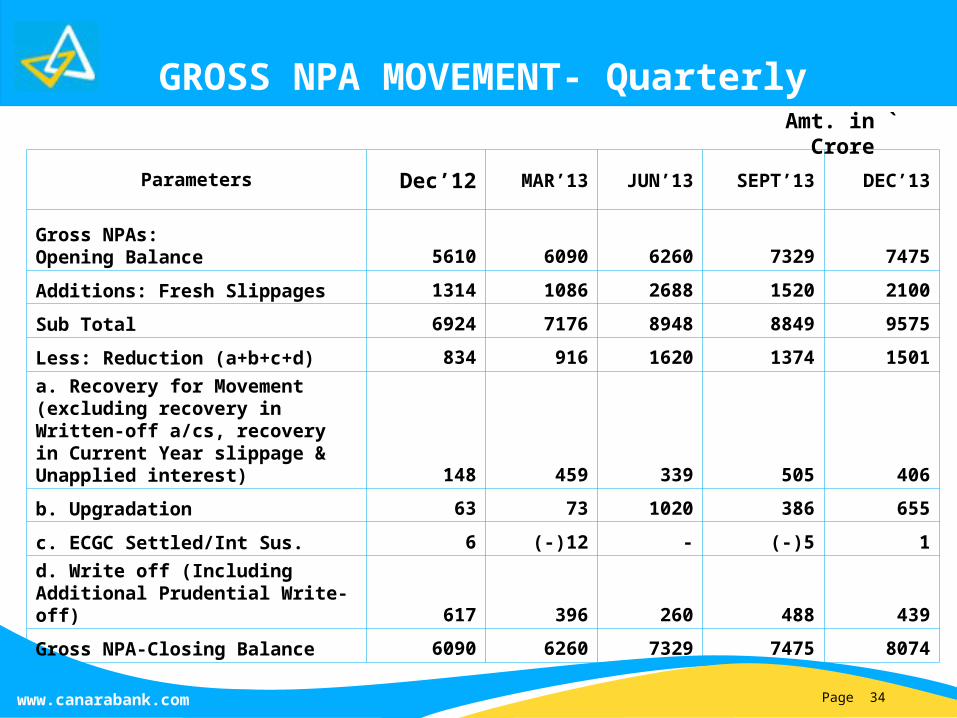
GROSS NPA MOVEMENT- Quarterly
Parameters Dec’12 MAR’13 JUN’13 SEPT’13 DEC’13
Gross NPAs: Opening Balance 5610 6090 6260 7329 7475
Additions: Fresh Slippages 1314 1086 2688 1520 2100
Sub Total 6924 7176 8948 8849 9575
Less: Reduction (a+b+c+d) 834 916 1620 1374 1501
a. Recovery for Movement (excluding recovery in Written-off a/cs, recovery in Current Year slippage & Unapplied interest) 148 459 339 505 406
b. Upgradation 63 73 1020 386 655
c. ECGC Settled/Int Sus. 6 (-)12 - (-)5 1
d. Write off (Including Additional Prudential Write-off) 617 396 260 488 439
Gross NPA-Closing Balance 6090 6260 7329 7475 8074
Amt. in ` Crore

Page 35www.canarabank.com
NPA COMPOSITION
Parameters Dec’12 MAR’13 JUN’13 SEPT’13 DEC’13
Gross Advances 219820 243936 251970 283024 289833
Sub-Standard 4189 4279 5178 4770 5211
Doubtful 1850 1932 2125 2705 2863
Loss 51 50 26 nil Nil
Provision CoverageRatio (%) 61.50 61.35 58.18 57.77 57.39
Amt. in ` Crore

Page 36www.canarabank.com
SECTORQ3
FY13
Q4
FY13 FY 13
Q1
FY14
Q2
FY14
Q3
FY14
% of Slippag
eMicro & Small Ent. 405 283 1210 278 278 288 14
Agriculture (33) 183 598 265 196 243 12Other Priority Sector (52) 104 440 184 116 125 6
Total Priority Sector 320 570
2248 727 590 656 31
Medium Industries 117 66 318 48 58 91 4
Large Industries 248 185 1304142
5 700 544 26
Other Non-Priority 622 199 1609 382 152 809 39Total Non-
Priority987 450
3231
1855 910
1444 69
Total (Domestic)130
7101
9547
9258
2150
0210
0
Overseas 7 60 340 106 20 -
Total (Global)131
4107
9581
9268
8152
0210
0
SECTOR-WISE NPA SLIPPAGES
Amt. in ` Crore
Page 37www.canarabank.com
SECTOR- WISE NPA OUTSTANDING
SECTOR Dec’12 Mar’13 Jun’13Sep’1
3Dec’13
Micro & Small Enterprises 1592 1532 1440162
5 1488
Agriculture 976 885 1000101
8 1016
Other Priority Segments 503 371 460 368 341
Medium Enterprises 340 345 324 402 379
Large Industries 1611 1521 2141314
6 3420
Other Non-Priority Segments 1068 1606 1964 916 1430
Total 6090 6260 7329747
5 8074
Amt. in ` Crore
Page 38www.canarabank.com
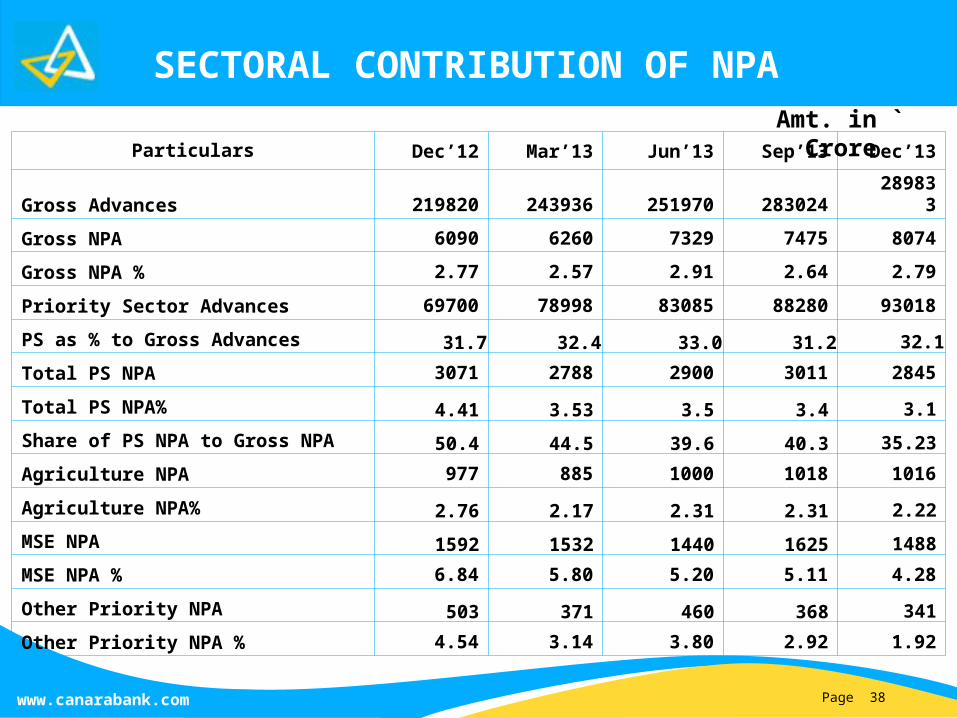
Particulars Dec’12 Mar’13 Jun’13 Sep’13 Dec’13
Gross Advances21982
024393
6 25197028302
428983
3
Gross NPA 6090 6260 7329 7475 8074
Gross NPA % 2.77 2.57 2.91 2.64 2.79
Priority Sector Advances 69700 78998 83085 88280 93018
PS as % to Gross Advances 31.7 32.4 33.0 31.2 32.1
Total PS NPA 3071 2788 2900 3011 2845
Total PS NPA% 4.41 3.53 3.5 3.4 3.1
Share of PS NPA to Gross NPA 50.4 44.5 39.6 40.3 35.23
Agriculture NPA 977 885 1000 1018 1016
Agriculture NPA% 2.76 2.17 2.31 2.31 2.22
MSE NPA 1592 1532 1440 1625 1488
MSE NPA % 6.84 5.80 5.20 5.11 4.28
Other Priority NPA 503 371 460 368 341
Other Priority NPA % 4.54 3.14 3.80 2.92 1.92
SECTORAL CONTRIBUTION OF NPA Amt. in ` Crore

Page 39www.canarabank.com
RESTRUCTURED ASSETSAmt. in `
CroreStandard Restructured Total
Restructured
Of Which Standard NPAs
A/C Amt A/C Amt A/C Amt A/C Restructured in FY 2009-10 1815 1312 1127 827 688 485
A/C Restructured in FY 2010-11 120 416 66 364 54 52
A/C Restructured in FY 2011-12 1746 3986 1462 3518 284 468
A/C Restructured in FY 2012-13 3845 11030 3627 10184 218 845
Total cumulative outstanding Liability as at 31.03.2013
20180 18113 13081 15901 7099 2212
A/C Restructured in Q1 FY2013-14 134 1683 125 1365 9 318
A/C Restructured in Q2 FY2013-14 3475 999 3416 973 59 26
A/C Restructured in Q3 FY2013-14 3086 3454 3032 3402 54 52
Total cumulative outstanding Liability as at 31.12.2013
29727 21728 17956 18450 11771 3278

Page 40www.canarabank.com
RESTRUCTURED ASSETS
SR.NO
DETAILS OF RESTRUCTUREDACCOUNTS
No. ofA/Cs
Amount1 Cr. & Above
No. ofAccount
s
Amount
1Total Restructured Assets as on 31.12.2013
29727 21728 746 20075
2Out of Which increase in Q3 FY14
3086 3454 57 3369
3
% of RestructuredAdvances/Portfolio to TotalLoans & Advances (as on 31.12.2013)
--7.46(%) -- --
4
-Of which Slippage into NPA-(% of Restructured Accounts)
--15.09
(%)
-- --
Amt. in ` Crore

Page 41www.canarabank.com
RESTRUCTURED ASSETS UNDER CDR
POSITION AS ON A/C Amount
DEC-2012 73 7570
MARCH-2013 78 9104
SEPT-2013 91 12932
DEC-2013 94 12185
Amt. in ` Crore

Page 42www.canarabank.com
SECTOR – WISE O/S RESTRUCTURED ACCOUNTS
SECTOR No. of Accounts Amount
Power 60 8193
Roads 24 741
Ports 2 123
Mining 39 32
Aviation 5 1047
Telecommunication 22 315Other services 9203 1849
Iron & steel 150 2491
Other industries 655 1204
Textile 605 2109
Amt. in ` Crore

Page 43www.canarabank.com
SECTOR No. of Accounts Amount
Engineering 383 674Real Estate 21 2Pharmaceuticals 38 212Cement 26 62Hardware 23 125Shipping 15 40Edible Oil 8 5Agriculture 9853 438Education 3499 83Housing 4870 243Chemicals 39 45Construction & Others 187 1698
TOTAL 29727 21728
SECTOR – WISE RESTRUCTURED ACCOUNTS Contd… Amt. in `
Crore
Page 44www.canarabank.com
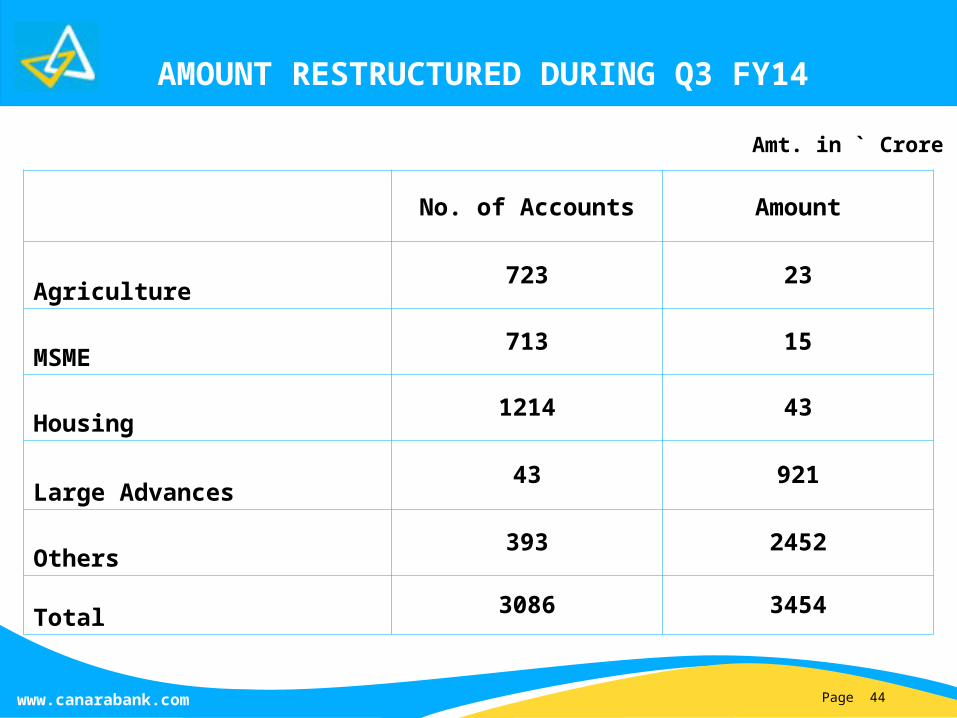
AMOUNT RESTRUCTURED DURING Q3 FY14
No. of Accounts Amount
Agriculture723 23
MSME713 15
Housing1214 43
Large Advances43 921
Others393 2452
Total 3086 3454
Amt. in ` Crore

Page 45www.canarabank.com
SECTOR WISE RESTRUCTURED ADVANCES OUTSTANDING
AS AT DECEMBER 2013
No. of Accounts Amount
Agriculture 9883 426
MSME 9531 604
Housing 8369 326
Large Advances 594 11424
Others 1350 8948
Total 29727 21728
Amt. in ` Crore

Page 46www.canarabank.com
CAPITAL ADEQUACY – NEW BASEL III NORMS
Capital Adequacy
Ratio
CRAR of 9.83% at DEC 2013 Vs. 9% norm
CET ratio at 7.13% Vs. 5% norm
Tier I ratio at 7.48% Vs . 6.5% norm
Tier II ratio at 2.35%
Govt. holding at 69%
Paid-up Capital at `461.26 crore
Reckoning 9 M profits, CRAR works out to
10.42%
Sufficient headroom available for raising further capital.` 500 crore capital infused by Govt. of India by way of
preferential allotment on 31.12.2013

Page 47www.canarabank.com
CAPITAL ADEQUACY – BASEL III
BASEL II BASEL IIIParticulars Mar'13 JUN’13 SEPT’13 DEC-13Risk-weighted Assets
243348 260699 273066 302533
Tier I Capital 23776 23260 23273 22609
Tier I Ratio%
9.77%
CET: 8.51%
AT I: 0.41%
Tier I: 8.92%
CET: 8.13 %
AT I: 0.39%
Tier I:8.52 %
CET: 7.13 %
AT I: 0.35%
Tier I:7.48%
Tier II Capital 6388 5762 5724 7097Tier II Ratio% 2.63% 2.21 2.10 2.35Total Capital 30164 29022 28997 29706CRAR% 12.40% 11.13% 10.62% 9.83%
Amt. in ` Crore

Page 48www.canarabank.com
SHAREHOLDING PATTERN
69.0
10.3
6.85.1 1.0
7.8
Govt of India FIIs
Insurance Companies Resident Individuals
Banks Others
As on DEC 31, 2013 Govt. 69
FIIs 10.33
Insurance Companies
6.84
Residents Individuals
5.06
Banks 0.97
Others 7.8

Page 49www.canarabank.com
FINANCIAL INCLUSION
Holistic Approac
h to Financi
al Inclusio
n
Under more than 2000 population category, the Bank has covered all the allotted 1624 villages in 24 states. Under less than 2000 population category, the Bank has covered 1544 villages out of the allotted 3794 villages.
Out of the total 466 branches opened in unbanked villages, 191 of them are opened in this financial year, garnering a total business of `200 crore.
Of the 542 USBs opened in more than 2000 population category, 25 have been upgraded to branches.
Basic Savings Bank (BSB) accounts increased to 81.43 lakh, with outstanding deposit balance of `1431 crore. In built OD facility provided to 2.49 lakh BSB a/c holders to the extent of around `97 crore.
Exposure under Self-Help Groups (SHGs) is `1406 crore under 81,322 SHG a/cs.

Page 50www.canarabank.com
FINANCIAL INCLUSION
Holistic Approac
h to Financi
al Inclusio
n
Exposure under General Credit Cards is `804 crore under 3.76 lakh accounts.
60 Financial Literacy Centres, 460 Farmers Clubs and 20 Micro Finance Branches operational as at December 2013.
A new Scheme “Canara Gramodaya” launched for holistic development of select 60 villages and 3 slums adopted by the Bank for this year. The Scheme aims at bringing socio, cultural and economic change through credit and non-credit support.
In the 121 DBT Districts, the Bank’s branches received details of 122322 beneficiaries from District Administration and opened 122322 accounts (100%). Aadhaar seeding has been done in 95162 accounts (99.98%), out of the 95181 beneficiaries’ details received .
Lead District Waynad reached 89% Aadhaar seeding under DBTL and is No. 1 District among 20 Districts in Phase 1.

Page 51www.canarabank.com
NEW PRODUCTS/PROCESSES
Canara Club Cards and EMV Cards.
Facility of hot listing of Debit Card through Net Banking.
Cash Withdrawal in ATMs by two Joint Holders of account operated jointly.
Mobile Banking registration through Net Banking and Mobile Banking activation through ATM.
Increased the Fund transfer limit per day per Net Banking Corporate Customer from Rs.50 lakh to Rs.1 Crore.
Central Processing Centres (CPC) enabled for Net Banking Retail User creation and Mobile Banking registration.
Request for cheque book through ATM, Net Banking & Mobile Banking.
New Products/Schemes

Page 52www.canarabank.com
NEW PRODUCTS/PROCESSES
Fund Transfer through IMPS using MPIN and beneficiary mobile number (or) Using IFSC Code and beneficiary Account Number under Net Banking.
CANSECURE made optional to Retail Banking Customers.
Facility of registration and verification of Aadhaar number has been provided to customers through 5 channels, viz., SMS, Mobile Banking, Internet Banking, Call Centre and Website.
Customer Service Centres (CSC) for financial inclusion services through Kiosk facility implemented in Akshaya Centres in Kerala.
Call Centre services extended to 24x7.
Cheque Truncation System implemented in 12 Centres of Western Grid.
Next generation RTGS implemented.
Biometric authentication for login to CBS system by staff implemented in more than 1000 branches.
New Products/Schemes

Page 53www.canarabank.com
EXPANDED CLIENTELE BASE
5.39 Crore
Strong Cliente
le Base
DEC’12 Mar’13 DEC’13Y-o-Y
Increase
Clientele Base 455.19 470.44 538.72 83.53
No. of Deposit A/Cs 404.61 417.22 475.93 71.32
No. of Borrowal A/Cs 50.58 53.22 62.79 12.20
83.53 lakhs Clientele added Y-o-Y
(In Lakhs)

Page 54www.canarabank.com
MAJOR EVENTS
Celebrating 108th Founder’s Day on 19th Nov 2013 by dedicating 108 branches and 108 ATMs to the nation, inaugurated by Hon’ble Chief Minister of Karnataka, Shri Siddaramaiah in the presence of Shri K.H. Muniyappa, Hon'ble Union Minister of State (MSME-Independent Charge)

Page 55www.canarabank.com
AWARDS/ACCOLADESGolden Peacock Award for excellence in Corporate Social Responsibility for the year 2013.
Skoch Renaissance Award with a Medal and Citation for being India's Best-2013.
Green Tech Award for excellence in CSR for the year 2013.
‘Jury Award for New Initiatives under MSME’ instituted by Chamber of Indian MSME under Banking Excellence Awards 2013.
Best Bank Award for implementation of Rural Self Employment Training Institutes for the second consecutive year by the Ministry of Rural Development, Govt. of India. Award under Category l & Category II for two of its exclusive RSETIs at Hassan (Karnataka) and Tiruppur (TN) as best performing RSETIs. 5 of the 27 RUDSETIs co-sponsored by the Bank awarded as best performing RUDSETIs.
‘Top Performer in New Demat Accounts Opened’ in banking sector by National Securities Depository Ltd., (NSDL) for the year 2013.

Page 56www.canarabank.com
GOALS FOR FUTURE
Aims to reach an aggregate business figure of more than ` 7 lakh crore, with deposit growth of 17%+ and advances growth of 21%+.
To take the number of branches to 5500 plus and number of ATMs to 10000 by March 2015.
Open 4 branches at Johannesburg (South Africa, License already received), Dar-es-Salaam (Tanzania), Frankfurt (Germany), DIFC (Dubai) in coming six months and remaining 10 branches at New York (USA), Sao Paulo (Brazil), Tokyo (Japan), Abuja (Nigeria), Jeddah (Saudi Arabia), Qatar Financial Centre (Qatar), Sydney (Australia), Ontario (Canada), Wellington (New Zealand) and Singapore by March 2015.
PLANS

Page 57www.canarabank.com
GOALS FOR FUTURE
Thrust on Retail Business- CASA, recovery, fee income, retail credit.
Technology and business process reengineering.
Thrust on improving operational financial ratios, such as, NIM, RoA, RoE and Cost-to-Income
Project ‘Shikhar’ aimed at rejuvenating the Bank by focusing on several themes like energizing branches and customer service, increasing sales from branches, growing a robust asset base and revamping the operating model is in progress. Global Management Consulting firm viz., M/s Boston Consulting Group (India) Private Limited (BCG) is assisting the Bank in this transformation journey.
PLANS

Page 58www.canarabank.com