
Overview of the Manitoba Biogenic Aerosol Experiment
63
ACPD 14, 1647–1709, 2014 Overview of the Manitou Experimental Forest Observatory J. Ortega et al. Title Page Abstract Introduction Conclusions References Tables Figures Back Close Full Screen / Esc Printer-friendly Version Interactive Discussion Discussion Paper | Discussion Paper | Discussion Paper | Discussion Paper | Atmos. Chem. Phys. Discuss., 14, 1647–1709, 2014 www.atmos-chem-phys-discuss.net/14/1647/2014/ doi:10.5194/acpd-14-1647-2014 © Author(s) 2014. CC Attribution 3.0 License. Atmospheric Chemistry and Physics Open Access Discussions This discussion paper is/has been under review for the journal Atmospheric Chemistry and Physics (ACP). Please refer to the corresponding final paper in ACP if available. Overview of the Manitou Experimental Forest Observatory: site description and selected science results from 2008–2013 J. Ortega 1 , A. Turnipseed 1 , A. B. Guenther 1,a , T. G. Karl 1,b , D. A. Day 2 , D. Gochis 1 , J. A. Huffman 3,4 , A. J. Prenni 5 , E. J. T. Levin 5 , S. M. Kreidenweis 5 , P. J. DeMott 5 , Y. Tobo 5 , E. G. Patton 1 , A. Hodzic 1 , Y. Cui 6 , P. C. Harley 1,c , R. H. Hornbrook 1 , E. C. Apel 1 , R. K. Monson 7 , A. S. D. Eller 8,d , J. P. Greenberg 1 , M. Barth 1 , P. Campuzano-Jost 2 , B. B. Palm 2 , J. L. Jimenez 2 , A. C. Aiken 9 , M. K. Dubey 9 , C. Geron 10 , J. Offenberg 11 , M. G. Ryan 12,13 , P. J. Fornwalt 13 , S. C. Pryor 14 , F. N. Keutsch 15 , J. P. DiGangi 15,e , A. W. H. Chan 16,f , A. H. Goldstein 16,17 , G. M. Wolfe 18,19 , S. Kim 1,g , L. Kaser 20,h , R. Schnitzhofer 20 , A. Hansel 20 , C. A. Cantrell 1,i , R. L. Mauldin III 1,i , and J. N. Smith 1 1 National Center for Atmospheric Research, P.O. Box 3000, Boulder, CO 80307, USA 2 Department of Chemistry and Biochemistry and Cooperative Institute for Research in the Environmental Sciences (CIRES), University of Colorado, Boulder, CO 80309, USA 3 Max Planck Institute for Chemistry, P.O. Box 3060, 55020, Mainz, Germany 4 University of Denver, Department of Chemistry & Biochemistry, Denver, CO 80208, USA 5 Department of Atmospheric Science, Colorado State University, Fort Collins, CO 80523, USA 1647
Transcript of Overview of the Manitoba Biogenic Aerosol Experiment

ACPD14 1647ndash1709 2014
Overview of theManitou
Experimental ForestObservatory
J Ortega et al
Title Page
Abstract Introduction
Conclusions References
Tables Figures
J I
J I
Back Close
Full Screen Esc
Printer-friendly Version
Interactive Discussion
Discussion
Paper
|D
iscussionP
aper|
Discussion
Paper
|D
iscussionP
aper|
Atmos Chem Phys Discuss 14 1647ndash1709 2014wwwatmos-chem-phys-discussnet1416472014doi105194acpd-14-1647-2014copy Author(s) 2014 CC Attribution 30 License
Atmospheric Chemistry
and Physics
Open A
ccess
Discussions
This discussion paper ishas been under review for the journal Atmospheric Chemistryand Physics (ACP) Please refer to the corresponding final paper in ACP if available
Overview of the Manitou ExperimentalForest Observatory site description andselected science results from 2008ndash2013J Ortega1 A Turnipseed1 A B Guenther1a T G Karl1b D A Day2D Gochis1 J A Huffman34 A J Prenni5 E J T Levin5 S M Kreidenweis5P J DeMott5 Y Tobo5 E G Patton1 A Hodzic1 Y Cui6 P C Harley1c RH Hornbrook1 E C Apel1 R K Monson7 A S D Eller8d J P Greenberg1M Barth1 P Campuzano-Jost2 B B Palm2 J L Jimenez2 A C Aiken9M K Dubey9 C Geron10 J Offenberg11 M G Ryan1213 P J Fornwalt13S C Pryor14 F N Keutsch15 J P DiGangi15e A W H Chan16fA H Goldstein1617 G M Wolfe1819 S Kim1g L Kaser20h R Schnitzhofer20A Hansel20 C A Cantrell1i R L Mauldin III1i and J N Smith1
1National Center for Atmospheric Research PO Box 3000 Boulder CO 80307 USA2Department of Chemistry and Biochemistry and Cooperative Institute for Research in theEnvironmental Sciences (CIRES) University of Colorado Boulder CO 80309 USA3Max Planck Institute for Chemistry PO Box 3060 55020 Mainz Germany4University of Denver Department of Chemistry amp Biochemistry Denver CO 80208 USA5Department of Atmospheric Science Colorado State University Fort Collins CO 80523 USA
1647
ACPD14 1647ndash1709 2014
Overview of theManitou
Experimental ForestObservatory
J Ortega et al
Title Page
Abstract Introduction
Conclusions References
Tables Figures
J I
J I
Back Close
Full Screen Esc
Printer-friendly Version
Interactive Discussion
Discussion
Paper
|D
iscussionP
aper|
Discussion
Paper
|D
iscussionP
aper|
6Department of Earth and Atmospheric Sciences Saint Louis University MO 63103 USA7School of Natural Resources and the Environment and Laboratory for Tree Ring ResearchUniversity of Arizona Tucson AZ 85721 USA8Cooperative Institute for Research in Environmental Sciences (CIRES) University ofColorado Boulder CO 80309 USA9Los Alamos National Laboratory Earth and Environmental Sciences Division Los AlamosNM 87545 USA10United States Environmental Protection Agency Office of Research and DevelopmentNational Risk Management Research Laboratory Air pollution Prevention and ControlDivision Research Triangle Park NC 27711 USA11United States Environmental Protection Agency Office of Research and DevelopmentNational Exposure Research Laboratory Research Triangle Park NC 27711 USA12National Resource Ecology Laboratory Colorado State University Fort Collins CO 80523USA13United States Department of Agriculture Forest Service Rocky Mountain Research Station240 West Prospect Rd Fort Collins CO 80526 USA14Department of Geological Sciences Indiana University Bloomington IN 47405 USA15Department of Chemistry University of Wisconsin Madison WI 53706 USA16Department of Environmental Science Policy and Management University of CaliforniaBerkeley CA 94720 USA17Department of Civil and Environmental Engineering University of California Berkeley CA94720 USA18Atmospheric Chemistry and Dynamics Laboratory NASA Goddard Space Flight Center8800 Greenbelt Road Greenbelt MD 20771 USA19Joint Center for Earth Systems Technology University of Maryland Baltimore CountyBaltimore MD 21250 USA20Institute for Ion Physics and Applied Physics University of Innsbruck Innsbruck Austriaanow at Pacific Northwest National Laboratory Atmospheric Sciences amp Global ChangeDivision PO Box 999 Richland WA 99352 USAbnow at University of Innsbruck Institute for Meteorology and Geophysics (IMGI) Innrain 526020 Innsbruck Austria
1648
ACPD14 1647ndash1709 2014
Overview of theManitou
Experimental ForestObservatory
J Ortega et al
Title Page
Abstract Introduction
Conclusions References
Tables Figures
J I
J I
Back Close
Full Screen Esc
Printer-friendly Version
Interactive Discussion
Discussion
Paper
|D
iscussionP
aper|
Discussion
Paper
|D
iscussionP
aper|
cnow at Department of Plant Physiology Estonian University of Life Sciences Tartu 51014Estoniadnow at Department of Biological Sciences Macquarie University Sydney NSW 2109Australiaenow at Department of Civil and Environmental Engineering Princeton University PrincetonNJ 08544 USAfnow at Department of Chemical Engineering and Applied Chemistry University of TorontoCanadagnow at Department of Earth System Science University of California Irvine Irvine CA92697 USAhnow at National Center for Atmospheric Research PO Box 3000 Boulder CO 80307 USAinow at Department of Atmospheric and Oceanic Sciences University of Colorado BoulderCO 80309 USA
Received 23 November 2013 ndash Accepted 18 December 2013 ndash Published 20 January 2014
Correspondence to J N Smith (jimsmithucaredu)
Published by Copernicus Publications on behalf of the European Geosciences Union
1649
ACPD14 1647ndash1709 2014
Overview of theManitou
Experimental ForestObservatory
J Ortega et al
Title Page
Abstract Introduction
Conclusions References
Tables Figures
J I
J I
Back Close
Full Screen Esc
Printer-friendly Version
Interactive Discussion
Discussion
Paper
|D
iscussionP
aper|
Discussion
Paper
|D
iscussionP
aper|
Abstract
The Bio-hydro-atmosphere interactions of Energy Aerosols Carbon H2O Organ-ics amp Nitrogen (BEACHON) project seeks to understand the feedbacks and inter-relationships between hydrology biogenic emissions carbon assimilation aerosolproperties clouds and associated feedbacks within water-limited ecosystems The5
Manitou Experimental Forest Observatory (MEFO) was established in 2008 by the Na-tional Center for Atmospheric Research to address many of the BEACHON researchobjectives and it now provides a fixed field site with significant infrastructure MEFO isa mountainous semi-arid ponderosa pine-dominated forest site that is normally domi-nated by clean continental air but is periodically influenced by anthropogenic sources10
from Colorado Front Range cities This article summarizes the past and ongoing re-search activities at the site and highlights some of the significant findings that haveresulted from these measurements These activities include
ndash soil property measurements
ndash hydrological studies15
ndash measurements of high-frequency turbulence parameters
ndash eddy covariance flux measurements of water energy aerosols and carbon dioxidethrough the canopy
ndash biogenic and anthropogenic volatile organic compound emissions and their influ-ence on regional atmospheric chemistry20
ndash aerosol number and mass distributions
ndash chemical speciation of aerosol particles
ndash characterization of ice and cloud condensation nuclei
ndash trace gas measurements and1650
ACPD14 1647ndash1709 2014
Overview of theManitou
Experimental ForestObservatory
J Ortega et al
Title Page
Abstract Introduction
Conclusions References
Tables Figures
J I
J I
Back Close
Full Screen Esc
Printer-friendly Version
Interactive Discussion
Discussion
Paper
|D
iscussionP
aper|
Discussion
Paper
|D
iscussionP
aper|
ndash model simulations using coupled chemistry and meteorology
In addition to various long-term continuous measurement three focused measurementcampaigns with state-of-the-art instrumentation have taken place since the site wasestablished and two of these are the subjects of this special issue BEACHON-ROCS(Rocky Mountain Organic Carbon Study 2010) and BEACHON-RoMBAS (Rocky5
Mountain Biogenic Aerosol Study 2011)
1 Introduction
11 Motivation
Development of Earth-System models is driven by the need to improve the predictabil-ity of atmospheric chemical and physical processes over time scales ranging from10
minutes to decades Accurate model predictions are critically contingent on process-level understanding and detailed numerical descriptions of the coupling between wa-ter energy and biogeochemical cycles across temporal and spatial scales (Denmanet al 2007 Alo and Wang 2008 Heald et al 2009) A number of studies have dis-cussed some of these processes and associated feedbacks (eg Barth et al 200515
Carslaw et al 2010 Mahowald et al 2011) but more detailed observations and co-ordinated modeling efforts are required for improved representation in Earth-Systemmodels
The Bio-hydro-atmosphere interactions of Energy Aerosols Carbon H2O Organicsamp Nitrogen (BEACHON) project was initiated by the National Center for Atmospheric20
Research (NCAR) as well as collaborators from the University of Colorado and Col-orado State University to investigate ecosystem-atmosphere exchange of trace gasesand aerosols and their potential feedbacks between biogeochemical and water cyclesBEACHON is now an ongoing component of atmospheric research sponsored by theNational Science Foundation This interdisciplinary research program integrates local25
and regional model simulations with remote sensing regional network observations1651
ACPD14 1647ndash1709 2014
Overview of theManitou
Experimental ForestObservatory
J Ortega et al
Title Page
Abstract Introduction
Conclusions References
Tables Figures
J I
J I
Back Close
Full Screen Esc
Printer-friendly Version
Interactive Discussion
Discussion
Paper
|D
iscussionP
aper|
Discussion
Paper
|D
iscussionP
aper|
and canopy- to regional-scale field measurements BEACHON includes investigationsof atmospheric ecological and hydrological processes including concentration and fluxmeasurements of energy CO2 H2O volatile organic compounds aerosols nitrogencompounds hydrological parameters and feedback processes that are relevant to at-mospheric chemistry Rocky Mountain ecosystems are important for providing water5
and other resources in the western United States but contain only a limited numberof long-term monitoring sites This region is predominantly arid or semi-arid result-ing in biogeochemical cycles that are water-limited Since the area contains some ofthe fastest growing population centers water limitations (combined with a climate thatis projected to be warmer and potentially drier) pose significant societal vulnerabil-10
ities (Vorosmarty et al 2010) The regionrsquos remote complex terrain leads to highlyvariable ecosystem characteristics and it is unclear how this variability affects hydro-logical and atmospheric processes across larger geographical areas The need forlong-term land-ecosystem-atmosphere observation networks has been identified byinternational research programs as a key need for advancing Earth System science15
(Guenther et al 2011)To address these challenges the BEACHON project in collaboration with the United
States Department of Agriculture (USDA) Forest Service established the Manitou Ex-perimental Forest Observatory (MEFO) in 2008 in an area representative of a middle-elevation (sim 2000ndash2500 masl) semi-arid ponderosa pine ecosystem that is common20
throughout the Rocky Mountain West but not adequately characterized The BEA-CHON project and establishment of this site were designed to meet the following ob-jectives
ndash collect long-term measurements of meteorology water carbon dioxide (CO2) andenergy fluxes aerosol size distributions and fluxes trace gas and cloud conden-25
sation nuclei concentrations
ndash monitor soil moisture precipitation snowpack stable water isotopes and otherhydrological variables to provide input and lateral boundary conditions for Earth-
1652
ACPD14 1647ndash1709 2014
Overview of theManitou
Experimental ForestObservatory
J Ortega et al
Title Page
Abstract Introduction
Conclusions References
Tables Figures
J I
J I
Back Close
Full Screen Esc
Printer-friendly Version
Interactive Discussion
Discussion
Paper
|D
iscussionP
aper|
Discussion
Paper
|D
iscussionP
aper|
System models and as a basis for making more accurate water resource predic-tions for this and other semi-arid regions
ndash provide infrastructure for collaborative research among government laboratoriesuniversities and private companies
ndash carry out intensive measurement campaigns5
ndash provide training for undergraduate and graduate students and promote multidisci-plinary research
This article describes the Manitou Experimental Forest Observatory presents on-goingresearch at the site and highlights some initial findings More specific scientific resultsand publications can be found in the publication list (Table S2) and within the individual10
articles as part of this special issue of Atmospheric Chemistry and Physics
12 Site description and meteorological overview
The Manitou Experimental Forest (391006 N 1050942 W Fig 1a and b) in theFront Range of the Colorado Rocky Mountains has been managed as a research fa-cility by the USDA Forest Servicersquos Rocky Mountain Research Station since 1938 It15
contains approximately 6760 ha and exemplifies the Colorado Front Range wildland-urban interface where semi-arid montane forest ecosystems are in close proximity tolarger urban population centers These interface areas which also contain a numberof small residential communities are prone to wild fires from lightning as well as hu-man causes Two particularly large nearby fires (the 560 km2 Hayman fire in 2002 and20
the 74 km2 Waldo Canyon Fire in 2012) were among the most ecologically and eco-nomically damaging in the statersquos history Although the primary study areas were notburned during these two fires areas within several km to the south and west of the sitewere affected by the 2002 fire The landscape has thus been dramatically affected inboth appearance and in the vegetationrsquos ability to slow soil erosion from surface run-25
off during monsoon rains Fire-damaged portions of the forest can change aspects of1653
ACPD14 1647ndash1709 2014
Overview of theManitou
Experimental ForestObservatory
J Ortega et al
Title Page
Abstract Introduction
Conclusions References
Tables Figures
J I
J I
Back Close
Full Screen Esc
Printer-friendly Version
Interactive Discussion
Discussion
Paper
|D
iscussionP
aper|
Discussion
Paper
|D
iscussionP
aper|
the atmospheric chemistry measured at the site through changes in gas- and aerosol-phase emissions from nearby fire-scarred vegetation and soil Wildfires are ubiquitousin the semi-arid forested American West of which this area can be considered repre-sentative
The Manitou Experimental Forestrsquos elevation ranges from 2280 to 2840 masl and5
vegetation is primarily composed of forests of ponderosa pine Douglas-fir mixedconifer and aspen The forest stands surrounding the observatory are relatively younguneven-aged stands dominated by ponderosa pine (Sect 13) Leaf area index (LAI)measurements from representative trees resulted in a value of 30 The fractional cov-erage of the ponderosa pine surrounding the observatory is 038 resulting in an effec-10
tive leaf area index for the site of 114 and average canopy height of 185 m In 2009core samples from a survey of 38 representative ponderosa pine showed that the me-dian tree age was 495 yr (with average minimum and maximum ages of 625 27and 201 yr respectively) Soils are mostly derived from weathered granite are poorlydeveloped and prone to erosion The National Weather Service has been monitoring15
precipitation at MEF since 1940 (Station Woodland Park 8 NNW Coop ID 059210)and US Forest Service staff have been collecting meteorological data including air andsoil temperature precipitation and wind speed since 1998 These data indicate that theclimate is cool (mean temperature is 19 C in July and minus2 C in January) and dry with anaverage annual precipitation for 2010ndash2013 of 4305 mm (1694 inches) Approximately20
50 of the precipitation falls as rain during the summer season (JunendashSeptember) pri-marily during afternoon thunderstorms characterized by brief but intense periods ofrainfall and lightning Winter snowfall is typically light and a persistent snowpack rarelydevelops
Numerous studies have been conducted here by researchers from a wide range25
of federal agencies academic institutions and non-governmental organizations Earlyresearch focused on range management including re-vegetation of abandoned fieldsgrazing management in native and seeded pastures watershed management in gullycontrol stream sedimentation surface runoff bacterial pollution and infiltration (Gary
1654
ACPD14 1647ndash1709 2014
Overview of theManitou
Experimental ForestObservatory
J Ortega et al
Title Page
Abstract Introduction
Conclusions References
Tables Figures
J I
J I
Back Close
Full Screen Esc
Printer-friendly Version
Interactive Discussion
Discussion
Paper
|D
iscussionP
aper|
Discussion
Paper
|D
iscussionP
aper|
et al 1985) Recent research is more diverse and includes a long-term (gt 30 yr) studyon the flammulated owl (Linkhart et al 2006 2007) studies assessing the impactsof forest restoration and fuel reduction techniques (Battaglia et al 2010 Massmanet al 2010 Rhoades et al 2012) silviculture studies (Lezberg et al 2008) and wild-fire recovery studies (Fornwalt et al 2010) Additional information about the site (in-5
cluding long-term weather tree growth data and a bibliography of publications) can befound at httpwwwfsusdagovmanitou
13 Measurements at the Manitou Experimental Forest Observatory (MEFO)under the auspices of BEACHON
In 2008 with cooperation with the USDA Forest Service NCAR established the in-10
frastructure at the site and named it the Manitou Experimental Forest Observatory(MEFO) The site includes four (4) mobile steel containers each having 160 ft2 of lab-oratory floor space numerous sampling ports temperature-control and 20 kW powerTwo research towers that extend through the canopy were constructed approximately300 m apart (Fig 1c) and are referred to here as the micrometeorology and chemistry15
towers Detailed information on these towersrsquo measurements is listed in Table S1 inthe Supplement A third smaller eddy-covariance measurement tower was deployedin a large clearing or ldquoforest gaprdquo from 2011ndash2012 The purpose of this smaller towerwas to make 4-way radiation measurements surface skin temperature and sensibleand latent heat flux measurements over the grass and forb vegetation that is found be-20
neath and in between the ponderosa pine These measurements were taken at 1 and3 magl
The micrometeorology tower (Fig 1e) is a narrow 45 m triangular tower (Rohn 45G425 mm per side) designed to facilitate the analysis of the impact of canopy elements(needles branches trunks) on turbulent exchange between the surface canopy layers25
and the overlying atmosphere This tower has instruments deployed at six different lev-els (2 8 16 22 30 and 43 m) thus allowing several measurements within and abovethe canopy (average canopy height asymp 185 m) The 22 m level contains a 4-component
1655
ACPD14 1647ndash1709 2014
Overview of theManitou
Experimental ForestObservatory
J Ortega et al
Title Page
Abstract Introduction
Conclusions References
Tables Figures
J I
J I
Back Close
Full Screen Esc
Printer-friendly Version
Interactive Discussion
Discussion
Paper
|D
iscussionP
aper|
Discussion
Paper
|D
iscussionP
aper|
Kipp and Zonen CNR1 radiometer for measuring above-canopy incoming and outgoingshortwave and longwave radiation Instrumentation on the other five levels include
ndash Campbell-Scientific CSAT3 sonic anemometers to record the three orthogonalwind velocity components and temperature fluctuations
ndash NCAR-Vaisala aspirated hygrothermometers to measure absolute temperature5
and relative humidity
ndash LI-COR open-path infrared gas analyzers to measure water vapor and carbondioxide
The instruments on the micrometeorology tower operated nearly continuously fromJuly 2009 until July 2012 when they were removed as a precaution due the proximity10
of the Waldo Canyon Fire This multi-season dataset is being used to
ndash quantify the importance of canopy-induced modifications to turbulence in predict-ing whole-ecosystem exchange in regional and global climate models
ndash partition water fluxes into transpiration and evaporation components and
ndash investigate impacts of spatially heterogeneous canopy distributions on evapotran-15
spiration using additional information from the chemistry and understory towers
The chemistry tower is a 28 m walk-up type tower that is equipped with meteorologi-cal sensors as well as a variety of flux and gradient concentration measurements forgasses and aerosols (Fig 1d) The platform on each level is 178mtimes127 m and is suit-able for heavier instruments that require more space power and maintenance It can20
also support gradient sampling systems which can move vertically along the towerThis tower is equipped with 2-D and 3-D sonic anemometers temperature and ra-diation probes for continuous meteorological measurements and for calculating fluxesusing the closed-path eddy covariance method Other continuous gas-phase measure-ments from this tower include CO CO2 H2O vapor NO NO2 and SO225
1656
ACPD14 1647ndash1709 2014
Overview of theManitou
Experimental ForestObservatory
J Ortega et al
Title Page
Abstract Introduction
Conclusions References
Tables Figures
J I
J I
Back Close
Full Screen Esc
Printer-friendly Version
Interactive Discussion
Discussion
Paper
|D
iscussionP
aper|
Discussion
Paper
|D
iscussionP
aper|
Measurements from ponderosa pine (the primary vegetation) include leaf- andbranch-level photosynthesis respiration and biogenic volatile organic compound(BVOC) emissions as well as sap flow using the compensation heat pulse methodas described by Burgess et al (2001) A suite of hydrological measurements for totalprecipitation soil moisture leaf wetness and snow depth have been measured nearly5
continuously since 2009 Aerosol measurements include two years of particle size dis-tributions from 4 nm to 2 microm and 1 yr of CCN (cloud condensation nuclei) data during2010ndash2011 measured from one of the 4 mobile laboratories adjacent to the chem-istry tower (Fig 1d) An additional month of CCN measurements was made abovethe canopy (25 m above ground) from the chemistry tower (Levin et al 2012) Two10
large field campaigns were conducted during the summers of 2010 and 2011 Theformer was BEACHON ROCS (Rocky Mountain Organics Study) and the latter wasBEACHON RoMBAS (Rocky Mountain Biogenic Aerosol Study) Selected results fromthese two campaigns as well as the initial 2008 Southern Rocky Mountain (SRM) studyare discussed in this article and are summarized in Sect 5 A more detailed summary15
of measurements at MEFO can be found in Table S1 in the Supplement Long-term orcampaign-specific data is available upon request
14 Meteorology at Manitou Experimental Forest Observatory
Due to the arearsquos complex topography wind patterns are influenced by multiple factorsranging from small-scale elevation gradients to regional-scale topographically-induced20
flows The observatory lies within a north-south drainage (draining to the north) leadingto the formation of local mountain-valley flows Nighttime flow above the canopy (28 m)is dominated by drainage from the south as can be seen in Fig 2b (Summer) and f(Winter) Winds below the canopy are often westerly or southwesterly due to drainageflow from surrounding ridgelines (Fig 2d) This height-dependent nocturnal pattern is25
dominant in all seasons Daytime flows are much more variable Although there is oftena southerly flow during the day other wind directions are also prevalent When synop-tic winds are strong (as during the winter) there is a higher frequency of westerly and
1657
ACPD14 1647ndash1709 2014
Overview of theManitou
Experimental ForestObservatory
J Ortega et al
Title Page
Abstract Introduction
Conclusions References
Tables Figures
J I
J I
Back Close
Full Screen Esc
Printer-friendly Version
Interactive Discussion
Discussion
Paper
|D
iscussionP
aper|
Discussion
Paper
|D
iscussionP
aper|
southwesterly flow (Fig 2e) These conditions tend to bring relatively unpolluted air tothe site as there is little anthropogenic influence to the west During periods when morestagnant high pressure encompasses the region locally-induced upslope flow from ei-ther the northeast or southeast becomes apparent Below the canopy these upslopeflows are consistently observed during daylight hours (Fig 2c) These periods are im-5
portant in understanding the local chemistry as these flows transport air from FrontRange cities (mainly Denver and Colorado Springs) Figure 3 shows two consecutivedays during August 2010 that exemplify these typical patterns Higher concentrationsof NOx (NO+NO2) and O3 accompany the upslope flow from the northeast on 14 Au-gust whereas much lower concentrations are observed during the southwesterly flow10
the next day (15 August) Regardless of the daytime wind patterns southerly drainageflow usually develops soon after the daytime heating ceases and the more stable noc-turnal boundary layer develops which is often accompanied by a NOx increase Windmeasurements as well as modeling results suggest that this is often due to air from theDenver area enhancing the total NOx in the region during daytime upslope flow which15
then drains towards the north and past the site at night However NOx concentrationsoften increase at night even without any upslope flow (Fry et al 2013) Some of thisincrease can be explained by the suppressed nocturnal boundary layer but there arestill other NOx sources under investigation that also contribute to these enhancementsNocturnal gradients of NOx measured along the Chemistry tower show vary little vari-20
ation (see Fig 3b) which indicates that soil NOx emissions are not significant
2 Footprint hydrology in a water-limited ecosystem
21 Overview of hydrological measurements
Intensive hydrological measurements of total precipitation (rain and snow) soil mois-ture and snow depth as well as soil temperatures have been collected at the MEFO25
since the summer of 2009 These complement the vertical flux measurements of water
1658
ACPD14 1647ndash1709 2014
Overview of theManitou
Experimental ForestObservatory
J Ortega et al
Title Page
Abstract Introduction
Conclusions References
Tables Figures
J I
J I
Back Close
Full Screen Esc
Printer-friendly Version
Interactive Discussion
Discussion
Paper
|D
iscussionP
aper|
Discussion
Paper
|D
iscussionP
aper|
vapor for a complete accounting of the sitersquos water budget The precipitation mea-surements augment the long-term records maintained by the USDA Forest Servicementioned in Sect 12 A network of 11 tipping bucket rain gauges as well as an alter-shielded weighing-type total precipitation gauge provide high time resolution year-round precipitation measurements in a network distributed within the chemistry tower5
footprint in order to characterize the high spatial variability of precipitation More detailsabout these measurements are given in Table S1 The 2010ndash2013 annual accumula-tion of hourly precipitation is shown in Fig 4a These time series are bias-correctedmerged data products between the sitersquos sensors in order to cover periodic data gapsThe sitersquos annual precipitation measurements for a given year are defined by an end10
date of 30 September of that year and a start date of 1 October in the preceding yearThe patterns observed have been fairly consistent Periodic precipitation episodes oc-cur throughout the principal cool season of October through May followed by a briefdry season from late May through mid-June This is followed by a summer period ofrather intense precipitation episodes associated with the regional incursion of the North15
American Monsoon system Finally there is an extended dry period starting in the latesummer and extending into early autumn The average annual accumulated precipita-tion for 2010ndash2013 was sim 4305 mm with a range of 392 mm (in 2012) to 513 mm (in2010) It should be noted that 2012 was among the driest years on record for most ofthe state and the total precipitation for 2013 was similarly low The latter year began20
with very low winter and spring snow fall and stayed much drier than average untilheavy September rains finally increased the total accumulated precipitation to aboutthe same level observed in 2012 During most years approximately 50 of the totalprecipitation occurs during JunendashSeptember The maximum observed hourly rainfallrecorded at the site from 2009ndash2013 was 579 mm which occurred on 4 August 201025
Other thunderstorms with high rain fall rates (up to 25 mmhminus1) are common during thesummer monsoon
Seasonally-transient snowpack is an important feature of the hydrologic cycle as thesnowpack can provide a lasting water source to the site during the spring melt period
1659
ACPD14 1647ndash1709 2014
Overview of theManitou
Experimental ForestObservatory
J Ortega et al
Title Page
Abstract Introduction
Conclusions References
Tables Figures
J I
J I
Back Close
Full Screen Esc
Printer-friendly Version
Interactive Discussion
Discussion
Paper
|D
iscussionP
aper|
Discussion
Paper
|D
iscussionP
aper|
and can also insulate the soil from freezing temperatures Snow depth measurements(Jenoptik Inc SHM30 laser snow depth sensor) began during the winter of 2010ndash2011 Persistent patchy or complete snowpack is limited to December January andFebruary Periodic snowstorms may also input appreciable moisture during the monthsof October November March and April although the snowpack rarely persists for more5
than 7 daysSoil moisture (Decagon EC-5 probes) and temperature (Campbell Scientific T107
thermistor) profiles extending from the near surface to approximately 1 m depth aremade at 3 different sites within the micrometeorology towerrsquos footprint The mergedannual cycle of soil moisture from all sites is shown in Fig 4b and the annual soil tem-10
perature cycle is shown in Fig 4c The soil moisture cycle exhibits some interesting andclassic features of western landscape hydrology especially the tendency for persistentdryness and pulsed recharge of near-surface moisture particularly in the warm sea-son Deeper into the soil the moisture variability is significantly damped and there isevidence of persistent soil moisture there regardless of extended summer dry periods15
This deeper layer of persistent wet soil helps sustain some of the total evaporative fluxfrom the ponderosa pine ecosystem during the summer There are extended periods ofwinter soil temperatures several degrees below 0 C which extends to approximately70 cm below the surface These low soil temperatures indicate that significant amountsof soil water freeze (ie creates ldquosoil frostrdquo) occasionally during the winter The pres-20
ence of soil frost is further evidenced by the sharp decline in recorded soil moisturevalues from December through late-February Suppressed soil moisture values corre-sponding with sub-zero soil temperatures is a classic measurement artifact due to thesignificant change in soil dielectric permittivity as water undergoes phase change fromliquid to ice and back again at the freezing point This meltwater release and periodic25
melting of the transient snowpack impart additional water pulses to the site As previ-ously mentioned MEFO typically experiences an early summer dry period before theonset of the monsoon rains which is highly correlated with increased CO2 and BVOCfluxes The semi-arid climate creates very low mid-day stomatal conductance in pon-
1660
ACPD14 1647ndash1709 2014
Overview of theManitou
Experimental ForestObservatory
J Ortega et al
Title Page
Abstract Introduction
Conclusions References
Tables Figures
J I
J I
Back Close
Full Screen Esc
Printer-friendly Version
Interactive Discussion
Discussion
Paper
|D
iscussionP
aper|
Discussion
Paper
|D
iscussionP
aper|
derosa pine during the early- and late-summer dry periods which protects the treesfrom water stress These fluxes and stomatal conductance both increase substantiallyduring the monsoon rains
22 Water manipulation effects on ponderosa pine
Projected water limitations and higher temperatures are expected to put addi-5
tional climate-induced physiological stresses on semi-arid forest ecosystems (Allenet al 2010) To test hypotheses related to future climates manipulation experimentsmust be carefully designed to ensure that data are representative of larger ecosystemsresponses (Beier et al 2012) With these considerations in mind another study atMEFO during 2010ndash2011 was designed to quantify the effect of different water treat-10
ments on the photosynthesis and respiration rates as well as BVOC emissions frommature trees (at least 10 m in height) Up to 50 of the incoming precipitation (snowand rain) was systematically diverted from the root zones (10mtimes10 m area) around tar-geted trees using an array of troughs (see Fig 1c) The intercepted water was collectedinto barrels and then added to nearby trees resulting in a water continuum delivered to15
the various trees from 05 to 15 times the total precipitation such that the total amountof water delivered to the entire plot remained constant Physiological parameters (egsapflow photosynthesis and BVOC emissions) were measured on all trees within theexperimental plot Similar to the speciation seen in ambient air branch-level measure-ments showed that the BVOCs emitted in the highest concentrations were methanol20
2-methyl-3-buten-2-ol and monoterpenes Initial observations showed that seasonal-ity in plant physiological processes and weather dynamics interact to produce complexcontrols over climate-dependent emissions of these compounds with a strong depen-dence on soil moisture and precipitation If the climate in this region shifts to a driersummer regime total BVOCs emitted from needles of this forest are likely to decrease25
which will have implications for modeling both gas- and liquid-phase regional chemistryStudies such as this exemplify the interdisciplinary research questions addressed by
1661
ACPD14 1647ndash1709 2014
Overview of theManitou
Experimental ForestObservatory
J Ortega et al
Title Page
Abstract Introduction
Conclusions References
Tables Figures
J I
J I
Back Close
Full Screen Esc
Printer-friendly Version
Interactive Discussion
Discussion
Paper
|D
iscussionP
aper|
Discussion
Paper
|D
iscussionP
aper|
the BEACHON project and are necessary to address the ecological system processesfor inclusion into Earth-System models as discussed in Sect 11
3 Volatile organic compounds oxidants and aerosol properties
31 Volatile organic compound observations
Volatile organic compounds (VOCs) at MEFO are a mixture of biogenic and anthro-5
pogenic compounds The summertime VOC signals are dominated by biogenic emis-sions primarily methanol ethanol acetone monoterpenes (C10H16 abbreviated byMT) and 2-methyl-3-buten-2-ol (C5H10O abbreviated by 232-MBO or MBO) Isoprene(C5H8) is also observed during summer but to a much lesser extent (sim 10ndash20 of 232-MBO concentrations) Anthropogenic VOC concentrations (which are typically trans-10
ported into the area from the Colorado Springs or Denver metropolitan areas) are lowerthan the biogenic signals
A variety of techniques have been used to measure VOCs from different levels onthe chemistry tower individual branches from the dominant vegetation (ponderosapine) and from the ground A quadrupole proton transfer reaction mass spectrome-15
ter (PTR-MS) measured a suite of selected VOCs (including methanol acetonitrileacetaldehyde acetone+propanal 232-MBO+ isoprene benzene monoterpenes andsesquiterpenes) during portions of each of the 2008ndash2012 growing seasons Undernormal PTR-MS operating conditions 232-MBO undergoes a dehydration reaction inthe PTR-MS drift tube leading to a molecular ion of mz = 69 This is the same ion20
as protonated isoprene which is why they are reported as the sum of both speciesMeasurements alternated between a six point gradient system (16 5 85 12 177and 251 m above ground) and an eddy covariance (EC) flux system at the top level(251 m) In addition a time-of-flight (TOF) PTR-MS was deployed for EC and con-centration measurements above the ponderosa pine canopy in 2010 and 2011 (Kaser25
et al 2013a b) A Selective Reagent Ion (SRI) PTR-TOF-MS instrument was used in
1662
ACPD14 1647ndash1709 2014
Overview of theManitou
Experimental ForestObservatory
J Ortega et al
Title Page
Abstract Introduction
Conclusions References
Tables Figures
J I
J I
Back Close
Full Screen Esc
Printer-friendly Version
Interactive Discussion
Discussion
Paper
|D
iscussionP
aper|
Discussion
Paper
|D
iscussionP
aper|
2011 to selectively distinguish 232-MBO from isoprene concentrations by using NO+
as the reagent ion (Karl et al 2012) This configuration was also used for one weekin 2012 to continue these measurements for determining EC fluxes of 232-MBO andisoprene (Karl et al 2014) Figure 5 shows the vertical flux profiles for 232-MBO andtotal MT calculated from gradient measurements using the methodology described in5
Karl et al (2004) It is evident that daytime MBO emissions follow a light-dependentpattern and that the fluxes increase with height up to 12 m MT emission patterns werevertically more uniformly distributed suggesting that the understory (forest litter barkand trunks) also contributed to the total emissions Using site-specific leaf cuvette mea-surements as model inputs MEGAN 21 estimates showed good agreement with the10
measured average daytime 232-MBO+ isoprene fluxes of 184 mgmminus2 hminus1 After thelarge rain and hail storm on 4 August 2010 (which produced 579 mm precipitation inan hour Sect 21) monoterpene fluxes increased to 47 mgmminus2 hminus1 which is a factor5ndash10 higher than what is normally observed (05ndash1 mgmminus2 hminus1) (Kaser et al 2013b)Figure 6a shows the sum of MT and MBO+ isoprene measurements starting on this15
day (4 August) and ending 1 week later (11 August) The increases in both emissionsand fluxes which continue for sim 2 days after the event are evident The missing fluxdata on the first day (and periodically throughout the measurement period) is due to tur-bulence characteristics that are not amenable to EC calculations Several other BVOCemissions such as cymene camphor nopinone pinonaldehyde and sesquiterpenes20
were also enhanced after this disturbance of the vegetationThe Trace Organic Gas Analyzer (TOGA Apel et al 2010) was deployed during
the BEACHON ROCS campaign to measure concentrations of isoprene 232-MBOspeciated MT and over 25 other targeted compounds Results showed that the MTspeciation is dominated by α-pinene β-pinene and ∆-3-carene (approximately 25 25
each) Other contributors include camphene (7 ) limonene (12 ) myrcene (5 )and ocimene (1 ) Figure 6b (1ndash4) shows August 2010 ambient diel concentrationsof 4 VOCs reported by TOGA The concentrations of the biogenic compounds MBOand MT are much higher than those of typical anthropogenic compound (eg toluene)
1663
ACPD14 1647ndash1709 2014
Overview of theManitou
Experimental ForestObservatory
J Ortega et al
Title Page
Abstract Introduction
Conclusions References
Tables Figures
J I
J I
Back Close
Full Screen Esc
Printer-friendly Version
Interactive Discussion
Discussion
Paper
|D
iscussionP
aper|
Discussion
Paper
|D
iscussionP
aper|
at this site and the concentrations have different diurnal signatures During the dayas the boundary layer grows and OH is present MT concentrations are diminishedeven though their emissions are the greatest during this time At night the suppressedboundary layer height combined with decreased losses from O3 and OH reactionsleads to elevated MT concentrations that generally increase from 1800 MST to mid-5
night and remain elevated until 0600ndash0700 MST MBO emissions from ponderosa pineare strongly light dependent (Harley et al 1998 Kaser et al 2013b) resulting in max-imum emissions and ambient concentrations during midday with a secondary peak inearly morning associated with initiation of emissions before the morning breakup of thenocturnal boundary layer The combination of all 3 instruments used during BEACHON10
ROCS provided a unique opportunity to compare VOC measurement techniques underreal-world conditions The results were encouraging as the instruments agreed withinsim 20 for monoterpenes and sim 10 for 232-MBO+ isoprene with R2 values of 085ndash097 (Kaser et al 2013a)
Branch- and needle-level BVOC measurements have been made by focusing emis-15
sions from cuvettes surrounding the vegetation on to solid adsorbents followed by ther-mal desorption gas chromatography with mass spectrometer and flame ionization (FID)detectors These measurements confirm the dominance of MBO in the emission profileduring daylight hours MBO comprises gt 85 of the emitted reactive BVOC mass Sim-ilar to ambient observations α-pinene β-pinene ∆-3-carene camphene and limonene20
dominate the MT emissions but a large number of other terpenoids are emitted at lowerrates including sabinene myrcene ocimene α-terpinene β-phellandrene cymeneterpinolene p-cymenene and the oxygenated monoterpenes linalool terpineol andmethyl chavicol A number of sesquiterpenes dominated by β-farnesene also appearin emission samples For model inputs BVOC speciation is an important considera-25
tion as different compounds (such as MT isomers with the same chemical formula)have different reaction rate constants with OH O3 and NO3 so their reaction productspathways and atmospheric lifetimes can vary considerably Additional soil BVOC fluxmeasurements have been made using enclosures and a micrometeorological gradient
1664
ACPD14 1647ndash1709 2014
Overview of theManitou
Experimental ForestObservatory
J Ortega et al
Title Page
Abstract Introduction
Conclusions References
Tables Figures
J I
J I
Back Close
Full Screen Esc
Printer-friendly Version
Interactive Discussion
Discussion
Paper
|D
iscussionP
aper|
Discussion
Paper
|D
iscussionP
aper|
technique at the site (Greenberg et al 2012) These results suggested that emissionsfrom the litter were negligible contributing less than 1 of above-canopy emissions forall BVOCs measured
A newly developed Thermal desorption Aerosol Gas chromatograph-Aerosol MassSpectrometer (TAG-AMS) was deployed and analyzed semi-volatile VOCs (simC14-C25)5
on a bihourly timescale (Zhao et al 2013) More than 70 semi-volatile gas-phasespecies were observed and quantified in the ambient atmosphere during August 2011Source apportionment was used to identify the origin of these gas-phase speciesSome were anthropogenic compounds (such as poly-aromatic hydrocarbons (PAH)oxygenated PAH and alkanes) but 23 species were identified to be terpenoid com-10
pounds of biogenic origin from a local source determined from Positive Matrix Factor-ization (PMF)
In addition to direct VOC emissions and transported species it is also importantto consider oxidation products These compounds can influence tropospheric ozoneformation oxidative capacity of the atmosphere and contribute to secondary organic15
aerosol Concentrations and fluxes of two important oxygenated VOCs formaldehyde(HCHO) and glyoxal (CHOCHO) were measured during the 2010 BEACHON-ROCScampaign (DiGangi et al 2011 2012) using Fiber Laser-Induced Fluorescence (FILIFHottle et al 2009) and Laser-Induced Phosphorescence (Huisman et al 2008) Am-bient formaldehyde concentrations ranged between a minimum of sim05 ppb in the20
early morning hours (400 MST) and maximum values of 2ndash25 ppb in the evening(sim2000 MST) Ambient glyoxal concentrations ranged between a minimum of sim 18 pptin the early morning hours (600 MST) and maximum values of 30ndash55 ppt in theevening (sim1700 MST) The glyoxal formaldehyde ratio maintained a stable diurnal cy-cle ratio with values of sim15ndash2 in the early morning and at night and rising to sim25ndash25
3 in the middle of the days In addition to our knowledge these are the first canopy-scale HCHO eddy flux measurements reported for any site These results coupled withenclosure measurements that showed minimal direct emissions suggest a surprisinglylarge HCHO production source within the canopy air space The mid-day HCHO fluxes
1665
ACPD14 1647ndash1709 2014
Overview of theManitou
Experimental ForestObservatory
J Ortega et al
Title Page
Abstract Introduction
Conclusions References
Tables Figures
J I
J I
Back Close
Full Screen Esc
Printer-friendly Version
Interactive Discussion
Discussion
Paper
|D
iscussionP
aper|
Discussion
Paper
|D
iscussionP
aper|
were positive (upward) ranging from 37 to 131 microgmminus2 hminus1 (see Fig 7b) and were cor-related with temperature and radiation within the canopy The missing HCHO sourceis thus consistent with oxidation of VOCs with light- and temperature-dependent emis-sion profiles The strength of HCHO fluxes cannot be accounted for by the oxidation ofmeasured MBO and terpenes (also see Sect 32)5
32 Peroxy and hydroxyl radical observations
Numerous studies (eg Stone et al 2012) have highlighted discrepancies betweenmodeled and measured radical concentrations in forested environments suggestingan incomplete understanding of the chemical processes driving secondary pollutantformation While most research has focused on regions dominated by isoprene emis-10
sions results from several investigations indicate gaps in our understanding of BVOCoxidation in MBO- and monoterpene-dominated areas similar to MEFO (Kurpius andGoldstein 2003 Day et al 2008 Farmer and Cohen 2008 Wolfe et al 2011 Maoet al 2012) Both the 2010 BEACHON-ROCS and 2011 BEACHON-ROMBAS cam-paigns included measurements of the hydroxyl radical (OH) and peroxy radicals (HO215
and RO2) (Table S1) providing a unique opportunity to test our understanding of thechemical reactions that link BVOC oxidation with production of ozone and secondaryorganic aerosol (SOA) precursors
Discrepancies between modeled and measured HOx (= OH + HO2) in regions withhigh BVOC levels have been primarily attributed to ldquomissingrdquo sources of OH (Thornton20
et al 2002 Lelieveld et al 2008 Hofzumahaus et al 2009 Peeters et al 2009)In the boundary layer OH is produced both via ldquoprimaryrdquo sources such as photolysisof ozone in the presence of water vapor and via radical cycling reactions such asreaction of HO2 with NO
O3 +hνrarr O(1D)+O2 (R1)25
O(1D)+H2O rarr 2OH (R2)
HO2 +NO rarr OH+NO2 (R3)1666
ACPD14 1647ndash1709 2014
Overview of theManitou
Experimental ForestObservatory
J Ortega et al
Title Page
Abstract Introduction
Conclusions References
Tables Figures
J I
J I
Back Close
Full Screen Esc
Printer-friendly Version
Interactive Discussion
Discussion
Paper
|D
iscussionP
aper|
Discussion
Paper
|D
iscussionP
aper|
In a detailed analysis of OH observations Kim et al (2013) demonstrate that rad-ical recycling via reaction (R3) is likely the dominant source of OH within the MEFOcanopy A 0-D box model under-predicts HOx concentrations relative to observationsimplying unidentified sources of HO2 Using the same box model in a study focused onperoxy radical observations Wolfe et al (2013) confirm this result and identify several5
potential additional sources of both HO2 and RO2 Notably it is suggested that oxi-dation of unmeasured highly reactive BVOC could explain a significant portion of themissing peroxy radical source Such a source may also explain the high HCHO fluxesobserved during the BEACHON ROCS campaign (DiGangi et al 2011 see Sect 31)Figure 7a compares the hourly-averaged measured and modeled total peroxy radical10
mixing ratios for BEACHON-ROCS (August 2010) As described in Wolfe et al (2013)the difference between measured and modeled values corresponds to a total ldquomissingrdquoperoxy radical production rate of as much as 130 pptminminus1 For comparison Fig 7bshows measured and modeled HCHO fluxes (DiGangi et al 2011) The additionalHCHO production needed to reconcile modeled and measured formaldehyde fluxes15
is on the order of 65 pptminminus1 at midday Uncertainties in measurements and modelresults contribute to a significant overall uncertainty in these production rate estimates(approximately plusmn50 ) Nonetheless the similarity between these results ndash obtainedvia two essentially independent methods ndash supports the conclusion that VOC oxidationwithin the canopy is much stronger than predicted by canonical chemical mechanisms20
Analysis of the role of anthropogenic influence on the oxidation of BVOCs espe-cially via the influence of NOx on the fate of RO2 is of great current interest (Orlandoand Tyndall 2012) and MEFO is well suited for such studies (see also Sect 41)Figure 8a shows the measured HO2 HO2 +RO2 NO and NO2 concentrations dur-ing a representative day in BEACHON ROCS (24 August 2010) and Fig 8c shows25
the corresponding wind speed and direction On this day upslope conditions (that canbring polluted urban air and are often seen at this site see Fig 3) were not observedas the wind was generally out of the south or southwest where there is relatively littleanthropogenic influence During the mid-morning as the boundary layer developed an
1667
ACPD14 1647ndash1709 2014
Overview of theManitou
Experimental ForestObservatory
J Ortega et al
Title Page
Abstract Introduction
Conclusions References
Tables Figures
J I
J I
Back Close
Full Screen Esc
Printer-friendly Version
Interactive Discussion
Discussion
Paper
|D
iscussionP
aper|
Discussion
Paper
|D
iscussionP
aper|
increase in NOx (Fig 8a) can be seen which was likely due to downward transportof a residual layer The anthropogenic influence on the fate of RO2 is evident as theloss mechanism was initially dominated by the RO2 +NO channel (Fig 8b) but dur-ing mid-day as NOx concentrations decreased (due to the residual morning boundarylayer breaking up and southwesterly flow to the site) the RO2 +HO2 channel became5
the major loss mechanism While the patterns of these transitions do not appreciablyaffect the concentrations of biogenic and anthropogenic VOCs the changes in the roleof the different reaction channels are consistent with the measured HCHO and glyoxalconcentrations (DiGangi et al 2012) and measured and modeled HO2 +RO2 concen-trations indicated in Fig 7 This competition between NOx and HO2 for reaction with10
the peroxy radicals (RO2) affects the composition of multigenerational reaction prod-ucts formed during gas-phase radical cycling and thus dictates to a large extent theproduction of ozone and organic aerosol precursors
33 Aerosol properties and composition
Particle size distribution measurements (covering diameters from 4 nm to 25 microm) were15
conducted for nearly 2 yr at MEFO starting in February 2010 and ending in Jan-uary 2012 Frequent ldquosmall particle eventsrdquo characterized by high concentrations of4ndash20 nm particles were observed especially during the summer season The originof these small particles is likely atmospheric nucleation (Kulmala et al 2007) whichis thought to be caused by reactions of gas-phase sulfuric acid with atmospheric20
bases such as ammonia and amines as well as oxidized organic compounds (Kirkbyet al 2011 Almeida et al 2013) An example of three typical small particle eventsduring July 2011 is shown in Fig 9a where the onset of each event is seen just prior tonoon (MST) These events are common at MEFO in the summer occurring 3ndash5 timesper week during late morning or early afternoon and typically coincide with changes in25
wind speed and direction Figure 9b shows wind speed and wind direction at the top ofthe chemistry tower and sulfate aerosol mass loadings measured by the aerosol massspectrometer On each of these mornings the wind speed is fairly low (sim 1 msminus1) at
1668
ACPD14 1647ndash1709 2014
Overview of theManitou
Experimental ForestObservatory
J Ortega et al
Title Page
Abstract Introduction
Conclusions References
Tables Figures
J I
J I
Back Close
Full Screen Esc
Printer-friendly Version
Interactive Discussion
Discussion
Paper
|D
iscussionP
aper|
Discussion
Paper
|D
iscussionP
aper|
800 MST with wind direction shifting from the south to a more northerly or northeast-erly direction indicating upslope transport from the Denver area (similar to the exampleshown in Fig 3) Thermal desorption chemical ionization mass spectrometer (TDCIMS)measurements during these nucleation events demonstrated that sub-20 nm particleswere composed of sim 60 sulfate by mass whereas during non-event periods sulfate5
contributed less than 40 of the mass to these small particles In both event and non-event periods the bulk aerosol mass is not significantly affected by this sulfate massas the majority of the total aerosol mass is dominated by larger particles The correla-tion with wind direction and the increase in sulfate aerosol indicates that these eventsare anthropogenically induced The scarcity of particles smaller than 10 nm on 29 July10
suggests that nucleation is occurring away from the site either aloft (Mirme et al 2010Schobesberger et al 2013) or in the mixed layer shortly (sim 60 min or less) upwind ofthe site
A Fast Mobility Particle Sizer (FMPS) was used during BEACHON-RoMBAS to mea-sure size-dependent particle fluxes (Pryor et al 2013) While the mean flux of both15
Aitken and nucleation mode (lt 30 nm diameter) particles was downwards upwardfluxes were frequently observed Based on quadrant and time-scale analyses usingaerosol dynamics modeling they found that the upward fluxes of nucleation mode par-ticles were most strongly influenced by upward transport of particle-rich air from thecanopy resulting from the growth of recently nucleated particles as well as coagulation20
processes Downward fluxes of the Aitken mode were more commonly linked to break-down of the nocturnal inversion and entrainment of particle-depleted air from above thecanopy
Average particle number concentrations at this site are typically less than 2times103 cmminus3 and rarely exceed 104 cmminus3 which are typical values in rural continental en-25
vironments During the summertime 2011 BEACHON-RoMBAS study AMS (AerosolMass Spectrometry) measurements showed average PM1 mass loadings of 25 microgmminus3
(Fig 10a) Also included in this figure is black carbon aerosol as measured with a sin-gle particle soot photometer (SP2 Droplet Measurement Technologies) Approximately
1669
ACPD14 1647ndash1709 2014
Overview of theManitou
Experimental ForestObservatory
J Ortega et al
Title Page
Abstract Introduction
Conclusions References
Tables Figures
J I
J I
Back Close
Full Screen Esc
Printer-friendly Version
Interactive Discussion
Discussion
Paper
|D
iscussionP
aper|
Discussion
Paper
|D
iscussionP
aper|
75 of the total PM1 aerosol mass was comprised of organic aerosol (OA) with therest composed primarily of ammonium sulfate Nitrate concentrations were low andwere shown to be primarily composed of organic nitrates (Fry et al 2013) Black car-bon (BC) aerosol mass was of the order of a few percent of the total submicron massand more variable often increasing and decreasing by an order of magnitude on hourly5
timescales Transport from urban areas fires and local traffic likely explain this highvariability Figure 10b shows the size-resolved composition for the same species andtime period Ammonium and sulfate size distributions were centered at 300ndash400 nmwhile organics and nitrate aerosol size distributions were centered at sim 250 nm Thedistinct size distributions of the chemical components indicate that these aerosols are10
not completely internally mixed Figure 10c shows the month-long daily distributionsindicating a subtle diurnal cycle in organic aerosol peaking at night but with consider-able day-to-day variability The peak in average sulfate (and associated ammonium) atsim1600ndash1900 MST is primarily due to the influence of certain days where sulfate in-creased during late afternoon to early evening with corresponding SO2 increases (see15
red spikes in Fig 10a) The diurnal BC trend has two peaks The larger of these wasin the evening (sim2000 MST) coincident with the regular prolonged impact of the urbanplume in afternoon through evening and was also seen in other anthropogenic species(eg NOx CO) The smaller shorter-duration morning peak (sim0600 MST) was alsocorrelated with NOx and CO The reason for this morning BC increase could be due20
to the break-up of the shallow nocturnal boundary layer causing mixing down of morepollution-rich residual layer air or an increase of local emission sources into a shal-low morning boundary layer It should be noted that the diameter measured from BCaerosol is the mass equivalent diameter (Dme) which was obtained by assuming a den-sity of 18 gcmminus3 as recommended by Moteki et al (2010) The vacuum aerodynamic25
diameter (Dva) shown in the size distributions (Fig 10b) was computed by multiplyingDme by the density (18) Dva of the particles containing BC could be larger if the BCwas internally mixed with other non-BC compounds (eg organic coatings) or smaller ifthe particles had irregular shapes (DeCarlo et al 2004) BC diameters peaked at Dva
1670
ACPD14 1647ndash1709 2014
Overview of theManitou
Experimental ForestObservatory
J Ortega et al
Title Page
Abstract Introduction
Conclusions References
Tables Figures
J I
J I
Back Close
Full Screen Esc
Printer-friendly Version
Interactive Discussion
Discussion
Paper
|D
iscussionP
aper|
Discussion
Paper
|D
iscussionP
aper|
sim 200ndash300 nm which is approximately 100 nm smaller than the peak of the organicand nitrate distributions
PM25 collection onto quartz fiber filters during the same campaign were analyzed fora variety of specific SOC (Secondary Organic Carbon) and carbon isotopic measure-ments as described in Geron (2011) and Lewandowski et al (2013) These results es-5
timated that 05 microgCmminus3 could be attributed to specific SOC (Secondary Organic Car-bon) precursors Hemiterpene precursor compounds (isoprene+MBO) representedapproximately half of the observed SOC with monoterpenes contributing nearly thesame amount to the total SOC Isotopic measurements of these same filter samplesfound that the 14C ratio was 071plusmn011 (range 052 to 088) indicating that roughly10
three quarters of the particulate carbon observed during BEACHON-RoMBAS was ofmodern non-petrogenic origin The fraction of modern carbon (70 ) at this site isless than values observed in eastern US forests For example Geron (2009) reportedmean summer-time values of 83 and with maximum values reaching 97 for thoseforests Similarly during summer months near forests in the Eastern United States15
Lewis et al (2004) observed values between sim 80ndash95 Organic tracer results (in-cluding isoprene MT and 232-MBO oxidation products) indicate that the lower fractionof contemporary carbon is primarily due to lower total biogenic emissions and lowerorganic mass loadings and not due to more traffic or other urban influences (Klein-dienst et al 2007) The modern carbon results from MEFO can also be compared to20
measurements at nine Interagency Monitoring for Protection of Visual Environments(IMPROVE) network sites The values from the urban sites in this network averagedapproximately 50 (Bench et al 2007)
Gas- and aerosol-phase organic nitrate concentrations were quantified with thermaldissociation laser-included fluorescence (TD-LIF Day et al 2002 Rollins et al 2010)25
during summer 2011 (Fry et al 2013) Gas-phase organic nitrate classes showeddiurnal cycles peaking mid-day at sim 200 ppt (total alkyl and multifunctional nitrates)sim 300 ppt (total peroxy acyl nitrates) while total particle-phase organic nitrates peakedat night or early morning Formation rates of gas-phase organic nitrates within the
1671
ACPD14 1647ndash1709 2014
Overview of theManitou
Experimental ForestObservatory
J Ortega et al
Title Page
Abstract Introduction
Conclusions References
Tables Figures
J I
J I
Back Close
Full Screen Esc
Printer-friendly Version
Interactive Discussion
Discussion
Paper
|D
iscussionP
aper|
Discussion
Paper
|D
iscussionP
aper|
shallow nocturnal boundary layer were comparable to daytime formation rates It wasobserved that total gas- and particle-phase organic nitrates had equilibrium-like re-sponses to diurnal temperature changes suggesting some reversible partitioning al-though thermodynamic modeling could not explain all of the repartitioning Additionallydiurnal cycles of gas-particle partitioning supported model-predicted nighttime forma-5
tion of lower volatility products compared to daytime from NO3 radical-initiated oxi-dation of monoterpenes Aerosol-phase organic nitrates were also measured by AMSand showed good agreement with TD-LIF (Fry et al 2013)
Hundreds of acids in the gas and aerosol phases were quantified in real-time duringsummer 2011 using the newly-developed Micro-Orifice Volatilization Impactor High-10
Resolution Time-of-Flight Chemical Ionization Mass Spectrometer (MOVI-HRToF-CIMS Yatavelli et al 2012 2013) This technique provides a direct measurement ofthe gas-particle partitioning of individual and bulk organic acids Bulk organic acidsfollowed absorptive partitioning responding to temperature changes on timescales ofsim 1ndash2 h suggesting there were not major kinetic limitations to species evaporation15
Species carbon number and oxygen content together with ambient temperature con-trolled the volatility of organic acids and were good partitioning predictors Moreoverthe relationship between observed and modeled partitioning with carbon number andoxygen content pointed toward the likely importance of different classes of multifunc-tional organic acids that comprised the bulk of the acid groups (eg hydroxyacids20
hydroperoxyacids or polyacids but not ketoacids)A newly identified 232-MBO-derived organosulfate was identified in aerosol samples
during the 2011 BEACHON-RoMBAS study although at levels signicantly lower thanreported for a similar ponderosa pine-dominated site in California (Zhang et al 2012)The reason for the lower organosulfates observed in the aerosol filter samples was25
tentatively attributed to the lower acidity of the pre-existing aerosol at BEACHON com-pared to the California site Acidity is thought to greatly enhance the formation of thisorganosulfate This species has the potential to be used as a tracer of SOA formationfrom 232-MBO
1672
ACPD14 1647ndash1709 2014
Overview of theManitou
Experimental ForestObservatory
J Ortega et al
Title Page
Abstract Introduction
Conclusions References
Tables Figures
J I
J I
Back Close
Full Screen Esc
Printer-friendly Version
Interactive Discussion
Discussion
Paper
|D
iscussionP
aper|
Discussion
Paper
|D
iscussionP
aper|
Part of BEACHON-RoMBAS included the collection of time- and size-resolved bio-logical aerosol properties To our knowledge this is the most extensive and compre-hensive set of these measurements and data available One key observation during thestudy was that rainfall events induced large increases in ambient fluorescent biologicalaerosol particle (FBAP) concentrations within the forest canopy (Huffman et al 20135
Prenni et al 2013) with concentrations remaining elevated for extended periods oftime (gt 12 h) due to increased humidity and surface wetness The largest observedincreases of more than an order of magnitude relative to dry conditions occurred inthe size range of 2ndash6 microm Microscopic observations showed that these particles weredominated by biological cells at sizes with characteristics of bacterial aggregates and10
fungal spores (Huffman et al 2013) Concentration increases that occurred during therain events likely resulted from mechanical ejection of biological particles from sur-faces (Constantinidou et al 1990 Jones and Harrison 2004) while a second largermode (which occurred after the rain) was likely actively emitted from biota on vegetatedsurfaces near the site (Elbert et al 2007 Huffman et al 2013) Contrary to the expec-15
tation that large particles will be washed out during precipitation these data showeda significant increase in concentration and net upward flux of primary super-micronparticles after rain which demonstrates a direct and important link of airborne parti-cles to the hydrological cycle Longer term measurements continued for ten months(July 2011ndashJune 2012) tracking the seasonal FBAP cycle at the site and observing20
trends with season precipitation and other meteorological parameters (Schumacheret al 2013)
34 Cloud condensation nuclei and ice nuclei
One of the primary goals of the BEACHON project was to determine the potentialfor biogenic emissions to serve as CCN and ice nuclei (IN) which can impact cloud25
properties and precipitation (eg Barth et al 2005) It has been recently suggestedthat fungal spores may have large influences on SOA formation in the Amazonian forest(Poumlhlker et al 2012) and as discussed below these biologically-influenced particles
1673
ACPD14 1647ndash1709 2014
Overview of theManitou
Experimental ForestObservatory
J Ortega et al
Title Page
Abstract Introduction
Conclusions References
Tables Figures
J I
J I
Back Close
Full Screen Esc
Printer-friendly Version
Interactive Discussion
Discussion
Paper
|D
iscussionP
aper|
Discussion
Paper
|D
iscussionP
aper|
can influence both CCN and IN Changes in cloud properties and precipitation can inturn influence biogenic emissions closing the loop on a potentially important feedbackbetween the carbon and water cycles (Poumlschl et al 2010 Morris et al 2014)
To better understand the influence of biogenic secondary organic aerosol on aerosolhygroscopicity and the seasonal variability of CCN a continuous 14 month study5
(March 2010ndashMay 2011) was performed at MEFO (Levin et al 2012) This was fol-lowed by additional measurements during the 2011 BEACHON-RoMBAS intensivecampaign which allowed for direct comparison between aerosol hygroscopicity andaerosol chemical composition measurements (Levin et al 2013) Aerosol hygroscop-icity was described using the dimensionless hygroscopicity parameter κ (Petters and10
Kreidenweis 2007) with an annual averaged κ value of 016plusmn008 This value issimilar to κ values measured in remote forested regions such as in Finland (Cerullyet al 2011) and the Brazilian Amazon (Gunthe et al 2009) and is lower than the com-monly assumed continental value of κ = 03 (Andreae and Rosenfeld 2008) Aerosolcomposition derived from the hygroscopicity measurements at MEFO indicated a pre-15
dominance of organic species in the aerosol leading to the low κ measurement valuesDirect comparison of organic mass fraction measured by aerosol mass spectrometryand filter measurements (discussed in Sect 33) during BEACHON-RoMBAS agreedwell with the composition derived from the hygroscopicity measurements Organicmass fractions were found to be largest (up to 90 ) in the smallest particles (20ndash20
30 nm) as measured by a Thermal Desorption Chemical Ionization Mass Spectrometer(TDCIMS) This fraction decreased with increasing particle diameter as measured bythe AMS (Fig 10b Levin et al 2013) and is consistent with the smallest particlesbeing composed primarily of oxidized organic species from forest emissions Resultsfrom the year-long measurements showed that κ was slightly higher during the win-25
ter months when biogenic emissions (which are strongly temperature-dependent) aresuppressed The combination of these results suggests that secondary organic aerosolderived from biogenic emissions impact aerosol hygroscopicity and CCN number con-centrations throughout the year
1674
ACPD14 1647ndash1709 2014
Overview of theManitou
Experimental ForestObservatory
J Ortega et al
Title Page
Abstract Introduction
Conclusions References
Tables Figures
J I
J I
Back Close
Full Screen Esc
Printer-friendly Version
Interactive Discussion
Discussion
Paper
|D
iscussionP
aper|
Discussion
Paper
|D
iscussionP
aper|
In addition to the CCN measurements IN have also been characterized Ice nucleat-ing particles induce ice formation in clouds and are thought to be critical in initiating pre-cipitation from mixed phase clouds (DeMott et al 2010) During BEACHON-RoMBASIN number concentrations were characterized at temperatures between minus34 C andminus9 C In addition the particle sizes that induced freezing at temperatures greater than5
minus20 C were characterized via the droplet freezing technique These particles as wellas IN were both positively correlated with number concentrations of FBAP (Huffmanet al 2013 Prenni et al 2013 Tobo et al 2013) Similar to the precipitation-inducedincreases observed in biological particle concentrations IN also increased during rainThe most dramatic example of this increase occurred on 2 August 2011 when a thun-10
derstorm produced 196 mm of precipitation (maximum rainfall rate of 30 mmhminus1) Dur-ing this storm IN concentrations at minus25 C increased from 2 Lminus1 to nearly 200 Lminus1
(Prenni et al 2013) Correlation between IN and FBAP across the temperature rangecoupled with DNA analysis of a portion of the residual IN suggests that a significantfraction of the IN at the surface is composed of biological particles particularly during15
and after rain events (Huffman et al 2013 Prenni et al 2013 Tobo et al 2013) Whenlofted to altitudes where mixed-phase clouds persist these biologically-influenced INcan influence subsequent precipitation providing yet another feedback between bio-genic emissions and the hydrologic cycle and further linking the biosphere hydro-sphere and atmosphere20
4 Atmospheric processes at an urban-rural interface
41 Atmospheric chemistry
As mentioned in Sect 22 the MEFO site is primarily influenced by clean continen-tal air but is periodically impacted by polluted air advected from the Colorado FrontRange urban areas This makes the site a suitable location to investigate interactions25
between biogenic and anthropogenic emissions and a variety of interesting questions
1675
ACPD14 1647ndash1709 2014
Overview of theManitou
Experimental ForestObservatory
J Ortega et al
Title Page
Abstract Introduction
Conclusions References
Tables Figures
J I
J I
Back Close
Full Screen Esc
Printer-friendly Version
Interactive Discussion
Discussion
Paper
|D
iscussionP
aper|
Discussion
Paper
|D
iscussionP
aper|
can be addressed For example how are the oxidation pathways of locally emittedBVOC influenced by oxidant levels (NO3 OH and O3) during clean and polluted condi-tions In addition to what extent does the transport of SO2 oxidants and VOCs fromurban areas affect particle nucleation and growth Model simulations can be initializedand parameterized using long-term and campaign-specific measurements of aerosols5
VOCs trace gasses and meteorology Results from these simulations can then becompared to observations Local emissions are dominated by 232-MBO and monoter-penes but these can be augmented by transport of anthropogenic species from theFront Range cities Typical summertime ozone concentrations are 50ndash60 ppb duringthe afternoon and decrease to sim 10ndash20 ppb at night Nitrogen oxides (NOx) are gen-10
erally dominated by NO2 with typical values sim 05 to 4 ppb although occasional urbaninfluences can cause the concentration to increase to 8ndash10 ppb NO concentrationsare much lower ndash typically less than 500 ppt and rarely exceed 1 ppb Since the area isrelatively rural with low NOx concentrations ozone is not titrated away at night as wouldtypically happen in an urban environment Average SO2 concentrations are quite low15
year-round averaging less than 200 ppt but concentrations can occasionally spike tosim 2 ppb The average July 2011 CO concentration was 100 ppb (standard deviation of52 ppb) These values increase when urban air is transported to the site but rarelyexceed 150 ppb CO measurements taken at other times of year have shown similarconsistent results Figures 3 and 6 above demonstrate the concentrations of some of20
these gas-phase species These direct measurements provide valuable insight into therange of atmospheric conditions that the site experiences and can be used as initialinputs and provide constraints in modeling efforts The relatively clean conditions com-bined with periodic well-defined urban perturbations make it an ideally situated locationfor studying atmospheric processes at the rural-urban interface An example of this was25
demonstrated in Fig 8 (adapted from DiGangi et al 2012) which shows the ambientconcentrations of HO2 RO2 NO and NO2 in 8A and the corresponding wind speed anddirection in 8C during a representative BEACHON-ROCS day (24 August 2010) In theearly morning both HO2 and RO2 are very low (lt 20 ppt) accompanied by low wind
1676
ACPD14 1647ndash1709 2014
Overview of theManitou
Experimental ForestObservatory
J Ortega et al
Title Page
Abstract Introduction
Conclusions References
Tables Figures
J I
J I
Back Close
Full Screen Esc
Printer-friendly Version
Interactive Discussion
Discussion
Paper
|D
iscussionP
aper|
Discussion
Paper
|D
iscussionP
aper|
speeds During the day the wind speed increases and becomes south-easterly with anaccompanying increase in NO (likely from the Colorado Springs area sim 40 km SE ofthe site) At sim1030 am there is an abrupt change in wind direction with air comingfrom the SW (where there is little anthropogenic influence) accompanied by a sharpdecrease in NO concentrations Concentrations of HO2 +RO2 then reach maximum5
values during the early afternoon at which point the HO2 concentrations become max-imized and the loss mechanism for RO2 is through the RO2 +HO2 channel (Fig 8b)These observations demonstrate that the fate of RO2 radicals at the site is dominatedby reaction with HO2 under clean-air conditions and by reaction with NO when in-fluenced by urban air The transitions between the two regimes can be quite sharp10
making the site well-suited for studying these types of transitions
42 Coupled weather and chemistry modeling
Three-dimensional coupled meteorology and chemistry simulations of MEFO and thesurrounding region have been conducted using the Weather Research and Forecast-ing model with Chemistry (WRF-Chem Grell et al 2005 Fast et al 2006) These15
model runs include gas-phase and aerosol chemistry as well as aerosol effects onradiation and clouds Simulations were performed at 4 km horizontal grid spacingand compared to ground measurements during the intensive BEACHON-ROCS andBEACHON-RoMBAS measurement periods These modeling studies focused partic-ularly on organic aerosol (OA) formation from forest BVOC emissions and the influ-20
ence of anthropogenic pollutants transported to the site Back-trajectory calculationsbased on WRF-Chem simulations confirm that these pollutants are advected from theFront Range urban (Fig 11) Elevated concentrations of NO2 (and SO2 not shown)measured onsite coincide with the arrival of polluted air masses from Denver or Col-orado Springs whereas low concentrations are associated with cleaner air advected25
from the west The effect of anthropogenic pollution on OA composition shows the pre-dicted fraction of modern carbon is consistent with observations (Sect 33) 30 ormore of OA is influenced by anthropogenic species (Fig 12) through either the for-
1677
ACPD14 1647ndash1709 2014
Overview of theManitou
Experimental ForestObservatory
J Ortega et al
Title Page
Abstract Introduction
Conclusions References
Tables Figures
J I
J I
Back Close
Full Screen Esc
Printer-friendly Version
Interactive Discussion
Discussion
Paper
|D
iscussionP
aper|
Discussion
Paper
|D
iscussionP
aper|
mation of secondary organic aerosols by nighttime NO3 chemistry increased OH andO3 oxidation or the direct transport of anthropogenic OA to the site NO3 chemistrycontributes to larger SOA concentrations at night when the boundary layer is shallow(Fry et al 2013) but the overall contribution to the actual aerosol column relevant to ra-diative forcing is small (a 1 microgmminus3 mass concentration represents a 100 microgmminus2 column5
density in a 100 m nighttime boundary layer) Daytime aerosol mass loadings contributemuch more to the regional aerosol mass due to the combination of the higher massloadings and fully developed boundary layer (2 microgmminus3 corresponds to 4000 microgmminus2 ina 2 km daytime boundary layer a forty-fold increase column height)
Small particle events were often correlated with elevated SO2 concentrations Fig-10
ure 13 shows the onset and subsequent growth of particles at the site during one ofthese events (29 July 2011) as observed (a) and the corresponding WRF-Chem sim-ulation (b) Model results indicate that initial particle formation is triggered by anthro-pogenic SO2 whereas subsequent particle growth is driven by condensation of BVOCoxidation products as discussed in Sect 33 Growth rates were calculated using the15
number mean diameter defined by (Matsui et al 2011)
NMD =
sumi Dpi timesNisum
i Ni(1)
where Dpi and Ni are the diameter (nm) and number concentration respectively Themodel simulations estimated that the average particle growth rates during these events20
(from 4ndash40 nm mobility diameter) were 34 nmhminus1 The observed values calculatedfrom SMPS measurements (average=20 nmhminus1) are less than the simulated valuesbut in reasonable agreement with other reports from forested regions in Indiana USA(25 nmhminus1 Pryor et al 2010) and Finland (29 nmhminus1 Jaatinen et al 2009) It shouldalso be noted that there is considerable variability in reported growth rates and this25
value is highly dependent upon the chosen diameter rangeThe impact of biogenic aerosols on clouds and precipitation was also investigated
as part of the BEACHON project Figure 13c shows the effect of new particle formation1678
ACPD14 1647ndash1709 2014
Overview of theManitou
Experimental ForestObservatory
J Ortega et al
Title Page
Abstract Introduction
Conclusions References
Tables Figures
J I
J I
Back Close
Full Screen Esc
Printer-friendly Version
Interactive Discussion
Discussion
Paper
|D
iscussionP
aper|
Discussion
Paper
|D
iscussionP
aper|
on cloud condensation nuclei (CCN) concentrations at the site during 5 days in Au-gust 2011 The observed CCN concentrations are compared with the predicted valuescomputed with and without accounting for particle nucleation in the model These re-sults show that modeled CCN concentration predictions (at 05 supersaturation) sig-nificantly under-predict the actual measured concentrations unless nucleation is taken5
into account This demonstrates the importance of aerosol nucleation to accuratelyparameterize aerosol-cloud interactions In future climate scenarios it has been hy-pothesized that warmer temperatures (and thus higher biogenic emissions) could havea negative climate feedback (Paasonen et al 2013) This is because more oxidationproducts from BVOC emissions will be available for condensation resulting in higher10
CCN concentrations and consequently increased cloud cover Other regional model-ing efforts utilizing BEACHON-ROCS and RoMBAS data are still underway to explorea variety of bio-hydro-atmosphere relationships
5 Key findings from 2008ndash2011 field campaigns
The Manitou Experimental Forest Observatory has hosted three multi-investigator in-15
tensive measurement campaigns each designed to focus on specific aspects of bio-hydro-atmosphere interactions Measurements made during the BEACHON-SRM08(Southern Rocky Mountains 2008) study provided an initial characterization of the siteprovided data (specifically aerosol number and mass concentrations CCN and hygro-scopicity) for evaluation of regional-scale model simulations examining aerosol-cloud20
interactions and enabled the identification of key scientific questions that could beaddressed during subsequent field campaigns The 2010 BEACHON-ROCS (RockyMountain Organic Carbon) study focused on BVOC oxidation and associated impli-cations for oxidant cycling and distributions The results showed that while there arecompounds in the ambient air not typically measured by standard techniques there25
is evidence that missing OH sinks are associated with oxidation products of knownBVOC rather than primary emissions of unknown BVOC The study also demonstrated
1679
ACPD14 1647ndash1709 2014
Overview of theManitou
Experimental ForestObservatory
J Ortega et al
Title Page
Abstract Introduction
Conclusions References
Tables Figures
J I
J I
Back Close
Full Screen Esc
Printer-friendly Version
Interactive Discussion
Discussion
Paper
|D
iscussionP
aper|
Discussion
Paper
|D
iscussionP
aper|
that considerable BVOC oxidation takes place within the canopy air space The fol-lowing year (2011) the BEACHON-RoMBAS (Rocky Mountain Biogenic Aerosol Study)took place to characterize a multitude of aerosol processes at the site and incorporatethe findings from the gas-phase measurements of BEACHON-ROCS into modelingefforts Among the many measurements performed were IN CCN particle size distri-5
butions chemical speciation of bulk aerosol and small (lt 30 nm) particles gas- andparticle-phase partitioning black carbon elementalorganic carbon (EC OC) ratiosgas-phase nitrate and NOx and super-micron biological particles This campaign alsoincluded many of the same gas-phase measurements from 2010 to further character-ize BVOC emissions oxidant levels and oxidation products Many of the long-term sea-10
sonal observations (see Table S1) have been valuable in characterizing the site and forinterpreting measurements taken during the intensive measurement campaigns TableS2 in the Supplement lists the publication results from the past 5 yr based on MEFOobservations Future investigations and data analysis from past measurements are ex-pected to result in further publications additional observations and more collaborative15
research This is not intended to be an exhaustive list but rather provide context for theresearch site and further information for past present and future researchers
6 Conclusions
Observations at the Manitou Experimental Forest Observatory have provided importantdata for understanding terrestrial-atmosphere interactions in a semi-arid ponderosa20
pine forest that is typical of the Colorado Front Range urbanndashrural interface Studies ofbiogenic emissions and their influence on gas-phase chemistry aerosol properties andcloud condensation nuclei have led to a number of interesting conclusions ndash someof which have been summarized herein High-frequency turbulence measurementscoupled with corresponding CO2 water and energy fluxes at the site are now be-25
ing incorporated into the land-surface schemes of climate models to more accuratelyrepresent canopy influences The unique observational data are available for other
1680
ACPD14 1647ndash1709 2014
Overview of theManitou
Experimental ForestObservatory
J Ortega et al
Title Page
Abstract Introduction
Conclusions References
Tables Figures
J I
J I
Back Close
Full Screen Esc
Printer-friendly Version
Interactive Discussion
Discussion
Paper
|D
iscussionP
aper|
Discussion
Paper
|D
iscussionP
aper|
model parameterization and evaluation studies The infrastructure exists to enable ad-ditional measurements and future scientific measurement campaigns as well as fortesting new instruments measurement inter-comparisons graduate and undergradu-ate student development and other studies involving terrestrial-atmospheric exchangeprocesses MEFO is a collaborative facility that is maintained through a cooperative5
agreement between NCAR and the USDA Forest Service and is available to the scien-tific community for training model development and evaluation and scientific discovery
Supplementary material related to this article is available online athttpwwwatmos-chem-phys-discussnet1416472014acpd-14-1647-2014-supplementpdf10
Acknowledgements The authors would like to acknowledge generous field support fromRichard Oakes (USDA Forest Service Manitou Experimental Forest Site Manager) Authorsfrom Colorado State University were supported through NSF grant ATM-0919042 Authors fromthe University of Colorado were supported by NSF grant ATM-0919189 and United States De-partment of Energy grant DE-SC0006035 Authors from the National Center for Atmospheric15
Research were supported by NSF grant ATM-0919317 and US Department of Energy grant DE-SC00006861 Thomas Karl was also supported by the EC Seventh Framework Program (MarieCurie Reintegration Program ldquoALP-AIRrdquo grant no 334084) S C Pryor (Indiana University)was supported by NSF ATM-1102309 Authors from the University of Innsbruck were supportedby the Austrian Science Fund (FWF) under the project number L518-N20L Kaser was also20
supported from a DOC-fFORTE-fellowship of the Austrian Academy of Science Authors fromthe University of Wisconsin-Madison were supported by NSF grant ATM-0852406 the BEA-CHON project and NASA-SBIR Phase I amp II funding Contributions from Los Alamos NationalLaboratory (LANL) were funded by the United States Department of Energyrsquos AtmosphericSystem Research (Project F265 KP1701 M K Dubey principal investigator) A C Aiken also25
thanks LANL ndash Laboratory Directed Research and Development for a Directorrsquos postdoctoralfellowship award The authors would also like to acknowledge substantial participation and in-put from the Max Planck Institute for Chemistry (MPIC Mainz Germany) which was fundedby the Max Planck Society (MPG) and the Geocycles Cluster Mainz (LEC Rheinland-Pfalz)
1681
ACPD14 1647ndash1709 2014
Overview of theManitou
Experimental ForestObservatory
J Ortega et al
Title Page
Abstract Introduction
Conclusions References
Tables Figures
J I
J I
Back Close
Full Screen Esc
Printer-friendly Version
Interactive Discussion
Discussion
Paper
|D
iscussionP
aper|
Discussion
Paper
|D
iscussionP
aper|
J A Huffman acknowledges internal faculty support from the University of Denver The UnitedStates Environmental Protection Agency (EPA) through its Office of Research and Develop-ment collaborated in the research described here This manuscript has been subjected to peerreview and has been cleared for publication Mention of trade names or commercial productsdoes not constitute endorsement or recommendation for use The National Center for Atmo-5
spheric Research is sponsored by the National Science Foundation Any opinions findings andconclusions or recommendations expressed in the publication are those of the authors and donot necessarily reflect the views of the National Science Foundation
References
Allen C D Macalady A K Chenchouni H Bachelet D McDowell N Vennetier M10
Kitzberger T Rigling A Breshears D D Hogg E H Gonzalez P Fensham RZhang Z Castro J Demidova N Lim J H Allard G Running S W Se-merci A and Cobb N A global overview of drought and heat-induced tree mortalityreveals emerging climate change risks for forests Forest Ecol Manag 259 660ndash684doi101016jforeco200909001 201015
Almeida J Schobesberger S Kurten A Ortega I K Kupiainen-Maatta O Praplan A PAdamov A Amorim A Bianchi F Breitenlechner M David A Dommen J Don-ahue N M Downard A Dunne E Duplissy J Ehrhart S Flagan R C Franchin AGuida R Hakala J Hansel A Heinritzi M Henschel H Jokinen T Junninen HKajos M Kangasluoma J Keskinen H Kupc A Kurten T Kvashin A N Laakso-20
nen A Lehtipalo K Leiminger M Leppa J Loukonen V Makhmutov V Mathot SMcGrath M J Nieminen T Olenius T Onnela A Petaja T Riccobono F Riip-inen I Rissanen M Rondo L Ruuskanen T Santos F D Sarnela N Schallhart SSchnitzhofer R Seinfeld J H Simon M Sipila M Stozhkov Y Stratmann F Tome ATrostl J Tsagkogeorgas G Vaattovaara P Viisanen Y Virtanen A Vrtala A Wag-25
ner P E Weingartner E Wex H Williamson C Wimmer D Ye P L Yli-Juuti TCarslaw K S Kulmala M Curtius J Baltensperger U Worsnop D R Vehkamaki Hand Kirkby J Molecular understanding of sulphuric acid-amine particle nucleation in theatmosphere Nature 502 359ndash363 doi101038nature12663 2013
1682
ACPD14 1647ndash1709 2014
Overview of theManitou
Experimental ForestObservatory
J Ortega et al
Title Page
Abstract Introduction
Conclusions References
Tables Figures
J I
J I
Back Close
Full Screen Esc
Printer-friendly Version
Interactive Discussion
Discussion
Paper
|D
iscussionP
aper|
Discussion
Paper
|D
iscussionP
aper|
Alo C A and Wang G L Hydrological impact of the potential future vegetation re-sponse to climate changes projected by 8 GCMs J Geophys Res-Biogeo 113 16doi1010292007jg000598 2008
Andreae M O and Rosenfeld D Aerosol-cloud-precipitation interactions Part 1the nature and sources of cloud-active aerosols Earth Sci Rev 89 13ndash415
doi101016jearscirev200803001 2008Apel E C Emmons L K Karl T Flocke F Hills A J Madronich S Lee-Taylor J
Fried A Weibring P Walega J Richter D Tie X Mauldin L Campos T Wein-heimer A Knapp D Sive B Kleinman L Springston S Zaveri R Ortega J Voss PBlake D Baker A Warneke C Welsh-Bon D de Gouw J Zheng J Zhang R10
Rudolph J Junkermann W and Riemer D D Chemical evolution of volatile organiccompounds in the outflow of the Mexico City Metropolitan area Atmos Chem Phys 102353ndash2375 doi105194acp-10-2353-2010 2010
Barth M McFadden J P Sun J L Wiedinmyer C Chuang P Collins D Griffin R Hanni-gan M Karl T Kim S W Lasher-Trapp S Levis S Litvak M Mahowald N Moore K15
Nandi S Nemitz E Nenes A Potosnak M Raymond T M Smith J Still C andStroud C Coupling between land ecosystems and the atmospheric hydrologic cycle throughbiogenic aerosol pathways B Am Meterol Soc 86 1738ndash1742 doi101175bams-86-12-1738 2005
Battaglia M A Rocca M E Rhoades C C and Ryan M G Surface fuel loadings within20
mulching treatments in Colorado coniferous forests Forest Ecol Manag 260 1557ndash1566doi101016jforeco201008004 2010
Beier C Beierkuhnlein C Wohlgemuth T Penuelas J Emmett B Korner C deBoeck H J Christensen J H Leuzinger S Janssens I A and Hansen K Precipitationmanipulation experiments ndash challenges and recommendations for the future Ecol Lett 1525
899ndash911 doi101111j1461-0248201201793x 2012Bench G Fallon S Schichtel B Malm W and McDade C Relative contributions of fossil
and contemporary carbon sources to PM25 aerosols at nine Interagency Monitoring for Pro-tection of Visual Environments (IMPROVE) network sites J Geophys Res-Atmos 112 10doi1010292006jd007708 200730
Berkelhammer M Hu J Bailey A Noone D C Still C Barnard H Gochis DHsiao G S Rahn T and Turnipseed A The nocturnal water cycle in an open-canopyforest J Geophys Res-Atmos 118 10225ndash10242 doi101002jgrd50701 2013
1683
ACPD14 1647ndash1709 2014
Overview of theManitou
Experimental ForestObservatory
J Ortega et al
Title Page
Abstract Introduction
Conclusions References
Tables Figures
J I
J I
Back Close
Full Screen Esc
Printer-friendly Version
Interactive Discussion
Discussion
Paper
|D
iscussionP
aper|
Discussion
Paper
|D
iscussionP
aper|
Burgess S S O Adams M A Turner N C Beverly C R Ong C K Khan A A H andBleby T M An improved heat pulse method to measure low and reverse rates of sap flowin woody plants Tree Physiol 21 589ndash598 2001
Carslaw K S Boucher O Spracklen D V Mann G W Rae J G L Woodward S andKulmala M A review of natural aerosol interactions and feedbacks within the Earth system5
Atmos Chem Phys 10 1701ndash1737 doi105194acp-10-1701-2010 2010Cerully K M Raatikainen T Lance S Tkacik D Tiitta P Petaumljauml T Ehn M Kulmala M
Worsnop D R Laaksonen A Smith J N and Nenes A Aerosol hygroscopicity andCCN activation kinetics in a boreal forest environment during the 2007 EUCAARI campaignAtmos Chem Phys 11 12369ndash12386 doi105194acp-11-12369-2011 201110
Constantinidou H A Hirano S S Baker L S Upper C D Atmospheric dispersal of icenucleation-active bacteria the role of rain Phytopathology 80 934ndash937 1990
Cross E S Hunter J F Carrasquillo A J Franklin J P Herndon S C Jayne J TWorsnop D R Miake-Lye R C and Kroll J H Online measurements of the emissionsof intermediate-volatility and semi-volatile organic compounds from aircraft Atmos Chem15
Phys 13 7845ndash7858 doi105194acp-13-7845-2013 2013Day D A Wooldridge P J Dillon M B Thornton J A and Cohen R C A thermal dissoci-
ation laser-induced fluorescence instrument for in situ detection of NO2 peroxy nitrates alkylnitrates and HNO3 J Geophys Res-Atmos 107 14 doi1010292001jd000779 2002
Day D A Wooldridge P J and Cohen R C Observations of the effects of temperature20
on atmospheric HNO3 ΣANs ΣPNs and NOx evidence for a temperature-dependent HOxsource Atmos Chem Phys 8 1867ndash1879 doi105194acp-8-1867-2008 2008
DeCarlo P F Kimmel J R Trimborn A Northway M J Jayne J T Aiken A C Go-nin M Fuhrer K Horvath T Docherty K S Worsnop D R and Jimenez J LField-deployable high-resolution time-of-flight aerosol mass spectrometer Anal Chem 7825
8281ndash8289 doi101021ac061249n 2006DeMott P J and Prenni A J New directions need for defining the numbers and
sources of biological aerosols acting as ice nuclei Atmos Environ 44 1944ndash1945doi101016jatmosenv201002032 2010a
DeMott P J Prenni A J Liu X Kreidenweis S M Petters M D Twohy C H Richard-30
son M S Eidhammer T and Rogers D C Predicting global atmospheric ice nucleidistributions and their impacts on climate P Natl Acad Sci USA 107 11217ndash11222doi101073pnas0910818107 2010b
1684
ACPD14 1647ndash1709 2014
Overview of theManitou
Experimental ForestObservatory
J Ortega et al
Title Page
Abstract Introduction
Conclusions References
Tables Figures
J I
J I
Back Close
Full Screen Esc
Printer-friendly Version
Interactive Discussion
Discussion
Paper
|D
iscussionP
aper|
Discussion
Paper
|D
iscussionP
aper|
Denman K L Brasseur G Chidthaisong A Ciais P Cox P M Dickinson R E Hauglus-taine D Heinze C Holland E Jacob D Lohmann U Ramachandran S da Silva DiasP L Wofsy S C and Zhang X Couplings Between Changes in the Climate Systemand Biogeochemistry in Climate Change 2007 The Physical Science Basis Contributionof Working Group I to the Fourth Assessment Report of the Intergovernmental Panel on Cli-5
mate Change edited by Solomon S Qin D Manning M Chen Z Marquis M AverytK B Tignor M and Miller H L Cambridge University Press Cambridge United Kingdomand New York NY USA 2007
DiGangi J P Boyle E S Karl T Harley P Turnipseed A Kim S Cantrell CMaudlin III R L Zheng W Flocke F Hall S R Ullmann K Nakashima Y Paul J B10
Wolfe G M Desai A R Kajii Y Guenther A and Keutsch F N First direct mea-surements of formaldehyde flux via eddy covariance implications for missing in-canopyformaldehyde sources Atmos Chem Phys 11 10565ndash10578 doi105194acp-11-10565-2011 2011
DiGangi J P Henry S B Kammrath A Boyle E S Kaser L Schnitzhofer R Graus M15
Turnipseed A Park J-H Weber R J Hornbrook R S Cantrell C A Maudlin III R LKim S Nakashima Y Wolfe G M Kajii Y Apel EC Goldstein A H Guenther AKarl T Hansel A and Keutsch F N Observations of glyoxal and formaldehyde as metricsfor the anthropogenic impact on rural photochemistry Atmos Chem Phys 12 9529ndash9543doi105194acp-12-9529-2012 201220
Dube W P Brown S S Osthoff H D Nunley M R Ciciora S J Paris M W McLaugh-lin R J and Ravishankara A R Aircraft instrument for simultaneous in situ measure-ment of NO3 and N2O5 via pulsed cavity ring-down spectroscopy Rev Sci Instrum 77 11doi10106312176058 2006
Eisele F L and Tanner D J Ion-assisted tropospheric oh measurements J Geophys Res-25
Atmos 96 9295ndash9308 doi10102991jd00198 1991Eisele F L and Tanner D J Measurement of the gas-phase concentration of H2SO4 and
methane sulfonic-acid and estimates of H2SO4 production and loss in the atmosphere JGeophys Res-Atmos 98 9001ndash9010 doi10102993jd00031 1993
Elbert W Taylor P E Andreae M O and Poumlschl U Contribution of fungi to primary biogenic30
aerosols in the atmosphere wet and dry discharged spores carbohydrates and inorganicions Atmos Chem Phys 7 4569ndash4588 doi105194acp-7-4569-2007 2007
1685
ACPD14 1647ndash1709 2014
Overview of theManitou
Experimental ForestObservatory
J Ortega et al
Title Page
Abstract Introduction
Conclusions References
Tables Figures
J I
J I
Back Close
Full Screen Esc
Printer-friendly Version
Interactive Discussion
Discussion
Paper
|D
iscussionP
aper|
Discussion
Paper
|D
iscussionP
aper|
Eller A S D Harley P and Monson R K Potential contribution of exposed resin to ecosys-tem emissions of monoterpenes Atmos Environ 77 440ndash444 2013
Farmer D K and Cohen R C Observations of HNO3 ΣAN ΣPN and NO2 fluxes evidencefor rapid HOx chemistry within a pine forest canopy Atmos Chem Phys 8 3899ndash3917doi105194acp-8-3899-2008 20085
Fast J D Gustafson W I Easter R C Zaveri R A Barnard J C Chapman E GGrell G A and Peckham S E Evolution of ozone particulates and aerosol direct radia-tive forcing in the vicinity of Houston using a fully coupled meteorology-chemistry-aerosolmodel J Geophys Res-Atmos 111 D21305 doi1010292005jd006721 2006
Fornwalt P J Kaufmann M R and Stohlgren T J Impacts of mixed severity wildfire on10
exotic plants in a Colorado ponderosa pine-Douglas-fir forest Biol Invasions 12 2683ndash2695 doi101007s10530-009-9674-2 2010
Fry J L Draper D C Zarzana K J Campuzano-Jost P Day D A Jimenez J LBrown S S Cohen R C Kaser L Hansel A Cappellin L Karl T Hodzic Roux ATurnipseed A Cantrell C Lefer B L and Grossberg N Observations of gas- and15
aerosol-phase organic nitrates at BEACHON-RoMBAS 2011 Atmos Chem Phys 138585ndash8605 doi105194acp-13-8585-2013 2013
Gary H L A Summary of Research at the Manitou Experimental Forest in Colorado 1937ndash1983 US Department of Agriculture Forest Service Publication Rocky Mountain Forest andRange Experiment Station Fort Collins CO 198520
Geron C Carbonaceous aerosol over a Pinus taeda forest in Central North Carolina USAAtmos Environ 43 959ndash969 doi101016jatmosenv200810053 2009
Geron C Carbonaceous aerosol characteristics over a Pinus taeda plantation results from theCELTIC experiment Atmos Environ 45 794ndash801 doi101016jatmosenv201007015201125
Greenberg J P Asensio D Turnipseed A Guenther A B Karl T and Gochis D Contribu-tion of leaf and needle litter to whole ecosystem BVOC fluxes Atmos Environ 59 302ndash311doi101016jatmosenv201204038 2012
Grell G A Peckham S E Schmitz R McKeen S A Frost G Skamarock W C andElder B Fully coupled ldquoonlinerdquo chemistry within the WRF model Atmos Environ 39 6957ndash30
6975 doi101016jatmosenv200504027 2005Gunthe S S King S M Rose D Chen Q Roldin P Farmer D K Jimenez J L
Artaxo P Andreae M O Martin S T and Poumlschl U Cloud condensation nuclei in
1686
ACPD14 1647ndash1709 2014
Overview of theManitou
Experimental ForestObservatory
J Ortega et al
Title Page
Abstract Introduction
Conclusions References
Tables Figures
J I
J I
Back Close
Full Screen Esc
Printer-friendly Version
Interactive Discussion
Discussion
Paper
|D
iscussionP
aper|
Discussion
Paper
|D
iscussionP
aper|
pristine tropical rainforest air of Amazonia size-resolved measurements and modeling ofatmospheric aerosol composition and CCN activity Atmos Chem Phys 9 7551ndash7575doi105194acp-9-7551-2009 2009
Guenther A Kulmala M Turnipseed A Rinne J Suni T and Reissell A Integrated landecosystem-atmosphere processes study (iLEAPS) assessment of global observational net-5
works Boreal Environ Res 16 321ndash336 2011Haman C L Lefer B and Morris G A Seasonal variability in the diurnal evolution of the
boundary layer in a near-coastal urban environment J Atmos Ocean Tech 29 697ndash710doi101175jtech-d-11-001141 2012
Harley P Fridd-Stroud V Greenberg J Guenther A and Vasconcellos P Emission of10
2-methyl-3-buten-2-ol by pines a potentially large natural source of reactive carbon to theatmosphere J Geophys Res-Atmos 103 25479ndash25486 doi10102998jd00820 1998
Heald C L Wilkinson M J Monson R K Alo C A Wang G L and Guenther A Re-sponse of isoprene emission to ambient CO2 changes and implications for global budgetsGlob Change Biol 15 1127ndash1140 doi101111j1365-2486200801802x 200915
Hoffmann T Bandur R Hoffmann S and Warscheid B On-line characterization of gaseousand particulate organic analytes using atmospheric pressure chemical ionization mass spec-trometry Spectrochim Acta B 57 1635ndash1647 doi101016s0584-8547(02)00111-8 2002
Hofzumahaus A Rohrer F Lu K D Bohn B Brauers T Chang C C Fuchs H Hol-land F Kita K Kondo Y Li X Lou S R Shao M Zeng L M Wahner A and20
Zhang Y H Amplified trace gas removal in the Troposphere Science 324 1702ndash1704doi101126science1164566 2009
Hottle J R Huisman A J Digangi J P Kammrath A Galloway M M Coens K LKeutsch F N A laser induced fluorescence-based instrument for in-situ measurementsof atmospheric formaldehyde Environ Sci Technol 43 790ndash795 doi101021es801621f25
2009Huffman J A Docherty K S Aiken A C Cubison M J Ulbrich I M DeCarlo P F
Sueper D Jayne J T Worsnop D R Ziemann P J and Jimenez J L Chemically-resolved aerosol volatility measurements from two megacity field studies Atmos ChemPhys 9 7161ndash7182 doi105194acp-9-7161-2009 200930
Huffman J A Prenni A J DeMott P J Poumlhlker C Mason R H Robinson N HFroumlhlich-Nowoisky J Tobo Y Despreacutes V R Garcia E Gochis D J Harris E Muumlller-Germann I Ruzene C Schmer B Sinha B Day D A Andreae M O Jimenez J L
1687
ACPD14 1647ndash1709 2014
Overview of theManitou
Experimental ForestObservatory
J Ortega et al
Title Page
Abstract Introduction
Conclusions References
Tables Figures
J I
J I
Back Close
Full Screen Esc
Printer-friendly Version
Interactive Discussion
Discussion
Paper
|D
iscussionP
aper|
Discussion
Paper
|D
iscussionP
aper|
Gallagher M Kreidenweis S M Bertram A K and Poumlschl U High concentrations ofbiological aerosol particles and ice nuclei during and after rain Atmos Chem Phys 136151ndash6164 doi105194acp-13-6151-2013 2013
Huisman A J Hottle J R Coens K L DiGangi J P Galloway M M Kammrath A andKeutsch F N Laser-induced phosphorescence for the in situ detection of glyoxal at part per5
trillion mixing ratios Anal Chem 80 5884ndash5891 doi101021ac800407b 2008Jaatinen A Hamed A Joutsensaari J Mikkonen S Birmili W Wehner B Spindler G
Wiedensohler A Decesari S Mircea M Facchini M C Junninen H Kulmala M Lehti-nen K E J and Laaksonen A A comparison of new particle formation events in theboundary layer at three different sites in Europe Boreal Environ Res 14 481ndash498 200910
Jones A M and Harrison R M The effects of meteorological factors on atmo-spheric bioaerosol concentrations ndash a review Sci Total Environ 326 151ndash180doi101016jscitotenv200311021 2004
Kang E Root M J Toohey D W and Brune W H Introducing the concept of PotentialAerosol Mass (PAM) Atmos Chem Phys 7 5727ndash5744 doi105194acp-7-5727-200715
2007Karl T Potosnak M Guenther A Clark D Walker J Herrick J D and Geron C Ex-
change processes of volatile organic compounds above a tropical rain forest implicationsfor modeling tropospheric chemistry above dense vegetation J Geophys Res-Atmos 109D18306 doi1010292004jd004738 200420
Karl T Hansel A Cappellin L Kaser L Herdlinger-Blatt I and Jud W Selective measure-ments of isoprene and 2-methyl-3-buten-2-ol based on NO+ ionization mass spectrometryAtmos Chem Phys 12 11877ndash11884 doi105194acp-12-11877-2012 2012
Karl T Kaser L and Turnipseed A Eddy covariance measurements of isoprene and 232-MBO based on NO+ time-of-flight mass spectrometry Int J Mass Spectrom in press 201425
Kaser L Karl T Schnitzhofer R Graus M Herdlinger-Blatt I S DiGangi J P Sive BTurnipseed A Hornbrook R S Zheng W Flocke F M Guenther A Keutsch F NApel E and Hansel A Comparison of different real time VOC measurement techniquesin a ponderosa pine forest Atmos Chem Phys 13 2893ndash2906 doi105194acp-13-2893-2013 2013a30
Kaser L Karl T Guenther A Graus M Schnitzhofer R Turnipseed A Fischer LHarley P Madronich M Gochis D Keutsch F N and Hansel A Undisturbed and dis-turbed above canopy ponderosa pine emissions PTR-TOF-MS measurements and MEGAN
1688
ACPD14 1647ndash1709 2014
Overview of theManitou
Experimental ForestObservatory
J Ortega et al
Title Page
Abstract Introduction
Conclusions References
Tables Figures
J I
J I
Back Close
Full Screen Esc
Printer-friendly Version
Interactive Discussion
Discussion
Paper
|D
iscussionP
aper|
Discussion
Paper
|D
iscussionP
aper|
21 model results Atmos Chem Phys 13 11935ndash11947 doi105194acp-13-11935-20132013b
Kleindienst T E Jaoui M Lewandowski M Offenberg J H Lewis C W Bhave P V andEdney E O Estimates of the contributions of biogenic and anthropogenic hydrocarbons tosecondary organic aerosol at a southeastern US location Atmos Environ 41 8288ndash83005
doi101016jatmosenv200706045 2007Kim S Karl T Guenther A Tyndall G Orlando J Harley P Rasmussen R and Apel E
Emissions and ambient distributions of Biogenic Volatile Organic Compounds (BVOC) in aponderosa pine ecosystem interpretation of PTR-MS mass spectra Atmos Chem Phys10 1759ndash1771 doi105194acp-10-1759-2010 201010
Kim S Wolfe G M Mauldin L Cantrell C Guenther A Karl T Turnipseed AGreenberg J Hall S R Ullmann K Apel E Hornbrook R Kajii Y Nakashima YKeutsch F N DiGangi J P Henry S B Kaser L Schnitzhofer R Graus M Hansel AZheng W and Flocke F F Evaluation of HOx sources and cycling using measurement-constrained model calculations in a 2-methyl-3-butene-2-ol (MBO) and monoterpene (MT)15
dominated ecosystem Atmos Chem Phys 13 2031ndash2044 doi105194acp-13-2031-2013 2013
Kirkby J Curtius J Almeida J Dunne E Duplissy J Ehrhart S Franchin A Gagne SIckes L Kurten A Kupc A Metzger A Riccobono F Rondo L Schobesberger STsagkogeorgas G Wimmer D Amorim A Bianchi F Breitenlechner M David A Dom-20
men J Downard A Ehn M Flagan R C Haider S Hansel A Hauser D Jud WJunninen H Kreissl F Kvashin A Laaksonen A Lehtipalo K Lima J Lovejoy E RMakhmutov V Mathot S Mikkila J Minginette P Mogo S Nieminen T Onnela APereira P Petaja T Schnitzhofer R Seinfeld J H Sipila M Stozhkov Y Stratmann FTome A Vanhanen J Viisanen Y Vrtala A Wagner P E Walther H Weingartner E25
Wex H Winkler P M Carslaw K S Worsnop D R Baltensperger U and Kulmala MRole of sulphuric acid ammonia and galactic cosmic rays in atmospheric aerosol nucleationNature 476 429ndashU477 doi101038nature10343 2011
Kleindienst T E Jaoui M Lewandowski M Offenberg J H Lewis C W Bhave P V andEdney E O Estimates of the contributions of biogenic and anthropogenic hydrocarbons to30
secondary organic aerosol at a southeastern US location Atmos Environ 41 8288ndash8300doi101016jatmosenv200706045 2007
1689
ACPD14 1647ndash1709 2014
Overview of theManitou
Experimental ForestObservatory
J Ortega et al
Title Page
Abstract Introduction
Conclusions References
Tables Figures
J I
J I
Back Close
Full Screen Esc
Printer-friendly Version
Interactive Discussion
Discussion
Paper
|D
iscussionP
aper|
Discussion
Paper
|D
iscussionP
aper|
Kulmala M Riipinen I Sipila M Manninen H E Petaja T Junninen H Dal Maso MMordas G Mirme A Vana M Hirsikko A Laakso L Harrison R M Hanson I Le-ung C Lehtinen K E J and Kerminen V M Toward direct measurement of atmosphericnucleation Science 318 89ndash92 doi101126science1144124 2007
Kurpius M R and Goldstein A H Gas-phase chemistry dominates O3 loss to a forest imply-5
ing a source of aerosols and hydroxyl radicals to the atmosphere Geophys Res Lett 301371 doi1010292002gl016785 2003
Lelieveld J Butler T M Crowley J N Dillon T J Fischer H Ganzeveld L Harder HLawrence M G Martinez M Taraborrelli D and Williams J Atmospheric oxidation ca-pacity sustained by a tropical forest Nature 452 737ndash740 doi101038nature06870 200810
Levin E J T Prenni A J Petters M D Kreidenweis S M Sullivan R C Atwood S AOrtega J DeMott P J and Smith J N An annual cycle of size-resolved aerosolhygroscopicity at a forested site in Colorado J Geophys Res-Atmos 117 D06201doi1010292011jd016854 2012
Levin E J T Prenni A J Palm B Day D Campuzano-Jost P Winkler P M Kreiden-15
weis S M DeMott P J Jimenez J and Smith J N Size-resolved aerosol compositionand link to hygroscopicity at a forested site in Colorado Atmos Chem Phys Discuss 1323817ndash23843 doi105194acpd-13-23817-2013 2013
Lewandowski M Piletic I R Kleindienst T E Offenberg J H Beaver M R Jaoui MDocherty K S and Edney E O Secondary organic aerosol characterisation at field sites20
across the United States during the spring-summer period Int J Environ An Ch 93 1084ndash1103 doi101080030673192013803545 2013
Lewis C W Klouda G A and Ellenson W D Radiocarbon measurement of the biogeniccontribution to summertime PM25 ambient aerosol in Nashville TN Atmos Environ 386053ndash6061 doi101016jatmosenv200406011 200425
Lezberg A L Battaglia M A Shepperd W D and Schoettle A W Decades-old silviculturaltreatments influence surface wildfire severity and post-fire nitrogen availability in a ponderosapine forest Forest Ecol Manag 255 49ndash61 doi101016jforeco200708019 2008
Linkhart B D and Reynolds R T Lifetime reproduction of Flammulated Owls in Colorado JRaptor Res 40 29ndash37 doi1033560892-1016(2006)40[29lrofoi]20co2 200630
Linkhart B D and Reynolds R T Return rate fidelity and dispersal in a breeding pop-ulation of flammulated owls (Otus flammeolus) Auk 124 264ndash275 doi1016420004-8038(2007)124[264rrfadi]20co2 2007
1690
ACPD14 1647ndash1709 2014
Overview of theManitou
Experimental ForestObservatory
J Ortega et al
Title Page
Abstract Introduction
Conclusions References
Tables Figures
J I
J I
Back Close
Full Screen Esc
Printer-friendly Version
Interactive Discussion
Discussion
Paper
|D
iscussionP
aper|
Discussion
Paper
|D
iscussionP
aper|
Mahowald N Ward D S Kloster S Flanner M G Heald C L Heavens N G Hess P GLamarque J F and Chuang P Y Aerosol impacts on climate and biogeochemistry AnnuRev Env Resour 36 45ndash74 doi101146annurev-environ-042009-094507 2011
Mao J Ren X Zhang L Van Duin D M Cohen R C Park J-H Goldstein A HPaulot F Beaver M R Crounse J D Wennberg P O DiGangi J P Henry S B5
Keutsch F N Park C Schade G W Wolfe G M Thornton J A and Brune W HInsights into hydroxyl measurements and atmospheric oxidation in a California forest AtmosChem Phys 12 8009ndash8020 doi105194acp-12-8009-2012 2012
Massman W J Frank J M and Mooney S J Advancing investigation and physical modelingof first-order fire effects on soils Fire Ecology 6 36ndash54 doi104996fireecology060103610
2010Matsui H Koike M Kondo Y Takegawa N Wiedensohler A Fast J D and Zaveri R A
Impact of new particle formation on the concentrations of aerosols and cloud condensationnuclei around Beijing J Geophys Res-Atmos 116 19 doi1010292011jd016025 2011
Mirme S Mirme A Minikin A Petzold A Hotilderrak U Kerminen V -M and Kulmala M15
Atmospheric sub-3 nm particles at high altitudes Atmos Chem Phys 10 437ndash451doi105194acp-10-437-2010 2010
Morris C E Conen F Huffman J A Phillips V Poumlschl U and Sands D C Bio-precipitation a feedback cycle linking Earth history ecosystem dynamics and land usethrough biological ice nucleators in the atmosphere Glob Change Biol 20 341ndash35120
doi101111gcb12447 2014Moteki N Kondo Y and Nakamura S Method to measure refractive indices of small non-
spherical particles application to black carbon particles J Aerosol Sci 41 513ndash521 2010Orlando J J and Tyndall G S Laboratory studies of organic peroxy radical chemistry an
overview with emphasis on recent issues of atmospheric significance Chem Soc Rev 4125
8213ndash8213 2012Ortega A M Day D A Cubison M J Brune W H Bon D de Gouw J A and
Jimenez J L Secondary organic aerosol formation and primary organic aerosol oxida-tion from biomass-burning smoke in a flow reactor during FLAME-3 Atmos Chem Phys13 11551ndash11571 doi105194acp-13-11551-2013 201330
Paasonen P Asmi A Petaja T Kajos M K Aijala M Junninen H Holst T Ab-batt J P D Arneth A Birmili W van der Gon H D Hamed A Hoffer A Laakso LLaaksonen A Leaitch W R Plass-Dulmer C Pryor S C Raisanen P Swietlicki E
1691
ACPD14 1647ndash1709 2014
Overview of theManitou
Experimental ForestObservatory
J Ortega et al
Title Page
Abstract Introduction
Conclusions References
Tables Figures
J I
J I
Back Close
Full Screen Esc
Printer-friendly Version
Interactive Discussion
Discussion
Paper
|D
iscussionP
aper|
Discussion
Paper
|D
iscussionP
aper|
Wiedensohler A Worsnop D R Kerminen V M and Kulmala M Warming-induced in-crease in aerosol number concentration likely to moderate climate change Nat Geosci 6438ndash442 doi101038ngeo1800 2013
Peeters J Nguyen T L and Vereecken L HOx radical regeneration in the oxidation ofisoprene Phys Chem Chem Phys 11 5935ndash5939 doi101039b908511d 20095
Petters M D and Kreidenweis S M A single parameter representation of hygroscopicgrowth and cloud condensation nucleus activity Atmos Chem Phys 7 1961ndash1971doi105194acp-7-1961-2007 2007
Poumlhlker C Wiedemann K T Sinha B Shiraiwa M Gunthe S S Smith M Su H Ar-taxo P Chen Q Cheng Y F Elbert W Gilles M K Kilcoyne A L D Moffet R C10
Weigand M Martin S T Poeschl U and Andreae M O Biogenic potassium salt par-ticles as seeds for secondary organic aerosol in the Amazon Science 337 1075ndash1078doi101126science1223264 2012
Poumlschl U Martin S T Sinha B Chen Q Gunthe S S Huffman J A Borrmann SFarmer D K Garland R M Helas G Jimenez J L King S M Manzi A Mikhailov E15
Pauliquevis T Petters M D Prenni A J Roldin P Rose D Schneider J Su HZorn S R Artaxo P and Andreae M O Rainforest aerosols as biogenic nuclei of cloudsand precipitation in the Amazon Science 329 1513ndash1516 doi101126science11910562010
Prenni A J Tobo Y Garcia E DeMott P J Huffman J A McCluskey C S Krei-20
denweis S M Prenni J E Pohlker C and Poschl U The impact of rain on icenuclei populations at a forested site in Colorado Geophys Res Lett 40 227ndash231doi1010292012gl053953 2013
Pryor S C Spaulding A M and Barthelmie R J New particle formation in the MidwesternUSA event characteristics meteorological context and vertical profiles Atmos Environ 4425
4413ndash4425 doi101016jatmosenv201007045 2010Pryor S C Barthelmie R J and Hornsby K E Size-resolved particle fluxes and vertical
gradients over and in a sparse pine forest Aerosol Sci Tech 47 1248ndash1257 2013Rhoades C C Battaglia M A Rocca M E and Ryan M G Short- and medium-term
effects of fuel reduction mulch treatments on soil nitrogen availability in Colorado conifer30
forests Forest Ecol Manag 276 231ndash238 doi101016jforeco201203028 2012
1692
ACPD14 1647ndash1709 2014
Overview of theManitou
Experimental ForestObservatory
J Ortega et al
Title Page
Abstract Introduction
Conclusions References
Tables Figures
J I
J I
Back Close
Full Screen Esc
Printer-friendly Version
Interactive Discussion
Discussion
Paper
|D
iscussionP
aper|
Discussion
Paper
|D
iscussionP
aper|
Robinson N H Allan J D Huffman J A Kaye P H Foot V E and Gallagher MCluster analysis of WIBS single-particle bioaerosol data Atmos Meas Tech 6 337ndash347doi105194amt-6-337-2013 2013
Rogers D C DeMott P J Kreidenweis S M and Chen Y L A continuous-flow diffusionchamber for airborne measurements of ice nuclei J Atmos Ocean Tech 18 725ndash7415
doi1011751520-0426(2001)018lt0725acfdcfgt20co2 2001Rollins A W Smith J D Wilson K R and Cohen R C Real time in situ detec-
tion of organic nitrates in atmospheric aerosols Environ Sci Technol 44 5540ndash5545doi101021es100926x 2010
Sadanaga Y Yoshino A Watanabe K Yoshioka A Wakazono Y Kanaya Y and Ka-10
jii Y Development of a measurement system of OH reactivity in the atmosphere byusing a laser-induced pump and probe technique Rev Sci Instrum 75 2648ndash2655doi10106311775311 2004
Schobesberger S Vaananen R Leino K Virkkula A Backman J Pohja T Siivola EFranchin A Mikkila J Paramonov M Aalto P P Krejci R Petaja T and Kulmala M15
Airborne measurements over the boreal forest of southern Finland during new particle for-mation events in 2009 and 2010 Boreal Environ Res 18 145ndash163 2013
Schumacher C J Poumlhlker C Aalto P Hiltunen V Petaumljauml T Kulmala M Poumlschl Uand Huffman J A Seasonal cycles of fluorescent biological aerosol particles in borealand semi-arid forests of Finland and Colorado Atmos Chem Phys 13 11987ndash1200120
doi105194acp-13-11987-2013 2013Smith J N Moore K F McMurry P H and Eisele F L Atmospheric measurements of
sub-20 nm diameter particle chemical composition by thermal desorption chemical ioniza-tion mass spectrometry Aerosol Sci Tech 38 100ndash110 doi10108002786820490249036200425
Stone D Whalley L K and Heard D E Tropospheric OH and HO2 radicals field measure-ments and model comparisons Chem Soc Rev 41 6348ndash6404 doi101039c2cs35140d2012
Tanner D J Jefferson A and Eisele F L Selected ion chemical ionization mass spectromet-ric measurement of OH J Geophys Res-Atmos 102 6415ndash6425 doi10102996jd0391930
1997Thornton J A Wooldridge P J Cohen R C Martinez M Harder H Brune W H
Williams E J Roberts J M Fehsenfeld F C Hall S R Shetter R E Wert B P
1693
ACPD14 1647ndash1709 2014
Overview of theManitou
Experimental ForestObservatory
J Ortega et al
Title Page
Abstract Introduction
Conclusions References
Tables Figures
J I
J I
Back Close
Full Screen Esc
Printer-friendly Version
Interactive Discussion
Discussion
Paper
|D
iscussionP
aper|
Discussion
Paper
|D
iscussionP
aper|
and Fried A Ozone production rates as a function of NOx abundances and HOxproduction rates in the Nashville urban plume J Geophys Res 107 4146ndash4163doi1010292001JD000932 2002
Tobo Y Prenni A J DeMott P J Huffman J A McCluskey C S Tian G Poumlhlker CPoumlschl U Kreidenweis S M Biological aerosol particles as a key determinant of ice5
nuclei populations in a forest ecosystem J Geophys Res-Atmos 118 10100ndash10110doi101002jgrd50801 2013
Vogel A L Aumlijaumllauml M Bruumlggemann M Ehn M Junninen H Petaumljauml T Worsnop D RKulmala M Williams J and Hoffmann T Online atmospheric pressure chemical ionizationion trap mass spectrometry (APCI-IT-MSn) for measuring organic acids in concentrated bulk10
aerosol ndash a laboratory and field study Atmos Meas Tech 6 431ndash443 doi105194amt-6-431-2013 2013
Vorosmarty C J McIntyre P B Gessner M O Dudgeon D Prusevich A Green P Glid-den S Bunn S E Sullivan C A Liermann C R and Davies P M Global threats tohuman water security and river biodiversity Nature 467 555ndash561 doi101038nature0944015
2010Wagner N L Dubeacute W P Washenfelder R A Young C J Pollack I B Ryerson T B and
Brown S S Diode laser-based cavity ring-down instrument for NO3 N2O5 NO NO2 andO3 from aircraft Atmos Meas Tech 4 1227ndash1240 doi105194amt-4-1227-2011 2011
Wolfe G M Thornton J A Bouvier-Brown N C Goldstein A H Park J-H McKay M20
Matross D M Mao J Brune W H LaFranchi B W Browne E C Min K-EWooldridge P J Cohen R C Crounse J D Faloona I C Gilman J B Kuster W Cde Gouw J A Huisman A and Keutsch F N The Chemistry of Atmosphere-Forest Ex-change (CAFE) Model ndash Part 2 Application to BEARPEX-2007 observations Atmos ChemPhys 11 1269ndash1294 doi105194acp-11-1269-2011 201125
Wolfe G M Cantrell C Kim S Mauldin III R L Karl T Harley P Turnipseed A ZhengW Flocke F Apel E C Hornbrook R S Hall S R Ullmann K Henry S B DiGangiJ P Boyle E S Kaser L Schnitzhofer R Hansel A Graus M Nakashima Y Kajii YGuenther A and Keutsch F N Missing peroxy radical sources within a rural forest canopyAtmos Chem Phys Discuss 13 31713ndash31759 doi105194acpd-13-31713-2013 201330
Yatavelli R L N Lopez-Hilfiker F Wargo J D Kimmel J R Cubison M J Bertram T HJimenez J L Gonin M Worsnop D R and Thornton J A A Chemical Ionization High-Resolution Time-of-Flight Mass Spectrometer Coupled to a Micro Orifice Volatilization Im-
1694
ACPD14 1647ndash1709 2014
Overview of theManitou
Experimental ForestObservatory
J Ortega et al
Title Page
Abstract Introduction
Conclusions References
Tables Figures
J I
J I
Back Close
Full Screen Esc
Printer-friendly Version
Interactive Discussion
Discussion
Paper
|D
iscussionP
aper|
Discussion
Paper
|D
iscussionP
aper|
pactor (MOVI-HRToF-CIMS) for analysis of gas and particle-phase organic species AerosolSci Tech 46 1313ndash1327 doi101080027868262012712236 2012
Yatavelli R L N Stark H Thompson S L Kimmel J R Cubison M J Day D ACampuzano-Jost P Palm B B Thornton J A Jayne J T Worsnop D R andJimenez J L Semi-continuous measurements of gasparticle partitioning of organic acids5
in a ponderosa pine forest using a MOVI-HRToF-CIMS Atmos Chem Phys Discuss 1317327ndash17374 doi105194acpd-13-17327-2013 2013
Zhang H F Worton D R Lewandowski M Ortega J Rubitschun C L Park J H Kris-tensen K Campuzano-Jost P Day D A Jimenez J L Jaoui M Offenberg J H Klein-dienst T E Gilman J Kuster W C de Gouw J Park C Schade G W Frossard A A10
Russell L Kaser L Jud W Hansel A Cappellin L Karl T Glasius M Guenther AGoldstein A H Seinfeld J H Gold A Kamens R M and Surratt J D Organosul-fates as tracers for Secondary Organic Aerosol (SOA) formation from 2-methyl-3-buten-2-ol(MBO) in the Atmosphere Environ Sci Technol 46 9437ndash9446 doi101021es301648z201215
Zhao J Eisele F L Titcombe M Kuang C G and McMurry P H Chemical ioniza-tion mass spectrometric measurements of atmospheric neutral clusters using the cluster-CIMS J Geophys Res-Atmos 115 19 doi1010292009jd012606 2010
Zhao J Smith J N Eisele F L Chen M Kuang C and McMurry P H Observationof neutral sulfuric acid-amine containing clusters in laboratory and ambient measurements20
Atmos Chem Phys 11 10823ndash10836 doi105194acp-11-10823-2011 2011Zhao Y L Kreisberg N M Worton D R Teng A P Hering S V and Goldstein A H
Development of an in situ thermal desorption gas chromatography instrument for quan-tifying atmospheric semi-volatile organic compounds Aerosol Sci Tech 47 258ndash266doi101080027868262012747673 201325
1695
ACPD14 1647ndash1709 2014
Overview of theManitou
Experimental ForestObservatory
J Ortega et al
Title Page
Abstract Introduction
Conclusions References
Tables Figures
J I
J I
Back Close
Full Screen Esc
Printer-friendly Version
Interactive Discussion
Discussion
Paper
|D
iscussionP
aper|
Discussion
Paper
|D
iscussionP
aper|
a b
c
d e
i
300 m
MEFO
N
Woodland Park
CO
NM AZ
UT
WY
MT
Denver ~90 km
Colorado Springs ~40 km
0 8 16 km
ND
SD
NE
KS
ii
iii N
Fig 1 Manitou Experimental Forest Observatory (MEFO) (a) Map showing general area withinColorado and its relationship to neighboring states (b) Site location relative to the Front Rangeurban corridor including Denver and Colorado Springs (c) Close-up aerial photograph showingthe open-canopy ponderosa pine-dominated forest with the (i) micrometeorological tower (ii)chemistry tower and (iii) water manipulation experiment (d) Close up picture of Chemistrytower (e) Close of up picture of micrometeorological tower The two towers shown in (c) areapproximately 300 m apart Maps in panels (a) and (b) were produced using ArcGIS software(ESRI Inc Redlands CA)
1696
ACPD14 1647ndash1709 2014
Overview of theManitou
Experimental ForestObservatory
J Ortega et al
Title Page
Abstract Introduction
Conclusions References
Tables Figures
J I
J I
Back Close
Full Screen Esc
Printer-friendly Version
Interactive Discussion
Discussion
Paper
|D
iscussionP
aper|
Discussion
Paper
|D
iscussionP
aper|
(a) z = 28 m
0 90 180 270 360
o
f S
am
ple
s0
50
100
150
200
250
300
350
(b) z = 28 m
90 180 270 360
0
500
1000
1500
2000
2500
(c) z = 2 m
0 90 180 270 360
o
f S
am
ple
s
0
100
200
300
400
500
(d) z = 2 m
90 180 270 360
0
200
400
600
800
1000
1200
Summer 2011
Daytime
Winter 2010-2011
Nighttime
(e) z = 28 m
0 90 180 270 360
o
f S
am
ple
s
0
100
200
300
400
500
600
(f) z = 28 m
90 180 270 360
0
200
400
600
800
1000
1200
1400
1600
1800
2000
f 0
0
0 0
d
b a
c
e
Summer 2010
0
z = 28 m z = 28 m
z = 2 m z = 2 m
z = 28 m z = 28 m
Wind direction (degrees)
o
f sa
mp
les
o
f sa
mp
les
o
f sa
mp
les
Fig 2 Wind direction distributions (5 min averages binned every 10 ) from the MEFO Chem-istry tower Panels (a) (c) and (e) are daytime wind distributions (900ndash1700 MST) whereaspanels (b) (d) and (f) are for nighttime hours (2000 until 500 MST) Summer includes datafrom JunendashAugust 2010 Winter includes data from December 2010 to February 2011 Mea-surement height is noted on the panels
1697
ACPD14 1647ndash1709 2014
Overview of theManitou
Experimental ForestObservatory
J Ortega et al
Title Page
Abstract Introduction
Conclusions References
Tables Figures
J I
J I
Back Close
Full Screen Esc
Printer-friendly Version
Interactive Discussion
Discussion
Paper
|D
iscussionP
aper|
Discussion
Paper
|D
iscussionP
aper|
A
B O3
NOy
August 14-15
Win
d S
peed
m
s
0
2
4
6
8
Win
d D
irecti
on
0
90
180
270
360
Wspd
Wdir
Day of Year
2260 2265 2270 2275 2280
O3 p
pb
v
10
20
30
40
50
60
70
NO
y p
pb
v
0
2
4
6
8
10
12
14
16
18O3
NOy
a
b O3
NOx
Wind speed
Wind direction
NO
x p
pb
v
Win
d s
pe
ed
ms
O
3 p
pb
v 8
6
4
2
0 70 60 50 40 30 20 10
226 2265 227 2275 228 Day of Year (2010)
August 14-15 2010 360
270
180
90 Win
d d
ire
ctio
n
18 16 14 12 10 8 6 4 2 0
Fig 3 Time series of wind speed wind direction ozone and NOx as measured from the MEFOchemistry tower (14ndash15 August 2010) showing typical summertime patterns Meteorologicalvariables were measured at the top of the tower (251 m) and the trace gasses were measuredusing the 6 point gradient system (Table S1) Ozone deposition and resulting gradients leadto the nighttime variability In contrast NOx is nearly constant through the canopy implyingnegligible soil emissions
1698
ACPD14 1647ndash1709 2014
Overview of theManitou
Experimental ForestObservatory
J Ortega et al
Title Page
Abstract Introduction
Conclusions References
Tables Figures
J I
J I
Back Close
Full Screen Esc
Printer-friendly Version
Interactive Discussion
Discussion
Paper
|D
iscussionP
aper|
Discussion
Paper
|D
iscussionP
aper|
000
B Average annual soil moisture (2010-2012)
A Accumulated precipitation (2010-2013)
C Average annual soil temperature (2010-2012)
600
200
0
400
500
300
100
2010 2012
2011 2013
2010-2013
Monthly average precipitation
a Accumulated precipitation (2010-2013)
b Average annual soil moisture (2010-2012) 0-10 cm 20-50 cm 70-150 cm
0-10 cm 20-50 cm 70-150 cm
c Average annual soil temperature (2010-2012)
005
020
010
025
030
015
000
270
285
275
290
295
280
265
300
Pre
cip
itat
ion
(m
m)
Soil
mo
istu
re (
m3 m
-3)
Tem
pe
ratu
re (
K)
Oct Nov Dec Jan Feb Mar Apr May Jun Jul Aug Sep
Fig 4 Hydrological measurement summary at the Manitou Experimental Forest ObservatoryAnnual accumulated precipitation from rain and snow (a) soil moisture at 3 depths (b) andsoil temperature at three different depths (c) Note that the hydrological year is defined from asending on 30 September with a start date of 1 October of the preceding year Panel (a) includesdata from hydrological years 2010ndash2013 whereas panels (b) and (c) include data from 2010ndash2012
1699
ACPD14 1647ndash1709 2014
Overview of theManitou
Experimental ForestObservatory
J Ortega et al
Title Page
Abstract Introduction
Conclusions References
Tables Figures
J I
J I
Back Close
Full Screen Esc
Printer-friendly Version
Interactive Discussion
Discussion
Paper
|D
iscussionP
aper|
Discussion
Paper
|D
iscussionP
aper|
Flux [mg m-2 hr-1 m-1]
Hei
ght
[m]
Fig 5 Average daytime and nighttime vertical fluxes of monoterpenes (C10H16) and 2-methyl-3-buten-2-ol (232MBO C5H10O) during August 2010 The average daytime integrated flux ratioof MBO Monoterpenes is 165 Fluxes within plusmn01 mgmminus2 hminus1 mminus1 are shown within the shadedgrey area to indicate the detection limit Error bars indicate the standard deviation of all mea-surements for that chemical species and level
1700
ACPD14 1647ndash1709 2014
Overview of theManitou
Experimental ForestObservatory
J Ortega et al
Title Page
Abstract Introduction
Conclusions References
Tables Figures
J I
J I
Back Close
Full Screen Esc
Printer-friendly Version
Interactive Discussion
Discussion
Paper
|D
iscussionP
aper|
Discussion
Paper
|D
iscussionP
aper|
a1 232-MBO (blue) and MT (red) fluxes
a2 232-MBO (blue) and MT (red) concentrations
5-Aug 6-Aug 7-Aug 8-Aug 9-Aug 10-Aug 11-Aug
4
3
2
1
0
5
3 2
1 0
4
16
12
8
4
0
Flu
x [
mg
-2 h
r-1]
MB
O [
pp
b]
5
3
2
1
4
0
Flu
x [m
g m
-2 hr
-1] M
T [p
pb
]
3000
2500
2000
1500
1000
500
0
0000 0600 1200 1800 0000
Time of Day (MST)
b MBO (pptv)2000
1500
1000
500
0
0000 0600 1200 1800 0000
Time of Day (MST)
d Sum of Monoterpenes (pptv)
1000
800
600
400
200
0
a Isoprene (pptv)
200
150
100
50
0
c Toluene (pptv)B-1 Isoprene (pptv) B-2 Toluene (pptv)
B-3 232-MBO (pptv) B-4 Total MT (pptv)
Time (MST)
b2 Toluene
b4 Sum MT 20
15
10
00
05
10
08
06
04
02
00
000 0600 1200 1800 0000
200
150
100
50
0
000 0600 1200 1800 0000 Time (MST)
30
25
20
15
10
00
05
b3 232-MBO
b1 Isoprene Is
op
ren
e[p
pb
] M
BO
[p
pb
]
To
lue
ne
[pp
t] M
T [p
pb
]
Fig 6 (a) (adapted from Kaser et al 2013b) shows the sum of MT and MBO+ isoprene mea-surements as reported by the PTR-TOF-MS from 251 m on the chemistry tower from 4 August(DOY=216) to 11 August 2010 (DOY=223) Top panel (a-1) shows the above-canopy fluxeswhile (a-2) shows the corresponding concentrations in ppbv An intense hailstorm on the af-ternoon of 4 August 2010 (doy=216) caused the anomalously high MT concentrations andfluxes that lasted for sim2 days after the event This effect is due to mechanical disturbancewhich released MT stored in pools within the needle structures MBO which is produced dur-ing photosynthesis and immediately emitted was not noticeably affected by the event Bottompanel (b) shows diurnal profiles of (b-1) isoprene (b-2) toluene (b-3) MBO and (b-4) sumof monoterpenes during all of August 2010 as measured using TOGA Box boundaries indi-cate inter-quartile range median is indicated as the line through the box and whisker lengthsindicate the total measurement range
1701
ACPD14 1647ndash1709 2014
Overview of theManitou
Experimental ForestObservatory
J Ortega et al
Title Page
Abstract Introduction
Conclusions References
Tables Figures
J I
J I
Back Close
Full Screen Esc
Printer-friendly Version
Interactive Discussion
Discussion
Paper
|D
iscussionP
aper|
Discussion
Paper
|D
iscussionP
aper|
(a)
(b)
Hour of day (MST)
Fig 7 Average modeled and measured diurnal cycles of (a) within-canopy peroxy radical mix-ing ratios and (b) above-canopy formaldehyde fluxes The measured and modeled results forboth compounds include the hourly averages from the August 2010 BEACHON ROCS intensivemeasurement campaign Model calculations of HCHO fluxes and peroxy radicals are describedin DiGangi et al (2011) and Wolfe et al (2013) respectively
1702
ACPD14 1647ndash1709 2014
Overview of theManitou
Experimental ForestObservatory
J Ortega et al
Title Page
Abstract Introduction
Conclusions References
Tables Figures
J I
J I
Back Close
Full Screen Esc
Printer-friendly Version
Interactive Discussion
Discussion
Paper
|D
iscussionP
aper|
Discussion
Paper
|D
iscussionP
aper|
0400 0800 1200 1600 2000 0000 0000
a
b
c
HO
2 a
nd
H
O2+
RO
2 (
pp
tv)
Co
ntr
ibu
tio
n (
)
Win
d d
ire
ctio
n (deg)
150
100
50
0
100
50
0 360
270
0
90
180
NO
2 (pp
bv)
NO
(pp
bv)
15
10
05
0
6
0
2
4
6
4
2
0
Win
d sp
eed
(m s
-1)
Fig 8 Examination of RO2 fate and its relation to anthropogenic influence on 24 August 2010during BEACHON-ROCS The first panel (a) shows median concentrations of NO NO2 HO2and HO2 +RO2 over the course of this day Wind speed and direction (c) show the wind shiftingfrom out of the south to out of the southeast just prior to noon indicating an anthropogenic-influence from the Colorado Springs area This transition is also reflected in the NO increase inpanel (a) The middle panel (b) shows the calculated RO2 loss percentage from reaction withNO or HO2 based on measured NO and HO2 concentrations and on rate constants obtainedfrom the IUPAC database Each symbol in (b) represents the median value from thirty minutetime bins Figure adapted from DiGangi et al (2012)
1703
ACPD14 1647ndash1709 2014
Overview of theManitou
Experimental ForestObservatory
J Ortega et al
Title Page
Abstract Introduction
Conclusions References
Tables Figures
J I
J I
Back Close
Full Screen Esc
Printer-friendly Version
Interactive Discussion
Discussion
Paper
|D
iscussionP
aper|
Discussion
Paper
|D
iscussionP
aper|
Win
d d
ire
ctio
n [
deg
ree
s] Su
lfate ae
roso
l mass4
and
win
d sp
ee
d
1000
100
10
4 M
ob
ility
Dia
me
ter
[nm
] July 27 July 28 July 29
a
b
Mountain Standard Time
000 400 800 1200 1600 2000 000 000 400 800 1200 1600 2000 000 400 800 1200 1600 2000
105
104
103
102
101
dN
dlo
gDp [cm
-3]
Fig 9 Three representative days of particle size distributions (a) wind speed wind directionand sulfate aerosol mass (b) during 27ndash29 July 2011 In panel (a) the mobility diameter ison the y axis time is on the x axis and the color bar indicates particle number concentration(dNdlogDp) in cmminus3 In panel (b) the sulfate aerosol mass is multiplied by 4 and is listed onthe 2nd y axis along with wind speed
1704
ACPD14 1647ndash1709 2014
Overview of theManitou
Experimental ForestObservatory
J Ortega et al
Title Page
Abstract Introduction
Conclusions References
Tables Figures
J I
J I
Back Close
Full Screen Esc
Printer-friendly Version
Interactive Discussion
Discussion
Paper
|D
iscussionP
aper|
Discussion
Paper
|D
iscussionP
aper|
1705
ACPD14 1647ndash1709 2014
Overview of theManitou
Experimental ForestObservatory
J Ortega et al
Title Page
Abstract Introduction
Conclusions References
Tables Figures
J I
J I
Back Close
Full Screen Esc
Printer-friendly Version
Interactive Discussion
Discussion
Paper
|D
iscussionP
aper|
Discussion
Paper
|D
iscussionP
aper|
Fig 10 Aerosol mass spectrometer (AMS) and Single Particle Soot Photometer (SP2) resultsof bulk PM1 aerosol composition during July and August 2011 Black carbon (BC) is measuredby the SP2 and all others (organics nitrate sulfate and ammonium) are from the AMS Panel(a) shows the mass loading time series panel (b) shows the average size-resolved aerosoldistributions and panel (c) shows the diurnal trends of each of the individual species averagedover the study period In (c) the lines represent the mean values the box plot boundariesrepresent the 25th and 75th percentiles and the whisker lengths indicate the 5th and 95thpercentiles of the measurements The center line through each box indicates the median andall statistical indicators are offset for some of the species by at most plusmn02 h for clarity Note thatthe majority of the aerosol is composed of organic species and that in all panels black carbonmass has been multiplied by 6 and the other (sulfate nitrate and ammonium) speciesrsquo masseshave been multiplied by 3 The diameters for the BC measurements are estimated using anassumed density of 18 gcmminus3 as indicated in the text (Sect 33)
1706
ACPD14 1647ndash1709 2014
Overview of theManitou
Experimental ForestObservatory
J Ortega et al
Title Page
Abstract Introduction
Conclusions References
Tables Figures
J I
J I
Back Close
Full Screen Esc
Printer-friendly Version
Interactive Discussion
Discussion
Paper
|D
iscussionP
aper|
Discussion
Paper
|D
iscussionP
aper|
Lati
tud
e
405
400
395
390
385
380 -105 -106 -104 -105 -106 -104
Longitude Longitude
Fig 11 Residence Time Analysis (RTA) from WRF-Chem estimates the amount of time that airmasses originate from the various locations in the region These simulations estimate 48 hourback-trajectories at MEFO (27 July to 26 August 2011) Three major Front Range cities (DenverColorado Springs and Pueblo) are shown and open circles indicate the citiesrsquo primary coal-fired power plants The left panel indicates that the majority of the low NO2 concentration results(0ndash50th percentile) are from air masses that originate from the west The right panel shows thatthe highest 10 of NO2 concentrations originate from the Front Range cities and are advectedto the site
1707
ACPD14 1647ndash1709 2014
Overview of theManitou
Experimental ForestObservatory
J Ortega et al
Title Page
Abstract Introduction
Conclusions References
Tables Figures
J I
J I
Back Close
Full Screen Esc
Printer-friendly Version
Interactive Discussion
Discussion
Paper
|D
iscussionP
aper|
Discussion
Paper
|D
iscussionP
aper|
TOA
[m
g m
-3]
600 1200 1800 000 (MST)
+ Anthropogenic SOA
+ Biogenic SOA from NO3
+ Biogenic SOA from OH O3 Primary OA
30
25
20
15
10
05
00
Modeled and measured total organic aerosol (TOA) July 16-August 25 2011
Fig 12 Modeled and measured average diurnal profiles of total organic aerosol (TOA) massconcentrations at MEFO during BEACHON-RoMBAS-2011 Aerosol mass spectrometry (AMS)observations are shown as black circles (with 1σ variability shown in gray) Predicted TOA isindicated in yellow (with variability shown by the yellow bars) The predicted TOA is the sumof the contributions primary OA (red) biogenic secondary organic aerosol (SOA) from OHand O3 chemistry (green) biogenic SOA from NO3 nighttime chemistry (purple) and anthro-pogenic SOA (yellow) Each plot (starting with green) is additive (equal to that process plus thesum of the processes below it) eg the purple plot shows the contributions from primary OAbiogenic SOA from OH and O3 and biogenic SOA+NO3 Biogenic SOA (both day and night)are the largest contributors to TOA but anthropogenic species (gold) also make a significantcontribution
1708
ACPD14 1647ndash1709 2014
Overview of theManitou
Experimental ForestObservatory
J Ortega et al
Title Page
Abstract Introduction
Conclusions References
Tables Figures
J I
J I
Back Close
Full Screen Esc
Printer-friendly Version
Interactive Discussion
Discussion
Paper
|D
iscussionP
aper|
Discussion
Paper
|D
iscussionP
aper|
Fig 13 29 July 2011 particle size distributions observed (a) and modeled with WRF-Chem (b)White areas in panel (a) indicate that no counts were observed for that diameter particle at thattime Panel (c) shows the observed (black) and predicted (red) CCN concentrations averagedover the 10ndash15 August 2011 time period The blue circles are the simulations when nucleationis not included which demonstrates the importance of particle nucleation for CCN formation
1709

ACPD14 1647ndash1709 2014
Overview of theManitou
Experimental ForestObservatory
J Ortega et al
Title Page
Abstract Introduction
Conclusions References
Tables Figures
J I
J I
Back Close
Full Screen Esc
Printer-friendly Version
Interactive Discussion
Discussion
Paper
|D
iscussionP
aper|
Discussion
Paper
|D
iscussionP
aper|
000
B Average annual soil moisture (2010-2012)
A Accumulated precipitation (2010-2013)
C Average annual soil temperature (2010-2012)
600
200
0
400
500
300
100
2010 2012
2011 2013
2010-2013
Monthly average precipitation
a Accumulated precipitation (2010-2013)
b Average annual soil moisture (2010-2012) 0-10 cm 20-50 cm 70-150 cm
0-10 cm 20-50 cm 70-150 cm
c Average annual soil temperature (2010-2012)
005
020
010
025
030
015
000
270
285
275
290
295
280
265
300
Pre
cip
itat
ion
(m
m)
Soil
mo
istu
re (
m3 m
-3)
Tem
pe
ratu
re (
K)
Oct Nov Dec Jan Feb Mar Apr May Jun Jul Aug Sep
Fig 4 Hydrological measurement summary at the Manitou Experimental Forest ObservatoryAnnual accumulated precipitation from rain and snow (a) soil moisture at 3 depths (b) andsoil temperature at three different depths (c) Note that the hydrological year is defined from asending on 30 September with a start date of 1 October of the preceding year Panel (a) includesdata from hydrological years 2010ndash2013 whereas panels (b) and (c) include data from 2010ndash2012
1699
ACPD14 1647ndash1709 2014
Overview of theManitou
Experimental ForestObservatory
J Ortega et al
Title Page
Abstract Introduction
Conclusions References
Tables Figures
J I
J I
Back Close
Full Screen Esc
Printer-friendly Version
Interactive Discussion
Discussion
Paper
|D
iscussionP
aper|
Discussion
Paper
|D
iscussionP
aper|
Flux [mg m-2 hr-1 m-1]
Hei
ght
[m]
Fig 5 Average daytime and nighttime vertical fluxes of monoterpenes (C10H16) and 2-methyl-3-buten-2-ol (232MBO C5H10O) during August 2010 The average daytime integrated flux ratioof MBO Monoterpenes is 165 Fluxes within plusmn01 mgmminus2 hminus1 mminus1 are shown within the shadedgrey area to indicate the detection limit Error bars indicate the standard deviation of all mea-surements for that chemical species and level
1700
ACPD14 1647ndash1709 2014
Overview of theManitou
Experimental ForestObservatory
J Ortega et al
Title Page
Abstract Introduction
Conclusions References
Tables Figures
J I
J I
Back Close
Full Screen Esc
Printer-friendly Version
Interactive Discussion
Discussion
Paper
|D
iscussionP
aper|
Discussion
Paper
|D
iscussionP
aper|
a1 232-MBO (blue) and MT (red) fluxes
a2 232-MBO (blue) and MT (red) concentrations
5-Aug 6-Aug 7-Aug 8-Aug 9-Aug 10-Aug 11-Aug
4
3
2
1
0
5
3 2
1 0
4
16
12
8
4
0
Flu
x [
mg
-2 h
r-1]
MB
O [
pp
b]
5
3
2
1
4
0
Flu
x [m
g m
-2 hr
-1] M
T [p
pb
]
3000
2500
2000
1500
1000
500
0
0000 0600 1200 1800 0000
Time of Day (MST)
b MBO (pptv)2000
1500
1000
500
0
0000 0600 1200 1800 0000
Time of Day (MST)
d Sum of Monoterpenes (pptv)
1000
800
600
400
200
0
a Isoprene (pptv)
200
150
100
50
0
c Toluene (pptv)B-1 Isoprene (pptv) B-2 Toluene (pptv)
B-3 232-MBO (pptv) B-4 Total MT (pptv)
Time (MST)
b2 Toluene
b4 Sum MT 20
15
10
00
05
10
08
06
04
02
00
000 0600 1200 1800 0000
200
150
100
50
0
000 0600 1200 1800 0000 Time (MST)
30
25
20
15
10
00
05
b3 232-MBO
b1 Isoprene Is
op
ren
e[p
pb
] M
BO
[p
pb
]
To
lue
ne
[pp
t] M
T [p
pb
]
Fig 6 (a) (adapted from Kaser et al 2013b) shows the sum of MT and MBO+ isoprene mea-surements as reported by the PTR-TOF-MS from 251 m on the chemistry tower from 4 August(DOY=216) to 11 August 2010 (DOY=223) Top panel (a-1) shows the above-canopy fluxeswhile (a-2) shows the corresponding concentrations in ppbv An intense hailstorm on the af-ternoon of 4 August 2010 (doy=216) caused the anomalously high MT concentrations andfluxes that lasted for sim2 days after the event This effect is due to mechanical disturbancewhich released MT stored in pools within the needle structures MBO which is produced dur-ing photosynthesis and immediately emitted was not noticeably affected by the event Bottompanel (b) shows diurnal profiles of (b-1) isoprene (b-2) toluene (b-3) MBO and (b-4) sumof monoterpenes during all of August 2010 as measured using TOGA Box boundaries indi-cate inter-quartile range median is indicated as the line through the box and whisker lengthsindicate the total measurement range
1701
ACPD14 1647ndash1709 2014
Overview of theManitou
Experimental ForestObservatory
J Ortega et al
Title Page
Abstract Introduction
Conclusions References
Tables Figures
J I
J I
Back Close
Full Screen Esc
Printer-friendly Version
Interactive Discussion
Discussion
Paper
|D
iscussionP
aper|
Discussion
Paper
|D
iscussionP
aper|
(a)
(b)
Hour of day (MST)
Fig 7 Average modeled and measured diurnal cycles of (a) within-canopy peroxy radical mix-ing ratios and (b) above-canopy formaldehyde fluxes The measured and modeled results forboth compounds include the hourly averages from the August 2010 BEACHON ROCS intensivemeasurement campaign Model calculations of HCHO fluxes and peroxy radicals are describedin DiGangi et al (2011) and Wolfe et al (2013) respectively
1702
ACPD14 1647ndash1709 2014
Overview of theManitou
Experimental ForestObservatory
J Ortega et al
Title Page
Abstract Introduction
Conclusions References
Tables Figures
J I
J I
Back Close
Full Screen Esc
Printer-friendly Version
Interactive Discussion
Discussion
Paper
|D
iscussionP
aper|
Discussion
Paper
|D
iscussionP
aper|
0400 0800 1200 1600 2000 0000 0000
a
b
c
HO
2 a
nd
H
O2+
RO
2 (
pp
tv)
Co
ntr
ibu
tio
n (
)
Win
d d
ire
ctio
n (deg)
150
100
50
0
100
50
0 360
270
0
90
180
NO
2 (pp
bv)
NO
(pp
bv)
15
10
05
0
6
0
2
4
6
4
2
0
Win
d sp
eed
(m s
-1)
Fig 8 Examination of RO2 fate and its relation to anthropogenic influence on 24 August 2010during BEACHON-ROCS The first panel (a) shows median concentrations of NO NO2 HO2and HO2 +RO2 over the course of this day Wind speed and direction (c) show the wind shiftingfrom out of the south to out of the southeast just prior to noon indicating an anthropogenic-influence from the Colorado Springs area This transition is also reflected in the NO increase inpanel (a) The middle panel (b) shows the calculated RO2 loss percentage from reaction withNO or HO2 based on measured NO and HO2 concentrations and on rate constants obtainedfrom the IUPAC database Each symbol in (b) represents the median value from thirty minutetime bins Figure adapted from DiGangi et al (2012)
1703
ACPD14 1647ndash1709 2014
Overview of theManitou
Experimental ForestObservatory
J Ortega et al
Title Page
Abstract Introduction
Conclusions References
Tables Figures
J I
J I
Back Close
Full Screen Esc
Printer-friendly Version
Interactive Discussion
Discussion
Paper
|D
iscussionP
aper|
Discussion
Paper
|D
iscussionP
aper|
Win
d d
ire
ctio
n [
deg
ree
s] Su
lfate ae
roso
l mass4
and
win
d sp
ee
d
1000
100
10
4 M
ob
ility
Dia
me
ter
[nm
] July 27 July 28 July 29
a
b
Mountain Standard Time
000 400 800 1200 1600 2000 000 000 400 800 1200 1600 2000 000 400 800 1200 1600 2000
105
104
103
102
101
dN
dlo
gDp [cm
-3]
Fig 9 Three representative days of particle size distributions (a) wind speed wind directionand sulfate aerosol mass (b) during 27ndash29 July 2011 In panel (a) the mobility diameter ison the y axis time is on the x axis and the color bar indicates particle number concentration(dNdlogDp) in cmminus3 In panel (b) the sulfate aerosol mass is multiplied by 4 and is listed onthe 2nd y axis along with wind speed
1704
ACPD14 1647ndash1709 2014
Overview of theManitou
Experimental ForestObservatory
J Ortega et al
Title Page
Abstract Introduction
Conclusions References
Tables Figures
J I
J I
Back Close
Full Screen Esc
Printer-friendly Version
Interactive Discussion
Discussion
Paper
|D
iscussionP
aper|
Discussion
Paper
|D
iscussionP
aper|
1705
ACPD14 1647ndash1709 2014
Overview of theManitou
Experimental ForestObservatory
J Ortega et al
Title Page
Abstract Introduction
Conclusions References
Tables Figures
J I
J I
Back Close
Full Screen Esc
Printer-friendly Version
Interactive Discussion
Discussion
Paper
|D
iscussionP
aper|
Discussion
Paper
|D
iscussionP
aper|
Fig 10 Aerosol mass spectrometer (AMS) and Single Particle Soot Photometer (SP2) resultsof bulk PM1 aerosol composition during July and August 2011 Black carbon (BC) is measuredby the SP2 and all others (organics nitrate sulfate and ammonium) are from the AMS Panel(a) shows the mass loading time series panel (b) shows the average size-resolved aerosoldistributions and panel (c) shows the diurnal trends of each of the individual species averagedover the study period In (c) the lines represent the mean values the box plot boundariesrepresent the 25th and 75th percentiles and the whisker lengths indicate the 5th and 95thpercentiles of the measurements The center line through each box indicates the median andall statistical indicators are offset for some of the species by at most plusmn02 h for clarity Note thatthe majority of the aerosol is composed of organic species and that in all panels black carbonmass has been multiplied by 6 and the other (sulfate nitrate and ammonium) speciesrsquo masseshave been multiplied by 3 The diameters for the BC measurements are estimated using anassumed density of 18 gcmminus3 as indicated in the text (Sect 33)
1706
ACPD14 1647ndash1709 2014
Overview of theManitou
Experimental ForestObservatory
J Ortega et al
Title Page
Abstract Introduction
Conclusions References
Tables Figures
J I
J I
Back Close
Full Screen Esc
Printer-friendly Version
Interactive Discussion
Discussion
Paper
|D
iscussionP
aper|
Discussion
Paper
|D
iscussionP
aper|
Lati
tud
e
405
400
395
390
385
380 -105 -106 -104 -105 -106 -104
Longitude Longitude
Fig 11 Residence Time Analysis (RTA) from WRF-Chem estimates the amount of time that airmasses originate from the various locations in the region These simulations estimate 48 hourback-trajectories at MEFO (27 July to 26 August 2011) Three major Front Range cities (DenverColorado Springs and Pueblo) are shown and open circles indicate the citiesrsquo primary coal-fired power plants The left panel indicates that the majority of the low NO2 concentration results(0ndash50th percentile) are from air masses that originate from the west The right panel shows thatthe highest 10 of NO2 concentrations originate from the Front Range cities and are advectedto the site
1707
ACPD14 1647ndash1709 2014
Overview of theManitou
Experimental ForestObservatory
J Ortega et al
Title Page
Abstract Introduction
Conclusions References
Tables Figures
J I
J I
Back Close
Full Screen Esc
Printer-friendly Version
Interactive Discussion
Discussion
Paper
|D
iscussionP
aper|
Discussion
Paper
|D
iscussionP
aper|
TOA
[m
g m
-3]
600 1200 1800 000 (MST)
+ Anthropogenic SOA
+ Biogenic SOA from NO3
+ Biogenic SOA from OH O3 Primary OA
30
25
20
15
10
05
00
Modeled and measured total organic aerosol (TOA) July 16-August 25 2011
Fig 12 Modeled and measured average diurnal profiles of total organic aerosol (TOA) massconcentrations at MEFO during BEACHON-RoMBAS-2011 Aerosol mass spectrometry (AMS)observations are shown as black circles (with 1σ variability shown in gray) Predicted TOA isindicated in yellow (with variability shown by the yellow bars) The predicted TOA is the sumof the contributions primary OA (red) biogenic secondary organic aerosol (SOA) from OHand O3 chemistry (green) biogenic SOA from NO3 nighttime chemistry (purple) and anthro-pogenic SOA (yellow) Each plot (starting with green) is additive (equal to that process plus thesum of the processes below it) eg the purple plot shows the contributions from primary OAbiogenic SOA from OH and O3 and biogenic SOA+NO3 Biogenic SOA (both day and night)are the largest contributors to TOA but anthropogenic species (gold) also make a significantcontribution
1708
ACPD14 1647ndash1709 2014
Overview of theManitou
Experimental ForestObservatory
J Ortega et al
Title Page
Abstract Introduction
Conclusions References
Tables Figures
J I
J I
Back Close
Full Screen Esc
Printer-friendly Version
Interactive Discussion
Discussion
Paper
|D
iscussionP
aper|
Discussion
Paper
|D
iscussionP
aper|
Fig 13 29 July 2011 particle size distributions observed (a) and modeled with WRF-Chem (b)White areas in panel (a) indicate that no counts were observed for that diameter particle at thattime Panel (c) shows the observed (black) and predicted (red) CCN concentrations averagedover the 10ndash15 August 2011 time period The blue circles are the simulations when nucleationis not included which demonstrates the importance of particle nucleation for CCN formation
1709

ACPD14 1647ndash1709 2014
Overview of theManitou
Experimental ForestObservatory
J Ortega et al
Title Page
Abstract Introduction
Conclusions References
Tables Figures
J I
J I
Back Close
Full Screen Esc
Printer-friendly Version
Interactive Discussion
Discussion
Paper
|D
iscussionP
aper|
Discussion
Paper
|D
iscussionP
aper|
1705
ACPD14 1647ndash1709 2014
Overview of theManitou
Experimental ForestObservatory
J Ortega et al
Title Page
Abstract Introduction
Conclusions References
Tables Figures
J I
J I
Back Close
Full Screen Esc
Printer-friendly Version
Interactive Discussion
Discussion
Paper
|D
iscussionP
aper|
Discussion
Paper
|D
iscussionP
aper|
Fig 10 Aerosol mass spectrometer (AMS) and Single Particle Soot Photometer (SP2) resultsof bulk PM1 aerosol composition during July and August 2011 Black carbon (BC) is measuredby the SP2 and all others (organics nitrate sulfate and ammonium) are from the AMS Panel(a) shows the mass loading time series panel (b) shows the average size-resolved aerosoldistributions and panel (c) shows the diurnal trends of each of the individual species averagedover the study period In (c) the lines represent the mean values the box plot boundariesrepresent the 25th and 75th percentiles and the whisker lengths indicate the 5th and 95thpercentiles of the measurements The center line through each box indicates the median andall statistical indicators are offset for some of the species by at most plusmn02 h for clarity Note thatthe majority of the aerosol is composed of organic species and that in all panels black carbonmass has been multiplied by 6 and the other (sulfate nitrate and ammonium) speciesrsquo masseshave been multiplied by 3 The diameters for the BC measurements are estimated using anassumed density of 18 gcmminus3 as indicated in the text (Sect 33)
1706
ACPD14 1647ndash1709 2014
Overview of theManitou
Experimental ForestObservatory
J Ortega et al
Title Page
Abstract Introduction
Conclusions References
Tables Figures
J I
J I
Back Close
Full Screen Esc
Printer-friendly Version
Interactive Discussion
Discussion
Paper
|D
iscussionP
aper|
Discussion
Paper
|D
iscussionP
aper|
Lati
tud
e
405
400
395
390
385
380 -105 -106 -104 -105 -106 -104
Longitude Longitude
Fig 11 Residence Time Analysis (RTA) from WRF-Chem estimates the amount of time that airmasses originate from the various locations in the region These simulations estimate 48 hourback-trajectories at MEFO (27 July to 26 August 2011) Three major Front Range cities (DenverColorado Springs and Pueblo) are shown and open circles indicate the citiesrsquo primary coal-fired power plants The left panel indicates that the majority of the low NO2 concentration results(0ndash50th percentile) are from air masses that originate from the west The right panel shows thatthe highest 10 of NO2 concentrations originate from the Front Range cities and are advectedto the site
1707
ACPD14 1647ndash1709 2014
Overview of theManitou
Experimental ForestObservatory
J Ortega et al
Title Page
Abstract Introduction
Conclusions References
Tables Figures
J I
J I
Back Close
Full Screen Esc
Printer-friendly Version
Interactive Discussion
Discussion
Paper
|D
iscussionP
aper|
Discussion
Paper
|D
iscussionP
aper|
TOA
[m
g m
-3]
600 1200 1800 000 (MST)
+ Anthropogenic SOA
+ Biogenic SOA from NO3
+ Biogenic SOA from OH O3 Primary OA
30
25
20
15
10
05
00
Modeled and measured total organic aerosol (TOA) July 16-August 25 2011
Fig 12 Modeled and measured average diurnal profiles of total organic aerosol (TOA) massconcentrations at MEFO during BEACHON-RoMBAS-2011 Aerosol mass spectrometry (AMS)observations are shown as black circles (with 1σ variability shown in gray) Predicted TOA isindicated in yellow (with variability shown by the yellow bars) The predicted TOA is the sumof the contributions primary OA (red) biogenic secondary organic aerosol (SOA) from OHand O3 chemistry (green) biogenic SOA from NO3 nighttime chemistry (purple) and anthro-pogenic SOA (yellow) Each plot (starting with green) is additive (equal to that process plus thesum of the processes below it) eg the purple plot shows the contributions from primary OAbiogenic SOA from OH and O3 and biogenic SOA+NO3 Biogenic SOA (both day and night)are the largest contributors to TOA but anthropogenic species (gold) also make a significantcontribution
1708
ACPD14 1647ndash1709 2014
Overview of theManitou
Experimental ForestObservatory
J Ortega et al
Title Page
Abstract Introduction
Conclusions References
Tables Figures
J I
J I
Back Close
Full Screen Esc
Printer-friendly Version
Interactive Discussion
Discussion
Paper
|D
iscussionP
aper|
Discussion
Paper
|D
iscussionP
aper|
Fig 13 29 July 2011 particle size distributions observed (a) and modeled with WRF-Chem (b)White areas in panel (a) indicate that no counts were observed for that diameter particle at thattime Panel (c) shows the observed (black) and predicted (red) CCN concentrations averagedover the 10ndash15 August 2011 time period The blue circles are the simulations when nucleationis not included which demonstrates the importance of particle nucleation for CCN formation
1709
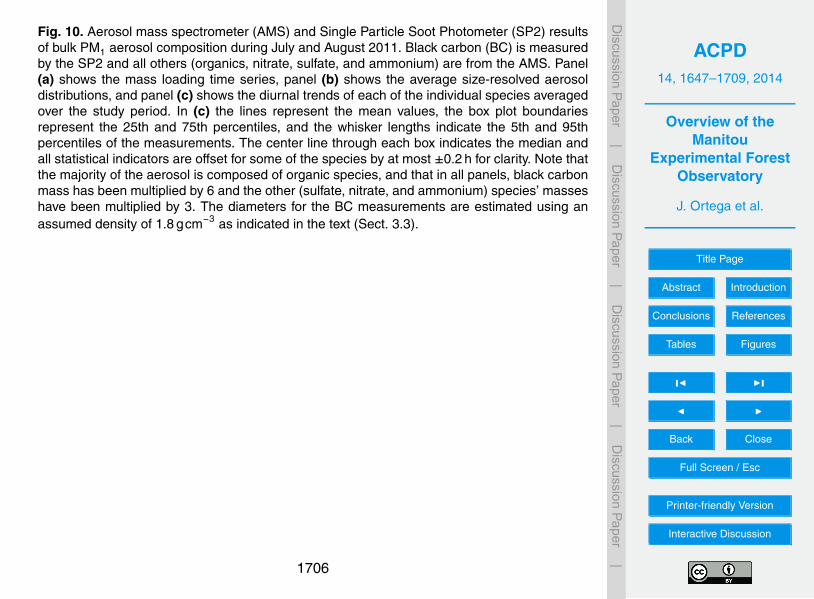
ACPD14 1647ndash1709 2014
Overview of theManitou
Experimental ForestObservatory
J Ortega et al
Title Page
Abstract Introduction
Conclusions References
Tables Figures
J I
J I
Back Close
Full Screen Esc
Printer-friendly Version
Interactive Discussion
Discussion
Paper
|D
iscussionP
aper|
Discussion
Paper
|D
iscussionP
aper|
Fig 13 29 July 2011 particle size distributions observed (a) and modeled with WRF-Chem (b)White areas in panel (a) indicate that no counts were observed for that diameter particle at thattime Panel (c) shows the observed (black) and predicted (red) CCN concentrations averagedover the 10ndash15 August 2011 time period The blue circles are the simulations when nucleationis not included which demonstrates the importance of particle nucleation for CCN formation
1709