Overview of Results from the 2009 Yemen Governance and ...
65
GOVERNANCE AND ANTI-CORRUPTION DIAGNOSTIC SURVEY THE REPUBLIC OF YEMEN World Bank * March 19, 2010 * Please contact Edouard Al-Dahdah for any questions or comments [email protected] 1 Public Disclosure Authorized Public Disclosure Authorized Public Disclosure Authorized Public Disclosure Authorized Public Disclosure Authorized Public Disclosure Authorized Public Disclosure Authorized Public Disclosure Authorized
Transcript of Overview of Results from the 2009 Yemen Governance and ...

GOVERNANCE AND ANTI-CORRUPTION DIAGNOSTIC SURVEYTHE REPUBLIC OF YEMEN
World Bank ∗
March 19, 2010
∗Please contact Edouard Al-Dahdah for any questions or comments [email protected]
1
Pub
lic D
iscl
osur
e A
utho
rized
Pub
lic D
iscl
osur
e A
utho
rized
Pub
lic D
iscl
osur
e A
utho
rized
Pub
lic D
iscl
osur
e A
utho
rized
Pub
lic D
iscl
osur
e A
utho
rized
Pub
lic D
iscl
osur
e A
utho
rized
Pub
lic D
iscl
osur
e A
utho
rized
Pub
lic D
iscl
osur
e A
utho
rized
wb350881
Typewritten Text
70583

.
Contents
1 Acknowledgments 4
2 Executive Summary 4
3 Chapter One: Introduction 4
3.1 Background . . . . . . . . . . . . . . . . . . . . . . . . . . . . . . . . . . . . 4
3.2 Rationale . . . . . . . . . . . . . . . . . . . . . . . . . . . . . . . . . . . . . 5
3.3 Survey Scope and Objectives . . . . . . . . . . . . . . . . . . . . . . . . . . . 5
3.4 Sampling Strategy . . . . . . . . . . . . . . . . . . . . . . . . . . . . . . . . 6
3.5 Timeline . . . . . . . . . . . . . . . . . . . . . . . . . . . . . . . . . . . . . . 7
3.6 Difficulties and Limitations . . . . . . . . . . . . . . . . . . . . . . . . . . . . 8
3.7 Sample Characteristics . . . . . . . . . . . . . . . . . . . . . . . . . . . . . . 9
3.8 Scope and Structure of the Report . . . . . . . . . . . . . . . . . . . . . . . 9
4 Contact with Public Service Providers 10
4.1 Contact with Public Health Services . . . . . . . . . . . . . . . . . . . . . . 13
4.2 Contact with Public Education . . . . . . . . . . . . . . . . . . . . . . . . . 15
5 User Satisfaction with Public Service Providers 16
5.1 Complaints and Service Delivery . . . . . . . . . . . . . . . . . . . . . . . . . 16
5.2 User Satisfaction with Public Health . . . . . . . . . . . . . . . . . . . . . . 17
2

5.3 User Satisfaction with Public Education . . . . . . . . . . . . . . . . . . . . 18
6 Attitudes Toward the Judiciary 19
7 Incidence of Bribes and Informal Payments 20
7.1 Public Health . . . . . . . . . . . . . . . . . . . . . . . . . . . . . . . . . . . 21
7.2 Public Education . . . . . . . . . . . . . . . . . . . . . . . . . . . . . . . . . 22
8 Reporting Corruption 22
9 Appendix A: Tables 24
10 Appendix B: Figures 46
11 Appendix C: Supplementary Information 62
3
1 Acknowledgments
The main client in this project is the Supreme National Anticorruption Committee (SNACC),headed by Mr. Ahamd al-Anssi, and which reports to the Presidency.
The team consisted of: Arun Arya (MNSED, Task Team Leader of the Technical Assistanceon Anti Corruption to Government of Yemen), Edouard Al-Dahdah (WBIG, Task TeamLeader for the Household Governance Survey), Hala Hanna (MNSED), and Audrey Sacks(WBIGV). The sampling strategy was developed by Juan Munoz and Beatriz Godoy fromSistemas Integrales. With help from the Central Statistics Office of Yemen’s Ministry ofPlanning and International Cooperation (cite them) The data collection was contracted tothe Yemen Polling Center (cite them). A special thanks to Thirumalai G Srinivasan (WalyWane? Benson Ateng?) and the staff at the Yemen Country Office in Sana’a.
2 Executive Summary
3 Chapter One: Introduction
3.1 Background
The Government of Yemen (GoY) has made significant progress in addressing governance andcorruption in the last two years. The country has taken important steps in terms of passinglegislation likely to affect the problem of corruption, such as the National Anti-CorruptionAct 2006, Financial Disclosure Act 2007 and the National Procurement Act 2007. TheYemeni parliament ratified the UN Convention against Corruption (UNCAC) on November7, 2005. Recently, the government decided to join the Extractive Industries TransparencyInitiative (EITI) to try and improve the transparency of revenue from oil reserves. Yemenhas also begun undertaking significant reforms in the area of civil service management andthe development of a comprehensive Human Resource Management System. These reformsare still at the initial stage of implementation, but make Yemen a pioneer in implementingneeded reforms in this area.
While the full implementation of these reforms should improve the quality of a country’sgovernance, Yemen has continued to lag behind in terms of its governance ratings. How-ever, because these aggregate measures primarily monitor expert opinions on the issue ofgovernance and corruption, they do not always reflect the experience of Yemeni households.
4

3.2 Rationale
One of the landmark developments was the 2006 enactment of the National Anti-CorruptionAct and the constitution of the new Supreme Authority to Combat Corruption (SNACC).SNACC has a triple mandate: taking preventive measures to minimize chances of corruption;investigating and pursuing reported cases of corruption; and, educating and raising theawareness of citizens about their rights and the legal framework to fight corruption.
The Deputy Prime Minister, in a letter dated 4 June 2007, requested the World Bankto provide Technical Assistance (TA) to the government in the area of anti-corruption, inalignment with other donors working on this agenda. The TA package to SNACC includes:conducting a baseline survey on the incidence of corruption, reviewing the existing legal andregulatory framework, developing a National Strategy and Action Plan to combat corruption,developing an investigation mechanism, and conducting training to build capacity.
One component of this TA is a diagnosis of mis-governance and corruption in specific sectorsof the Yemeni economy, through a Governance and Service Delivery survey. This deliv-ery survey will provide an assessment of Yemeni households’ experiences with public sectorgovernance and service delivery in order to provide policy-oriented advice and support themainstreaming and implementation of SNACC’s National Strategy and Action Plan to Com-bat Corruption.
In contrast with perception-based and expert opinion surveys, this document reports thefindings of a survey assessing Yemeni households’ experience with corruption in Yemen. Inaddition, while some available polls measure the opinion of the street, their questions remaingeneral. For example, while 76 percent of Yemenis think that corruption is widespreadthroughout the government (Gallup Poll, September 2009), little is known about whichpublic services are most affected by the problem, and to what extent.
3.3 Survey Scope and Objectives
The Yemen household survey focuses mainly on the nature, extent and form of corruption andthe management of public service delivery in the sectors of health, education, and justice.It surveys private citizens on their experiences and perceptions of corruption and servicedelivery in these sectors.
The objective of this household survey is to diagnose, through the scope and manifestationsof poor governance and from the lenses of access to public services, the quality of publicservices, and the obstacles to effective, accountable and transparent public service delivery.By measuring the degree of corruption in each public sector institution delivering services to
5

citizens in a scientific and nationally representative way, the survey will enable the Govern-ment of Yemen to direct its anti-corruption efforts to the sectors where corruption is mostentrenched.
As an outcome, this initiative:
• Provides benchmark data that will be used for the monitoring and evaluation of thegovernment’s performance in implementing ongoing and future reforms.
• Acts as key input towards preparation of SNACC’s National Action Plan toCombat Corruption - which is a key outcome of the WB anti-corruption TA.
• Prepares the ground for future interventions aimed at leveling obstacles to a moreresponsive, transparent, accountable, and efficient delivery of public services in Yemen.
3.4 Sampling Strategy
The survey interviewed a nationally representative sample of 1,331 households on their gen-eral perceptions of standards of living; their opinion on and experience with the integrity andaccountability of various public services providers; their experiences reporting corruption;their perception and experiences with corruption in multiple sectors including: transporta-tion and roads, judiciary, education and health. The last section inquires about respondents’personal and households characteristics.
The sampling methodology was constructed to produce a nationally representative sampleand with the objective of linking its results with the Multipurpose Household Budget Survey(HBS) 2005/2006 conducted by the Central Statistics Office (CSO). For that reason, themaster sample was the HBS sample, which in turn was based on the 2004 census. Thereforethe sampling frame was identical to that of the HBS: it was generated by the GeneralPopulation, Housing, and Establishment Census 2004. The sample frame used provides theadvantage of being up-to-date, giving stability to the selected households, and insuring theaccuracy and precision of the elements of the chosen sample.
Dwelling units (with residing households) were defined as primary sampling units (PSUs)on the urban and rural levels of each governorate, except nomadic communities, collectivehousing, and military camps. According to the administrative divisions, Yemeni householdsare spread out in 21 governorates, including the Secretariat of the Capital (Sana’a City)(see Figure 1). The study population was allocated into 38 strata, where 17 governorateswere represented by two strata (urban and rural), Sana’a City and Aden were representedby urban stratum only, while Raima and Sana’a Region where represented by only ruralstratum. This resulted in 19 urban strata and 19 rural strata.
6

The main frame of households was used to draw districts, sectors, sections, and enumerationareas included in the survey sample. Yemen HBS follows two-stage cluster sampling. Sampleis designed to produce estimate of consumption in all governorates of both rural and urbanpopulation. In the first stage, 1200 clusters were picked by a combination of probabilityproportional to size (PPS) and equal allocation of sample across strata (for allocation ofsample across strata, see Box 1). In the second stage, 12 households were picked from eachcluster by simple random sampling to make the final size of 14400 households.
For the purpose of this survey, 10 percent of the HBS sample was selected in a nationallyrepresentative manner, ensuring the coverage of all 21 governorates and 38 strata. Of the1200 HBS clusters, 129 were selected at random (10 percent of the total, plus 9 clusters toaccount for dropout rate), covering a total of 1,434 households.
3.5 Timeline
The Yemen household survey instruments were peer-reviewed on January 2009 and pre-tested in April 2009. The survey was administered in the Yemeni dialect of Arabic, in June2009. The results of this survey were first presented at a conference in December 2009 inSana’a City, in the presence of SNACC members, ministers and members of parliament, civilsociety representatives, donors, academics, and other interested stakeholders.
Training and Pilot Testing
Training of enumerators was conducted with the participation of representatives from theCentral Statistics Office. 65 field supervisors and field interviewers participated in the train-ing workshop, including 20 field supervisors. Five researchers were excluded after a weakperformance at the evaluative tests. We were left with 60 participants: 20 field supervisorsand 40 field interviewers. Every two interviewers had one field supervisor.
The trainees were divided into two groups:
• The first group involved the field supervisors and interviewers in Sana’a City, Sana’agovernorate, Ibb, Al-Mahweet, Amran, Sa’ada, Al-Jawf, Mareb and Hajjah gover-norates and the training lasted for three days May 30 - June 1, 2009. Field trainingwas conducted on Tuesday, June 2, 2009.
• The second group included the field interviewers and supervisors from Aden, Lahj,Abyan, Shabwa, Hadramout, Al-Dhale’, Dhamar, Taiz, Al-Hodeidah, Rayma. The in-
7

class training of this group lasted for three days, June 2-4. The group’s field trainingwas conducted on Friday, June 5, 2009.
The pilot testing of the sample and the questionnaire form was made on a random sam-ple comprising 70 households in six areas, namely Shibam, Al-Mahweet city, Hamdan, Al-Thawrah area in Sana’a city, Old City of Sana’a and Al-Haymah Al-Dhakhlia. The firstgroup conducted the pilot testing in Shibam, Al-Mahweet and Hamdan on Wednesday, June3, 2009, while the second group made the pilot testing in Sana’a city and Al-Hayma Al-Dakhlia on Friday, June 5, 2009.
These 70 households interviewed during the pilot test were not included in the final sample.
Data Collection
The fieldwork started on Tuesday, June 9 in the Capital Secretariat, Sana’a and Sana’agovernorate, and two days later in other governorates, with the exception of Al-Jawf, Adenand Al-Dhale where the fieldwork was delayed for security reasons beyond the field staff’scontrol. The fieldwork was concluded on Wednesday, June 24, 2009.
Control and Data Quality
While the team was working in the field, the field supervisors were responsible for checkingquestionnaire forms. The control measures include a complete review of the questionnairein its early stages and discussion of errors that occurred while collecting the data with eachfield interviewer. Likewise, the supervisors in Sana’a contacted the field interviewers andsupervisors on a daily basis and ensured the filling of the form of response rate tables.
3.6 Difficulties and Limitations
1. Security: 2.3 percent of the original sample was not covered due to security reasons.The sample had to exclude three rural clusters (Bani Dhabian in Sana’a governorate,Saqeen in Sa’ada governorate, and Kharab Al-Marashi in Al-Jawf governorate). There-fore 19 of the 21 governorates, and 34 of the 38 strata were covered. Despite the pre-cautions, the research team in Sa’ada was subject to an assault by a group of youngpeople and was asked to hand over the questionnaire forms. While no team memberwas hurt, the questionnaires were left incomplete for that PSU.
8

2. Population dispersion: field interviewers faced difficulties in reaching the targetedhouseholds because of the sample dispersion, particularly in rural areas. These prob-lems were faced most in Taiz, Ibb and Al-Mahweet governorates. Census signs wereunclear in most areas, and almost nonexistent in rural areas. Thus, the interviewersresorted to asking people where they could find the target households.
3. Response rate: Due to internal emigration and tribal conflicts, there has been a risein the number of vacant households. In particular, certain areas of the governoratesof Hadramout and Mahara were victims of severe floods in the fall of 2008, forcinghouseholds out of their dwelling. In addition, due to the nature of the sampling whichtargeted the same households as those interviewed for the HBS, targeted respondentswere identified by their name. This caused some of them to get concerned: “whyme”? The interviewers tried best to explain to the respondents that the targeting wasdue to linkages with the HBS. Enumerators and supervisors were successful enough inovercoming this challenge.
Despite these difficulties and limitations, 1,331 of the 1,434 targeted households were inter-viewed - a dropout rate of less than 8 percent (7.18 percent). Of those 1,331 households,91.81 percent (1,222) were the same households that were interviewed in 2005 for the HBS.
3.7 Sample Characteristics
The Household Survey covered heads of households who are Yemenis and who are beneficia-ries of public services. The enumerators were to speak to the head of household (breadwinnersand housewives) as they are most involved in their families’ spending. If, after two attempts,the head of household was not reachable, the enumerator could interview any other householdmember above the age of 18 that was in charge of administering household affairs.
The final sample allocation is as shown in Table 1 and 2 and Figure 1. Due to the nation-ally representative sampling strategy, geographical characteristics of the sample mirror thenational distribution of the population. For example, the Yemeni population remains ruralat 75 percent; Taiz, Ibb and Al Hodeidat are the three most populated governorates.
3.8 Scope and Structure of the Report
The report is structured as follows:
9

1. Chapter One provides general introduction and has included background to the study,justification and objectives.
2. Chapter Two addresses issues of access to public service delivery, reporting on Yemenihouseholds’ contact with ppublic service providers, with an emphasis on public health-care and education services.
3. For those who have had contact with public service providers, Chapter Three assessestheir satisfaction with the quality of these services. Specific attention is given toeducation and healthcare services.
4. Next, Chapter Four provides synthetic discussion and analysis of access to the judicialsector.
5. Chapter Five discusses and analyzes bribes and petty corruption, critical to servicedelivery and the performance of public institutions.
6. Following on from Chapter Five, Chapter Six analyzes mechanisms for reporting cor-ruption.
7. The final chapter presents general analytical governance conclusions that could bedrawn from the survey results.
4 Contact with Public Service Providers
Inflation, Cost of Living Biggest Concerns: Respondents were probed on what theysee as the most serious problem facing Yemen today. As Table 3 suggests, more respondents,20.8 percent, rank inflation as the most serious problem facing Yemen today than any otherproblem. The high cost of living is the second most cited problem (16.1 percent) followed bypolitical instability (12.2 percent), unemployment (11.9 percent) and then corruption (8.4percent). As illustrated in Table 4, the vast majority of Yemeni respondents believe that allfour of these issues are serious problems, in addition to several others including drug abuseor trafficking, lack of access to clean water, and safety concerns or crime, and, the high costof living.
Most Yemenis Interface with Public Health and Public Education Services: Re-spondents were probed on whether they have had contact with fifteen different public servicesranging from public health services to traffic police in the past six months. The majorityof respondents, 68.9 percent, have had contact with public health services in the last sixmonths. With the exception of public health, public education and electricity services, veryfew Yemenis have had contact with public service providers in the last six months (see Fig-ure 2). Less than one-fifth of respondents have had contact with social security services.
10

Only 10.1 percent of respondents have had contact with judges and court officials and only3.5 percent of respondents have had contact with the tax division.
With the available data, we do not know whether contact with public services means thatrespondents actually accessed the services. The survey only asked respondents whether theyhave accessed public health and public education services, as well as official courts. We find amoderately strong correlation between questions asking about contact with a public serviceprovider and questions asking about access to that service. The bivariate correlation betweenrespondents who said they had contact with electricity services in the last six months andrespondents who report that they have electricity at home is 0.41. The correlation betweenrespondents who have had contact with public education services and respondents whoseoldest school-age child attends school is 0.26. The correlation between respondents whohave had contact with public health services and respondents who have visited a health carefacility or whose family members visited a health care facility is 0.49. Finally, the correlationbetween respondents who report having had contact with judges and court officials in thelast six months and respondents who reported having turned to a formal court to resolve adispute is 0.38.
Contact with public services varies substantially across Yemen’s Governorates:There is substantial variation in the percent of respondents who have had contact with publicservices across governorates.
Sana’a City has the highest percentage of respondents who have had contact withjudges and court officials and traffic police within the last year:. As illustrated byTable 6, about one-third of respondents from Sana’a City and Hajjah have had contact withthe police and no one from Saadah or Al Jawf have had contact with the police. Whereasabout a quarter of respondents from Amran and Lahej have had contact with judges andcourts, only 2.2 percent of respondents from Al Hodiedah and none of the respondents fromAl Jawf have had contact with judges and courts. Whereas over a quarter of respondentsfrom Sana’a City have had contact with traffic police, less than 5 percent of respondentsfrom Haijah, Raimah, Aden, Al Hodiedah, Al Mahweet, Taiz, and Al Jawf have had contactwith traffic police.
Sana’a City and Aden have the highest percentage of respondents who havehad contact with infrastructure services within the last year: About three-quarterof the respondents from Aden, Sana’a City, and Abyan have had contact with electricityservices within the past year. By contrast, no respondent from Hajjah, Marib, Raimahand Saadah have had contact with electricity services. While over half of Aden and Sana’aCity’s respondents have had contact with telephone services, no one from Hajjah, Mariband Saadah have had contact with telephone services. Aden leads in the percentage of itsrespondents who have had contact with water and sewage services (81.6 percent) followedby Sana’a City (45.7 percent) and Lahej (42.6 percent). No respondents from Al Baydha, AlMahweet, Marib and Saadah have had contact with water and sewage services (see Table 7).
11

Respondents in former Southern Yemen are more likely to have had contact withinfrastructure and administrative services than the rest of Yemen: [ADD SOME-THING ABOUT WHY WE EXPECT SOUTHERN YEMENIS TO HAVE MORE CON-TACT WITH PUBLIC SERVICES] Using logistic regression, we test whether householdsfrom former southern Yemen, Aden, Lahej, Abyan, Shabwah and Hadramout, are more likelyto have had contact with public services while controlling for age, gender, urban/rural resi-dence, income and education levels. We find that respondents from former southern Yemenare more likely (p<.05) to have had contact with the following: public health services; thenational registration office; water and sewage services; electricity services; telephone services;pensions; and, social security. We calculate first differences of the effect of living in southernYemen in the predicted probability of having contact with these services. 1 As illustratedby Figure 3, living in the southern Yemen corresponds to a percentage point increase (withthe standard errors in parantheses) of 12.0 (0.04), 10.0 (0.04), 9.7 (0.04), 9.6 (0.03), and 5.3(0.02) in the likelihood of having contact with water and sewage services, social security,public health services, electricity services, and the national registration office.
Female, Rural Areas, the Poor, and the Uneducated have Less Contact withPublic Services: The infrequent contact between Yemenis and public service providerssuggests either that there is a low level of service provision across Yemen or that there areprohibitive obstacles to accessing these services for some groups of Yemen citizens, or acombination of the two. With the exception of Social Security, from Figure 4, 5 and 6, wecan see that the poor appear to have less contact with public services than the wealthy.
We estimated a multilevel logistic regression on each of the fifteen types of public servicesincluded on the survey to examine the relationship between socio-demographic factors andcontact with public services (see, for example, Table 5; the rest of the regression results areavailable upon request).2. Regression results suggest that, in general, males, the wealthy,and the more educated are more likely to have had contact with public service providers thanfemales, poor respondents, and less educated respondents. Similarly, urban respondents aremore likely to have had contact with public service providers than rural respondents.
1To calculate the first differences, we estimated the multilevel parameters and drew 10,000 sets of simu-lated coefficients and simulated random errors from their posterior distribution. We then set our conceptualmeasures for civil bureaucracy, infrastructure, and law and order that were significant at the p<0.05 level inmodel 1 to their minimum and maximum values, while holding all other variables at their central tendencies,and calculated 10,000 expected values. The first difference is E(Ymax) - E(Ymin). We then averaged thesimulated values to obtain a point estimate and sorted the values to obtain a standard error.
2The dataset used for this paper has a multilevel structure; individuals are nested within primary sam-pling units (PSU), which are nested within districts, which are nested within governorates. Ignoring themultilevel nature of the data would generate a number of severe statistical problems. We deal with theseissues by estimating a multilevel model that allows us to estimate varying intercepts for the governorateswhile producing asymptotically efficient standard errors. We construct a measure of income based on re-spondents’ self-respondents’ total income in the last month, which we divide into quartiles. The poorestquartile correspondents to the first quartile and the wealthiest quartile corresponds to the fourth quartile.We use this measure of income for in all regression analyses and in tables and figures.
12

More specifically, regression results suggest that men are more likely than women to havehad contact with law enforcement services (police and traffic police, and judges and courtofficials), public education, administrative services (the national registration and passportoffices), and, water and sewage services. For example, the difference in the predicted probablyof having contact with traffic police, judges and court officials, and public education servicesfor males compared to females is 1.1 percentage points (0.01), 3.9 percentage points (0.02),and 19.0 percentage points (0.05), respectively.
Urban respondents are more likely than rural respondents to have had contact with thenational registration office, traffic police, electricity and telephone services, and pensions.For example, the first difference in the impact of living area in an urban as opposed to a ruralarea on having contact with traffic police, electricity and telephone services is 1.8 percentagepoints (0.02), 34 percentage points (0.08) and 38 percentage points (0.1), respectively.
Education levels are correlated with a greater likelihood of contact with law enforcementservices, infrastructure services (telephone and water and sewage services), public educa-tion, and pensions. Having technical or higher education corresponds to a percentage pointincrease of 52 (0.1), 13 (0.13) and 9.1 (0.1) in the predicted probability of having contactwith public education services, the police and the national passport office, respectively.
Wealthier respondents are more likely than poorer respondents to have had contact withthe following: human development services (public health and public education); admin-istrative services (social security, pensions, insurance, and the passport office); some lawenforcement services (the police and judges and court officials); and, some infrastructureservices (water and sewage and telephone services). For example, being in the wealthiestquartile corresponds to a percentage point increase of 7.8 (0.04), 17.2 (0.5) and 8.9 (0.5)in the predicted probability of having contact with public health services, public educationservices and judges and court officials, respectively.
4.1 Contact with Public Health Services
Yemenis use public hospitals more frequently than other types of health carecenter: The majority of respondents, 76.8 percent, report that either they or someone intheir immediate household visited a hospital, clinic, or primary health care center for medicalattention in the last twelve months. The majority of both urban and rural respondents reportthat they had gone to a public hospital on their last health care visit. Urban respondents areno more or less likely to have visited a health care facility than their rural counterparts. Ofthe respondents who had visited a health care facility, 31 percent went to a public hospital,20.6 percent went to a private hospital, and 18.1 percent went to a public dispensary.
Over 90 percent of respondents from Marib, Al Baydha and Lahej have used
13

public health services in the last twelve months: There is substantial variation in thepercentage of respondents who have used public health services in the last twelve months(see Table 15). Over 95 percent of respondents from Marib, Al Baydha and Lahej reportthat either they or a household member visited a health care center in the last six months.By contrast, only 61.9 percent, 57.9 percent, and 54.8 of respondents from Al Jawf, Adenand Dhamar, respectively, reported that either they or a household member visited a healthcare center within the last twelve months.
Wealthier and more educated respondents more likely to have visited a healthcare center: Regression results suggest that more educated respondents are more likelyto report that either they or a household member visited a health care facility within thelast twelve months (p<0.01). There is a positive relationship between household size andthe likelihood that a respondent or household member visited a health care center (p<0.01);in other words, as the size of the household increases, the likelihood that the respondentor a household member visited a health care center increases. There are no statisticallysignificant relationships between a respondent’s income quartile, gender, age, urban or ruralstatus, and the likelihood that a respondent or household member visited a health care center(see Table 9).
The average cost of a health care visit is over four times respondents’ averagemonthly income: On average, respondents report that the official cost of their last visit toa public health care facility is 33.00 USD (6,814.00 YER), which is 18 percent of respondents’average monthly income of 179.00 USD (36,628.00 YER). On average, respondents reportthat the official cost of their last health care visit to a private facility is 106.00 USD (21,707.00YER), which is 52 percent of respondents’ average monthly income of 202.00 USD (41,431.00YER).
The Distance between a Respondents’ Houses and the Closest Health Facility isHigher in Rural Areas: On average, the closest health care facility is 8339 km from arespondents’ house. The average distance to the closest health care facility is substantiallyhigher for rural respondents (10,602 km) than for urban respondents (1790 km) (χ2=631,p<0.001). The bivariate correlation between whether a respondent has used a health carefacility in the last twelve months and the distance to the closest health facility is small,-0.09. This suggests that only 9 percent of the variation in whether a respondent has useda health care facility in the last twelve months can be attributed to the distance from arespondent’s house to the closest health facility. Once we control for socio-demographicfactors, the bivariate relationship between distance to a health care facility and use of ahealth care facility within the last six months loses its statistical significance.
14

4.2 Contact with Public Education
Majority of Respondents’ Oldest School-Age Child Goes to School: The majority,69 percent, of respondents with school-age children report that their oldest-child goes toschool. Of these respondents, the majority, 96 percent, report that their oldest-child attendspublic school. A higher percentage of rural respondents send their oldest school-age childto public schools compared to urban respondents (χ2=56.04, p<0.001). Respondents reportthat their oldest-child attends school, on average, 5.7 days a week and teachers are present,on average, 5.1 days per week.
Less than one-third of respondents from Shabwah and over 90 percent of re-spondents from Sana’a City send their oldest school age child to public school:There is substantial variation across governorates in the percentage of respondents who sendtheir oldest school-age child to school. (see Table 11). Over 80 percents of respondents fromSana’a City, Sana’a, Al Dhalea, Lahej, Taiz, and Al Baydha send their oldest school agechild to public school. Less than 60 percent of respondents from Al Hodiedah, Al Mahweet,Dhamar, and Shabwah send their oldest school-age child to public school.
Wealthier respondents more likely to send oldest school-age child to school: Re-gression results suggests that wealthier respondents are more likely to send their child toschool then poorer respondents (p<0.001). The average annual income for respondents whodo not send their oldest school-age child to school, 1,830 USD (375,168.00 YER), is sub-stantially less than the average income of respondents who send their oldest school-age childto school, 2,382.00 USD (488,244 YER). There is no statistically significant relationshipbetween respondents’ gender, education, age, urban/rural status, and household size (seeTable 10)
The annual fee for school is over 6.29 percent of respondents’ average annualsalary: The average annual fee for public school is 1.48 USD (304 YER), which is less thanone percent of respondents’ (who send their oldest school-age child to public school) averageannual salary of 2215.67 USD (454,212.00 YER). The average annual fee for private schoolis 265.41 USD (54,410.00 YER), which is 4.0 percent of respondents’ (who send their oldestschool-age child to private school) of average annual salary of 6721.93 USD (1,377,996.00YER).
There is also variation in the average annual cost of public school across governorates.Whereas in Al Jawf, the average annual school fee is 2.40 USD (488.00 RYI), in Al Mahweet,the average annual school fee is less than one dollar (110.00 RYI).
15

5 User Satisfaction with Public Service Providers
Yemenis Rate the Quality of Administrative Services Most Favorably: As Figure 7illustrates, a higher percentage of respondents rate the quality of administrative services -social security, national registration, and telephone - as “good” or ”very good” than anyother type of service. By contrast, a smaller percentage percentage of respondents rateextractive and law enforcement services as “good” or ”very good” than any other service.This suggests that citizens are more satisfied with services that are voluntary as comparedto services that are coercive.
Urban Respondents are more Satisfied with the Quality of Public Services: AsFigures 8, 9 and 10 illustrate, with the exception of electricity and water and sewageservices, a higher percentage of respondents from urban areas are satisfied with the qualityof public services than rural respondents. We estimate ordered logistic regressions with theperceived quality of each type of public service as the response variable; quality is codedon the survey as “very bad”, “bad”, “neither good nor bad”, “good”, or “very good”. Wecontrol for socio-demographic characteristics including income, education, gender, age, andtest whether there is a relationship between urban/rural residence, income, and perceptionsof the quality of the service.
The results from ordered logistic regressions point to a statistically significant (p < 0.05)relationship between living in an urban area and satisfaction with the quality of public health,education, police, traffic police, passport and telephone services.3 User satisfaction with thequality of services varies little across income groups. With the exception of water and sewageservices, we do not find any statistically significant relationships between a respondents’income quartile and satisfaction with the quality of service provision. To summarize, resultssuggest that user satisfaction with public services varies by urban/rural residence but notincome.
5.1 Complaints and Service Delivery
Respondents who are not satisfied with a service are more likely to have a com-plaint about the service: Respondents were asked whether they had a valid reason tomake a complaint while seeking any of the fifteen different public services included on thesurvey during the past six months. Of all the services, traffic police and judges and courtshave elicited the most amount of complaints from respondents. 32 percent and 31 percentof respondents who have had contact with traffic police and judges and courts, respectively,in the last six months believe they have a valid reason to complain about these services.
3We could not estimate the models on the customs division, tax division, passport office, and judges andcourt officials, because of too few observations.
16
As illustrated by Figure 11, there is a very high negative correlation, -0.87, between thepercentage of respondents who are satisfied with the quality of a service and the percentageof respondents who believe they have a valid reason to complain about the service.
Respondents who have been asked to pay a bribe for a service are more likely tohave a complaint about the service: There is also a strong correlation, 0.66, betweenthe percentage of respondents who have been asked to pay a bribe for a service and thepercentage of respondents who believe they have a valid reason to complain about the service(see Figure 12). This suggests that being asked to pay a bribe affects one’s perception of thequality of public services.
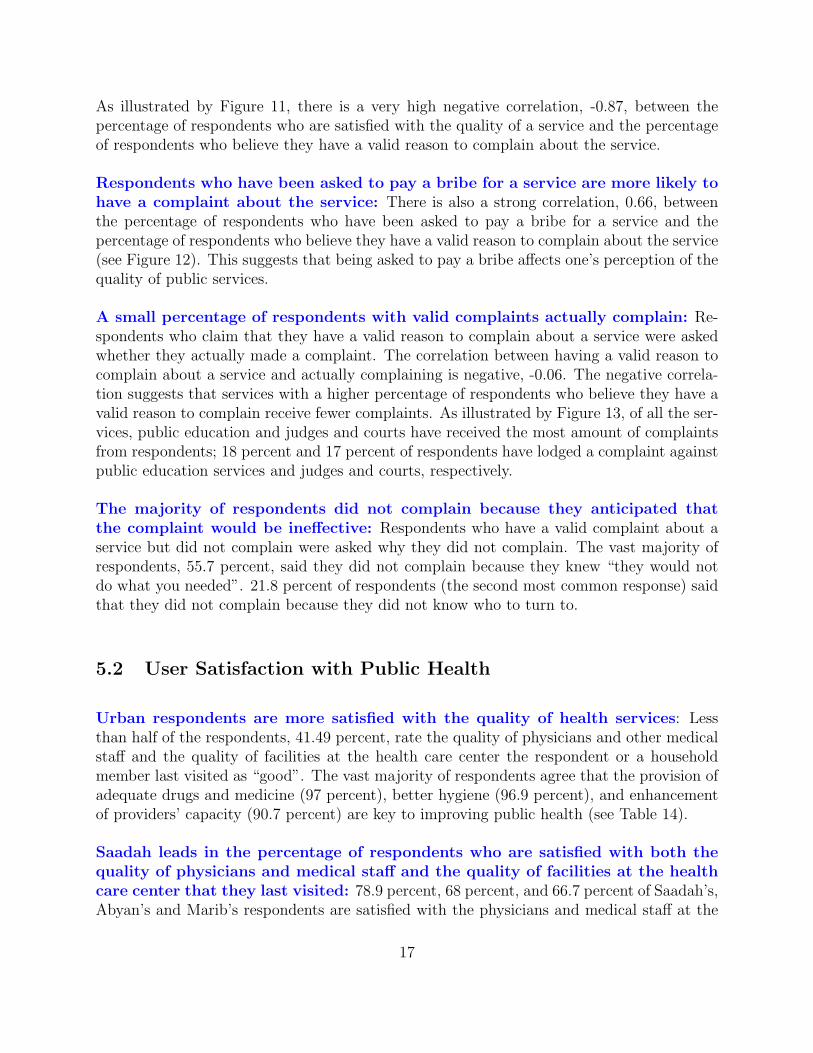
A small percentage of respondents with valid complaints actually complain: Re-spondents who claim that they have a valid reason to complain about a service were askedwhether they actually made a complaint. The correlation between having a valid reason tocomplain about a service and actually complaining is negative, -0.06. The negative correla-tion suggests that services with a higher percentage of respondents who believe they have avalid reason to complain receive fewer complaints. As illustrated by Figure 13, of all the ser-vices, public education and judges and courts have received the most amount of complaintsfrom respondents; 18 percent and 17 percent of respondents have lodged a complaint againstpublic education services and judges and courts, respectively.
The majority of respondents did not complain because they anticipated thatthe complaint would be ineffective: Respondents who have a valid complaint about aservice but did not complain were asked why they did not complain. The vast majority ofrespondents, 55.7 percent, said they did not complain because they knew “they would notdo what you needed”. 21.8 percent of respondents (the second most common response) saidthat they did not complain because they did not know who to turn to.
5.2 User Satisfaction with Public Health
Urban respondents are more satisfied with the quality of health services: Lessthan half of the respondents, 41.49 percent, rate the quality of physicians and other medicalstaff and the quality of facilities at the health care center the respondent or a householdmember last visited as “good”. The vast majority of respondents agree that the provision ofadequate drugs and medicine (97 percent), better hygiene (96.9 percent), and enhancementof providers’ capacity (90.7 percent) are key to improving public health (see Table 14).
Saadah leads in the percentage of respondents who are satisfied with both thequality of physicians and medical staff and the quality of facilities at the healthcare center that they last visited: 78.9 percent, 68 percent, and 66.7 percent of Saadah’s,Abyan’s and Marib’s respondents are satisfied with the physicians and medical staff at the
17

health care center they last visited. By contrast, only 5.9 percent of Hajjah’s respondentsare satisfied with the quality of physicians and medical staff at the health care center theylast visited. 73.7 percent, 66.7 percent and 61.2 percent of Saadah, Sana’a Sana’a City. Bycontrast, only 7.1 and 7.7 percent of Haijah and Al Jawf respondents are satisfied with thequality of facilities at the health care center they last visited (see Table 15).
Urban respondents are more satisfied with the quality of health services: Asis the case with the majority of public services, a higher percentage of urban respondents(52.3 percent) are satisfied with the quality of physicians and medical staff at the healthcare center last visited then rural respondents (37.8 percent) (χ2=17.16, p < 0.001) (seeTable 12). A higher percentage of urban respondents are also satisfied with the quality ofhealth care facility at the health care center the respondent or household member last visitedthen rural respondents (χ2=25.37, p < 0.001) (see Table 13).
5.3 User Satisfaction with Public Education
Less than one-third of respondents are satisfied with the quality of education::Less than one-third of respondents, 29.03 percent, are satisfied with the quality of educationthat their oldest school-age child received during the last school year. Respondents aremore satisfied with teachers’ attendance (79.7 percent), subject coverage and syllabi (79.5percent) and the number of teachers (78.2 percent) than with any other school-related factor(see Table 17).
Al Mahweet leads in the percentage of respondents who are satisfied with thequality of education: The majority of respondents from Al Mahweet (80.00 percent),Sana’a City (59.2) and Marib (53.8 percent) of respondents are satisfied with the qualityof education their oldest school-age child is receiving. By contrast, few respondents fromAmran (7.3 percent) and Lahej (4.4 percent) are satisfied with the quality of education theiroldest school-age child is receiving(see Table 18).
Urban respondents are more satisfied with the quality of education: A higherpercentage of urban respondents (43.3) percent) compared to rural respondents (24.3) aresatisfied with the quality of their child’s (χ2=24.30, p < 0.001) (see Table 16). Satisfactionwith the quality of schools is also higher for respondents, whose oldest school-age goes toprivate school (60 percent) compared to public school (27.8 percent) (χ2= 13.74, p < 0.01).
18

6 Attitudes Toward the Judiciary
A small percentage of respondents and household members have recently beeninvolved in a dispute: Respondents were asked whether they or their household membershave been involved in a dispute over the past three years. Only 18 percent of respondentsanswered “yes” to this question. 40.9 percent of respondents from Al-Dhalea said that theyhave been involved in a dispute over the past three years. Over 25 percent of respondentsfrom Al Baydha, Lahej, Amran, Sana’a and Ibb said they have been involved in a disputeover the past three years. By contrast, less than 10 percent of Al Hodiedah’s (8.6 percent)and Marib (5.6 percent) said that they have been involved in a dispute over the past threeyears (see Table 19).
Of the respondents who were involved in a dispute, the majority, 55 percent, said that thedispute involved land issues. The second most common issue involved in disputes was ”familyand society issues”. Respondents were then asked how long it took for the dispute to beresolved. Of the respondents who were involved in a dispute, 37.1 percent said that theircase was still unresolved. As illustrated by Figure 14, 14.8 percent said that their disputetook one to two years to resolve and 12.2 percent said that the dispute took one to twomonths to resolve. Of the respondents who claimed they had a dispute, the majority, 60percent, turned to formal courts to resolve the case.
The length of procedure times is the most common reason why respondentsopted out of court: Respondents who felt the need to use courts but opted out wereasked whether any of the following factors influenced their decision: procedure times are toolong; a need to make extra payments to register or advance a case; court decisions are notimplemented; courts are too far; and the process is too complex, among several other factors.The most cited reason for opting out of courts is the length of procedure times for cases.The second most cited reason is the need to make extra payments and the third most citedreason is the perception that court decisions are not actually implemented (see Table 20).
Traditional or tribal leaders is the most common form of dispute resolutionthat occurs outside of courts: The majority, 51.6 percent, of respondents involved ina dispute who did not use the formal court system turned to a traditional or tribal leader.Rural respondents are more likely to rely on traditional or tribal leaders compared to urbanrespondents (χ2=12.33, p < 0.001). The second and third most common form of conflictresolution involved formal mediators and arbitrators (37.9 percent) and a religious person(20 percent) (see Table 21).
19

7 Incidence of Bribes and Informal Payments
Bribes are More Common among Law Enforcement and Tax Authorities: Re-spondents were probed on whether they were asked to make extra payments while seekingthe fifteen public services included on the survey. Of the public services, a higher percentageof respondents were asked to make an extra payment for law enforcement services - trafficpolice, judges and courts, and the tax division - than other services. Of the respondentswho have had contact with traffic police, judges and courts and the tax division in thepast six months, 62 percent, 47 percent and 40 percent, respectably, claimed that they wereasked to make an extra payment. Infrastructure services - water and sewage, telephone, andelectricity services, appear to ask for extra payments the least frequently (see Figure 15).
There does not appear to be any statistically significant relationship between gender and thelikelihood of getting asked to make any extra payment with two exceptions. The results of amultilevel logistic regression suggest that women are more likely to have been asked to makeextra payments by judges and court officials than men (p < 0.05) (see Table 22). Similarly,regression results suggest that men are more likely to be asked to make an extra paymentby police than women (p < 0.05) (see Table 23). Regression results suggest that there isno statistically significant relationship between income and the likelihood of being asked tomake an extra payment.
There are too few observations to be able to statistically test the relationship between gender,income, and the amount of extra payments made for public services. Yet, from Figure 16,17 and 18, we can that the median amount of the extra payment made for public services ishigher for women than men, especially for the following services: public health services; elec-tricity services; water and sewage services; judges and court officials; and, the tax division.As Figure 19, 20 and 21 suggest, the relationship between income and the median extraamount paid for public services is mixed. On the one hand, the wealthy pay higher bribesfor public health and public education services and to the tax division than the poor. Onthe other hand, the poor pay higher bribes for judges and court officials and for electricityand telephone services.
The median cost of bribes is higher for less commonly used services: We expect thatthe high price of bribes demanded for services deters a large portion of Yemenis from seekingservices in the first place. Indeed, the scatterplot in Figure 22 shows a negative relationshipbetween the percentage of respondents who have had contact with a public service and themedian of the extra amount respondents paid for that service. The scatterplot shows thatthe cost of extra payments is higher for less utilized services like the court system and thetax division and lower for the more utilized services like public health and public educationservices.
As the cost of bribes for service increase, satisfaction with the services decreases:
20

As illustrated in Figure 23, there is a negative correlation between satisfaction with thequality of services and the median amount of extra payments for the service. For example,on the one hand, 83 percent of respondent are satisfied with telephone services and themedian of the extra amount paid for telephone services is 3.30 USD (675 RYI). On the otherhand, only 21 percent of respondents are satisfied with the quality of courts and judges andthe median amount of the bribe paid for courts and judges is 24.00 USD (5,000.00 RYI).
Bribes work better for discrete, instant transactions: Respondents were probedon whether paying a bribe helped them to obtain a service or resolve a problem. Bribesappear to be more effective for discrete, instant transaction, specifically, for the traffic police,national registration, and public health services (see Figure 24). Of the respondents whomade an extra payment to traffic police within the past six months, 91.5 percent said thatthe bribe was effective. Similarly, of those respondents who made extra payments to thenational registration office or to public health services, 83.7 percent and 81.6 of respondents,respectively, said that that the bribes were effective.
7.1 Public Health
Corruption is less prevalent in the health sector: Of the 1,019 respondents or house-hold members who have visited a health care facility within the last twelve months, 10.5percent of respondents were asked to make an extra payment for health care. There are nostatistically significant relationships between whether a respondent was asked to pay a bribe,whether a respondent lives in an urban or rural area, and the type of health care facility therespondent last visited.
The average bribe the respondent paid on their last health care visit was 18.00 USD (3,629.00RYI), which is 1.19 times respondents’ average monthly salary of 15.00 USD (3056.00 RYI).The amount of the extra payment paid does not appear to be related to the type of healthcare facility the respondent last visited or whether the respondent lives in an urban or ruralarea.
None of Al Baydha’s, Hadramout’s and Marib’s respondents were asked to makean extra payment for health care services: By comparison, 25 percent of respondentsfrom Sana’a were asked to make an unofficial payment or gift for public health servicesreceived. 17.2 percent of respondents from Ibb and 17.1 percent of respondents from Taizwere asked to make an extra payment for public health services (see Table 24).
21

7.2 Public Education
Corruption is prevalent in the education sector especially in rural areas: Aboutone-third of respondents were asked to make an extra payment for their eldest child’s primaryor secondary school in the last school year (N=689). Rural respondents (33.5 percent) aremore likely to have been asked to make an extra payment for their eldest child’s primary orsecondary school in the last school year than urban respondents (22.8) (p < 0.05). There is nostatistically significant relationship between the type of school a respondents’ oldest school-age child attends (public or private) whether the respondent was asked to make an extrapayment, and the amount of the bribe paid for the school. The average bribe the respondentpaid for education is 5.00 USD (972.00 Riyal), which is 31.81 percent of respondents averagemonthly salary.
Over 50 percent of respondents from Taiz, Haijah and Sanna had to make extrapayments for their eldest child’s education during the last school year: By contrast,less than ten percent of respondents from Al Mahweet, Abyan and Al Baydha report thatthey had to make extra payments for their eldest child’s education during the last schoolyear (see Table 25).
8 Reporting Corruption
Few respondents who have knowledge of a corrupt act report it: One-fifth ofrespondents claimed that they had knowledge of an act of corruption committed by a publicofficial during the past three years. Of those, only 15 percent reported that act. Thereis some variation in the percentage of respondents who report having observed an act ofcorruption across governorates. One-quarter of Sana’a’s respondent report having observedan act of corruption and no one from Al Baydha, Hadramout, and Marib report havingobserved an act of corruption (see Table 26).
Of those who reported a corrupt act, over a quarter reported the act to theperson in charge at a corrupt entity: Of those who reported a corrupt act, over a quarterreported the act to the person in charge at a corrupt entity. The second and third mostcommon entities to which respondents reported corrupt acts are police (19.5 percent) andtribal chiefs (17.1 percent), respectively (see Table 27). Whereas a higher percentage of ruralrespondents reported corruption to tribal chiefs, a higher percentage of urban respondentsreported corruption to the person in charge at the corrupt entity (see Table 28). Only 9.8percent of respondents reported the corrupt act to SNACC.
A minority of respondents believe reporters of corruption cases would be pro-tected from harassment: Respondents were asked whether they believe reporters of cor-
22

ruption cases would be protected from harassment. Only 35 percent of respondents answered“yes” to this question.
The most cited reason for not reporting a corruption is the belief that no in-vestigation would be made: Of the respondents who did not report corruption, 39.2percent cited their belief that no investigation would be made as a reason for not reportingcorruption. 21.1 percent of respondents did not report corruption because they did not knowwhere to report the case. 15.5 percent of respondents did not report because they cannotprove their case (see Table 29 There does not appear to be a relationship between the reasonfor not reporting the act of corruption and urban/rural residence.
Non-government actors are perceived as most helpful in fighting corruption: Re-spondents were asked whether a variety of government and non-government institutions arehelpful fighting corruption. 81.8 percent of respondents believe that mosques and religiousbodies are helpful in fighting corruption. 62.6 percent and 61.9 percent of respondents,respectively, believe that the media and academics and teachers are helpful in fighting cor-ruption. Of the government institutions, a higher percentage of respondents, 55.7 percent,believe that courts are helpful compared to 38.1 percent who believe that Members of Par-liament are helpful (see Table 30).
23

9 Appendix A: Tables
List of Tables
1 Population Characteristics of the Sample . . . . . . . . . . . . . . . . . . . . 26
2 Geographical Distribution of the Sample . . . . . . . . . . . . . . . . . . . . 27
3 Biggest Concerns for Respondents . . . . . . . . . . . . . . . . . . . . . . . . 28
4 Perceptions of whether Social Problems are Dangerous . . . . . . . . . . . . 28
5 Regression Results of Contact with Traffic Police . . . . . . . . . . . . . . . 29
6 Contact with Law Enforcement Services Varies by Governorates . . . . . . . 30
7 Contact with Infrastructure Services Varies by Governorates . . . . . . . . . 31
8 Contact with Public Health Services Varies across Governorates . . . . . . . 32
9 Regression Results - Visited a Health Care Center During Past 12 Months . 33
10 Regression Results - Oldest School-Age Child Attends School . . . . . . . . . 34
11 Contact with Education Varies by Governorates . . . . . . . . . . . . . . . . 35
12 Satisfaction with Quality of Physicians and Medical Staff by Urban/Rural . 35
13 Satisfaction with the Quality of Health Facilities by Urban/Rural . . . . . . 35
14 Priorities for Improving Health Care . . . . . . . . . . . . . . . . . . . . . . 36
15 User Satisfaction with Public Health Services Varies by Governorates . . . . 36
16 Perceptions of the Quality of Education by Urban/Rural . . . . . . . . . . . 37
17 Satisfaction with Various Components of Education . . . . . . . . . . . . . . 37
18 User Satisfaction with Education Varies by Governorates . . . . . . . . . . . 38
19 Percent of Respondents Involved in a Dispute Varies by Governorate . . . . . 39
24

20 Reasons for Opting out of Court . . . . . . . . . . . . . . . . . . . . . . . . . 39
21 Alternative methods of conflict resolution . . . . . . . . . . . . . . . . . . . . 40
22 Regression Results on Being Asked to Make an Extra Payment for Judges andCourt Officials . . . . . . . . . . . . . . . . . . . . . . . . . . . . . . . . . . . 40
23 Regression Results on Being Asked to Make an Extra Payment for Police . . 41
24 Percent of respondents who were asked to make an extra payment for publichealth services varies by Governorate . . . . . . . . . . . . . . . . . . . . . . 42
25 Percent of respondents who were asked to make an extra payment for schoolvaries by Governorate . . . . . . . . . . . . . . . . . . . . . . . . . . . . . . . 43
26 Percent of respondents who observed an act of corruption by Governorate . . 44
27 Actors/Entities to which Respondents Report Corruption . . . . . . . . . . . 44
28 Actors/Entities to which Respondents Report Corruption by Urban/Rural . 45
29 Reasons for Not Reporting Corruption . . . . . . . . . . . . . . . . . . . . . 45
30 Who is most Helpful in Fighting Corruption? . . . . . . . . . . . . . . . . . 45
25

Table 1: Population Characteristics of the Sample
Age Frequency Percent< 24 72 5.4124-55 985 74.00> 55 274 20.59Total 1,331 100
Sex Frequency PercentFemale 296 22.24Male 1,035 77.76Total 1,331 100
Single Married Divorced WomenWomen 2.4 70.9 1.0 25.7Men 5.7 91.8 0.5 2.0
Education Level Frequency PercentIlliterate 547 41.1Read and Write 252 18.93Primary Education 132 9.92Middle Education 69 5.18Secondary Education 177 13.3Technical Education 24 1.8Higher Education 130 9.77Total 1,331 100
Income Quartile Average Frequency PercentFirst Quartile 10469.0 376 29.0Second Quartile 21969.8 275 21.2Third Quartile 34199.1 324 25.0Fourth Quartile 82310.9 322 24.826

Table 2: Geographical distribution of the sample
Governorate Frequency PercentAbyan 30 2.3Aden 38 2.9Al Baydha 35 2.6Al Dhalea 22 1.7Al Hodiedah 185 13.9Al Jawf 21 1.6Al Mahweet 35 2.6Amran 63 4.7Dhamar 104 7.8Hadramout 54 4.1Hajjah 95 7.1Ibb 139 10.4Lahej 54 4.1Marib 18 1.4Raimah 34 2.6Saadah 26 2.0Sana’a 41 3.1Sana’a City 129 9.7Shabwah 27 2.0Taiz 181 13.6Total 1,331 100
Status Frequency PercentUrban 337 25.3Rural 994 74.7Total 1,331 100
27

Table 3: Inflation, cost of living biggest concerns
Reason Percent (N=1328)Inflation 20.8
High cost of living 16.1Political instability or poor leadership 12.2
Unemployment 11.9Corruption 8.4
Drug abuse or trafficking 7.7Lack of access to clean water 4.3
Safety concerns or crime 2.9Other 15.8
Table 4: Yemenis perceive many social problems as seriousReason Percent (N=1328)
Inflation 93.5Public Sector Corruption 91.7
Low Quality of health care 90.2Unemployment 89.9
High Cost of living 89.1Lack of access to clean water 88.5
Low Quality of education 88.0Food shortage 87.8
Political instability and poor leadership 84.4Drug abuse and trafficking 82.6
Low quality of roads 82.0Violence 78.5
Safety concerns and crime 77.9Environmental Destruction 77.54
Housing shortage 74.9Qat chewing 71.7
Poor Sanitation 71.9Private Sector Corruption 71.1
28

Table 5: Males, the educated, and urban households are more likely to have had contactwith traffic police (N=1,297)
Estimate Std. ErrorFixed Effects
(Intercept) -3.61 *** 0.00Male 1.10 * 0.03Read and write 1.32 ** 0.00
Primary education 1.20 * 0.02Middle education 1.33 * 0.02Secondary Education 1.19 * 0.25Technical Education 1.91 ** 0.00Higher Education 1.11 * 0.03Age -0.02 0.12Rural -0.71 * 0.01Income - 2nd Quartile -0.43 0.35Income - 3rd Quartile 0.27 0.55Income - 4th Quartile 0.72 0.08
Random InterceptsGovernorates 0.1 0.3
*p<0.05,**p<0.01, ***p<0.001
29

Table 6: Contact with law enforcement services varies across governorates with Sana’City inthe lead
Governorate Police Judges and Courts Traffic PoliceSanaa City 31.0 18.6 26.4Hajjah 29.5 6.3 3.2Al Baydha 20.0 17.1 5.7Lahej 14.8 24.1 13.0Shabwah 14.8 7.4 7.4Sana’a 12.2 9.8 14.6Raimah 11.8 11.8 2.9Ibb 11.5 16.5 5.0Abyan 10.0 10.0 6.7Amran 9.5 25.4 6.3Al Dhalea 9.1 18.2 4.5Dhamar 7.7 5.8 7.7Hadramout 7.4 3.7 9.3Marib 5.6 11.1 11.1Aden 5.3 5.3 2.6Al Hodiedah 3.2 2.2 2.7Al Mahweet 2.9 8.6 2.9Taiz 2.8 5.5 3.9Al Jawf 0.0 0.0 4.8Saadah 0.0 3.8 15.4χ2 123*** 76*** 89***
30
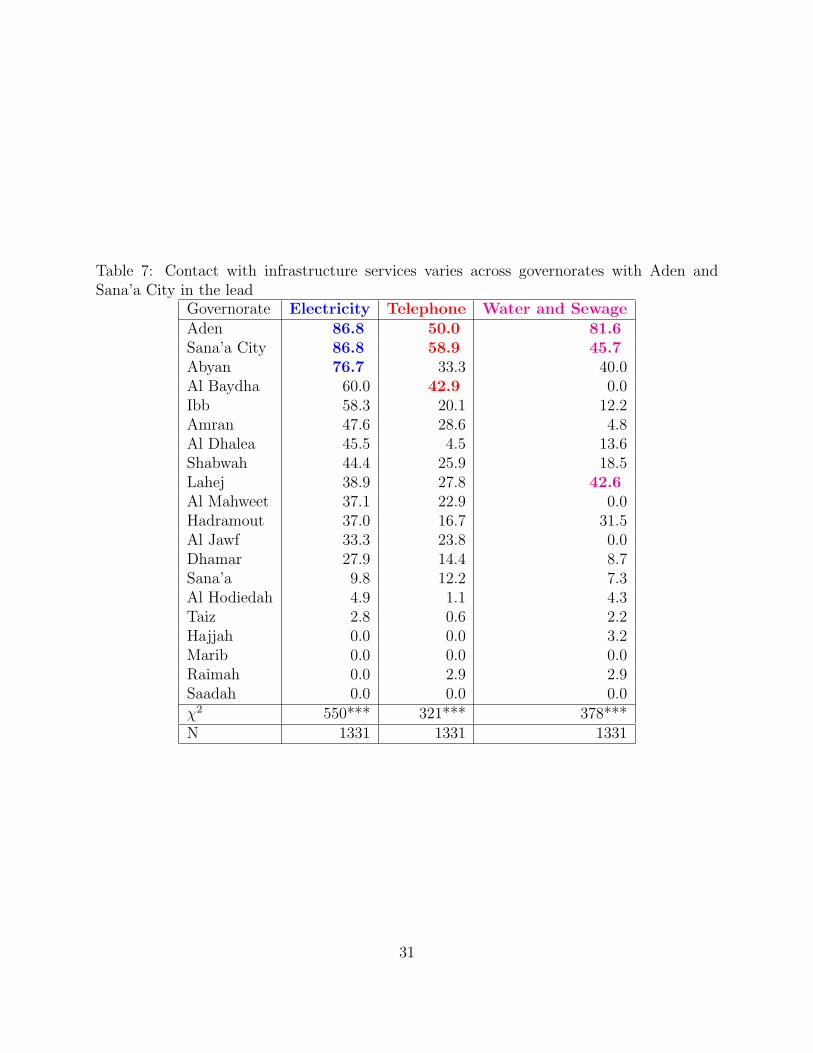
Table 7: Contact with infrastructure services varies across governorates with Aden andSana’a City in the lead
Governorate Electricity Telephone Water and SewageAden 86.8 50.0 81.6Sana’a City 86.8 58.9 45.7Abyan 76.7 33.3 40.0Al Baydha 60.0 42.9 0.0Ibb 58.3 20.1 12.2Amran 47.6 28.6 4.8Al Dhalea 45.5 4.5 13.6Shabwah 44.4 25.9 18.5Lahej 38.9 27.8 42.6Al Mahweet 37.1 22.9 0.0Hadramout 37.0 16.7 31.5Al Jawf 33.3 23.8 0.0Dhamar 27.9 14.4 8.7Sana’a 9.8 12.2 7.3Al Hodiedah 4.9 1.1 4.3Taiz 2.8 0.6 2.2Hajjah 0.0 0.0 3.2Marib 0.0 0.0 0.0Raimah 0.0 2.9 2.9Saadah 0.0 0.0 0.0χ2 550*** 321*** 378***N 1331 1331 1331
31

Table 8: Over 90 percent of respondents from Marib, Al Baydha and Lahej have had contactwith public health services
Governorate Percent of Respondents (N=1331)Marib 100.00Al Baydha 97.1Lahej 96.3Sana’a City 89.9Hajjah 89.5Ibb 87.8Hadramout 87.0Abyan 83.3Al Dhalea 81.8Amran 81.0Sana’a 80.5Al Mahweet 77.1Shabwah 74.1Raimah 73.5Saadah 73.4Taiz 68.0Al Hodiedah 62.2Al Jawf 61.9Aden 57.9Dhamar 54.8χ2 130***
32

Table 9: More educated and larger households are more likely to have visited a health carefacility during the past 12 months (N=1297)
Estimate Std. ErrorFixed Effects
Intercep) 0.3 0.6Male -0.1 0.2Read and Write 0.5 * 0.2Primary Education 0.5 0.3Middle Education 0.9 * 0.4Secondary Education 0.6 * 0.3Technical Education 0.2 0.5Higher Education 1.1 ** 0.4Age 0.0 0.0Rural 0.3 0.2Income - Second Quartile 0.4 0.2Income - Third Quartile 0.3 0.2Income - Fourth Fourth Quartile 0.3 0.2Household Size 0.1 *** 0.0Log Distance to Health Clinic 0.0 0.1
Random InterceptsGovernorates 0.5 0.8
*p<0.05,**p<0.01, ***p<0.001
33
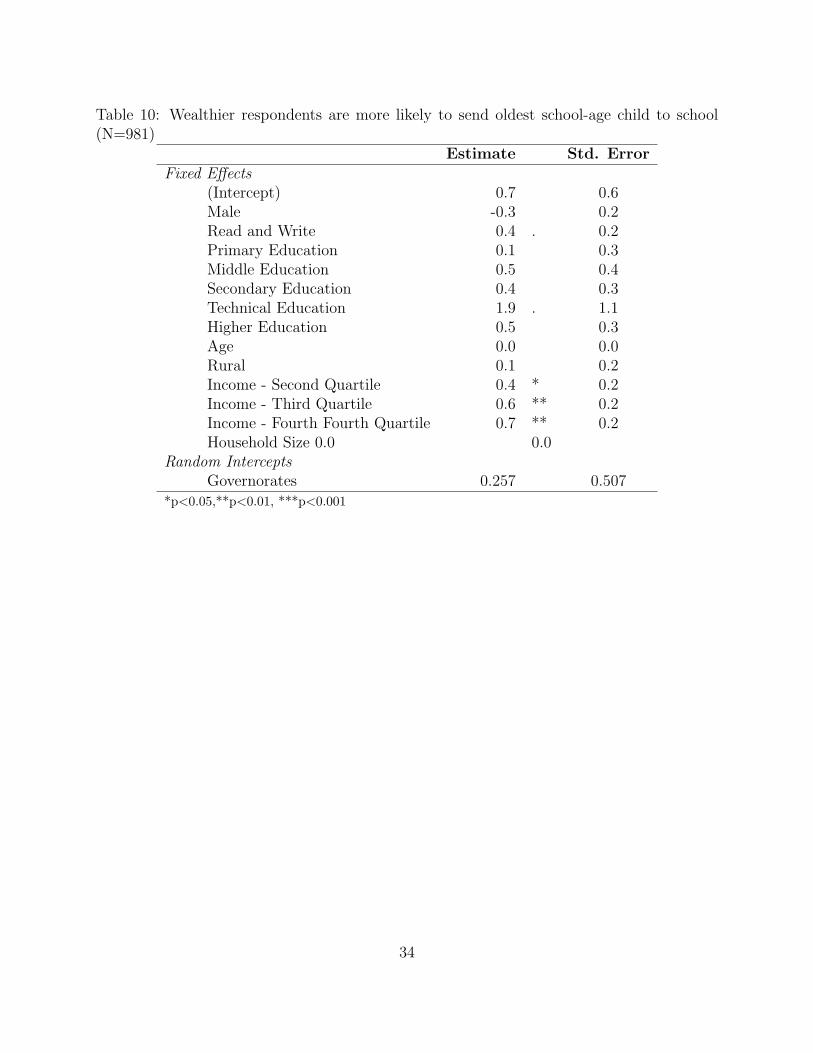
Table 10: Wealthier respondents are more likely to send oldest school-age child to school(N=981)
Estimate Std. ErrorFixed Effects
(Intercept) 0.7 0.6Male -0.3 0.2Read and Write 0.4 . 0.2Primary Education 0.1 0.3Middle Education 0.5 0.4Secondary Education 0.4 0.3Technical Education 1.9 . 1.1Higher Education 0.5 0.3Age 0.0 0.0Rural 0.1 0.2Income - Second Quartile 0.4 * 0.2Income - Third Quartile 0.6 ** 0.2Income - Fourth Fourth Quartile 0.7 ** 0.2Household Size 0.0 0.0
Random InterceptsGovernorates 0.257 0.507
*p<0.05,**p<0.01, ***p<0.001
34

Table 11: Over 85 percent of households from Sana’a City, Sana’a, Al Dhalea, and Lahejhave had contact with public education services
Governorate Percent of Respondents (N=1331)Sana’a City 90.48Sana’a 88.46Al Dhalea 88.24Lahej 88.24Taiz 82.48Al Baydha 81.48Marib 72.22Saadah 68.42Abyan 67.86Hajjah 67.65Al Jawf 66.67Amran 65.08Aden 65.00Hadramout 64.86Ibb 63.44Raimah 60.00Al Hodiedah 55.20Al Mahweet 50.00Dhamar 50.00Shabwah 36.84χ2 93.01***
Table 12: Urban respondents more satisfied with quality of physicians and medical staff(N=1022)
Poor Acceptable GoodUrban 9.8 37.9 52.3Rural 13.7 48.5 37.7
Table 13: Urban respondents more satisfied with quality of health facilities (N=1022)
Poor Acceptable GoodUrban 11.4 35.2 53.4Rural 22.2 40.5 37.3
35

Table 14: Provision of drugs and better hygiene seen as most important for improving publichealth
Factors PercentProvision of adequate drugs and medicine 97.1More hygiene 97.0Enhancement of providers’ capacity 90.8Increase in the number of hospitals/clinics 90.5Increases in salary of health personnel 84.2Increase in the number of female care providers 80.8Increase in the number of staff 76.9
Table 15: User satisfaction with quality of public health services on last visit is highest inSaadah, Abyan and Marib
Governorate Quality of Physicians and Staff Quality of FacilitiesSaadah 78.9 73.7Abyan 68.0 56.0Marib 66.7 38.9Aden 63.6 59.1Hadramout 59.6 51.1Al Baydha 58.8 52.9Sana’a 57.6 66.7Sana’a City 56.0 61.2Shabwah 55.0 45.0Raimah 52.0 40.0Ibb 48.4 45.9Al Mahweet 48.1 44.4Al Hodiedah 34.8 33.0Al Dhalea 33.3 33.3Dhamar 33.3 40.4Lahej 32.7 51.9Taiz 29.3 22.8Amran 25.5 49.0Al Jawf 15.5 7.7Hajjah 5.9 7.1χ2 188.70*** 265.73***N 1022 1022
36

Table 16: Urban respondents more satisfied with quality of their oldest child’s school(N=689)
Poor Acceptable GoodUrban 14.6 42.1 43.3Rural 25.5 50.2 24.3
Table 17: More Yemenis are satisfied with teachers’ attendance and curricula than withother factors
Factors PercentTeachers’ attendance 79.7Subject coverage and syllabi 79.5Number of teachers 78.2Teachers’ professional capacity 77.6Number of schools and Distance to school 74.3Buildings, infrastructure and equipment 73.7
37
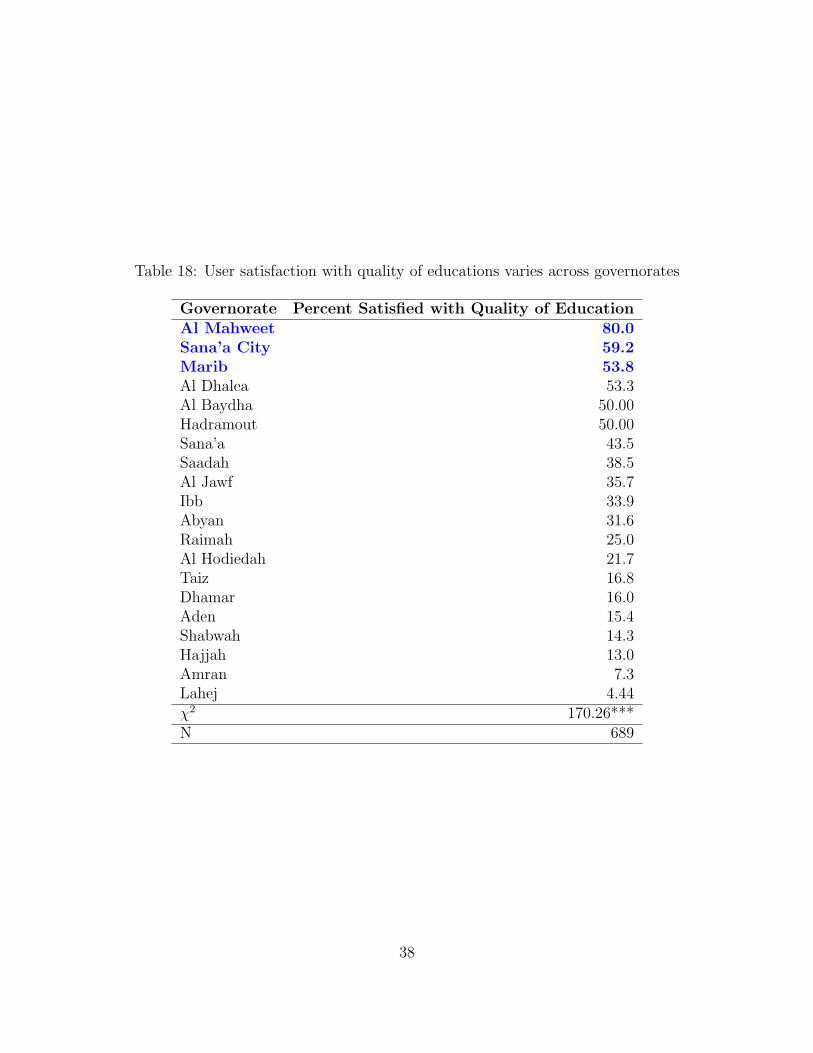
Table 18: User satisfaction with quality of educations varies across governorates
Governorate Percent Satisfied with Quality of EducationAl Mahweet 80.0Sana’a City 59.2Marib 53.8Al Dhalea 53.3Al Baydha 50.00Hadramout 50.00Sana’a 43.5Saadah 38.5Al Jawf 35.7Ibb 33.9Abyan 31.6Raimah 25.0Al Hodiedah 21.7Taiz 16.8Dhamar 16.0Aden 15.4Shabwah 14.3Hajjah 13.0Amran 7.3Lahej 4.44χ2 170.26***N 689
38

Table 19: More respondents from Al Dhalea than any other governorate have been involvedin a dispute
Governorate Percent of RespondentsAl Dhalea 40.9Al Baydha 37.1Lahej 35.2Amran 34.9Sana’a 34.1Ibb 26.6Shabwah 25.9Sana’a City 17.8Abyan 16.7Hadramout 14.8Dhamar 14.4Al Jawf 14.3Raimah 11.8Hajjah 11.6Saadah 11.5Al Mahweet 11.4Aden 10.5Taiz 10.5Al Hodiedah 8.6Marib 5.6χ2 120.16***N 1331
Table 20: Respondents who feel the need to use courts opt out because
Reason PercentProcedure times are too long 76.1Need to make extra payments 61.2Court decisions are not implemented 55.2Courts are too far 53.7Process is too complex 52.2Lawyer fees are excessive 52.2Court judgments influenced by corruption 40.3Judges are incompetent 37.3Court Fees are excessive 29.9
39

Table 21: Alternative methods of conflict resolution
Method Percent (N=95)Traditional/Tribal leader 51.6Formal Mediator/Arbitrator 37.9Religious person 20.0Direct negotiation with the other party 15.8Government official 10.5Respected member of business community 9.5Lawyer without going to court 7.4Threats or use of force 4.2
Table 22: Women are more likely to be asked to make extra payment by judges and courtofficials (N=131)
Estimate Std. ErrorFixed Effects
(Intercept) 2.1 2.2Male -2.9 * 1.3Read and write 0.0 0.7Primary Education -18.0 1302.4Middle education -0.5 1.2Secondary Education -1.2 0.9Technical Education -0.8 1.2Higher Education -2.1 * 0.9Age 0.0 0.0Status 0.2 0.8
Income - 2nd Quartile 0.7 0.8Income - 2nd Quartile 1.6 * 0.8Income - 4th Quartile 0.2 0.8
Random InterceptsGovernorates 1.04 1.02
*p<0.05,**p<0.01, ***p<0.001
40

Table 23: Men are more likely to be asked to make extra payment by police (N=149)Estimate Std. Error
Fixed Effects(Intercept) 0.1 2.1Male 3.1 * 1.4Read and write -0.5 0.6Primary Education -1.3 0.8Middle education -0.6 1.0Secondary Education -1.1 0.7Technical Education -2.4 1.5Higher Education -0.9 0.8Age 0.0 ** 0.0Status -0.4 0.7Income - 2nd Quartile 1.0 0.6
Income - 3rd Quartile 0.8 0.7Income - 4th Quartile 0.5 0.6
Random InterceptsGovernorates 1.02 1.01
*p<0.05,**p<0.01, ***p<0.001
41

Table 24: No respondents from Al Baydha, Hadramout or Marib had to make an extrapayment for public health services
Governorate Percent of RespondentsSana’a 25.0Ibb 17.2Taiz 17.1Hajjah 16.7Abyan 16.0Raimah 16.0Al Mahweet 11.5Lahej 11.5Shabwah 10.0Al Jawf 7.7Dhamar 7.0Sana’a City 6.9Al Dhalea 5.6Saadah 5.3Al Hodiedah 5.2Aden 4.5Amran 3.9Al Baydha 0Hadramout 0Marib 0χ2 95.71***N 1022
42

Table 25: Over 50 percent of respondents from Taiz, Haijah and Sana’a had to make anextra payment for public school
Governorate Percent of RespondentsTaiz 58.4Hajjah 56.5Sana’a 52.2Al Hodiedah 43.5Ibb 42.4Raimah 33.3Marib 23.1Al Jawf 21.4Dhamar 18.0Lahej 17.8Aden 15.4Saadah 15.4Shabwah 14.3Al Dhalea 13.3Hadramout 12.5Amran 12.2Sana’a City 11.8Al Mahweet 6.7Abyan 5.3Al Baydha 4.5χ2 239.65***N 689
43

Table 26: 25 percent of respondents from Sana’a observed act of corruption by a publicofficial
Governorate Percent of RespondentsLahej 68.5Al Dhalea 50.0Raimah 38.2Sana’a 36.6Al Baydha 34.3Saadah 26.9Abyan 26.7Hadramout 24.1Amran 22.2Marib 22.2Ibb 21.6Sana’a City 20.9Taiz 20.4Shabwah 18.5Hajjah 17.9Aden 15.8Dhamar 10.6Al Jawf 9.5Al Mahweet 2.9Al Hodiedah 1.6χ2 95.71***
Table 27: Of those who reported a corrupt act, over a quarter reported the act to the personin charge at a corrupt entity
Entity (N=41) PercentPerson in charge at corrupt entity 26.8Police 19.5Tribal Chiefs 17.1SNACC 9.8Courts 7.3Other 19.5
44

Table 28: A higher percentage of rural respondents report corruption to tribal chiefs
Entity (N=41) Urban % Rural %Person in charge at corrupt entity 33.3 23.1Police 20.0 19.2Tribal Chiefs 6.7 23.1SNACC 13.3 7.7Courts 13.3 3.8Other 13.3 23.1
Table 29: Respondents did not report corruption because
Reason (N=232) PercentNo investigation would be made 39.2They don’t know where to report 21.1They cannot prove their case 15.5Decisions, even if in their favor, will not be enforced 12.5Corruption is a normal behavior, it is not worth reporting 11.6
Table 30: Non-Government actors are perceived as most helpful in fighting corruption
Reason (N=1331) PercentMosques/Religious bodies 81.8Media (Print and TV) 63.2Academics and Teachers 62.0Courts 55.8Central Organization for Control and Audit (COCA) 55.3Anti-corruption Commission (SNACC) 54.5Armed Forces/Military 54.1Attorney General 55.3Tribal Systems 52.6Police 49.1Professional Associations Accountants, Lawyers, etc.) 47.9Non-Government Organizations 45.8Members of Parliament 38.2
45

10 Appendix B: Figures
List of Figures
1 Sample geographical distribution . . . . . . . . . . . . . . . . . . . . . . . . . . . . . 48
2 Contact with Public Services . . . . . . . . . . . . . . . . . . . . . . . . . . . . . . . 48
3 Effect of living in southern Yemen of having contact with public services . . . . . . . 49
4 Contact with Human Development Services by Income . . . . . . . . . . . . . . . . . 50
5 Contact with Law Enforcement by Income . . . . . . . . . . . . . . . . . . . . . . . . 50
6 Contact with Infrastructure Services by Income . . . . . . . . . . . . . . . . . . . . . 50
7 Perceptions of the Quality of Services . . . . . . . . . . . . . . . . . . . . . . . . . . 51
8 Perceptions of Quality of Human Development Services by Urban/Rural . . . . . . . 52
9 Perceptions of Quality of Law Enforcement Services by Urban/Rural . . . . . . . . . 52
10 Perceptions of Quality of Infrastructure Services by Urban/Rural . . . . . . . . . . . 52
11 Correlation between User Satisfaction and Complaints about Services . . . . . . . . 53
12 Correlation between Bribes and Complaints about Services . . . . . . . . . . . . . . 54
13 Percent of Respondents who Actually Complained . . . . . . . . . . . . . . . . . . . 55
14 Time To Resolve Dispute . . . . . . . . . . . . . . . . . . . . . . . . . . . . . . . . . 56
15 Percent of Respondents who were Asked to Make An Extra Payment . . . . . . . . . 57
16 Extra Payments for Human Development Services by Gender . . . . . . . . . . . . . 58
17 Extra Payments for Law Enforcement Services by Gender . . . . . . . . . . . . . . . 58
18 Extra Payments for Infrastructure Services by Gender . . . . . . . . . . . . . . . . . 58
19 Median Amount of Bribe for Human Development Services and Income Group . . . 59
46

20 Median Amount of Bribe for Law Enforcement Services and Income Group . . . . . 59
21 Median Amount of Bribe for Infrastructure Services and Income Group . . . . . . . 59
22 Correlation between Contact with Public Services and Amount of Bribe for a Service 60
23 Correlation between Quality of Public Services and Amount of Bribe for a Service . 60
24 Effectiveness of Bribes for Public Services . . . . . . . . . . . . . . . . . . . . . . . . 61
25 Yemen’s score on the World Governance Indicators . . . . . . . . . . . . . . . . . . . 62
26 Yemen’s score on the World Governance Indicators compared to Middle East/NorthAfrican Countries and Low Income Countries . . . . . . . . . . . . . . . . . . . . . . 63
27 Yemen’s Score on the Global Integrity Index compared to Middle East/Norht AfricanCountries . . . . . . . . . . . . . . . . . . . . . . . . . . . . . . . . . . . . . . . . . . 64
28 Levels of health and education are appalling in Yemen . . . . . . . . . . . . . . . . . 65
47

No. of PSUs Sampled from 20/21 Governates
over 128 − 124 − 8under 4
Figure 1: Sample geographical distribution
Taxes
Traffic Police
Judges & Courts
National Registration
Water & Sewage
Telephone
Social Security
Electricity
Public Education
Public Health
●
●
●
●
●
●
●
●
●
●
0 20 40 60 80 100Percent of pespondents who had contact with service providers in last 6 months (N=1331)
Figure 2: Most Yemenis interface with public health and public education services
48

Effect of living in Southern Yemen on Contact with:
0.00 0.05 0.10 0.15 0.20 0.25 0.30
Natn'l Registration
Electricity
Public Health
Social Security
Water & Sewage
●
●
●
●
●
0.00 0.05 0.10 0.15 0.20 0.25 0.30
Figure 3: Respondents living in southern Yemen having a greater likelihood of having contactwith some public services
49

Richest Quartile
Poorest Quartile
Social Security
Richest Quartile
Poorest Quartile
Public Education
Richest Quartile
Poorest Quartile
Public Health
●
●
●
●
●
●
0 20 40 60 80 100Percent of respondents who have had contact with human development services (N=1331)
Figure 4: The poor have less contact withhuman development services than the rich
Richest Quartile
Poorest Quartile
Police
Richest Quartile
Poorest Quartile
Traffic Police
Richest Quartile
Poorest Quartile
Judges & Courts
●
●
●
●
●
●
0 5 10 15 20 25Percent of respondents who have had contact
with law enforcement services (N=1331)
Figure 5: And even less contact with law en-forcement
Richest Quartile
Poorest Quartile
Water & Sewage
Richest Quartile
Poorest Quartile
Telephone
Richest Quartile
Poorest Quartile
Electricity
●
●
●
●
●
●
0 10 20 30 40 50 60Percent of respondents who have had contact
with infrastructure services (N=1331)
Figure 6: ...And infrastructure services
50

Taxes
Traffic Police
Judges & Courts
National Registration
Water & Sewage
Telephone
Social Security
Electricity
Public Education
Public Health
●
●
●
●
●
●
●
●
●
●
20 30 40 50 60 70 80Percent of respondents who rate the quality of services as good
Figure 7: Yemenis rate the wuality of administrative services most favorably
51

Social Security (N=251)
Public Education (N=586)
Public Health (N=917)
Percent of respondents who rate the quality of human development services as good
Fre
quen
cy
010
2030
4050
Urban/Rural
UrbanRural
Figure 8: User satisfaction with health, ed-ucation and social security higher in urbanareas
Judges & Courts (N=135)
Traffic Police(N=103)
Taxes (N=47)
Percent of respondents who rate the quality of law enforcement services as good
Fre
quen
cy
010
2030
40
Urban/Rural
UrbanRural
Figure 9: The Same is True for Law Enforce-ment Services
Electricity (N=430)
Telephone(N=235)
Water & Sewage (N=198)
Percent of respondents who rate the quality of infrastructure services as good
Fre
quen
cy
020
4060
8010
0
Urban/Rural
UrbanRural
Figure 10: ...And Less So For Infrastructure
52

●
●
●
●
●
●
●
●
●
●
0 20 40 60 80 100
010
2030
4050
Percent of Respondents Who Rate Services As Good
Per
cent
of R
espo
nden
ts W
ith R
easo
n To
Com
plai
n
Taxes
Traffic Police
Judges & Courts
National Registration
Water & Sewage
Telephone
Social Security
Electricity
Public EducationPublic Health
Figure 11: High negative correlation between user satisfaction with services and complaintsabout services (Corr = -0.87)
53
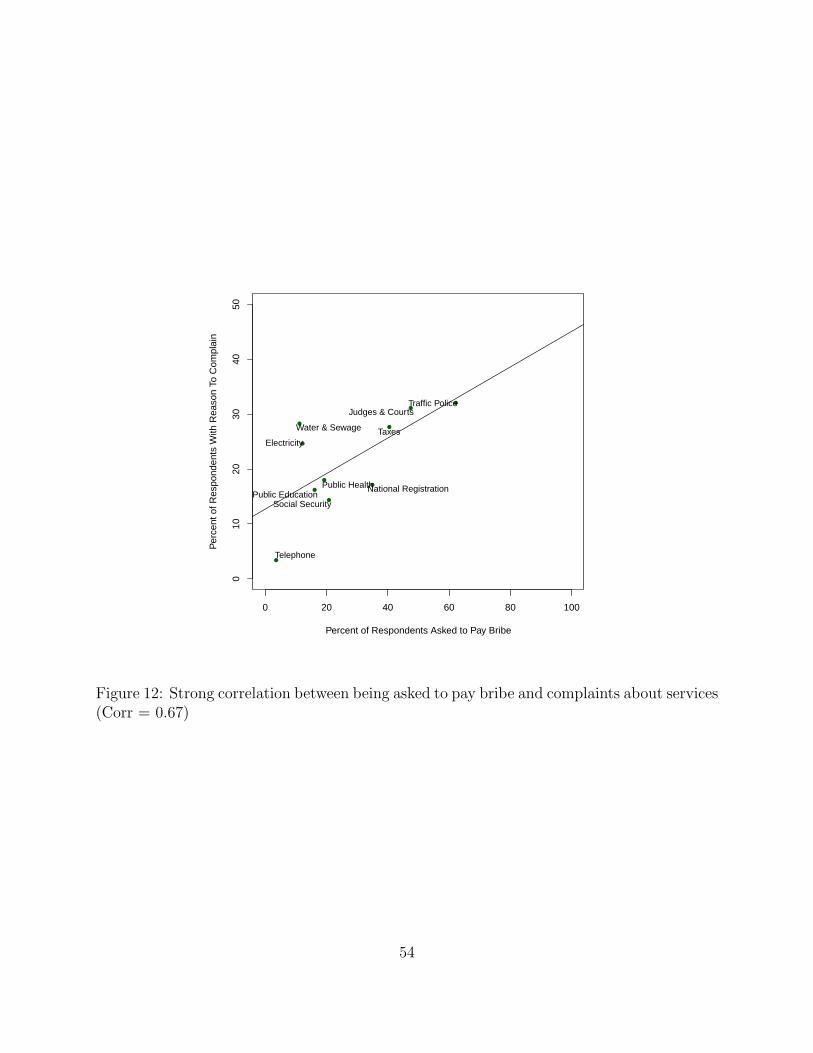
●
●
●
●
●
●
●
●
●
●
0 20 40 60 80 100
010
2030
4050
Percent of Respondents Asked to Pay Bribe
Per
cent
of R
espo
nden
ts W
ith R
easo
n To
Com
plai
n
Taxes
Traffic PoliceJudges & Courts
National Registration
Water & Sewage
Telephone
Social Security
Electricity
Public EducationPublic Health
Figure 12: Strong correlation between being asked to pay bribe and complaints about services(Corr = 0.67)
54

Traffic Police
Judges & Courts
National Registration
Water & Sewage
Telephone
Social Security
Electricity
Public Education
Public Health
●
●
●
●
●
●
●
●
●
0 5 10 15 20
Percent of respondents who complained about a service
Figure 13: Only a small percentage of respondents have lodged a complaint about publicservices
55
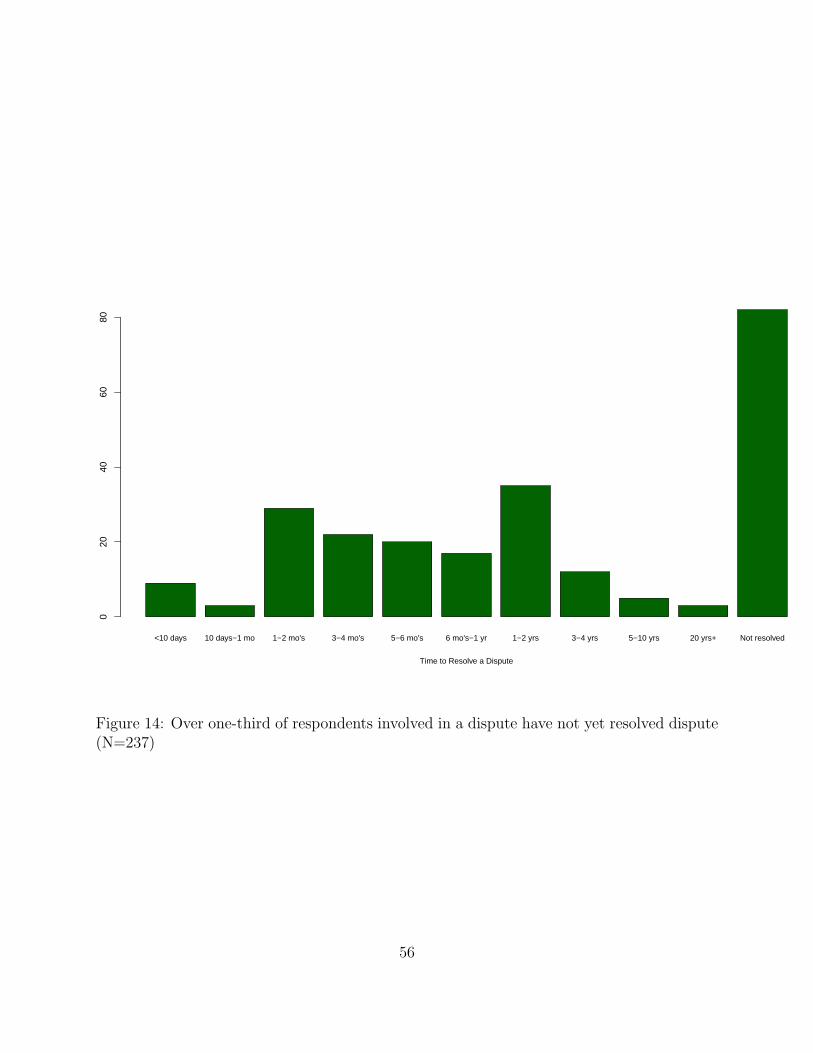
<10 days 10 days−1 mo 1−2 mo's 3−4 mo's 5−6 mo's 6 mo's−1 yr 1−2 yrs 3−4 yrs 5−10 yrs 20 yrs+ Not resolved
Time to Resolve a Dispute
Per
cent
of R
espo
nden
ts
020
4060
80
Figure 14: Over one-third of respondents involved in a dispute have not yet resolved dispute(N=237)
56

Taxes
Traffic Police
Judges & Courts
National Registration
Water & Sewage
Telephone
Social Security
Electricity
Public Education
Public Health
●
●
●
●
●
●
●
●
●
●
0 20 40 60 80 100Percent of respondents who were asked to make extra payments
Figure 15: Bribes are more common among law enforcement officials and tax authorities
57

Male
Female
Social Security (N=47)
Male
Female
Public Education (N=84)
Male
Female
Public Health (N=141)
●
●
●
●
●
●
●
●
●
0 500 1000 1500 2000 2500Median Amount in Riyal
Extra amount respondents paid last time they sought service
Figure 16: Women are more vulnerable tocorruption in the health sector
Male
Female
Taxes Division (N=17)
Male
Female
Traffic Police (N=59)
Male
Female
Judges & Courts (N=51)
●
●
●
●
●
●
●
●
●
0 5000 10000 15000Median Amount in Riyal
Extra amount respondents paid last time they sought a service
Figure 17: Women are more vulnerable tocorruption in the judiciary and tax sectors
Male
Female
Water & Sewage (N=19)
Male
Female
Telephone (N=8)
Male
Female
Electricity (N=40)
●
●
●
●
●
●
●
●
●
0 2000 4000 6000 8000 10000Median Amount in Riyal
Extra amount respondents paid last time they sought a service
Figure 18: Women are more vulnerable tocorruption in the infrastructure sector
58

Richest Quartile
Poorest Quartile
Social Security (N=47)
Richest Quartile
Poorest Quartile
Public Education (N=84)
Richest Quartile
Poorest Quartile
Public Health (N=141)
●
●
●
●
●
●
●
●
●
0 500 1000 1500 2000 2500 3000Median Amount in Riyal
Extra amount respondents paid last time they sought a service
Figure 19: The wealthy pay higher bribes forhealth and education services
Richest Quartile
Poorest Quartile
Taxes Division (N=17)
Richest Quartile
Poorest Quartile Quartile
Traffic Police (N=59)
Richest Quartile
Poorest Quartile Quartile
Judges & Courts (N=51)
●
●
●
●
●
●
●
●
●
0 2000 4000 6000 8000 10000 14000Median Amount in Riyal
Extra amount respondents paid last time they sought a service
Figure 20: The poor are more vulnerable tocorruption in the judiciary sector
Richest Quartile
Poorest Quartile
Telephone (N=8)
Richest Quartile
Poorest Quartile
Electricity (N=40)
●
●
●
●
●
●
0 1000 2000 3000 4000 5000 6000Median Amount in Riyal
Extra amount respondents paid last time they sought a service
Figure 21: The poor are more vulnerable tocorruption in the electricity and telephonesectors
59

●
●
●
●
● ●
●●●
●
0 20 40 60 80 100
020
0040
0060
0080
00
Percent of Respondents who Have Had Contact with Public Services
Med
ian
Ext
ra A
mou
nt P
aid
for
Ser
vice
s
Judges & Courts
Taxes
Water & Sewage
Traffic Police
Natn'l RegistrationElectricity
Public HealthTelephone Social Security
Public Education
Figure 22: Negative correlation between contact with public services and amount of extrapayment for a service (Corr=-0.57)
●
●
●
●
●●
●●●
●
0 20 40 60 80 100
010
0020
0030
0040
0050
0060
0070
00
Percent of Respondents Who Rate Services As Good
Med
ian
Ext
ra A
mou
nt P
aid
for
Ser
vice
s
Courts & Judges
Taxes
Water & Sewage
Traffic Police
National RegistrationElectricity
Public HealthTelephoneSocial Security
Public Education
Figure 23: Negative correlation between quality of services and the amount of extra paymentfor a service (Correlation=-0.5)
60

Taxes
Traffic Police
Judges & Courts
National Registration
Water & Sewage
Telephone
Social Security
Electricity
Public Education
Public Health
●
●
●
●
●
●
●
●
●
●
50 60 70 80 90 100
Percent of Respondents who paid a bribe that was effective
Figure 24: Bribes work better for discrete, instant transactions
61

11 Appendix C: Supplementary Information
On the Corruption Perception Index (CPI) of Transparency International, Yemen is ranked 158thout of total 180 countries (15th percentile) in 2009. In percentile terms, this is a continuous declinesince 2005 when Yemen was ranked 111th out of total 163 countries (32nd percentile); and 2005,when it was ranked 103rd out of 158 countries (35th percentile). In the Middle East and NorthAfrica Region, Yemen is ranked 16th out of 18 countries in 2009, with only Iran ranked 168th andIraq ranked 178th below it. A comparison of Yemen’s CPI scores in relation to the region andover time (see Figure 25). It is clear that Yemen has a long way to go in terms of improving onperceptions of corruption.
According to the Worldwide Governance Indicators (WGI) issued by the World Bank Institute in2009, Yemen has mixed results. Political stability remains elusive. Yemen scores best in “Controlof Corruption” (-0.6) and “Regulatory Quality” (-0.7) amongst the six dimensions of Governance.It is showing good signs of improvement in Regulatory Quality and Rule of Law. Marginal im-provements are also noted in Control of Corruption (see Figure 25). The areas of concern remain tobe Government effectiveness and Voice and Accountability, which have been going down in recentyears.
Figure 25: Yemen’s score on the World Governance Indicators
62
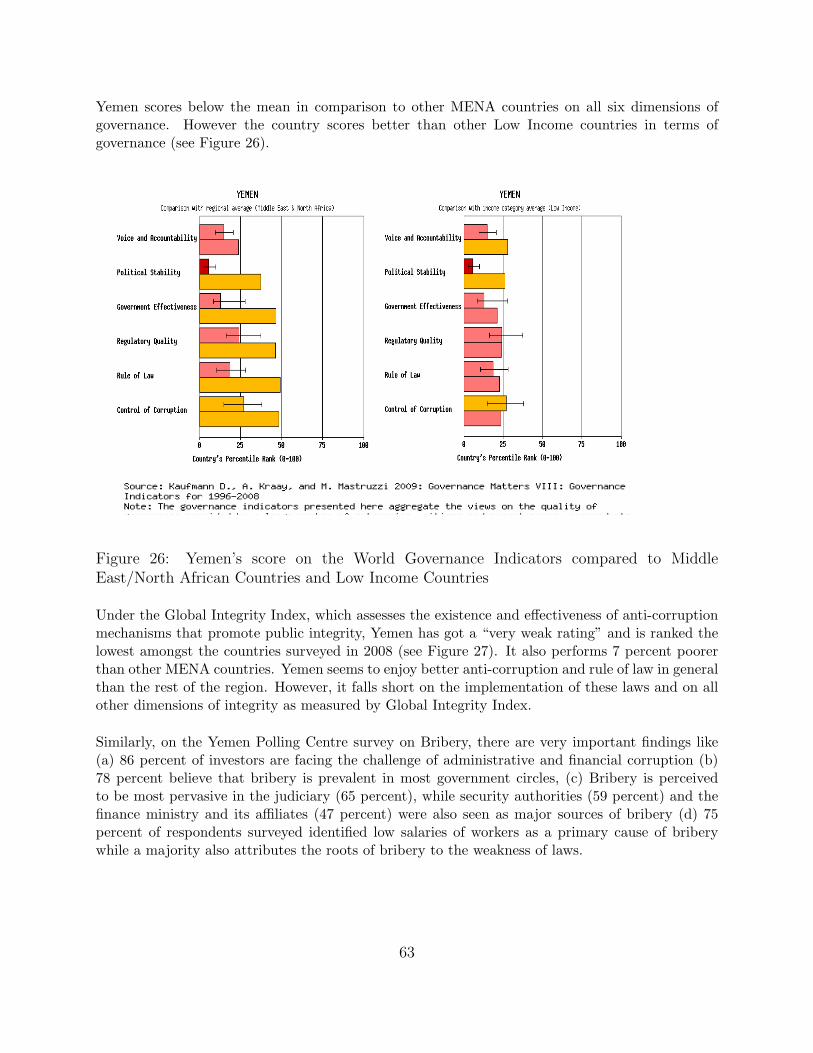
Yemen scores below the mean in comparison to other MENA countries on all six dimensions ofgovernance. However the country scores better than other Low Income countries in terms ofgovernance (see Figure 26).
Figure 26: Yemen’s score on the World Governance Indicators compared to MiddleEast/North African Countries and Low Income Countries
Under the Global Integrity Index, which assesses the existence and effectiveness of anti-corruptionmechanisms that promote public integrity, Yemen has got a “very weak rating” and is ranked thelowest amongst the countries surveyed in 2008 (see Figure 27). It also performs 7 percent poorerthan other MENA countries. Yemen seems to enjoy better anti-corruption and rule of law in generalthan the rest of the region. However, it falls short on the implementation of these laws and on allother dimensions of integrity as measured by Global Integrity Index.
Similarly, on the Yemen Polling Centre survey on Bribery, there are very important findings like(a) 86 percent of investors are facing the challenge of administrative and financial corruption (b)78 percent believe that bribery is prevalent in most government circles, (c) Bribery is perceivedto be most pervasive in the judiciary (65 percent), while security authorities (59 percent) and thefinance ministry and its affiliates (47 percent) were also seen as major sources of bribery (d) 75percent of respondents surveyed identified low salaries of workers as a primary cause of briberywhile a majority also attributes the roots of bribery to the weakness of laws.
63

Figure 27: Yemen’s Score on the Global Integrity Index compared to Middle East/NorhtAfrican Countries
64

Figure 28: Levels of health and education are appalling in Yemen
65