Overview of non parametric methods. Parametric methods. Normality.
24
Overview of non parametric methods
-
Upload
barbara-sullivan -
Category
Documents
-
view
233 -
download
0
Transcript of Overview of non parametric methods. Parametric methods. Normality.
Overview of non parametric methods
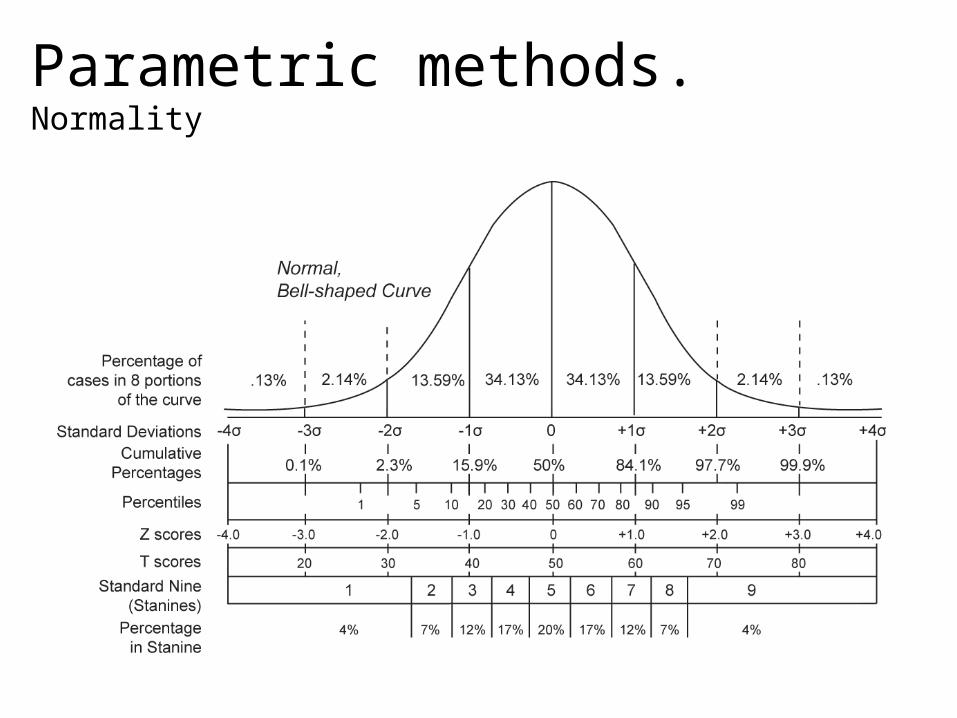
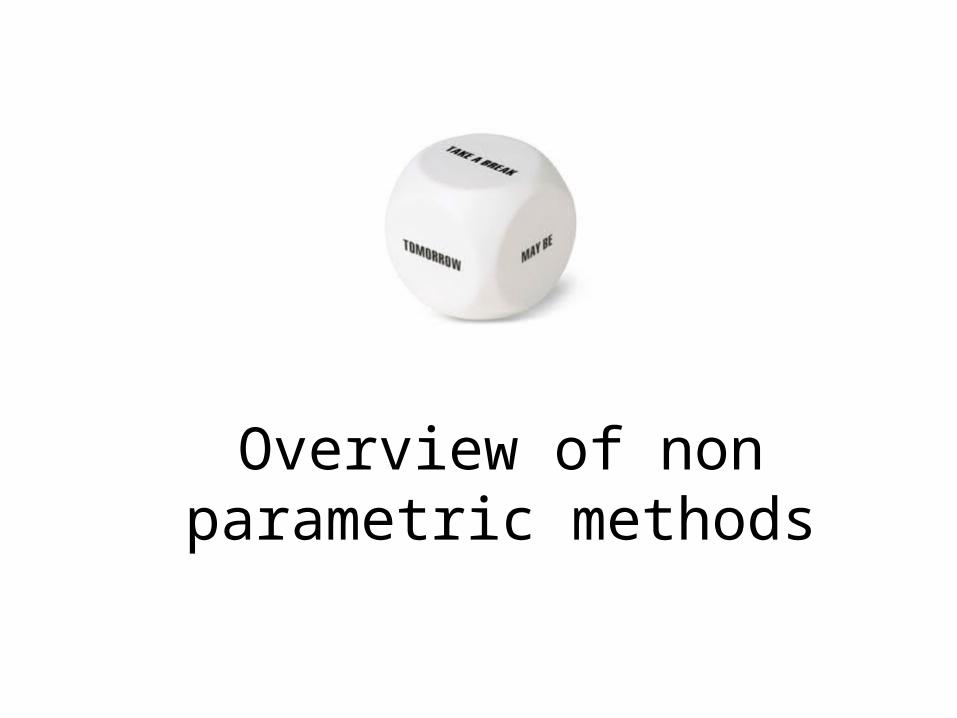
Parametric methods. Normality
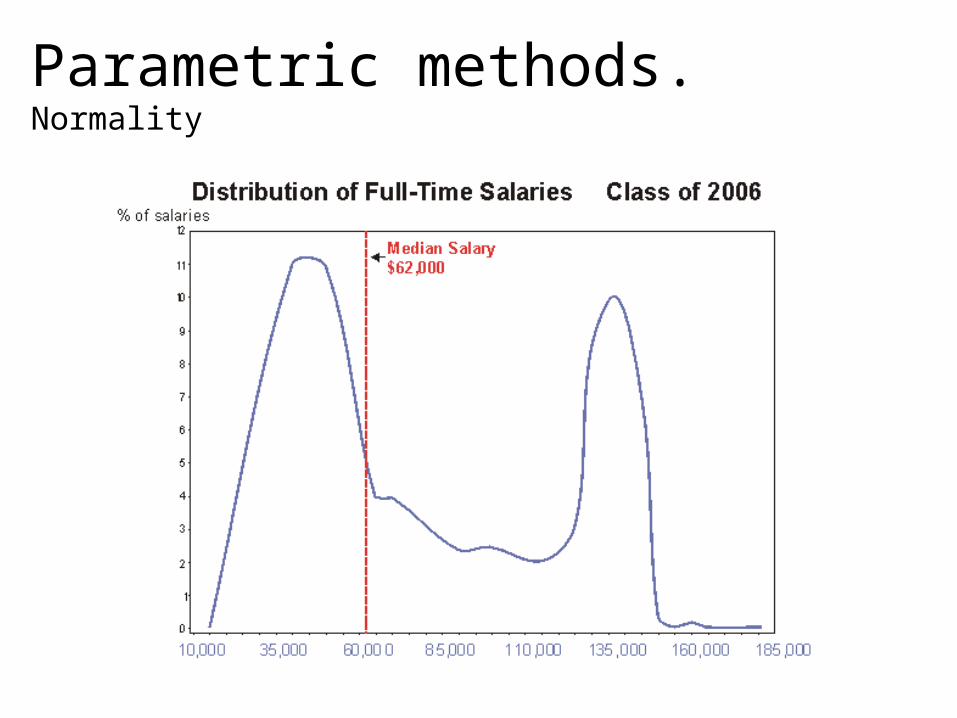
Parametric methods. Normality
Parametric methods. Sample size.
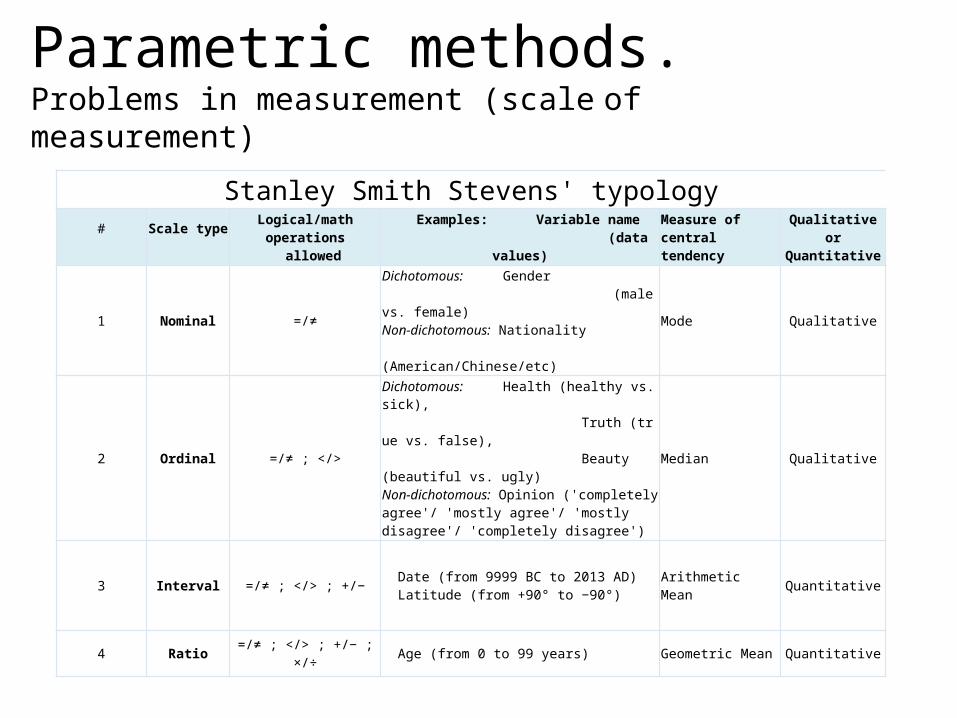
Parametric methods. Problems in measurement (scale of measurement)
Stanley Smith Stevens' typology#
Scale type
Logical/math operations allowed
Examples: Variable name (data values)
Measure ofcentral tendency
Qualitative or Quantitative
1 Nominal =/≠
Dichotomous: Gender (male vs. female)Non-dichotomous: Nationality (American/Chinese/etc)
Mode Qualitative
2 Ordinal =/≠ ; </>
Dichotomous: Health (healthy vs. sick), Truth (true vs. false), Beauty (beautiful vs. ugly)Non-dichotomous: Opinion ('completely agree'/ 'mostly agree'/ 'mostly disagree'/ 'completely disagree')
Median Qualitative
3 Interval =/≠ ; </> ; +/− Date (from 9999 BC to 2013 AD) Latitude (from +90° to −90°)
Arithmetic Mean Quantitative
4 Ratio =/≠ ; </> ; +/− ; ×/÷ Age (from 0 to 99 years) Geometric Mean Quantitative
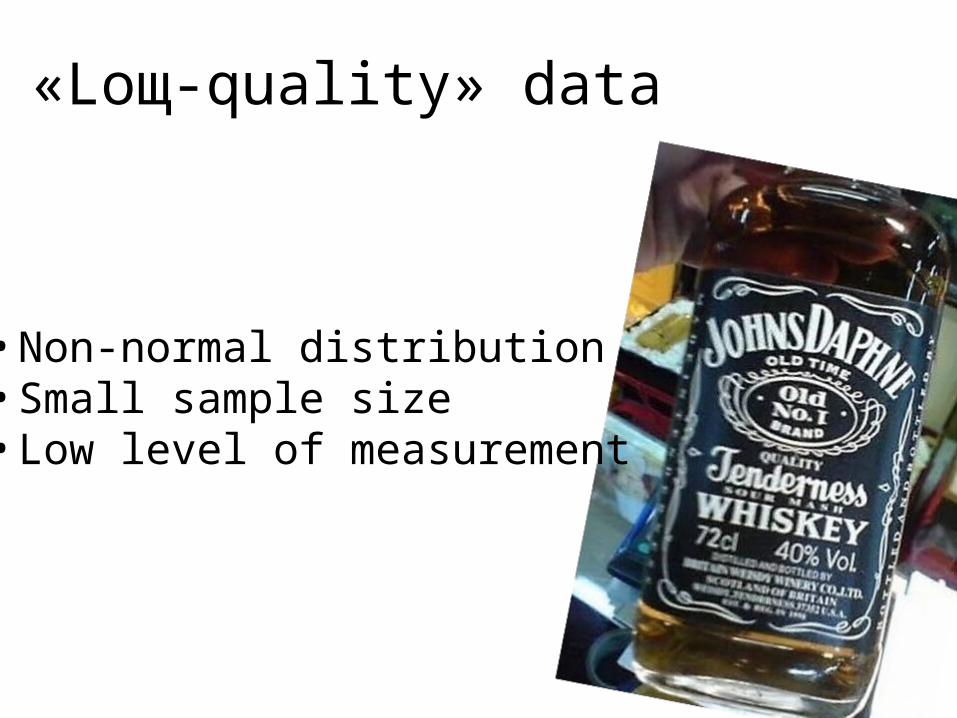
«Loщ-quality» data
• Non-normal distribution• Small sample size• Low level of measurement
Parametric and nonparametric methods(parameter-free methods or distribution-free methods.)
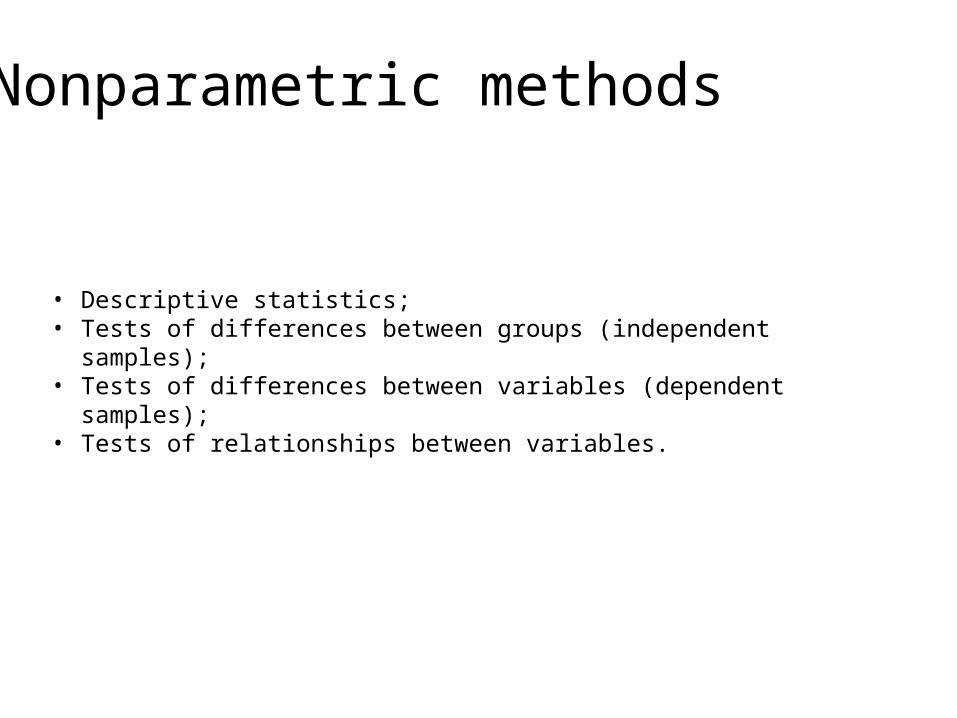
• Descriptive statistics;• Tests of differences between groups (independent samples); • Tests of differences between variables (dependent samples); • Tests of relationships between variables.
Nonparametric methods
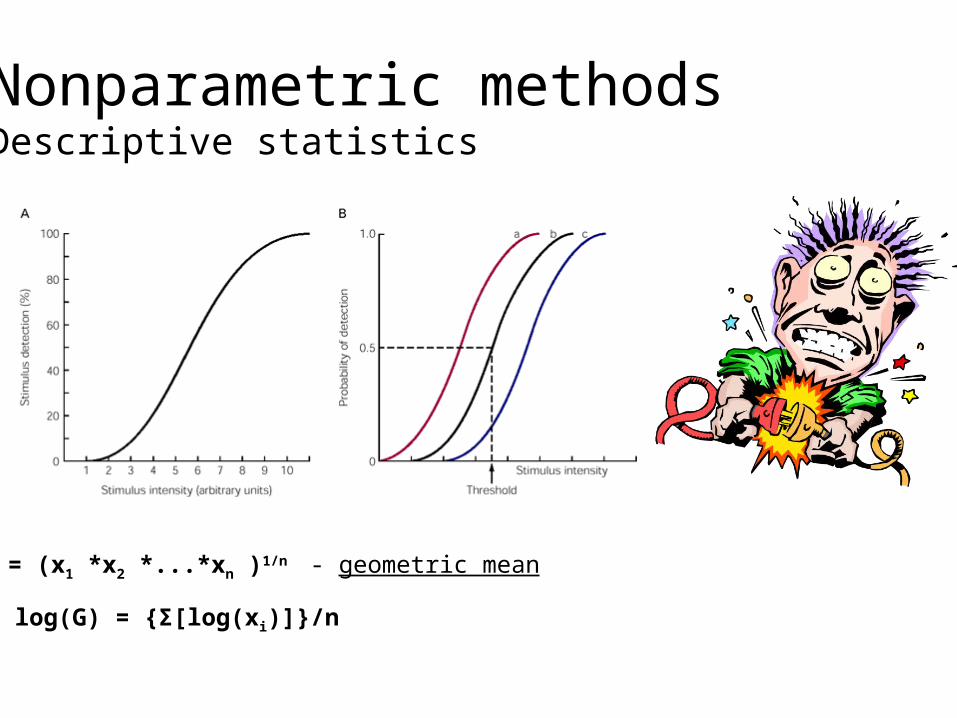
Nonparametric methodsDescriptive statistics
G = (x1 *x2 *...*xn )1/n - geometric mean
log(G) = {Σ[log(xi)]}/n
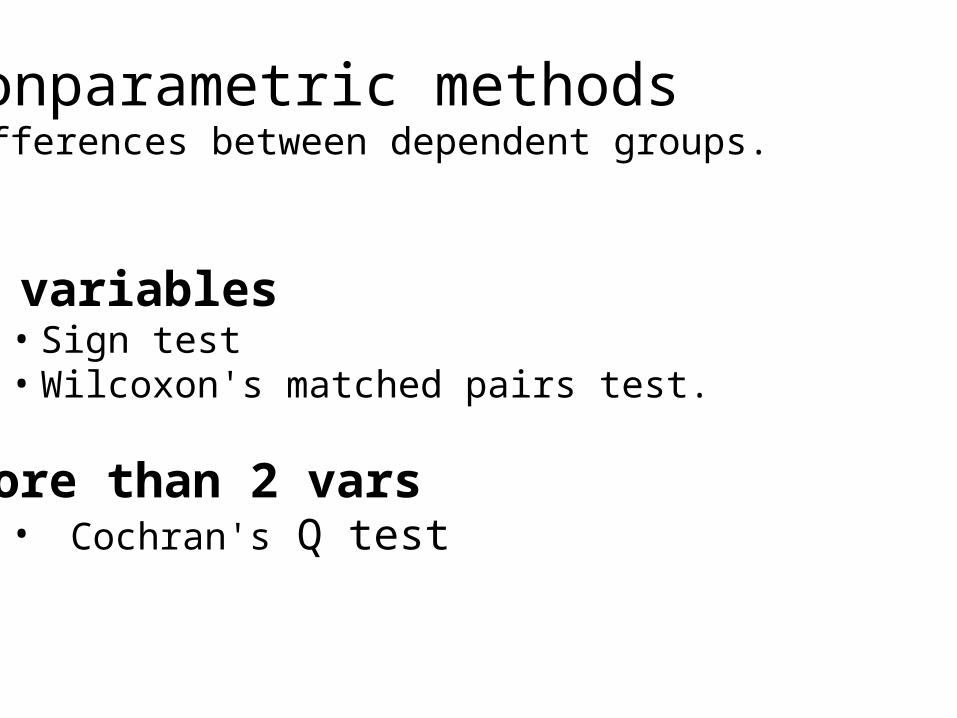
Nonparametric methodsDifferences between dependent groups.
2 variables• Sign test • Wilcoxon's matched pairs test.
More than 2 vars• Cochran's Q test
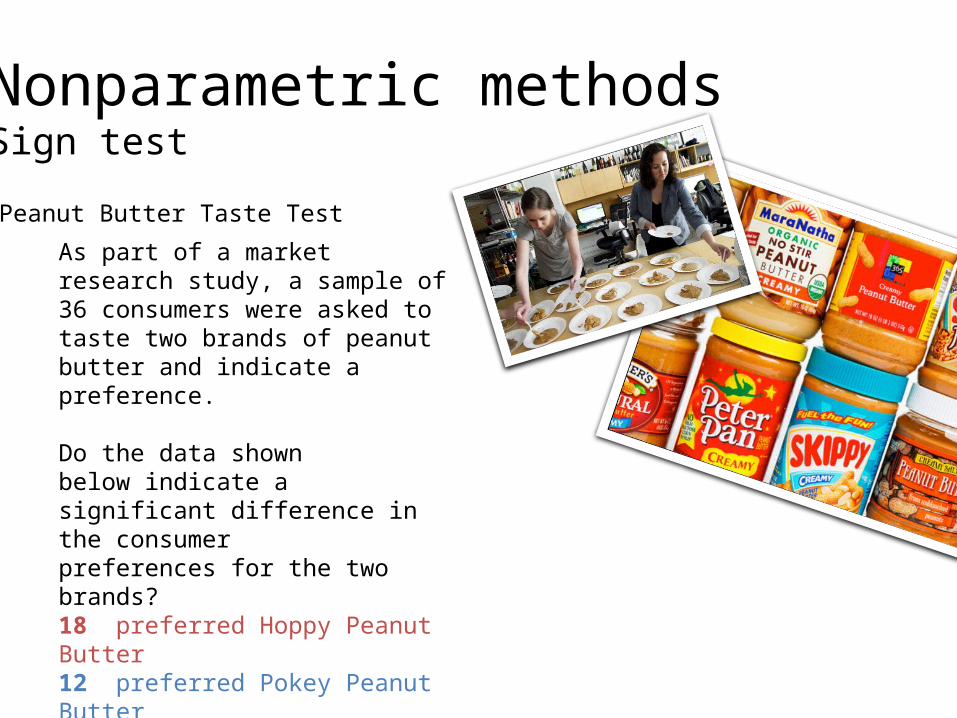
Nonparametric methodsSign test
Peanut Butter Taste Test
As part of a market research study, a sample of 36 consumers were asked to taste two brands of peanutbutter and indicate a preference.
Do the data shownbelow indicate a significant difference in the consumerpreferences for the two brands?18 preferred Hoppy Peanut Butter 12 preferred Pokey Peanut Butter6 had no preference
The analysis is based on a sample size of 18 + 12 = 30.
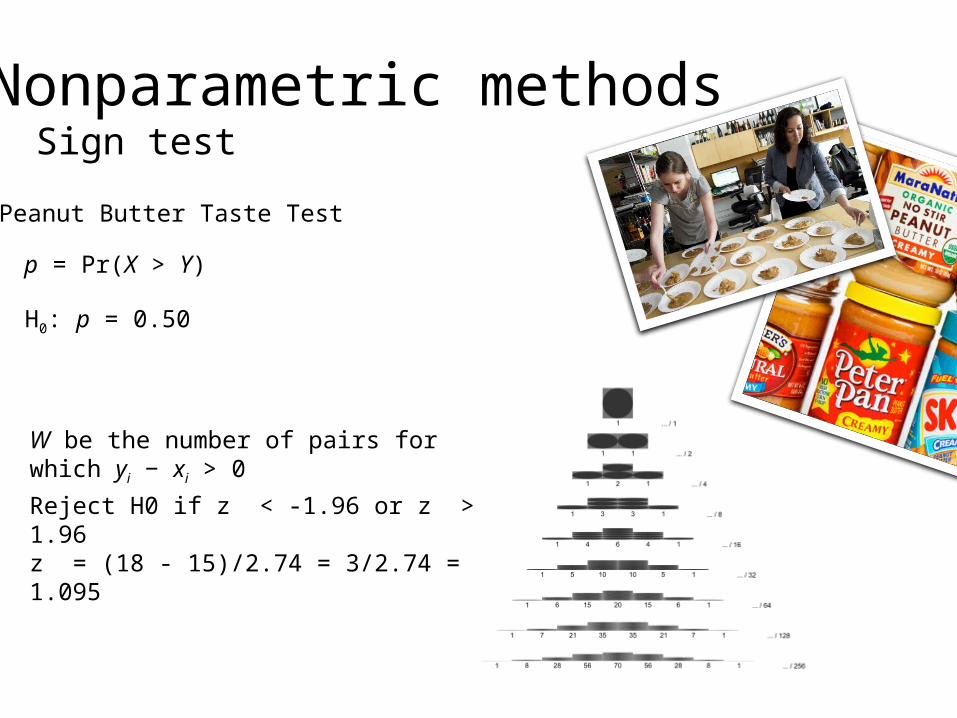
Nonparametric methodsSign test
Peanut Butter Taste Test
Reject H0 if z < -1.96 or z > 1.96z = (18 - 15)/2.74 = 3/2.74 = 1.095
H0: p = 0.50
p = Pr(X > Y)
W be the number of pairs for which yi − xi > 0
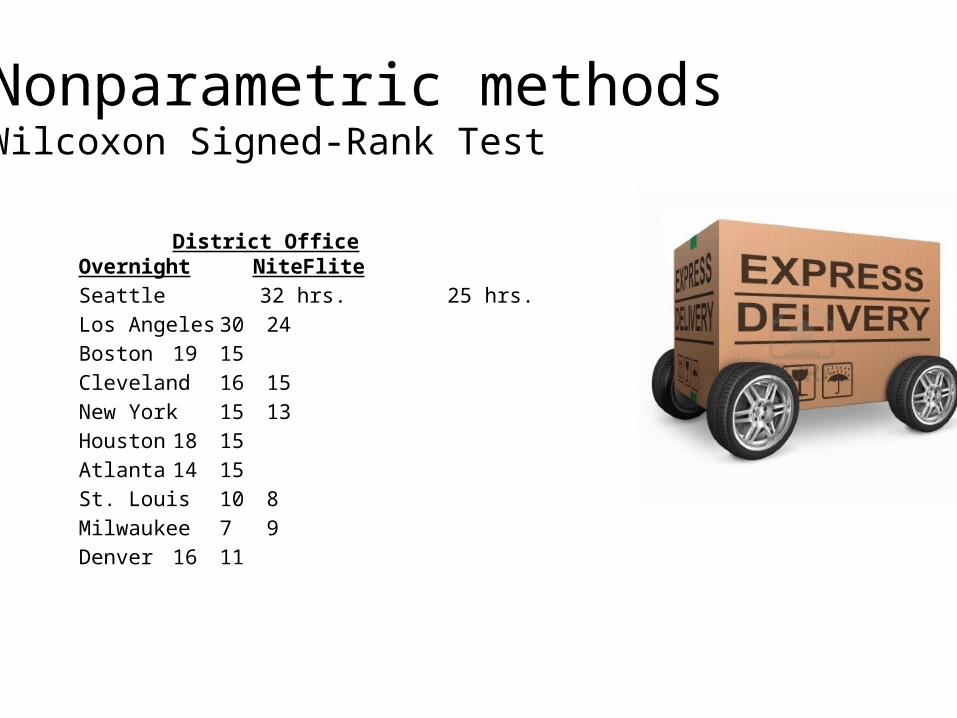
Nonparametric methodsWilcoxon Signed-Rank Test
District Office Overnight NiteFlite
Seattle 32 hrs. 25 hrs.Los Angeles 30 24Boston 19 15Cleveland 16 15New York 15 13Houston 18 15Atlanta 14 15St. Louis10 8Milwaukee 7 9Denver 16 11
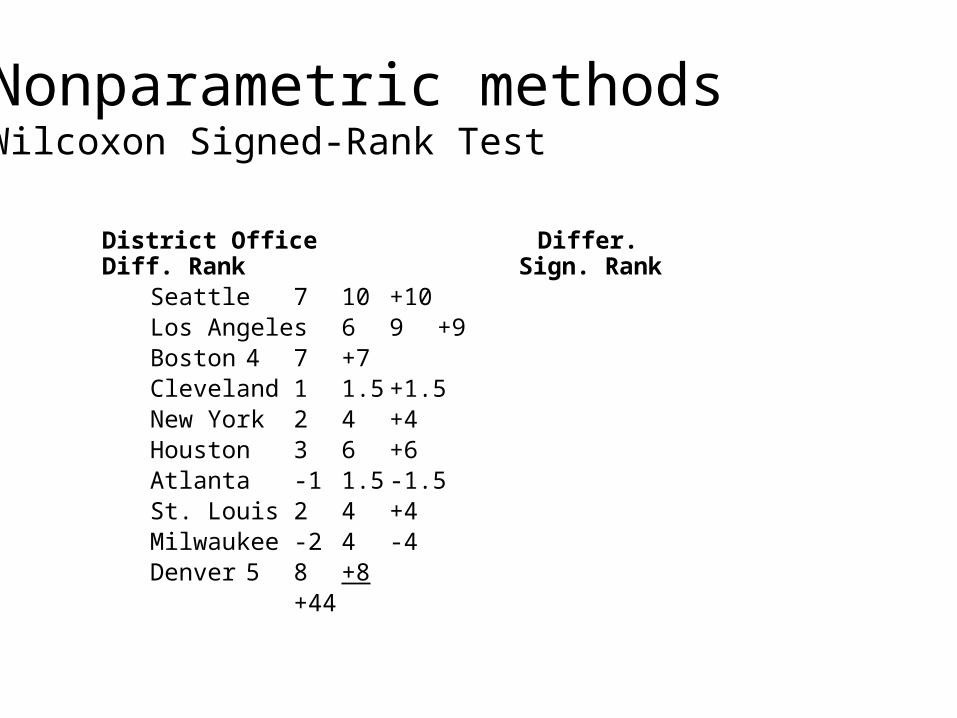
Nonparametric methodsWilcoxon Signed-Rank Test
District Office Differ. Diff. Rank Sign. Rank
Seattle 7 10 +10Los Angeles 6 9 +9Boston 4 7 +7Cleveland 1 1.5 +1.5New York 2 4 +4Houston 3 6 +6Atlanta -1 1.5 -1.5St. Louis 2 4 +4Milwaukee -2 4 -4Denver 5 8 +8
+44
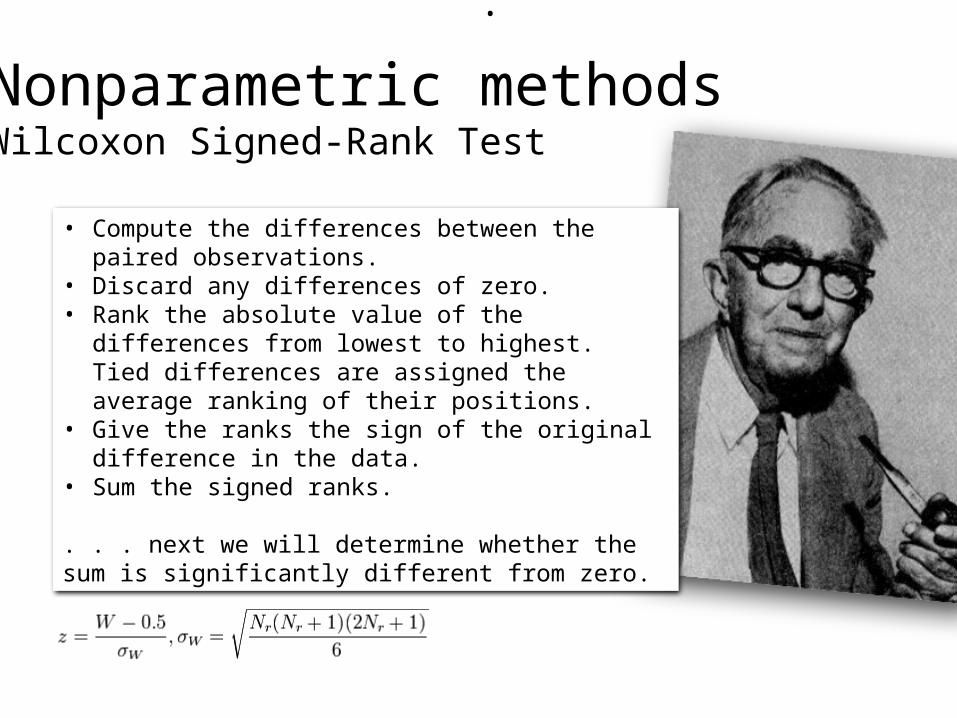
Nonparametric methodsWilcoxon Signed-Rank Test
• Compute the differences between the paired observations.
• Discard any differences of zero.• Rank the absolute value of the differences
from lowest to highest. Tied differences are assigned the average ranking of their positions.
• Give the ranks the sign of the original difference in the data.
• Sum the signed ranks.
. . . next we will determine whether the sum is significantly different from zero.
.
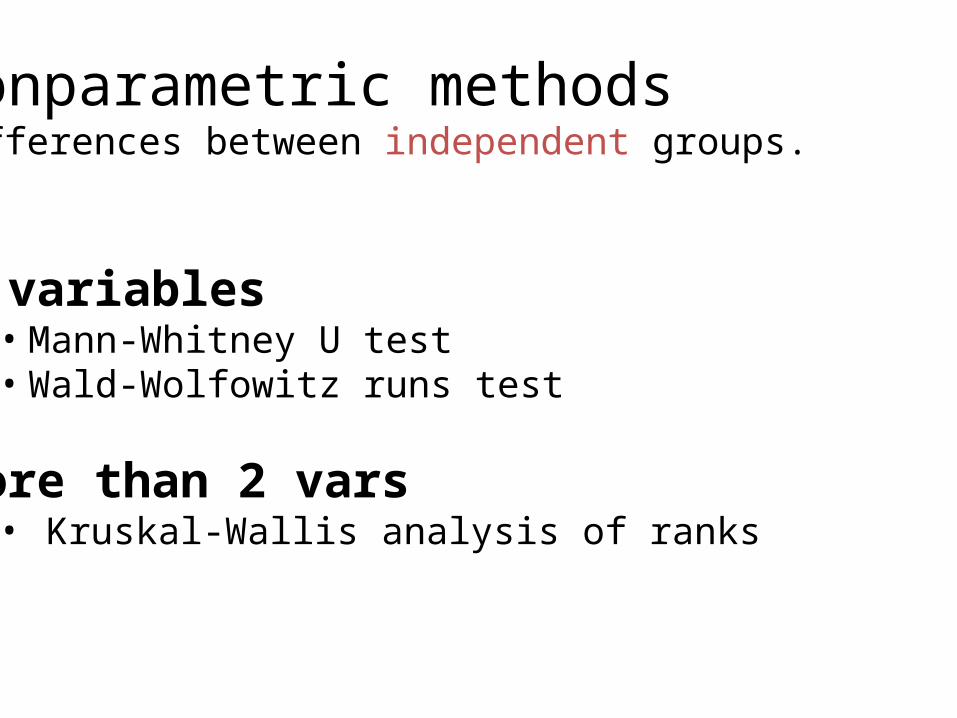
Nonparametric methodsDifferences between independent groups.
2 variables• Mann-Whitney U test• Wald-Wolfowitz runs test
More than 2 vars• Kruskal-Wallis analysis of ranks
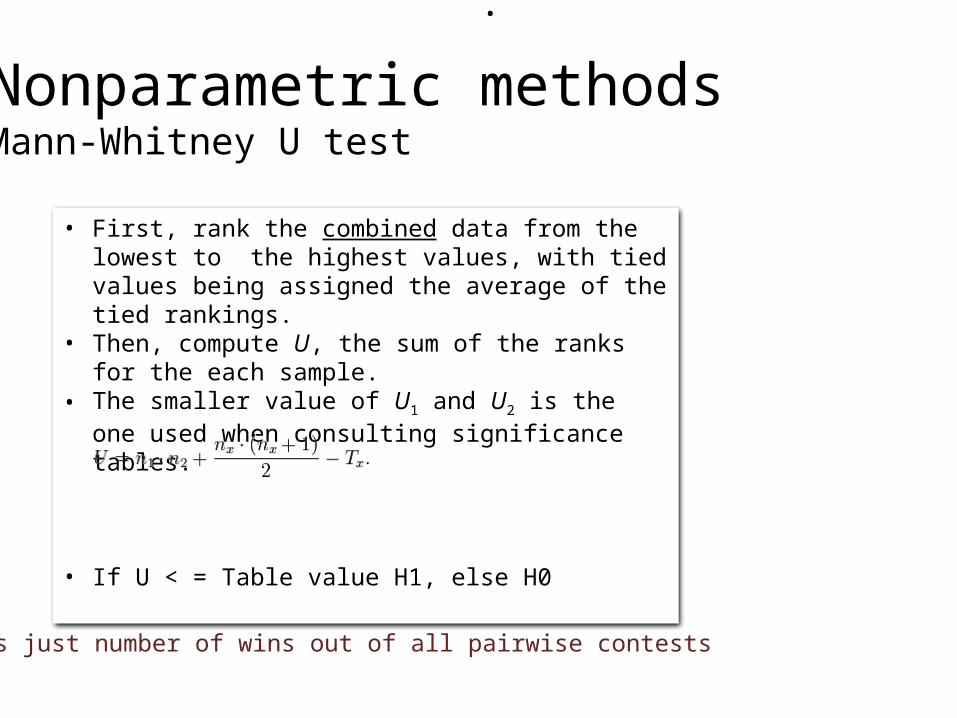
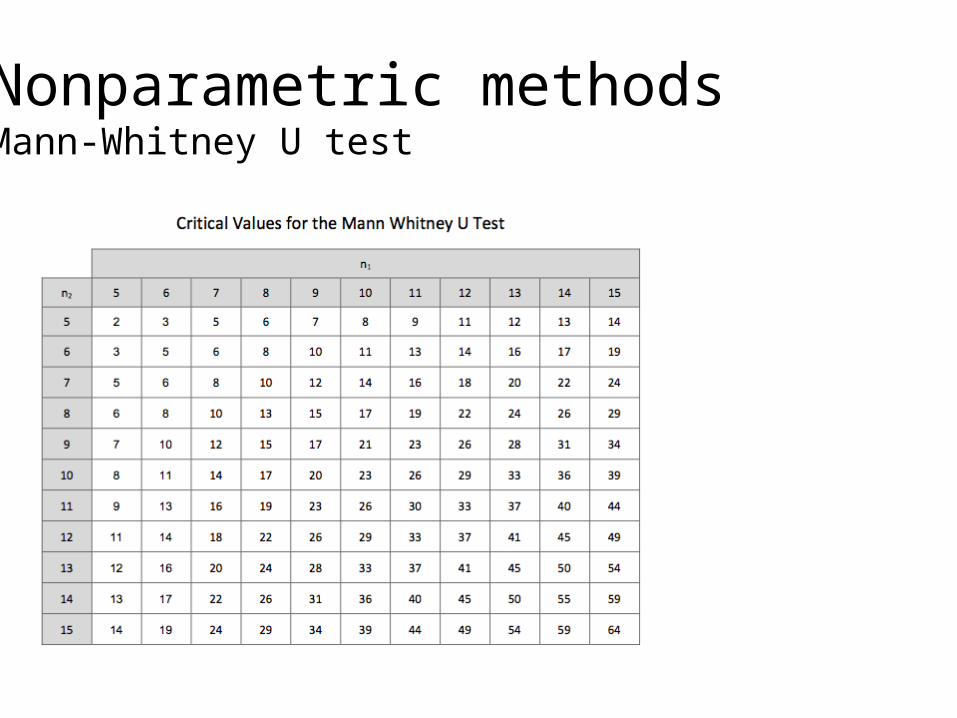
Nonparametric methodsMann-Whitney U test
• First, rank the combined data from the lowest to the highest values, with tied values being assigned the average of the tied rankings.
• Then, compute U, the sum of the ranks for the each sample.
• The smaller value of U1 and U2 is the one used when consulting significance tables.
• If U < = Table value H1, else H0
.
U is just number of wins out of all pairwise contests
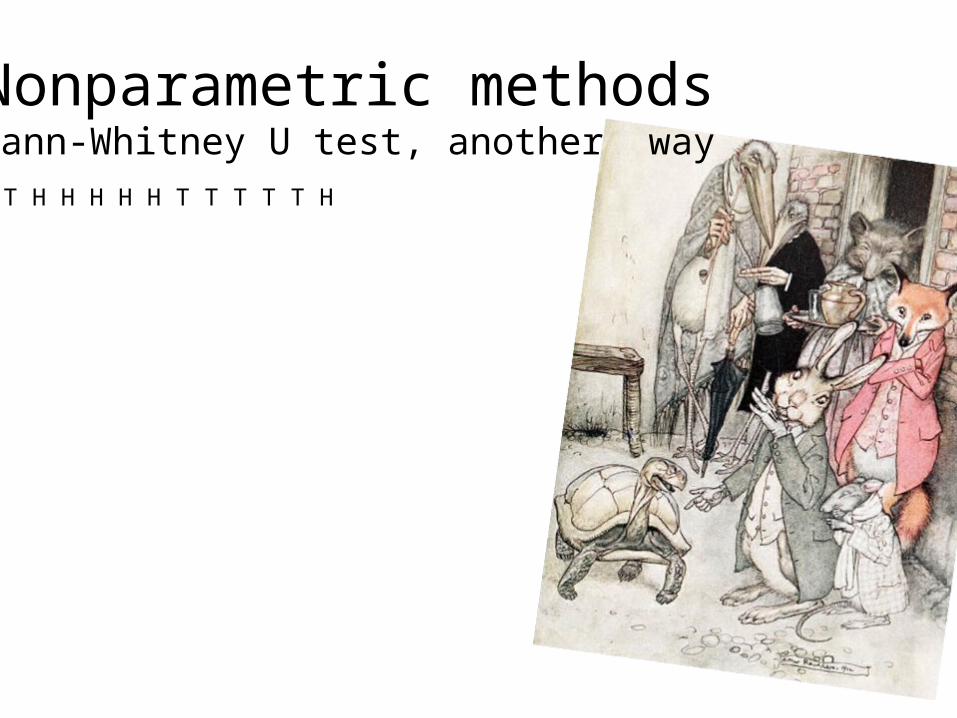
Nonparametric methodsMann-Whitney U test, another way
T H H H H H T T T T T H
Nonparametric methodsMann-Whitney U test
Nonparametric methodsTests of relationships between variables.
• Spearman, Kendall tau, Gamma correlation coefficients• 2x2 Tables
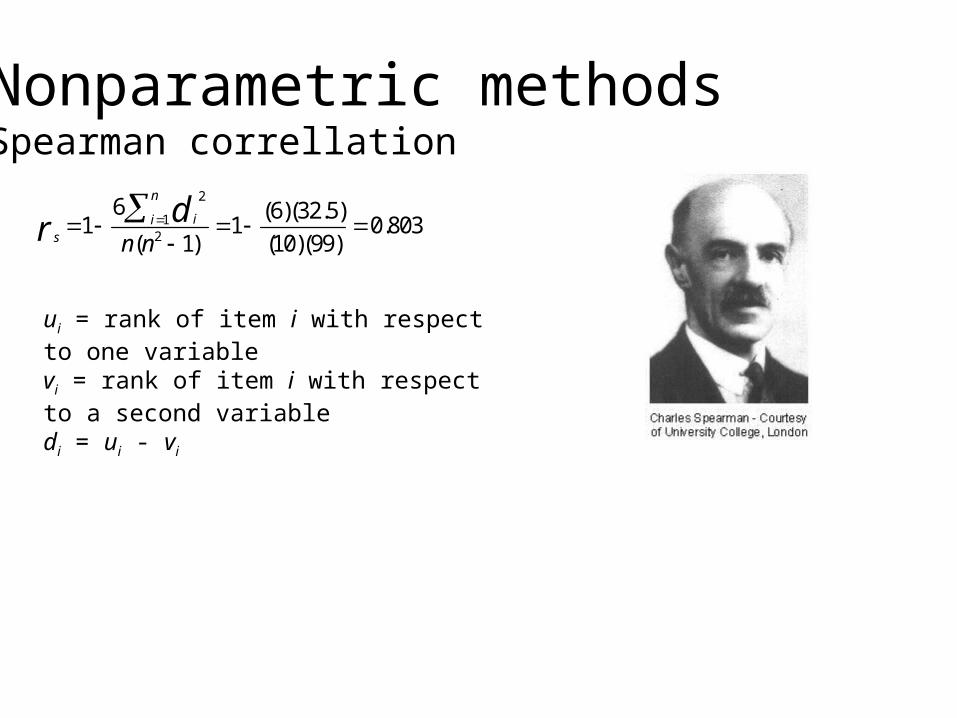
Nonparametric methodsSpearman correllation
ui = rank of item i with respect to one variable vi = rank of item i with respect to a second variabledi = ui - vi
2
12
6 (6)(32.5)1 1 0.803
( 1) (10)(99)
n
iis n n
dr
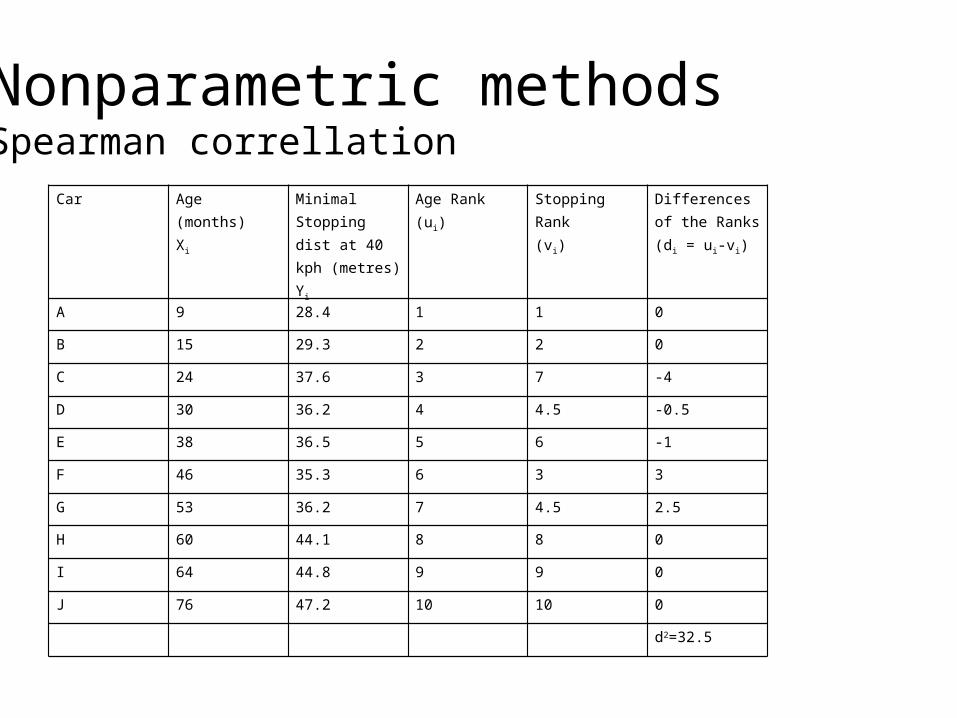
Nonparametric methodsSpearman correllation
Car Age(months)Xi
Minimal Stopping dist at 40 kph (metres)Yi
Age Rank(ui)
Stopping Rank(vi)
Differences of the Ranks (di = ui-vi)
A 9 28.4 1 1 0
B 15 29.3 2 2 0
C 24 37.6 3 7 -4
D 30 36.2 4 4.5 -0.5
E 38 36.5 5 6 -1
F 46 35.3 6 3 3
G 53 36.2 7 4.5 2.5
H 60 44.1 8 8 0
I 64 44.8 9 9 0
J 76 47.2 10 10 0
d2=32.5

Nonparametric methodsClassification and clustering
Tree Diagram for 22 Variables
Single Linkage
Euclidean distances
0 20 40 60 80 100 120
(Dlink/Dmax)*100
Copper, $/mt, nominal$Tobacco, $/mt, nominal$
Aluminum, $/mt, nominal$Platinum, $/toz, nominal$
Gold, $/toz, nominal$Wheat, Canada, $/mt, nominal$
Rice, Thailand, 5%, $/mt, nominal$Soybeans, $/mt, nominal$
Logs, Cameroon, $/cubicmeter, nominal$Maize, $/mt, nominal$Silver, $/toz, nominal$
Natural gas LNG, $/mmbtu, nominal$Natural gas, Europe, $/mmbtu, nominal$
Sugar, world, $/kg, nominal$Coffee, Arabica, $/kg, nominal$
Tea, Colombo auctions, $/kg, nominal$Cotton, A Index, $/kg, nominal$
Meat, chicken, $/kg, nominal$Meat, beef, $/kg, nominal$Iron ore, $/dmtu, nominal$
Coal, Australia, $/mt, nominal$Crude oil, Brendt, $/bbl, nominal$
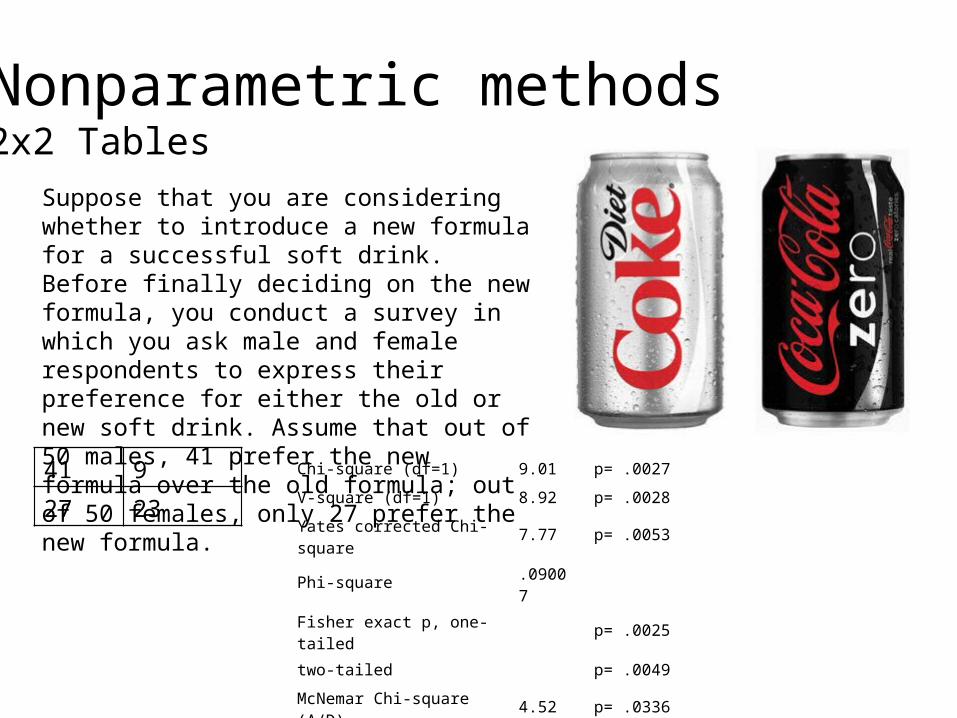
Nonparametric methods2x2 Tables
Suppose that you are considering whether to introduce a new formula for a successful soft drink. Before finally deciding on the new formula, you conduct a survey in which you ask male and female respondents to express their preference for either the old or new soft drink. Assume that out of 50 males, 41 prefer the new formula over the old formula; out of 50 females, only 27 prefer the new formula. 41 9
27 23
Chi-square (df=1) 9.01 p= .0027
V-square (df=1) 8.92 p= .0028
Yates corrected Chi-square
7.77 p= .0053
Phi-square.09007
Fisher exact p, one-tailed
p= .0025
two-tailed p= .0049
McNemar Chi-square (A/D)
4.52 p= .0336
Chi-square (B/C) 8.03 p= .0046