
Outcomes Based Leader Evaluations A Valuable Tool for …€¦ · 1 © 2008 Studer Group...
26
1 © 2008 Studer Group www.studergroup.com Outcomes-Based Leader Evaluation (LEM): A Valuable Tool for the Learning Organization Rob Ryder Vice President, Learning and Leadership Development Laurie Kennedy Director, Learning and Leadership Development Centura Health, Denver, Colorado What’s Right in Health Care SM | Evidence to Outcomes Presentation Objectives • Know the difference between outcome-based leader evaluation and tactic-based leader evaluation • Understand the difference between Leader Evaluation as a grading tool and Leader Evaluation as a learning tool. • Appreciate the power of data derived from outcomes-based leader evaluation in determining, implementing, and monitoring effective, aligned, organization-wide strategies.
Transcript of Outcomes Based Leader Evaluations A Valuable Tool for …€¦ · 1 © 2008 Studer Group...

1 © 2008 Studer Groupwww.studergroup.com
Outcomes-Based Leader Evaluation (LEM):A Valuable Tool for the Learning Organization
Rob RyderVice President, Learning and Leadership Development
Laurie KennedyDirector, Learning and Leadership Development
Centura Health, Denver, Colorado
What’s Right in Health CareSM | Evidence to Outcomes
Presentation Objectives
• Know the difference between outcome-based leader evaluation and tactic-based leader evaluation
• Understand the difference between Leader Evaluation as a grading tool and Leader Evaluation as a learning tool.
• Appreciate the power of data derived from outcomes-based leader evaluation in determining, implementing, and monitoring effective, aligned, organization-wide strategies.

2 © 2008 Studer Groupwww.studergroup.com
What’s Right in Health CareSM | Evidence to Outcomes
What is Centura Health?
• Centura Health is a large faith-based healthcare system in Colorado.
• Centura is the umbrella organization that provides corporate services and leadership to the CHI (Catholic Health Initiatives) and AHS (Adventist Health Systems) healthcare facilities on Colorado’s front range.
• Centura employs about 12,000 human beings• Over 800 of the employees are “leaders”
What’s Right in Health CareSM | Evidence to Outcomes
What does Centura Health do?
• Provides comprehensive healthcare services through its ten acute care facilities in Frisco, Boulder, Denver, Parker, Colorado Springs, Pueblo and Canon City
• Provides Home Care and Hospice Services in these communities
• Has an extensive network of Senior Services in these communities

3 © 2008 Studer Groupwww.studergroup.com
What’s Right in Health CareSM | Evidence to Outcomes
Where We’re Located
What’s Right in Health CareSM | Evidence to Outcomes

4 © 2008 Studer Groupwww.studergroup.com
What’s Right in Health CareSM | Evidence to Outcomes
What’s Right in Health CareSM | Evidence to Outcomes

5 © 2008 Studer Groupwww.studergroup.com
What’s Right in Health CareSM | Evidence to Outcomes
What’s Right in Health CareSM | Evidence to Outcomes
6 © 2008 Studer Groupwww.studergroup.com
What’s Right in Health CareSM | Evidence to Outcomes
What’s Right in Health CareSM | Evidence to Outcomes

7 © 2008 Studer Groupwww.studergroup.com
What’s Right in Health CareSM | Evidence to Outcomes
What’s Right in Health CareSM | Evidence to Outcomes

8 © 2008 Studer Groupwww.studergroup.com
What’s Right in Health CareSM | Evidence to Outcomes
What’s Right in Health CareSM | Evidence to Outcomes
Getting Started
• Had been working towards a balanced approach to system effectiveness for several years
• In spite of concentrated efforts to create positive change, our metrics were flat
• We engaged the Studer Group in 2006 because we believed that they could help give “legs” to the work we were doing
• Outcomes based leadership evaluation is a key tactic for moving the dials
9 © 2008 Studer Groupwww.studergroup.com
What’s Right in Health CareSM | Evidence to Outcomes
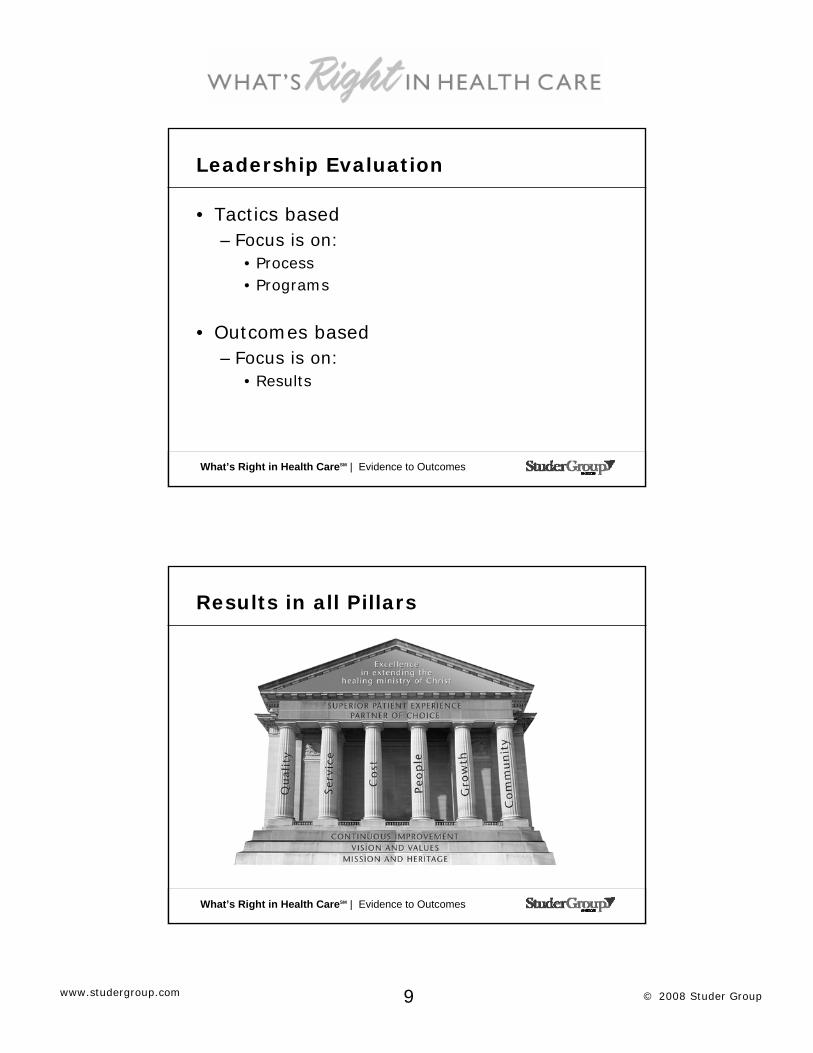
Leadership Evaluation
• Tactics based– Focus is on:
• Process• Programs
• Outcomes based– Focus is on:
• Results
What’s Right in Health CareSM | Evidence to Outcomes
Results in all Pillars

10 © 2008 Studer Groupwww.studergroup.com
What’s Right in Health CareSM | Evidence to Outcomes
Leader Evaluation ManagerSM (LEM)
• Software program that allows a systematic way to establish and monitor achievement of strategically aligned goals
• Commonly referred to as the “LEM”
What’s Right in Health CareSM | Evidence to Outcomes
Goal Sheet

11 © 2008 Studer Groupwww.studergroup.com
What’s Right in Health CareSM | Evidence to Outcomes
90 Day Plan
What’s Right in Health CareSM | Evidence to Outcomes
Monthly Report Card

12 © 2008 Studer Groupwww.studergroup.com
What’s Right in Health CareSM | Evidence to Outcomes
Decisions we made…
• What organizational goals will we align to?• What are the targets? i.e., How will we know
when a goal has been achieved?• Who will participate?• How will new leaders learn about the LEM?• What data will be used to populate the LEM?• What goals should be required?• How will achievement of goals be connected to
pay?
What’s Right in Health CareSM | Evidence to Outcomes
Challenges
• Compliance• Orienting new leaders to system• Selecting tactics instead of goals• No interface to our employee database• Executive Incentive plans not aligned with LEM
outcomes• Understanding that a Rating of “3” means
GOOD!• Owning overarching goals when leader only
has influence vs. direct control• Consistency

13 © 2008 Studer Groupwww.studergroup.com
What’s Right in Health CareSM | Evidence to Outcomes
Why LEM as a Learning Tool?
• LEM is a living document not an event• LEM is objective• LEM produces data• LEM data tells a story
– About the leader and– About the organization
What’s Right in Health CareSM | Evidence to Outcomes
LEM Goal Data Base Fields
• Department• Division• Facility Type• Last Name• First name• Job Type
• Executive Type• Pillar• Goal• Goal Type• Goal Weight

14 © 2008 Studer Groupwww.studergroup.com
What’s Right in Health CareSM | Evidence to Outcomes
Job Types
• Medical Staff Svcs
• IT• Marketing• Nursing Units• Foundation• Pt. Education• Gift Shop• Cardiology• Oncology• Facilities• Pulmonary• Physicians• Volunteers• HR• Rehab
• Clinical/nursing education.• HIM
• Billing• Imaging• Health at Home• EVS• Finance• Lab• Quality• Nut. Services• Supply chain• Pharmacy• Cancer Center• Registration• O's & VP'sInfrastructureAncillaryClinicalSupportExec/Admin
What’s Right in Health CareSM | Evidence to Outcomes
Strategic Focus
1. Physician Alignment2. CMS Bundle Scores3. Patient Satisfaction (HCAHPS)4. Associate Satisfaction5. Financial Performance
– EBITDA– Expense– Productivity– Growth

15 © 2008 Studer Groupwww.studergroup.com
What’s Right in Health CareSM | Evidence to Outcomes
Goal Types
• Accreditation/JCAHO/Compliance• Assoc Satisfaction• CMS Bundle/ Clinical Outcomes• Community Budget• Community Board• Community Participation• Community Perception• EBITDA/Margin• Expense• Fund Raising• Interdepartmental Satisfaction
• Physician Credentials• Physician Satisfaction• Process/Process Imp./Training• Productivity/Staffing/Agency• Pt/Res/Client/Customer Satisfaction• Revenue/Collections• Safety• TAT• Turnover• Volume/Growth
What’s Right in Health CareSM | Evidence to Outcomes
The Normal Look at Organizational Effort
3658Grand Total
0.11%4Comm Board
0.19%7Comm Bgt
0.27%10Phys Credentials
0.46%17Comm Perception
0.33%12Fund Raising
0.55%20Accreditation/JCAHO/Compliance
1.56%57EBITDA/TTL Bgt/Margin
1.97%72Safety
2.08%76TAT
3.47%127Turnover
3.61%132Phys. Sat
6.23%228Comm Participation
3.72%136Revenue/Collections
5.11%187Process/PI/Training
5.52%202CMS Bundle/ Cinical Outcomes
8.17%299Productivity/Staffing/Agency
7.11%260Volume/Growth
6.59%241Interdept Sat
9.73%356Pt/Res/Client/Customer Sat
15.31%560Expense
17.91%655Assoc Sat
% of GoalsCountGoal Type Reclass

16 © 2008 Studer Groupwww.studergroup.com
What’s Right in Health CareSM | Evidence to Outcomes
A Closer Look
3658Grand Total
12.50%0.11%4Comm Board
12.14%0.19%7Comm Bgt
21.00%0.27%10Phys Credentials
17.29%0.46%17Comm Perception
29.00%0.33%12Fund Raising
20.25%0.55%20Accreditation/JCAHO/Compliance
16.97%1.56%57EBITDA/TTL Bgt/Margin
19.28%1.97%72Safety
19.97%2.08%76TAT
13.52%3.47%127Turnover
14.34%3.61%132Phys. Sat
10.11%6.23%228Comm Participation
21.34%3.72%136Revenue/Collections
19.55%5.11%187Process/PI/Training
19.28%5.52%202CMS Bundle/ Cinical Outcomes
15.66%8.17%299Productivity/Staffing/Agency
18.99%7.11%260Volume/Growth
20.66%6.59%241Interdept Sat
18.52%9.73%356Pt/Res/Client/Customer Sat
15.67%15.31%560Expense
20.84%17.91%655Assoc Sat
AvgWght% of GoalsCountGoal Type Reclass
What’s Right in Health CareSM | Evidence to Outcomes
The Closest Look
100.00%3658Grand Total
12.50%0.08%0.11%4Comm Board
12.14%0.13%0.19%7Comm Bgt
21.00%0.32%0.27%10Phys Credentials
17.29%0.45%0.46%17Comm Perception
29.00%0.53%0.33%12Fund Raising
20.25%0.62%0.55%20Accreditation/JCAHO/Compliance
16.97%1.48%1.56%57EBITDA/TTL Bgt/Margin
19.28%2.13%1.97%72Safety
19.97%2.33%2.08%76TAT
13.52%2.63%3.47%127Turnover
14.34%2.90%3.61%132Phys. Sat
10.11%3.53%6.23%228Comm Participation
21.34%4.45%3.72%136Revenue/Collections
19.55%5.60%5.11%187Process/PI/Training
19.28%5.97%5.52%202CMS Bundle/ Cinical Outcomes
15.66%7.18%8.17%299Productivity/Staffing/Agency
18.99%7.57%7.11%260Volume/Growth
20.66%7.63%6.59%241Interdept Sat
18.52%10.10%9.73%356Pt/Res/Client/Customer Sat
15.67%13.45%15.31%560Expense
20.84%20.92%17.91%655Assoc Sat
AvgWght
% of TtlWght% of GoalsCountGoal Type Reclass

17 © 2008 Studer Groupwww.studergroup.com
What’s Right in Health CareSM | Evidence to Outcomes
Total
0.00%
5.00%
10.00%
15.00%
20.00%
25.00%Ac
cred
itatio
n/JC
AHO
/Com
plia
nce
Asso
c Sa
t
CM
S Bu
ndle
/ Cin
ical
Out
com
es
Com
m B
gt
Com
m B
oard
Com
m P
artic
ipat
ion
Com
m P
erce
ptio
n
EBIT
DA/
TTL
Bgt/M
argi
n
Expe
nse
Fund
Rai
sing
Inte
rdep
t Sat
Phys
Cre
dent
ials
Phys
. Sat
Proc
ess/
PI/T
rain
ing
Prod
uctiv
ity/S
taffi
ng/A
genc
y
Pt/R
es/C
lient
/Cus
tom
er S
at
Rev
enue
/Col
lect
ions
Safe
ty
TAT
Turn
over
Volu
me/
Gro
wth
Total
Facility Type (All)
Sum of Goal Wt%
Goal Type Reclass
Drop Series Fields Here
Effort Placement by Goal Type by Job Type
What’s Right in Health CareSM | Evidence to Outcomes
Executive Effort Placement by Pillar
0.00%
5.00%
10.00%
15.00%
20.00%
25.00%
30.00%
35.00%
40.00%
45.00%
Community Cost Grow th People Quality Service
CEO
CFO
CMO
CNO
COO
Facility Type (All)
Sum of Goal Wt%
Pillar
Executive Type

18 © 2008 Studer Groupwww.studergroup.com
What’s Right in Health CareSM | Evidence to Outcomes
Executive Effort Placement by Goal Type
0.00%
5.00%
10.00%
15.00%
20.00%
25.00%
30.00%
35.00%
40.00%As
soc
Sat
CM
S Bu
ndle
/ Cin
ical
Out
com
es
Com
m B
gt
Com
m B
oard
Com
m P
artic
ipat
ion
Com
m P
erce
ptio
n
EBIT
DA/
TTL
Bgt/M
argi
n
Expe
nse
Inte
rdep
t Sat
Phys
Cre
dent
ials
Phys
. Sat
Proc
ess/
PI/T
rain
ing
Prod
uctiv
ity/S
taffi
ng/A
genc
y
Pt/R
es/C
lient
/Cus
tom
er S
at
Rev
enue
/Col
lect
ions
Safe
ty
Turn
over
Volu
me/
Gro
wth
CEO
CFO
CMO
CNO
COO
Facility Type (All)
Sum of Goal Wt%
Goal Type Reclass
Executive Type
What’s Right in Health CareSM | Evidence to Outcomes
0.00%
5.00%
10.00%
15.00%
20.00%
25.00%
30.00%
35.00%
40.00%
45.00%
Asso
c Sa
t
CM
S Bu
ndle
/ Cin
ical
Out
com
es
EBIT
DA/
TTL
Bgt/M
argi
n
Expe
nse
Phys
. Sat
Prod
uctiv
ity/S
taffi
ng/A
genc
y
Pt/R
es/C
lient
/Cus
tom
er S
at
Volu
me/
Gro
wth
CEO
CFO
CMO
CNO
COO
Facility Type (All)
Sum of Goal Wt%
Goal Type Reclass
Executive Type
Executive Effort Placement by Strategic Emphasis

19 © 2008 Studer Groupwww.studergroup.com
What’s Right in Health CareSM | Evidence to Outcomes
Exec/Admin
0.00%
5.00%
10.00%
15.00%
20.00%
25.00%
30.00%
Asso
c Sa
t
CM
S Bu
ndle
/ Cin
ical
Out
com
es
EBIT
DA/
TTL
Bgt/M
argi
n
Expe
nse
Phys
. Sat
Prod
uctiv
ity/S
taffi
ng/A
genc
y
Pt/R
es/C
lient
/Cus
tom
er S
at
Exec/Admin
Facility Type (All) DIV (All)
Sum of Goal Wt%
Goal Type Reclass
Job Type
Combined Executive Effort by Strategic Emphasis
What’s Right in Health CareSM | Evidence to Outcomes
Job Types
• Medical Staff Svcs
• IT• Marketing• Nursing Units• Foundation• Pt. Education• Gift Shop• Cardiology• Oncology• Facilities• Pulmonary• Physicians• Volunteers• HR• Rehab
• Clinical/nursing education.• HIM
• Billing• Imaging• Health at Home• EVS• Finance• Lab• Quality• Nut. Services• Supply chain• Pharmacy• Cancer Center• Registration• O's & VP'sInfrastructureAncillaryClinicalSupportExec/Admin

20 © 2008 Studer Groupwww.studergroup.com
What’s Right in Health CareSM | Evidence to Outcomes
Effort Placement by Pillar by Job Type
0.00%
5.00%
10.00%
15.00%
20.00%
25.00%
30.00%
Community Cost Grow th People Quality Service
Ancillary
Clinical
Exec/Admin
Infrastructure
Support
Facility Type (All)
Sum of Goal Wt%
Pillar
Job Type
What’s Right in Health CareSM | Evidence to Outcomes
Effort Placement by Goal Type by Job Type
0.00%
5.00%
10.00%
15.00%
20.00%
25.00%
Accr
edita
tion/
JCAH
O/C
ompl
ianc
e
Asso
c Sa
t
CM
S Bu
ndle
/ Cin
ical
Out
com
es
Com
m B
gt
Com
m B
oard
Com
m P
artic
ipat
ion
Com
m P
erce
ptio
n
EBIT
DA/
TTL
Bgt/M
argi
n
Expe
nse
Fund
Rai
sing
Inte
rdep
t Sat
Phys
Cre
dent
ials
Phys
. Sat
Proc
ess/
PI/T
rain
ing
Prod
uctiv
ity/S
taffi
ng/A
genc
y
Pt/R
es/C
lient
/Cus
tom
er S
at
Rev
enue
/Col
lect
ions
Safe
ty
TAT
Turn
over
Volu
me/
Gro
wth
Ancillary
Clinical
Exec/Admin
Infrastructure
Support
DIV (All)
Sum of Goal Wt%
Goal Type Reclass
Job Type

21 © 2008 Studer Groupwww.studergroup.com
What’s Right in Health CareSM | Evidence to Outcomes
0.00%
5.00%
10.00%
15.00%
20.00%
25.00%
30.00%
35.00%
40.00%
Asso
c Sa
t
CM
S Bu
ndle
/ Cin
ical
Out
com
es
EBIT
DA/
TTL
Bgt/M
argi
n
Expe
nse
Phys
. Sat
Prod
uctiv
ity/S
taffi
ng/A
genc
y
Pt/R
es/C
lient
/Cus
tom
er S
at
Volu
me/
Gro
wth
Ancillary
Clinical
Exec/Admin
Infrastructure
Support
Facility Type (All)
Sum of Goal Wt%
Goal Type Reclass
Job Type
Effort Placement by Strategic Emphasis by Job Type
What’s Right in Health CareSM | Evidence to Outcomes
Total
0.00%
5.00%
10.00%
15.00%
20.00%
25.00%
30.00%
35.00%
Asso
c Sa
t
CM
S Bu
ndle
/ Cin
ical
Out
com
es
EBIT
DA/
TTL
Bgt/M
argi
n
Expe
nse
Phys
. Sat
Prod
uctiv
ity/S
taffi
ng/A
genc
y
Pt/R
es/C
lient
/Cus
tom
er S
at
Volu
me/
Gro
wth
Total
Facility Type (All)
Sum of Goal Wt%
Goal Type Reclass
Drop Series Fields Here
Combined Effort by Strategic Emphasis (All Job Types)

22 © 2008 Studer Groupwww.studergroup.com
What’s Right in Health CareSM | Evidence to Outcomes
Total
0.00%
5.00%
10.00%
15.00%
20.00%
25.00%Ac
cred
itatio
n/JC
AHO
/Com
plia
nce
Asso
c Sa
t
CM
S Bu
ndle
/ Cin
ical
Out
com
es
Com
m B
gt
Com
m B
oard
Com
m P
artic
ipat
ion
Com
m P
erce
ptio
n
EBIT
DA/
TTL
Bgt/M
argi
n
Expe
nse
Fund
Rai
sing
Inte
rdep
t Sat
Phys
Cre
dent
ials
Phys
. Sat
Proc
ess/
PI/T
rain
ing
Prod
uctiv
ity/S
taffi
ng/A
genc
y
Pt/R
es/C
lient
/Cus
tom
er S
at
Rev
enue
/Col
lect
ions
Safe
ty
TAT
Turn
over
Volu
me/
Gro
wth
Total
Facility Type (All)
Sum of Goal Wt%
Goal Type Reclass
Drop Series Fields Here
Effort Placement by Goal Type by Job Type
What’s Right in Health CareSM | Evidence to Outcomes
Conclusions
• Effort tends to be focused on what we control, not what we can influence
• Number of leaders choosing a given goal is not an indication of the effort that will be expended towards attaining that goal
• Goal alignment among executives cannot be assumed

23 © 2008 Studer Groupwww.studergroup.com
What’s Right in Health CareSM | Evidence to Outcomes
Try not. Do, or do not. There is no 'try.'
What’s Right in Health CareSM | Evidence to Outcomes
The “Learning Organization” . . .How well do we know ourselves?
• Are individual intentions aligned with organizational intentions?
• Is our effort aligned towards the same outcomes?
• It’s not how well we are doing, it’s how well we’re doing on the right stuff!

24 © 2008 Studer Groupwww.studergroup.com
What’s Right in Health CareSM | Evidence to Outcomes
0.0%10.0%20.0%30.0%40.0%50.0%60.0%70.0%80.0%90.0%
100.0%
July-Sept01
Sept-Nov01
Dec01 -Feb02
Mar02 -May02
June-Aug02
Sept- Nov
02
Dec02 -Feb03
Mar03 -May03
June- Aug
03
Sept- Nov
03
Dec03 -Feb04
Mar -May04
June- Aug
04
Sept- Nov
04
0.0%
10.0%
20.0%
30.0%
40.0%
50.0%
60.0%
July-Sept01
Sept-Nov01
Dec01 -Feb02
Mar02 -May02
June-Aug02
Sept -Nov02
Dec02 -Feb03
Mar03 -May03
June -Aug03
Sept -Nov03
Dec03 -Feb04
Mar -May04
June -Aug04
Sept -Nov04
LEARNING . . . .
is what fills the space between where you are . . . .
. . . . . and where you want to be!
The Right People!The Right Effort!On the Right Stuff!
What’s Right in Health CareSM | Evidence to Outcomes
Lessons Learned
• Educate the Board: align goals and incentives• Targets must be meaningful and achievable• Goal setting process must start at top and
cascade down to ensure alignment and focus• Data must be accessible and consistent• Use more pre-populated goal templates • Be clear about philosophy when designing• Reporting outcomes in multiple ways reduces
compliance• A LEM or “LEM-like” tool provides a powerful
and necessary infrastructure for achieving goals
25 © 2008 Studer Groupwww.studergroup.com
What’s Right in Health CareSM | Evidence to Outcomes
Next Steps
• Educate Board• Establish meaningful targets• “Connect the Dots” Education on how each
employee group can influence strategic targets• Build more pre-populated templates• Start goal selection process with Corporate
CEO and cascade down• Audit to ensure weights reflect strategic
direction• Automate data mining• Use LEM as primary dashboard for monitoring • Tie incentives to LEM
What’s Right in Health CareSM | Evidence to Outcomes
ANY QUESTIONS?

26 © 2008 Studer Groupwww.studergroup.com
Thank You! Rob Ryder
[email protected](303) 804-8169
Laurie Kennedy, [email protected]
(303) 804-8169