South Carolina TAP: A National Leader in Outcomes Based Teacher Incentive Programs.
24
South Carolina TAP: A National Leader in Outcomes Based Teacher Incentive Programs
-
Upload
pearl-laureen-green -
Category
Documents
-
view
214 -
download
0
Transcript of South Carolina TAP: A National Leader in Outcomes Based Teacher Incentive Programs.

South Carolina TAP: A National Leader in Outcomes Based Teacher Incentive Programs

There are many effective teachers - just not enough.
Percent of teachers scoring in top decile of high school achievement test:
• 1971-74 24%2000 11%
Attrition: 1/3 of teachers leave after 3 years of teaching; 1/2 by fifth year
The most inexperienced teachers teach in high poverty schools
The median age of teachers is on the rise • 33 in 1976 to the mid-40's today, • more teachers nearing retirement age
Fewer students inclined to become teachers • only 14 percent expressed "a great deal of interest" in
teaching as a career. • Thirty-nine percent responded, "no interest at all.”
Disturbing Trends
Stagnant Student Achievement
Disenfranchised faculty
High Teacher Turnover
Improved Student Achievement
Positive School Climate
Reduced Teacher Turnover
After TAPBefore TAP

4 TAP Elements
1. Multiple Career Paths
2. Performance-based Compensation
1. Instructionally-focused Accountability
2. Ongoing, Applied Professional Growth

The Career Ladder
CareerTeacher
Administrator
CareerTeacher
MentorTeacher
MasterTeacher
Traditional Model
SCTAP Model
Multiple Career Paths
Requiring increasing levels of:• professional qualifications• responsibilities• authority• assessment rigor
Single Career Path
Requiring the same level of:• professional qualifications• responsibility• authority• assessment rigor
Keeps
great teachers
in the classroom
Regional Master
Teacher
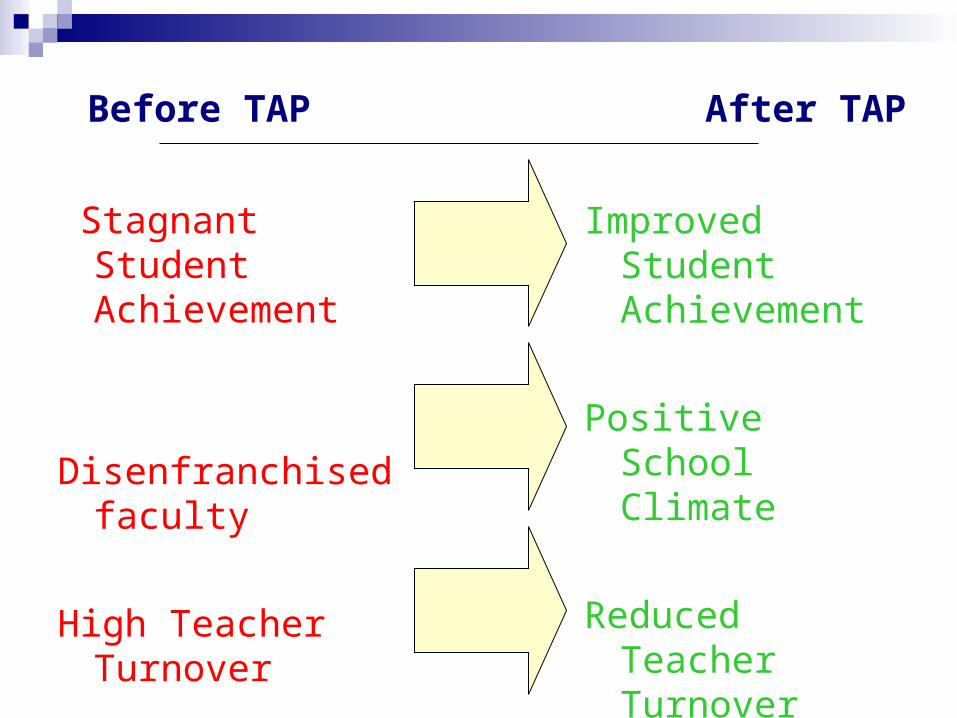
Compensation
Salary Schedule Drives Compensation
• Performance-based salary
• Determined by:• credentials• level of responsibility• classroom effectiveness• school team achievement• student achievement
Traditional Model
SCTAP Model
• Lock-step salary
• Determined by years of experience and
training units accrued
• Credentials-based
Performance and Responsibility
Drive Compensation

Determinedby Approved
Testing
IndividualTeacher Value addedValue added
Achievement
30% Teacher Skills, Knowledge and Responsibilities
40%School-wide Value addedValue added Achievement
30%
Determined byEvaluationswith TAPRubrics
How Teacher Performance is Measured

Salary Comparison
School Salary (5 years and BA)
Student Achievement
Incentive Total
Non-TAP $35,649 High $0 $35,649
SCTAP $35,649 High $8,500 $44,149

Master Teacher Responsibility and High
Performance
School Salary Bonus Stipend Total
SCTAP $35,649 $8,500 $10,000 $54,149
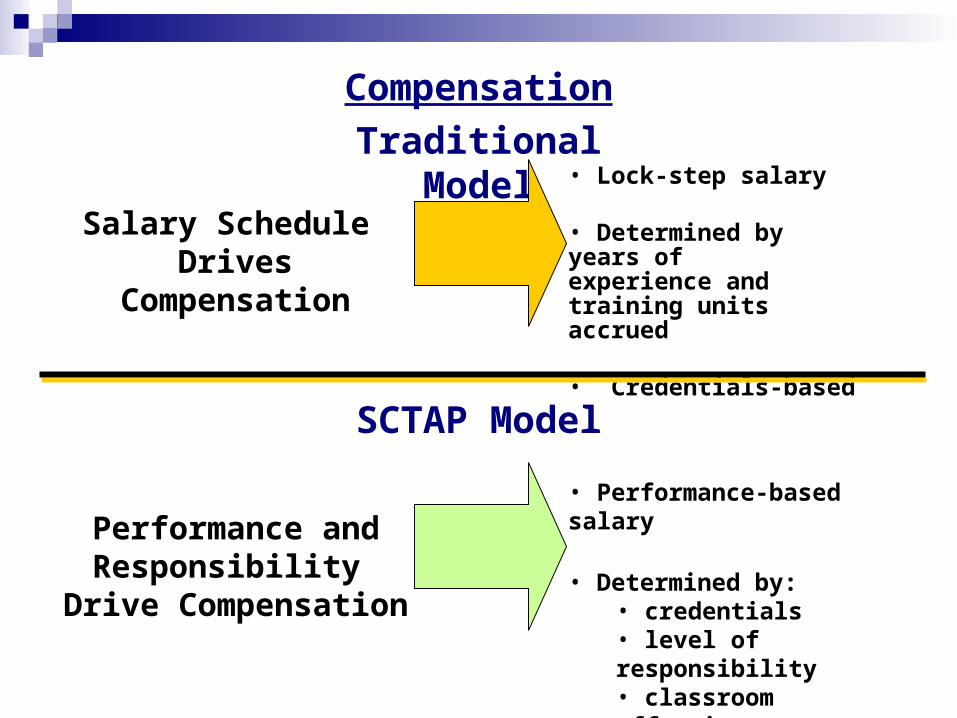
Because value-added measures growth in achievement of the same students over time, and because schools are largely responsible for achievement growth, value-added scores reflect the school and teacher contribution to student learning, not family and neighborhood factors.
Value-Added Analyses

- 5
Previously high achieving students, Teacher below average in effectiveness
CLow achieving students, Teacher above average in effectiveness
High achieving students, Teacher above average in effectiveness
L Previous Score H (Previous Achievement)
ObservedStudent Score
Low
High
Comparison of High and Low Effectiveness
A
B
+ 5
+ 5
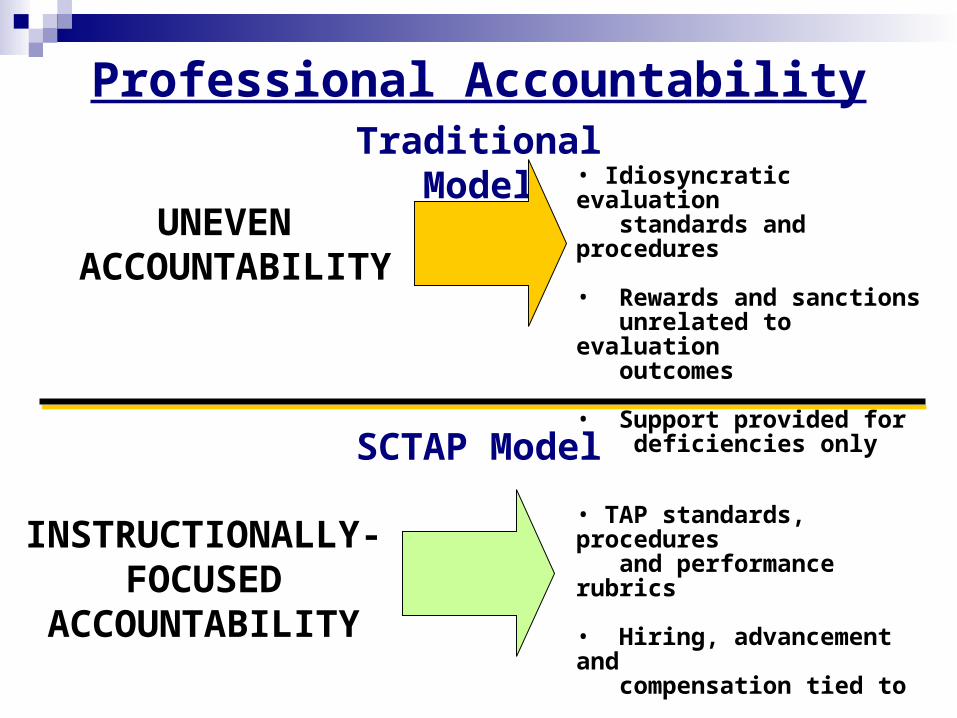
Professional Accountability
UNEVEN ACCOUNTABILITY
• TAP standards, procedures and performance rubrics
• Hiring, advancement and compensation tied to evaluation
• Support provided for growth
Traditional Model
SCTAP Model
• Idiosyncratic evaluation standards and procedures
• Rewards and sanctions unrelated to evaluation outcomes
• Support provided for deficiencies only
INSTRUCTIONALLY-FOCUSED
ACCOUNTABILITY
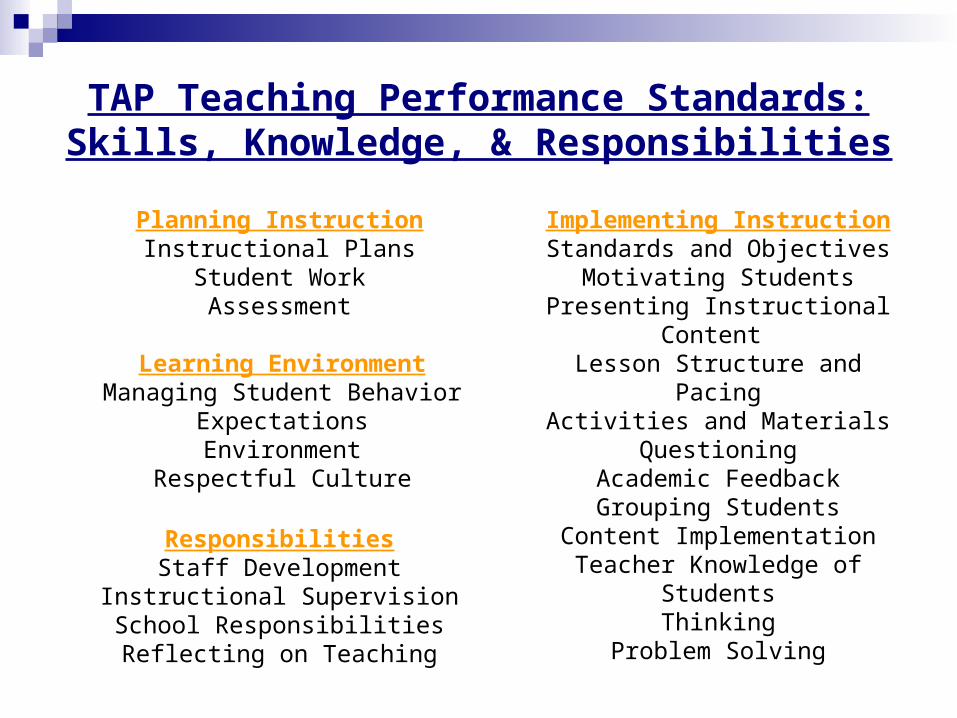
TAP Teaching Performance Standards: Skills, Knowledge, & Responsibilities
Implementing InstructionStandards and Objectives
Motivating StudentsPresenting Instructional
Content Lesson Structure and Pacing
Activities and MaterialsQuestioning
Academic FeedbackGrouping Students
Content ImplementationTeacher Knowledge of
StudentsThinking
Problem Solving
ResponsibilitiesStaff Development
Instructional SupervisionSchool ResponsibilitiesReflecting on Teaching
Learning EnvironmentManaging Student Behavior
ExpectationsEnvironment
Respectful Culture
Planning InstructionInstructional Plans
Student WorkAssessment
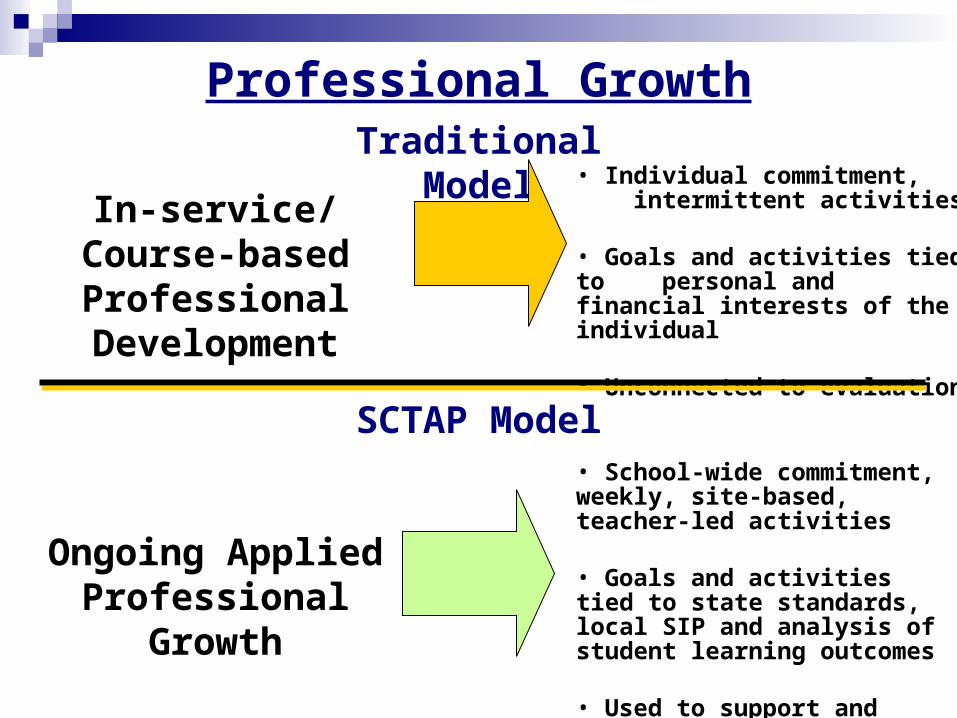
Professional Growth
In-service/Course-based Professional
Development
• School-wide commitment, weekly, site-based, teacher-led activities
• Goals and activities tied to state standards, local SIP and analysis of student learning outcomes
• Used to support and reinforce evaluation growth goals
Traditional Model
SCTAP Model
• Individual commitment, intermittent activities
• Goals and activities tied to personal and financial interests of the individual
• Unconnected to evaluation
Ongoing Applied Professional Growth

Sustaining TAP

RESULTS OF TAP
RESULTS OF TAP
0
1
2
3
4
5
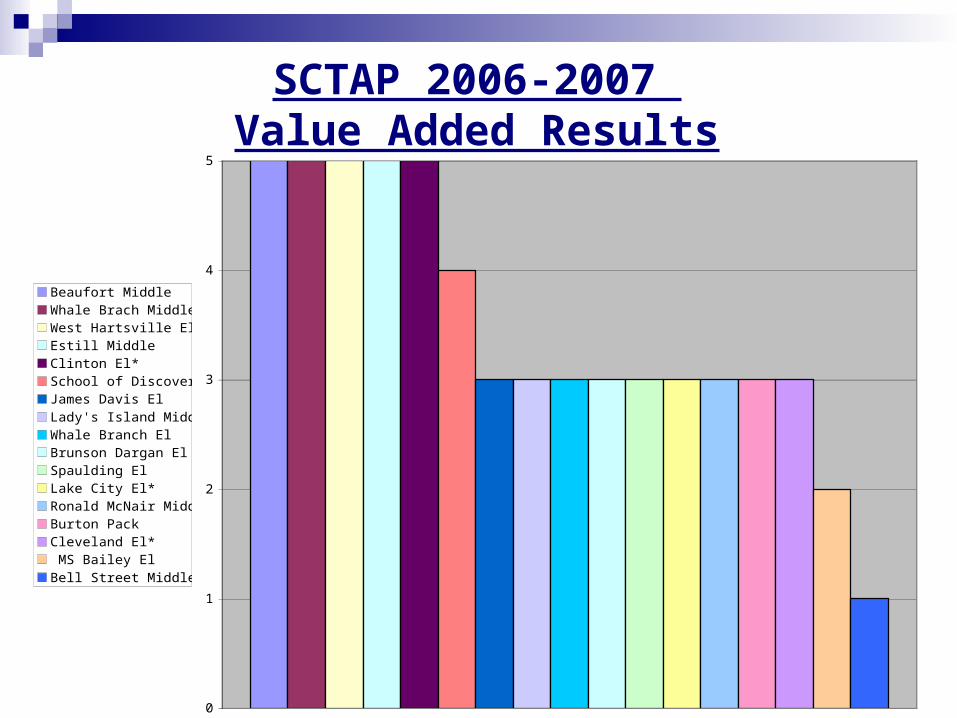
Beaufort MiddleWhale Brach MiddleWest Hartsville ElEstill MiddleClinton El*School of Discovery*James Davis ElLady's Island MiddleWhale Branch ElBrunson Dargan ElSpaulding ElLake City El*Ronald McNair Middle*Burton PackCleveland El* MS Bailey ElBell Street Middle
SCTAP 2006-2007 Value Added Results

22.1
36.6
40.1
34.4
29.1
25.9
37.0
42.1
40.5
71.7
52.6
23.6
15.3
59.4
49.3
66.2
49.8
37.0
31.4
33.9
0 10 20 30 40 50 60 70 80 90 100
2006Collegiality 2005
2006
Performance-based Compensation 2005
2006Accountability 2005
2006
Professional Growth 2005
2006Multiple Career Path 2005
P ercent
Average Support / Strongly Support
Teacher Support for TAP Elements:

38%
26% 25%
14%
0%
15%
30%
45%
TAP Control TAP Control
Percent of Teachers Achieving More thanONE Standard Error Above an Average
Year's Growth
Percent of Teachers Achieving More thanTWO Standard Errors Above an Average
Year's Growth
Teacher Support for TAP Elements:

40%
32%
26%
18%
0%
15%
30%
45%
TAP Control TAP Control
Percent of Schools Achieving More thanONE Standard Error Above an Average
Year's Growth
Percent of Schools Achieving More thanTWO Standard Errors Above an Average
Year's Growth
National Aggregated School Effect

Clinton Elementary School,Laurens School District 56
From Below Average to Average with an improvement rating of Good after just one year of TAP. This school was also a Value added ‘5.’
Case Study:

Timeline of TAP Expansion in South Carolina
Year 2002 2003 2004 2005 2006 2007 2008
Number of
schools
4 5 9 12 17 43 50+
Milestones Program piloted in Beaufort
and Laurens
56
First bonus checks are distributed to teachers
Professional development component refined and
rubric created
SC hosts second TAP
National Conference
and summer training
Principal bonus added
Compensation levels
increased
Districts given more
autonomy to make changes
in program implementation
SC creating in-state training
materials

Challenges
1.Fiscal Sustainability
1.Continuity of Leadership
1.Local Capacity

QuestionsContact Information:
Jason CulbertsonExecutive Director, SCTAP
3700 Forest Drive, Suite 320Columbia, SC 29204
(864)[email protected]