OTN Workshop 2015 OTN SandBox Presented by Marta Mihoff OTN Database/Data Process Manager.
49
OTN Workshop 2015 OTN SandBox Presented by Marta Mihoff OTN Database/Data Process Manager
-
Upload
joy-reeves -
Category
Documents
-
view
234 -
download
1
Transcript of OTN Workshop 2015 OTN SandBox Presented by Marta Mihoff OTN Database/Data Process Manager.

OTN Workshop 2015
OTN SandBox Presented by Marta Mihoff
OTN Database/Data Process Manager

Start OTN SandboxOn your laptop open command prompt Navigate to Desktop/OTN Sandbox Execute command ‘vagrant up’

Outline• Background• Platform Overview• Quick R-Studio review• Changes with Exercises
- Data folder management- Filter function- Distance Matrix- Compressed data
• New functions with exercises- Compress Function- Add Column Unique ID Function- Cohort Data Function
• Wrap Up

OTN Sandbox Backround
• Symposium 2013 researcher requests• First incarnation 2014• Evolution and improvements• New Functions for 2015

OTN SandBox Platform
• Free open software Black Box•Oracle Virtual Box•HashiCorp Vagrant•Rstudio • IPython Notebook• Postgresql

OTN SandBox Tools (last year)
White-Mihoff False Filtering Tool• Builds a file of suspect detections• Creates a file of filtered detections• Creates a distance matrix
Distance Matrix Merge• Outputs a matrix overriding distances with researcher input
Mihoff Interval Data Tool• Creates a file of Compressed detections and a file of Interval data
Miscellaneous• File Conversion (UTF8)• Cleanup
OTN SandBox Tools - Changes
Filter Function • added new parameter: detection radius• change in file structure for distance matrix output
Distance Matrix Merge Function Changes• change in file structure for distance matrix inputs and output
Interval Data Function Changes• change in file structure for distance matrix input• new additional column on compressed data output file 'Average time
between Detections'

OTN SandBox Tools – New Functions
Compress Function• first step of Interval Data Function split out on its own• exact same output
Add Column Unique ID Function• takes any file and adds column unqdetecid sequential integer values• no validation is done on input file so can be used for any type of file
Cohort Data Function• Input a compressed detection file and time parameter• Identifies groups of animals which visit stations within time period.

Sign In
• Open Chrome or Firefox • Paste sandbox URL
• Sign in• Username: sandbox• Password: otn123
• Will not work with VPN turned on

R-Studio Navigation
• Look at bottom right corner• Click on the folder RStudio

R-Studio Navigation
Creating a New folder• Click the New Folder area on the Files tab• Give your folder a name

R-Studio Navigation
Rename a folder• Click the Rename area on the Files
tab• Give your folder a new name

R-Studio Navigation
More • Click the More area on the Files tab
to see other options

Data Folder Management
Big change from last year • No longer required to import and export your data folder • Now the data folder stays on your laptop and is always visible to the Sandbox
NEVER EVER Delete or Rename folder data in OTNSandbox
• Instead copy your data folder
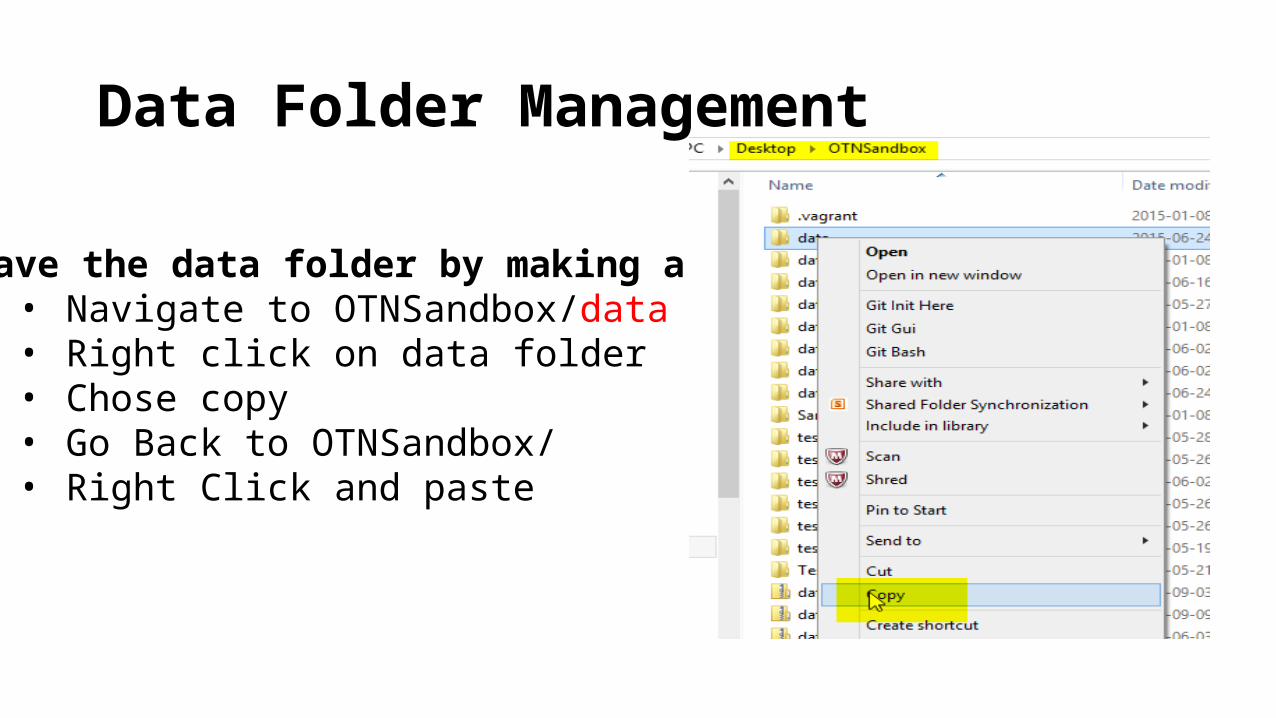
Data Folder Management
Save the data folder by making a copy• Navigate to OTNSandbox/data• Right click on data folder• Chose copy• Go Back to OTNSandbox/• Right Click and paste
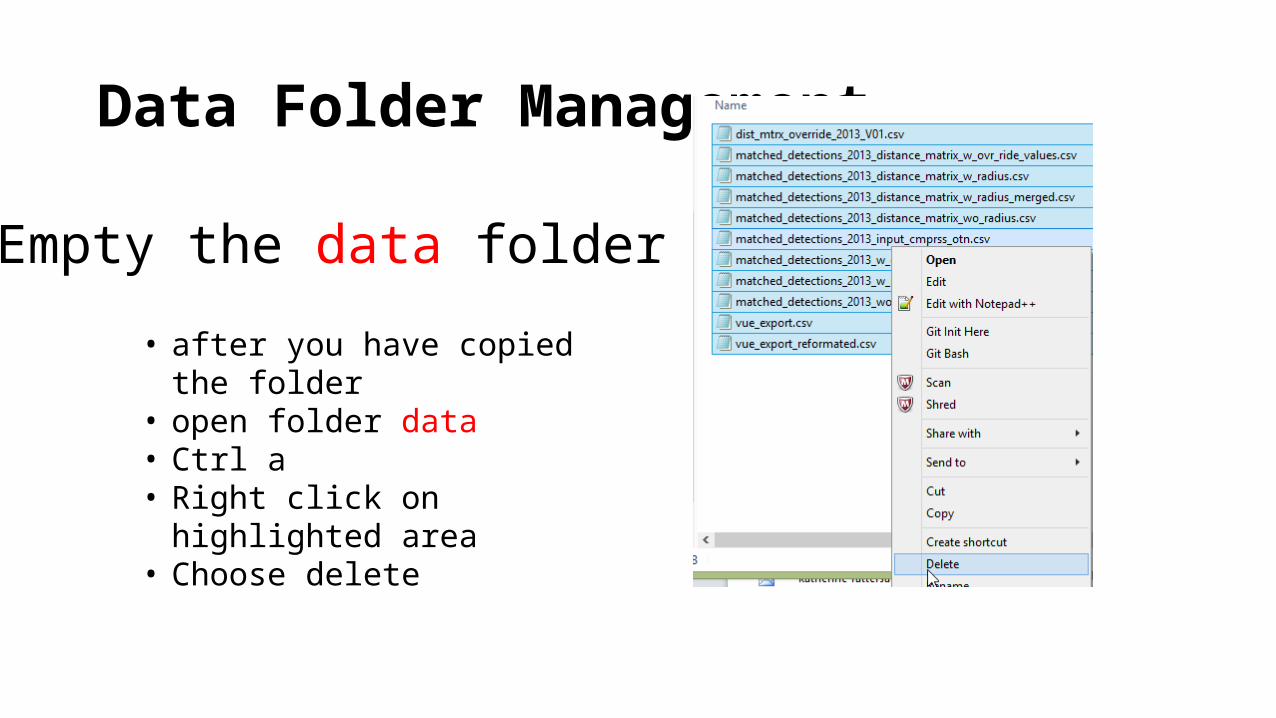
Data Folder Management
Empty the data folder
• after you have copied the folder• open folder data• Ctrl a• Right click on highlighted area• Choose delete

Data Folder ManagementGo to Sample data link
• http://members.oceantrack.org/toolbox/workshop• Click 2015.zip• Save to Desktop/OTNSandbox

Data Folder Management
• Navigate to OTNSandbox• Unzip (Right click, Extract All)• Drill down to folder with files• Open• Crtl a• Right click• Choose copy
Retrieve the sample data

Data Folder Management
Paste sample data into data folder
• Navigate to OTNSandbox/data folder• Open folder data• Right click • Chose paste
Open file CutPaste_file.txt in a text editor

Data Folder Management
Data folder in RStudio Data folder on lap top

Changes to existing functions
Filter Driver • new parameter: detection radius• optional
Distance Matrix Merge Driver• Two new columns added to
input and output files
Compressed Data File• New column on output file: Avg_min_between_det

Create a work shop folder for test scripts
• Go to Rstudio menu bar• Click New Folder button on Files Menu• Type in folder name• Click OK

Exercise: Interval Data
•We are going to do three exercises with the interval data tool
• Each involves a different distance matrix1. A matrix with no values for detection radius2. A matrix with detection radius3. A matrix with detection radius and some real distances
•We will look at the output and see what changes

Exercise: Interval Data
• Open sandbox folder• Click file interval_data_driver.r• Will open in upper left window• Save to WorkShop Scripts folder

Exercise: Interval Data
Using distance matrix without detection radius• In the top left pane edit the script by typing the files names in yellow• Save the script

Exercise: Interval Data
Compressed data output file• Example of how to use new column avg_min_between_detections• Open file matched_detections_2013_wo_radius_compressed_detections_v00.csv with XLS or ODT• Record 1650• Shows 7 detections with average 277.9 minutes between them• Indicates a problem• One or more may be suspect

Exercise: Interval Data
Interval data output file• Open file matched_detections_2013_wo_radius_interval_data_v00.csv with XLS or ODT• Look at records 9 through 15• The last column is velocity

Exercise: Interval Data
Using distance matrix with detection radius• Copy the highlighted lines of code• Paste just below• Edit by changing the input file names • Change _wo_ to _w_
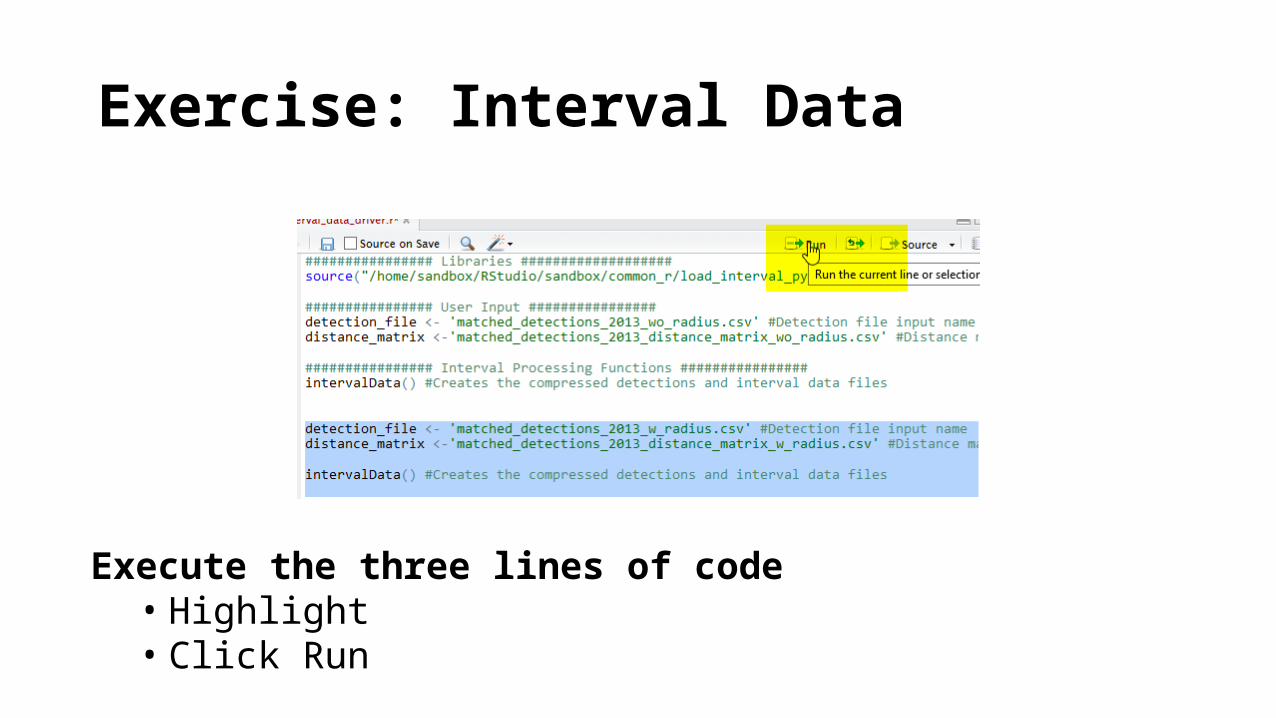
Exercise: Interval Data
Execute the three lines of code• Highlight• Click Run

Exercise: Interval Data
Interval data output file• Open file matched_detections_2013_w_radius_interval_data_v00.csv with XLS or ODT• Look at records 9 through 15• The last column now shows zero velocity

Exercise: Interval Data
Interval data output file• Same file looking at from station HFX036(caught/lost/found)• caught/lost/found means receiver was recovered at a different place than deployed• Loaded with the recover lat and long• Don’t know when it went off station

Distance Matrix real Distances
Provide real distances for lost found receivers

Exercise: Interval Data
Using distance matrix with detection radius and real distances• Copy and paste same three lines of code• Change the file names as above• Hightlight and execute

Exercise: Interval Data
• now if you look at those records the velocity is reasonable

Exercise: Compress data (New)
• Open file compress_driver in the upper left pane• You do this by clicking on the file in folder Home> Rstudio> sandbox
• Change the input file name as shown in yellow

Exercise: Compress data (New)
• Highlight code and execute• Look at the messages• Go to the data folder on your laptop and open file
vue_export_reformatted.csv in a text editor
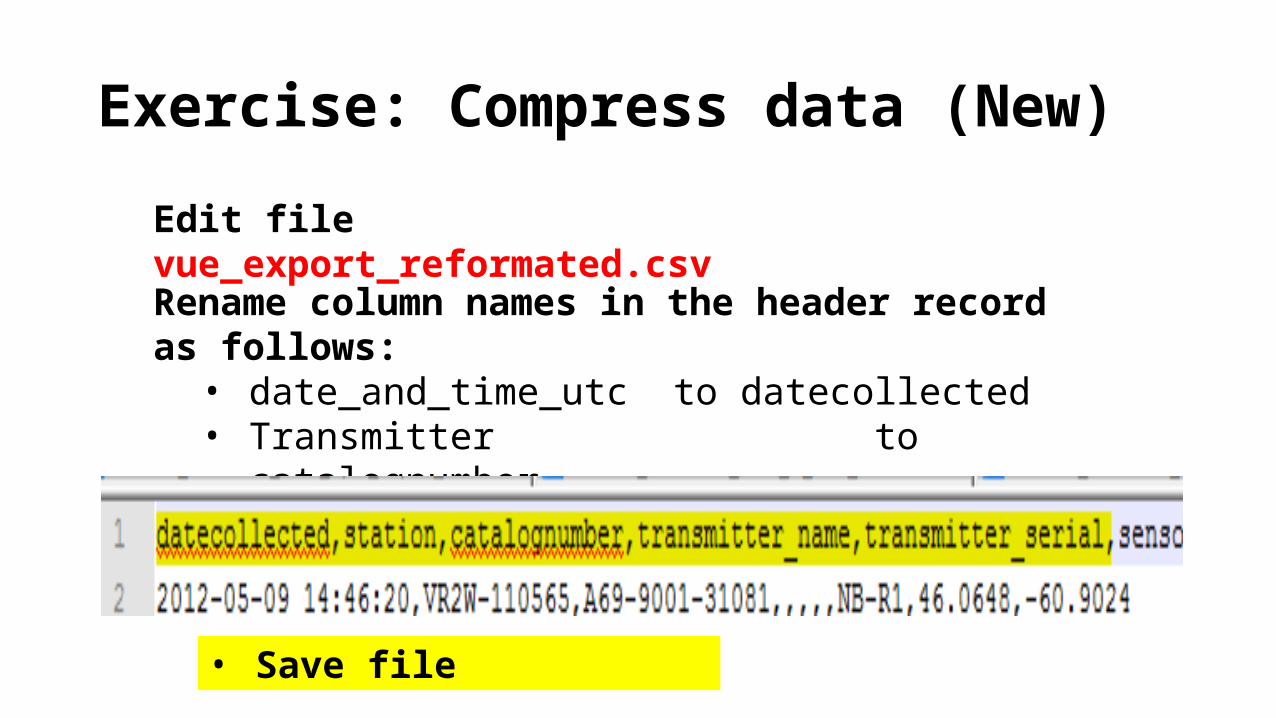
Exercise: Compress data (New)
Rename column names in the header record as follows:• date_and_time_utc to datecollected• Transmitter to catalognumber• Receiver to station
• Save file
Edit file vue_export_reformated.csv

Exercise: Compress data (New)
• Edit the script by changing the filename • Highlight code and execute• Look at the messages• Still one column missing: unqdetecid

Exercise: Add column unqdetecid
• Open file add_column_unqdetecid.r in sandbox folder• Change input file name to the one you just edited• You can cut from the message pane and paste• Highlight code • and execute

Back to Exercise: Compress data (New)
• Highlight code and execute
• Go back to the compress driver script• We are going to use a different input to get ready for next function • Change the input filename as shown in yellow

Exercise: Cohort data (New)
• Open file cohort_driver.r in sandbox folder• Change input file name to value highlighted in yellow• You can cut from the bottom of the message pane and paste• Highlight code • and execute

Exercise: Cohort data (New)
Looking at the messages• 242 incidents of animals appearing at stations close together
were identified• Open the output file from your laptop

Cohort data file

Documentation and Software Location • Introduction page with links
http://members.oceantrack.org/data/otn-tool-box

Folder Structure: Documentation
• Direct link to documentation: http://members.oceantrack.org/toolbox/

Teach yourself to program
• Free open software• Extremely powerful• Standardized
• IPython: rival to MATLAB and Rstudio• Can embed R code and java script
• PostgreSQL

How? Coursera
• Rice University: An Introduction to Interactive Programming in Python TBAhttps://www.coursera.org/specialization/fundamentalscomputing/9?utm_medium=catalogSpec
• Johns Hopkins: GitHub; and R Programming both Part of the "Data Science" Specialization https://www.coursera.org/course/datascitoolboxhttps://www.coursera.org/course/rprog
• University of Michigan: Programming for Everybody https://www.coursera.org/course/pythonlearn

PostgreSQL: Online Tutorials
http://www.postgresqltutorial.com/

Questions?