Original Research Investigating Hydrological Responses and ... 2338 Zaman M., et al. Introduction...
12
Pol. J. Environ. Stud. Vol. 27, No. 5 (2018), 2337-2348 Original Research Investigating Hydrological Responses and Adaptive Operation of a Hydropower Station under a Climate Change Scenario Muhammad Zaman 1, 2 *, Shouqi Yuan 1 , Junping Liu 1 , Ijaz Ahmad 3 , Muhammad Sultan 4 , Muhammad U. Qamar 2 , Muhammad Saifullah 5 , Muhammad Adnan 6 , Muhammad N. Anjum 7 , Muhammad I. Nawaz 8 , Imran Ali 9 1 Research Center of Fluid Machinery Engineering and Technology, Jiangsu University, Zhenjiang, China 2 Department of Irrigation and Drainage, University of Agriculture, Faisalabad, Pakistan 3 Centre of Excellence in Water Resources Engineering, University of Engineering and Technology, Lahore, Pakistan 4 Department of Agricultural Engineering, Bahauddin Zakariya University, Multan, Pakistan 5 Department of Structures and Environmental Engineering, University of Agriculture, Faisalabad, Pakistan 6 State Key Laboratory of Cryospheric Sciences, Northwest Institute of Eco-Environment and Resources, Chinese Academy of Sciences (CAS), Lanzhou, China 7 State key laboratory of Crysopheric Science, Northwest institute of eco-Environment and Resources, Chinese Academy of Sciences, Lanzhou 730000, China. 8 School of Environment and Safety Engineering, Jiangsu University, Zhenjiang, China 9 College of Environmental Science and Engineering, Ocean University of China, Qingdao, China Received: 28 May 2017 Accepted: 16 October 2017 Abstract In this study we investigated the projections of climate change and its impacts on the water resources of the Xin’anjiang watershed and optimal hydropower production using future run-offs (the decades of the 2020s, 2050s, and 2080s). The arc SWAT hydrological model and change factor downscaling technique were integrated to detect the run-offs and to downscale CMIP5 future climate variables, respectively. Optimal hydropower generation using future runoff was predicted by developing a mathematical model and by applying the particle swarm optimization technique within its paradigm. The results depict an increase of up to 5.9ºC in monthly mean maximum temperature, and 5.58ºC in minimum temperature until the 2080s. There will be a 63% increase in flow magnitudes more than the base year flow during the 2020s, whereas up to 70% and 31.40% increments have been observed for the 2050s and 2080s, respectively. The results revealed potential hydropower generation of 19.23*10 8 kWh using 2020s run- off of rainy years. Similarly, 19.35*10 8 kWh and 14.23*10 8 kWh were estimated from the flows during the 2050s and 2080s, respectively. Keywords: arc SWAT, CMIP5, optimal hydropower generation, temperature *e-mail: [email protected] DOI: 10.15244/pjoes/78678 ONLINE PUBLICATION DATE: 2018-05-09
Transcript of Original Research Investigating Hydrological Responses and ... 2338 Zaman M., et al. Introduction...

Pol. J. Environ. Stud. Vol. 27, No. 5 (2018), 2337-2348
Original Research
Investigating Hydrological Responses and Adaptive Operation of a Hydropower Station under
a Climate Change Scenario
Muhammad Zaman1, 2*, Shouqi Yuan1, Junping Liu1, Ijaz Ahmad3, Muhammad Sultan4, Muhammad U. Qamar2, Muhammad Saifullah5,
Muhammad Adnan6, Muhammad N. Anjum7, Muhammad I. Nawaz8, Imran Ali9
1Research Center of Fluid Machinery Engineering and Technology, Jiangsu University, Zhenjiang, China2Department of Irrigation and Drainage, University of Agriculture, Faisalabad, Pakistan
3Centre of Excellence in Water Resources Engineering, University of Engineering and Technology, Lahore, Pakistan4Department of Agricultural Engineering, Bahauddin Zakariya University, Multan, Pakistan
5Department of Structures and Environmental Engineering, University of Agriculture, Faisalabad, Pakistan6State Key Laboratory of Cryospheric Sciences, Northwest Institute of Eco-Environment and Resources,
Chinese Academy of Sciences (CAS), Lanzhou, China7State key laboratory of Crysopheric Science, Northwest institute of eco-Environment and Resources,
Chinese Academy of Sciences, Lanzhou 730000, China.8School of Environment and Safety Engineering, Jiangsu University, Zhenjiang, China
9College of Environmental Science and Engineering, Ocean University of China, Qingdao, China
Received: 28 May 2017Accepted: 16 October 2017
Abstract
In this study we investigated the projections of climate change and its impacts on the water resources of the Xin’anjiang watershed and optimal hydropower production using future run-offs (the decades of the 2020s, 2050s, and 2080s). The arc SWAT hydrological model and change factor downscaling technique were integrated to detect the run-offs and to downscale CMIP5 future climate variables, respectively. Optimal hydropower generation using future runoff was predicted by developing a mathematical model and by applying the particle swarm optimization technique within its paradigm. The results depict an increase of up to 5.9ºC in monthly mean maximum temperature, and 5.58ºC in minimum temperature until the 2080s. There will be a 63% increase in flow magnitudes more than the base year flow during the 2020s, whereas up to 70% and 31.40% increments have been observed for the 2050s and 2080s, respectively. The results revealed potential hydropower generation of 19.23*108 kWh using 2020s run-off of rainy years. Similarly, 19.35*108 kWh and 14.23*108 kWh were estimated from the flows during the 2050s and 2080s, respectively.
Keywords: arc SWAT, CMIP5, optimal hydropower generation, temperature
*e-mail: [email protected]
DOI: 10.15244/pjoes/78678 ONLINE PUBLICATION DATE: 2018-05-09
2338 Zaman M., et al.
Introduction
Global temperature is increasing and air tempe-rature has risen up to 0.85ºC between 1880 and 2012, with the past 30 years being the warmest [1]. Wang et al. (2012) argued that water resources are highly sensitive to climate change and figured out that the change in climatic temperature is mainly responsible for this change [2]. Studies have depicted climate change as also affecting the spatial and temporal changes in Chinese water resources [3-5] and of the world [6]. Thus, climate change and its ultimate effects on water resources hold great importance to scientists and engineers. The northern part of China is becoming warmer more rapidly than the southern part [7-8]. Studies have found that until the year 2050, the average temperature in China will increase by +2.5-4.6ºC [9]. A working group of the IPCC has also observed variations in precipitation trends that are increasing in the eastern parts of South and North America, some parts of Europe, and central and northern Asia. The Sahel, the Mediterranean Basin, and some parts of southern Asia and Africa have shown a decreasing precipitation trend during 1900-2005 [4]. Tropical areas have exhibited insignificant increases, while the mid-latitudes (30-60°N) of the northern hemisphere have experienced significant increases in precipitation trends, as cited from the long-term data (1901-2008) compiled by the IPCC in 2013 [1].
The Xin’anjiang watershed lies in southeastern China. Several researchers have tried to determine the precipitation trends in China. Ding et al. (2009) found that there was no significant annual averaged precipitation trend in the country, while inter decadal trends and variability have been found on a regional basis [10]. Song et al. (2011) found a decreasing trend in mean annual precipitation during 1961-2008 in northeastern China, whereas an increasing trend has been found in eastern China [11]. Studies have shown an adjustment in precipitation trends in eastern China after 1970 [12], whereas significant changes in precipitation and temperature trends have been observed in southern China [13]. Researchers have indicated that the southern China and Yangtze River basin suffered from heavier precipitation and severe flooding in the area, while northeastern and northern China experienced a number of severe drought events [7, 10]. Several studies were conducted to determine the precipitation trends on the local scale in China. Wang et al. (2013) used precipitation data from 1961-2008 of the Jinshajiang River basin and found insignificant increases [14], whereas Meng et al. (2016) detected the decreasing trends in annual precipitation in the Yellow River Basin, China [15]. Xu et al. (2010) observed an increase in precipitation in the Tarim River basin during 1960-2007 [16]. Many researchers have tried to find climate change trends on a large scale throughout the country [17-20], but not much work
has been done in the southeastern part of the country at medium scale watersheds to determine the effect of climate change on water resources, such as the Xin’anjiang watershed.
Due to climate change and variability, assessment of future hydrology and water resources is becoming much more important for the city planners in water allocation and utilization [21-22]. The impacts of climate change regarding Chinese water resources are also becoming more important [3, 8, 23]. For the projection of future scenarios in the context of climate change, the general circulation models (GCMs) have been observed to be the best tool [24]. GCM/RCM outputs can be downscaled to catchment-scale hydro climatic variables [15, 18]. Different results can be obtained by applying different downscaling techniques to show that a small change in precipitation can have a significant effect on the hydrology of an area [25-26]. We use the latest CMIP5 data for precipitation, temperature, and runoff projections in this study for the Xin’anjiang watershed.
The soil and water assessment tool (SWAT) is widely used for simulating sediment yield, runoff, and loss of nutrients in different types of watersheds [27]. The SWAT model has been used and verified in America [27], Europe [28], Australia [29], Africa [30], and in Asia [31-32]. Compared to previous studies, the presented study utilized the SWAT model for the projection of runoff for the prediction of hydropower generation.
Optimal use and allocation of water resources is becoming more important because of the uncertainty of water resources. Optimizing water resources is complicated and is based on mathematical models [33]. During 1970-1980, some algorithms were developed for the solution to such problems. Many programming techniques (linear, nonlinear, and dynamic) have been applied to find the solutions of the problems related to reservoir operations in the past [34-38]. Particle swarm optimization (PSO) is an optimization technique developed by Kennedy (1995) and is becoming important in optimization problems [39]. The optimization of the Xin’anjiang hydropower stations is one such complex problem because of variable inflows and water demands downstream. Therefore, the particle swarm optimization technique was used to obtain an optimal amount of hydropower from the Xin’anjiang hydropower station.
Many researchers have utilized the above-mentioned techniques according to their needs, but not much work has been done in southeastern China for medium-sized watersheds related to precipitation, temperature, and runoff projections for the future using the latest CMIP5 RCP scenario. In this paper, the optimization technique has been used after developing a mathematical model for getting optimal hydropower generation from future projected flows. Optimal hydropower generation for future water projections under a climate change scenario has also been predicted in the presented study.

2339Investigating Hydrological Responses...
Material and Methods
Study Area
The study area, the Xin’anjiang watershed, lies between 117°38′15″-119°31′56″ longitude and 29o11′9.9″-30°13′49″ latitiude (Fig. 1). The watershed has an area of about 11,675.71 km2. The Xin’anjiang Hydropower Station is located in this watershed (29°28′38″.16 latitude and 119°13′31″ longitude). Water resources of the area are quite important due to the utilization of water for agriculture and drinking as well as hydropower generation. The study area is sandwiched between Hangzhou City and Huangshan Mountain. The change in precipitation or temperature trends affect the water resources in this area, affecting agriculture, domestic water needs, and the generation of electricity.
Data Collection
Daily metrological data for 1979-2010 was obtained from the China Metrological Department. The community climate system model version 4 (CCSM4) with representative concentration pathway (RCP4.5) scenarios of CMIP5 is used in the presented study for future projection. CCSM4 models, at the same time, can simulate the Earth’s atmosphere, ocean, sea-ice, land, and land-ice. When complimented by a central coupler component, CCSM4 permits researchers to conduct essential research into the Earth’s past, present, and future climate states. The CCSM4 model of CMIP has also been used in past studies in China for climate change impact assessments [40-42]. RCP4.5 is a moderate mitigation scenario that might be better for water resource projections and could be used for the assessment of optimal electricity generation in the study
Fig. 1. Geographical representation of study area: a) metrological stations, b) land use, and c) soil map.

2340 Zaman M., et al.
area [43]. The analysis was performed using (1979-2010) data as the base year. The three future periods of 2010-2039, 2040-2069, and 2070-2099, for which future water resources projections will be made, have been termed as the 2020s, 2050s, and 2080s in this study. The hydrological data series of the watershed is required for the calibration and validation of the model. The data were collected from the Hydrology Bureau of Zhejiang Province. Data from 1979-1993 were used for calibration, while data from 1994-2005 were used for validation of the model.
Change Factor Method
The change factor (CF) method is a bias correction method used to reduce bias between observed data and model outputs [32, 43-44]. The main purpose of the CF is to modify daily future precipitation and temperature data series (2020s, 2050s, and 2080s) by adding monthly mean changes to the output of the GCM. The modified daily maximimum and minimum temperatures (Tmax and Tmin) of the future data series can be obtained by adding monthly changes between the base years and the future years of the GCM. However, future precipitation can be obtained by multiplying the ratio of the future to the reference year monthly data series with the daily precipitation of the base year. The temperature and precipitation equations are given below:
(1)
(2)
…where Padj;fut;d/Tadj;fut;d is the future-adjusted daily precipitation/temperature series, Pobs;d/Tobs;d_ is observed daily precipitation/temperature, and PGCM,futrm /TGCM,futrm and PGCM,refrm /TGCM,refrm are future and base year mean monthly precipitation/temperature data series of GCM, respectively. pi is the grid weight of each GCM grid cell, and k is the total number of cells.
Arc SWAT Simulation
The SWAT hydrological model is a basin-scale continuous model that operates on a daily time step basis. The model was founded by the Agricultural Research Service and the US Department of Agriculture to predict the effects of land management practices on sediment, water and agricultural chemicals. The watershed is divided into a number of sub-basins, which are further divided into hydrological response units according to the land use, soil properties and slope of the area. The model considers the watershed hydrology in the watershed land areas for the simulation of water together with sediment, chemical pesticides and nutrients from every HRU. The model also considers the water behavior in the water channels. Modified SCS
curve numbers are used to predict the surface run-offs from daily rainfall, whereas modified rational numbers are used to calculate the peak run-offs in the Arc SWAT model. A kinematic storage routing model is used to determine the sub-surface lateral flow up to 2 m depth in each soil layer. A shallow aquifer storage area is created to gauge the groundwater flow contribution. Potential evapotranspiration is estimated by using the Hargreaves method, because of the availability of precipitation and temperature data. The variable storage coefficient technique is used for flow routing, which can be explained as follow:
Model setup: The present study uses Arc SWAT 2012 interface in ArcGIS. The data set needed and used in this study is presented in (Table 1). A large number of spatial and temporal data sets are required for the simulation of the Arc SWAT model. The required main data are explained below.
Spatial datasets: The spatial database includes the topography of the area, land use and soil type. The digital elevation model (DEM) for land use and soil are the inputs of the Arc SWAT model.
Digital elevation model (DEM): A 90 m DEM (http://gdex.cr.usgs.gov/gdex/) was processed to delineate the watershed and topographic parameters, which were derived from the DEM. After processing the DEM, an area of about 11675.710 km2 was found.
Land use: Changes in land use affect the run-off in an area. This study uses the USGS Land Cover Institute data (http://landcover.usgs.gov/), (Fig. 1b). Five classes of land use were found, of which FRSD (forest decidous) as the most prominent class is 66.905% (Fig. 1b).
Soil data: The soil map of the study area was obtained from United Nations Food and Agriculture Organization (http://data.fao.org/m a p ? e n t r y I d = 4 4 6 e d 4 3 0 - 8 3 8 3 - 11d b - b 9 b 2 -000d939bc5d8). The soil delineated in the study area has 5 classes (Fig. 1c). Hydrological response units
Data Data Source
DEM SRTM 90m Digital elevation model (http://gdex.cr.usgs.gov/gdex/)
Land UseUnited States Geological Survey Land
Cover Institute data (http://landcover.usgs.gov/)
Soil
Soil maps taken from United Nations Food and Agriculture Organization (http://data.
fao.org/map?entryId=446ed430-8383-11db-b9b2-000d939bc5d8).
Climate CCSM4 model of CMIP5 project with RCP4.5 scenarios
Observed climatic data
Climatic data from 1979-2008 were obtained from the China Metrological
Department.
Run off Hydrology Bureau of Zhejiang Province
Table 1. Data source and description.
2341Investigating Hydrological Responses...
were defined by overlying the soil types and land use classes.
Temporal data: Climatic data is required for the Arc SWAT simulations. Run-offs significantly change due to changes in precipitation and temperature.
Meteorological data: Daily precipitation together with maximum and minimum temperatures are the most important data series required to run an Arc SWAT model. Whereas wind speed, relative humidity and solar radiation data are optional, because the model has a weather generation function to generate the data of these parametres, itself. Daily precipitation, together with the minimum and maximum temperature data series, during the period of 1979-2008 were obtained from the China Metrological Department. The daily RCP4.5 scenarios of the CCSM4 model of the CMIP5 was used for the future water resources projections.
Hydrological data: The hydrological data series of the watershed is required for the calibration and validation of the model. The data were collected from the Hydrology Bureau of Zhejiang Province. The dataset from 1979-1993 was used for the calibration, while data from 1994-2005 was used for the validation of the model.
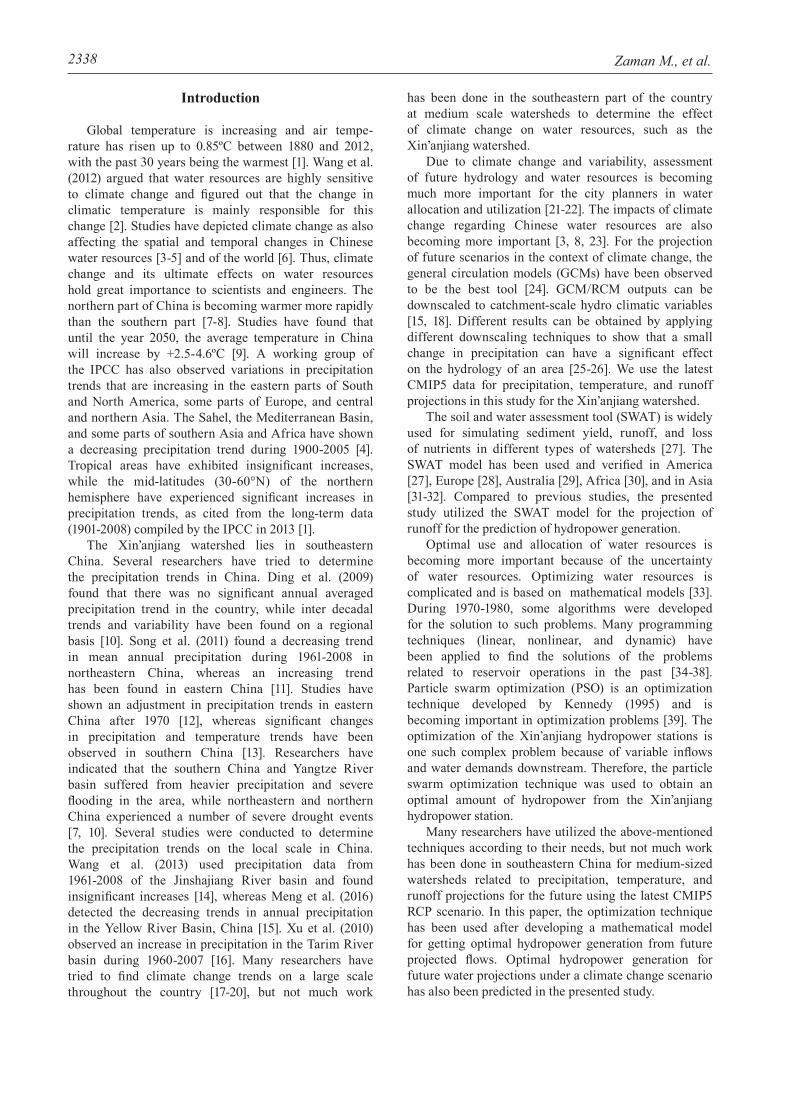
Model Calibration and Validation: The SUFI2 programme of the Arc SWATCUP was used for the calibration and validation in this study [45,46]. The developed input default Arc SWAT parameters were used to prepare Arc SWAT CUP input files. The model output results for calibration and validation are presented in Figs 2a) and 2b).
Model efficiency: Coefficient of determination (R2) and the Nash-Sutcliffe Efficiency were used to determine the model’s efficiency. a) Coefficient of determination (R2): The value of R2 lies between 0 and 1, and is considered acceptable if it is greater than 0.50 [47]. b) Nash-Sutcliffe Coefficient: The Nash-Sutcliffe techniques were developed by Nash and Sutcliffe [48] as a statistical method, which is described below:
(3)
...where Yjobs, Yj
sim, and Yjmean are the j-th observed,
simulated and mean observed stream flow values, respectively; and n is the total number of observations. If NSE>0.5 mean, the simulation is considered to be acceptable [49-52].
Optimization of Hydropower
The runoff generated from the watershed is used for generating electricity at Xin’anjiang Hydropower Station and the projected future flows were used for calculating optimal hydropower generation. The mathematical model and the technique used for calculating optimal hydropower are discussed below:
Mathematical Model for Xin’anjiang Hydropower Scheduling
The mathematical model has two parts: the constraints and the objective function. The water levels of the reservoirs are taken as decision variables with the objective function to maximize electricity during a period of 12 months.The objective function E (maximum hydropower pro-duction) is:
(4)
The constraints are given below.Water balance equation:
(5)
Fig. 2. Comparison between observed, GCM, and downscaled: a) precipitation, b) Tmax and, c) Tmin.
2342 Zaman M., et al.
Reservoir discharge limits:
(6)
Reservoir storage volume limits:
(7)
Limits of power generated by hydropower station:
(8)
…where T is total period count within a year (T = 12); M is the total number of reservoirs; Aj denotes the power generation coefficient; E is maximum power generation output from hydropower; Qjt is inflow of reservoir j at time period t in m3/s; Hjt is average head of reservoir j at time period t in meters; Vj,t+1 is volume of reservoir j at the end of time period t; Qjt.min and Qjt.max are the minimum and maximum water discharge magnitudes of the reservoir j in the given time period t, respectively, in m3/s; Vjt.min and Vjt.max are the minimum and maximum volume of reservoir j at time t, respectively; Njt.min is the minimum hydropower generation constraint of reservoir j at time period t; and Njt.max stands for the installed plant capacity in kW.
Particle Swarm Optimization
Kennedy (1995) developed particle swarm optimization [39], which has two phases: the initialization phase, where the particles are randomly distributed, and the evolutionary phase, where the particles adjust and change their positions by following the most successful particles in search of optimal solution until termination of the algorithm. Suppose that the particles are moving with velocity Vk, where Vk = (Vk1, Vk2….…VkD) in a D-dimensional space and are at position k, where k = ( k1, k2, k3,…,kD ). After time t+1, the velocity and position are given as:
(9)
(10)
…where k = (1,2…,swarm/.population size), t = number of reproduction steps, w = inertial weight, Vk
t = the speed vector of the particle, c1, c2 = learning rates, pbestk = best solution reached by particle k, gbestk = the best solution reached by the swarm, and rand1 and rand2 = independent random variables from (0,1) uniformly distributed. Different parameters used in the particle swarm optimization in this study are particle swarm size = 20, c1 = 1.4962; c2 = 1.4962; w = 0.7298;
and variable dimension D = 12. Algorithm runs for 400 generations to get the best solution in each case.
Results and Discussion
Downscaling Future Projections
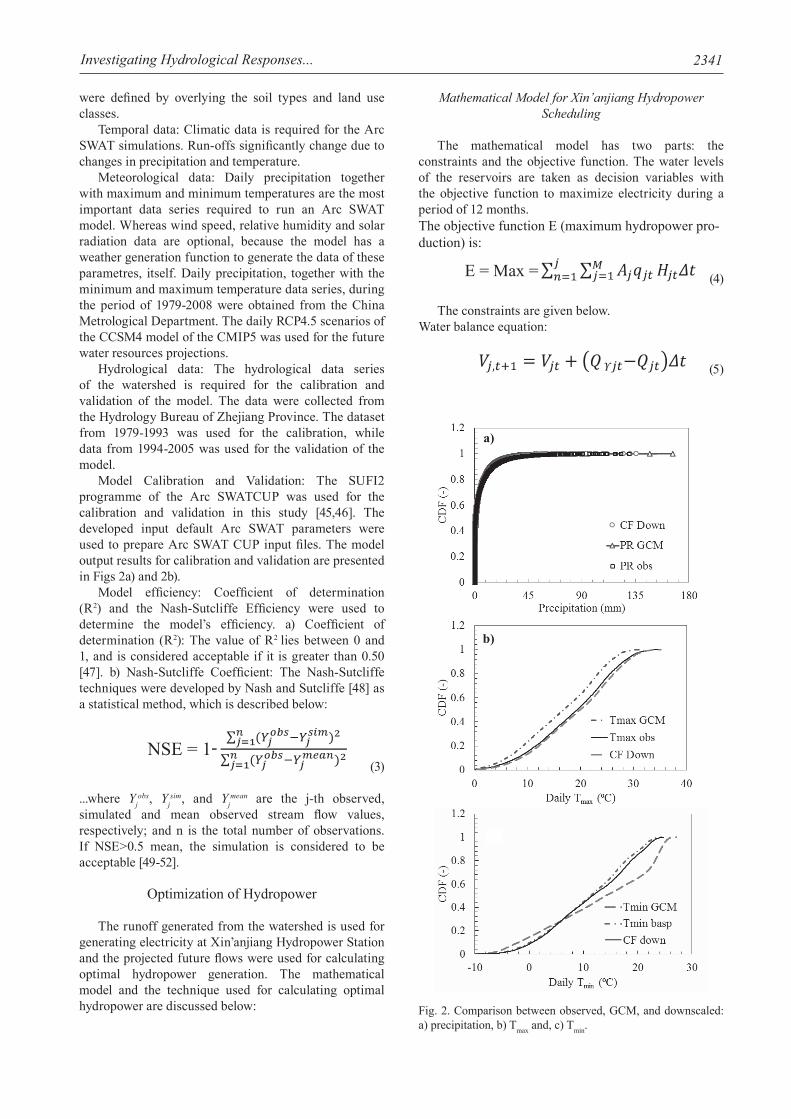
Cumulative density function values for observed and GCMs, with and without downscaling, precipitation, and maximum and minimum temperatures data series are presented in Fig. 2. Results revealed that the change factor method is a good bias correction method as shown in figures. [32, 43-44] utilized the change factor downscaling technique for the downscaling of future projections of precipitation, temperature, and other climatic variables and the method was found to be reliable. Results also revealed that the change factor downscaling technique gives very accurate results as it executes a very little difference in the cumulative distribution function (CDF) values of the observed and downscaled precipitation for the base period. Similarly, Figs. 2b) and 2c) exhibits the maximum and minimum temperatures against cumulative density function, respectively. Results revealed a good match between base period and observed data series. Fig. 3 shows the flows of water obtained from Arc SWAT model using
Fig. 3. Comparision between observed and GCM base period flows with monthly data series: a) and b) scattered plot.
2343Investigating Hydrological Responses...
observed and downscaled GCM metrological data for the base period. Results revealed not much difference in overall stream flow for GCM and observed data series as shown in Figs 3a) and 3b). These results confirm that change factor technique is a comparatively better technique to downscale future climate projections as R2 value is in acceptable range (greater than 0.5).
Calibration and Validation of Model
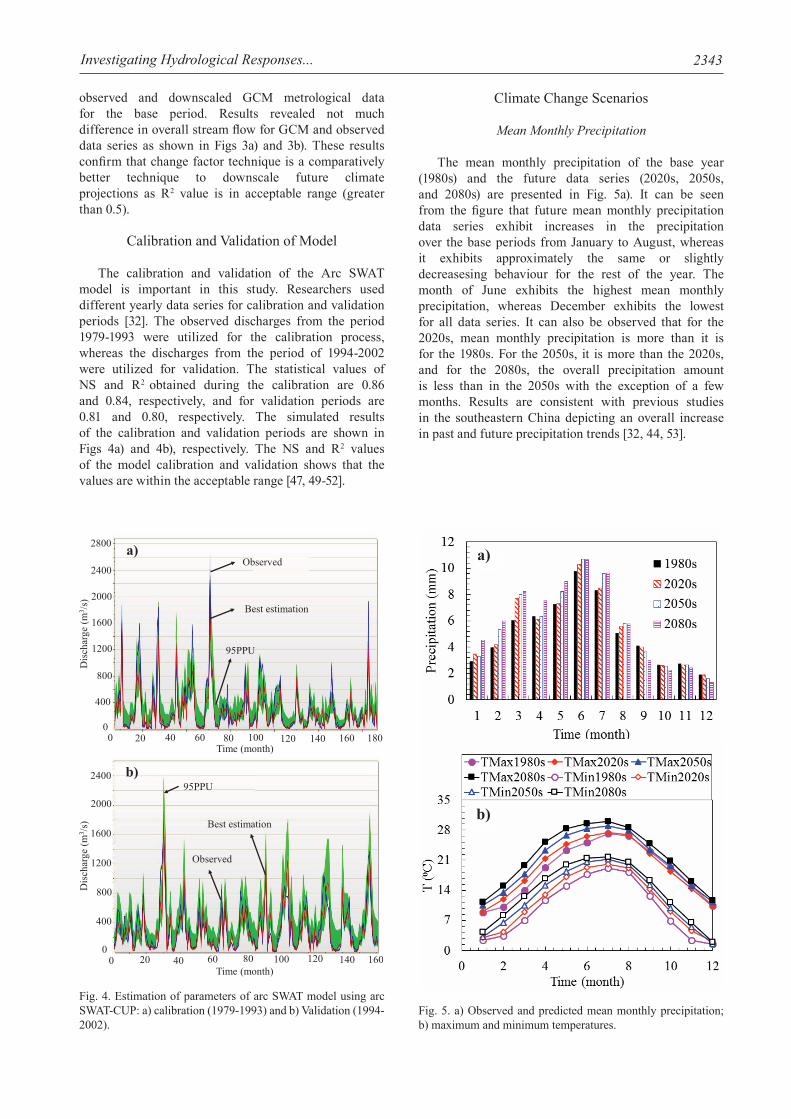
The calibration and validation of the Arc SWAT model is important in this study. Researchers used different yearly data series for calibration and validation periods [32]. The observed discharges from the period 1979-1993 were utilized for the calibration process, whereas the discharges from the period of 1994-2002 were utilized for validation. The statistical values of NS and R2 obtained during the calibration are 0.86 and 0.84, respectively, and for validation periods are 0.81 and 0.80, respectively. The simulated results of the calibration and validation periods are shown in Figs 4a) and 4b), respectively. The NS and R2 values of the model calibration and validation shows that the values are within the acceptable range [47, 49-52].
Climate Change Scenarios
Mean Monthly Precipitation
The mean monthly precipitation of the base year (1980s) and the future data series (2020s, 2050s, and 2080s) are presented in Fig. 5a). It can be seen from the figure that future mean monthly precipitation data series exhibit increases in the precipitation over the base periods from January to August, whereas it exhibits approximately the same or slightly decreasesing behaviour for the rest of the year. The month of June exhibits the highest mean monthly precipitation, whereas December exhibits the lowest for all data series. It can also be observed that for the 2020s, mean monthly precipitation is more than it is for the 1980s. For the 2050s, it is more than the 2020s, and for the 2080s, the overall precipitation amount is less than in the 2050s with the exception of a few months. Results are consistent with previous studies in the southeastern China depicting an overall increase in past and future precipitation trends [32, 44, 53].
Fig. 4. Estimation of parameters of arc SWAT model using arc SWAT-CUP: a) calibration (1979-1993) and b) Validation (1994-2002).
Fig. 5. a) Observed and predicted mean monthly precipitation; b) maximum and minimum temperatures.
2344 Zaman M., et al.
Monthly Mean TMax and TMin
The mean monthly maximum (TMax) and minimum (TMin) temperatures for the base period (1980s) and the future periods (2020s, 2050s, and 2080s) are presented in Fig. 5b) [53], which found an increasing trend in monthly maximum and minimu temperatures with the highest increase in the month of July. [32 and 44] also found similar results in southeastern China. It can be seen that for all series, maximum and minimum temperatures have increased. The results reveal that the month of July exhibits the highest mean monthly temperature for the maximum and minimum temperature data series, whereas December exhibits the minimum temperature for all data series. In addition, in the future the temperature is increasing as the 2020s exhibit a higher temperature than the 1980s. Similarly, the 2050s temperature is higher than the 2020s. Likewise, the 2080s exhibit a higher temperature than the 2050s for both the maximum and minimum temperature data series. It can be seen that the maximum increase in temperature is up to 5.9ºC during 2070-2099 (2080s) for the mean monthly maximum temperature series, whereas there is an increase of up to 5.58ºC during the same period for the mean monthly minimum temperature data series.
Hydrological Impacts of Climate Change
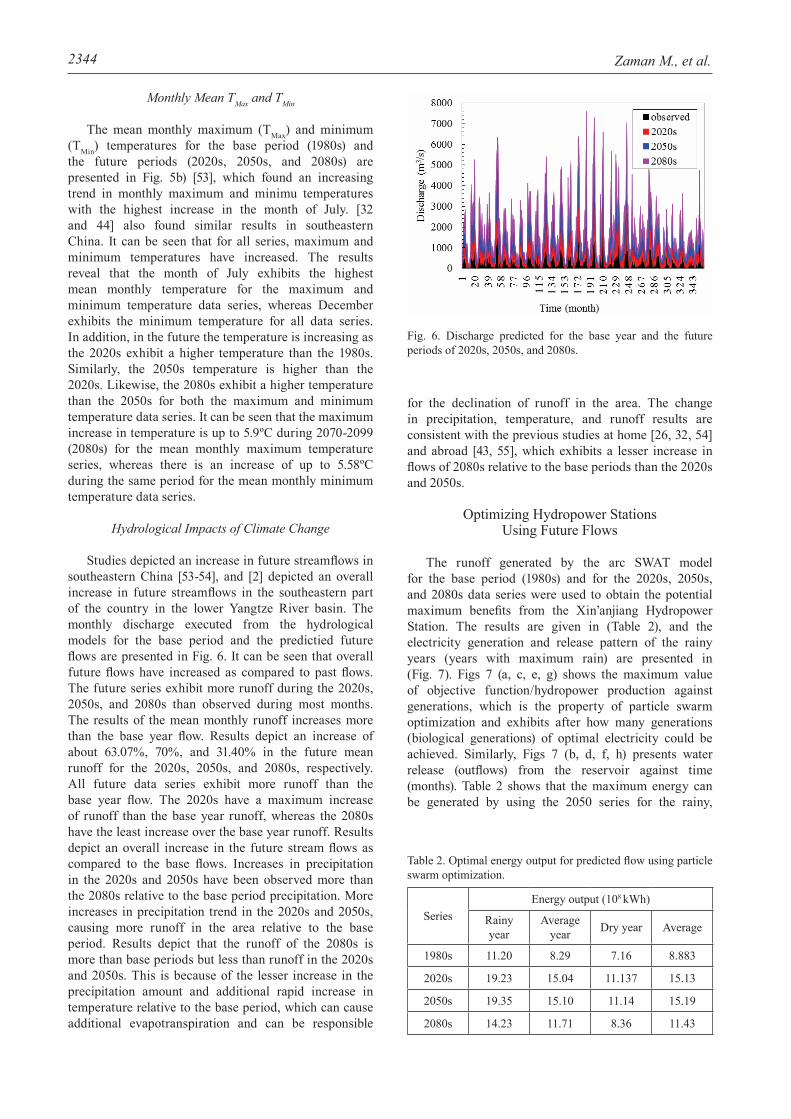
Studies depicted an increase in future streamflows in southeastern China [53-54], and [2] depicted an overall increase in future streamflows in the southeastern part of the country in the lower Yangtze River basin. The monthly discharge executed from the hydrological models for the base period and the predictied future flows are presented in Fig. 6. It can be seen that overall future flows have increased as compared to past flows. The future series exhibit more runoff during the 2020s, 2050s, and 2080s than observed during most months. The results of the mean monthly runoff increases more than the base year flow. Results depict an increase of about 63.07%, 70%, and 31.40% in the future mean runoff for the 2020s, 2050s, and 2080s, respectively. All future data series exhibit more runoff than the base year flow. The 2020s have a maximum increase of runoff than the base year runoff, whereas the 2080s have the least increase over the base year runoff. Results depict an overall increase in the future stream flows as compared to the base flows. Increases in precipitation in the 2020s and 2050s have been observed more than the 2080s relative to the base period precipitation. More increases in precipitation trend in the 2020s and 2050s, causing more runoff in the area relative to the base period. Results depict that the runoff of the 2080s is more than base periods but less than runoff in the 2020s and 2050s. This is because of the lesser increase in the precipitation amount and additional rapid increase in temperature relative to the base period, which can cause additional evapotranspiration and can be responsible
for the declination of runoff in the area. The change in precipitation, temperature, and runoff results are consistent with the previous studies at home [26, 32, 54] and abroad [43, 55], which exhibits a lesser increase in flows of 2080s relative to the base periods than the 2020s and 2050s.
Optimizing Hydropower Stations Using Future Flows
The runoff generated by the arc SWAT model for the base period (1980s) and for the 2020s, 2050s, and 2080s data series were used to obtain the potential maximum benefits from the Xin’anjiang Hydropower Station. The results are given in (Table 2), and the electricity generation and release pattern of the rainy years (years with maximum rain) are presented in (Fig. 7). Figs 7 (a, c, e, g) shows the maximum value of objective function/hydropower production against generations, which is the property of particle swarm optimization and exhibits after how many generations (biological generations) of optimal electricity could be achieved. Similarly, Figs 7 (b, d, f, h) presents water release (outflows) from the reservoir against time (months). Table 2 shows that the maximum energy can be generated by using the 2050 series for the rainy,
Fig. 6. Discharge predicted for the base year and the future periods of 2020s, 2050s, and 2080s.
SeriesEnergy output (108 kWh)
Rainy year
Average year Dry year Average
1980s 11.20 8.29 7.16 8.883
2020s 19.23 15.04 11.137 15.13
2050s 19.35 15.10 11.14 15.19
2080s 14.23 11.71 8.36 11.43
Table 2. Optimal energy output for predicted flow using particle swarm optimization.

2345Investigating Hydrological Responses...
average, and dry years. Results depict that we can produce a maximum of 11.20*108 kWh of electricity with 1980s flows, and maximum benefit in the form of electricity can be achieved by using future flows optimally. Optimal electricity production and water release under current climate conditions is shown in
Fig. 7, which exhibits different patterns of electricity production and release, as electricity production from base period flows is the minimum (Fig. 7) due to less water. To get optimal hydropower production, water release should be in accordance with water release presented in Fig. 7. Release of water for the 1980s
Fig. 7. Total power generation and release of hydropower stations using PSO for the rainy years of the 1980s, 2020s, 2050s, and 2080s.

2346 Zaman M., et al.
should start after January from 100 m3/s and should become minimum at the end of February and remain as such until the start of the 4th month (April). Water release should achieve its peak value of 650 m3/s in the month of August and then decrease and increase until December. Similarly, for the 2020s, water release starts in February and reaches its peak value of 2,200 m3/s in the month of June and then again follows decreasing and increasing structure (Fig. 7) until December to get optimal production for the 2020s. The pattern of water release followed by the 2050s flows demonstrates that water release should start at the end of January with 300 m3/s discharge and achieve its maximum level of 1,100 m3/s in December for optimal hydropower production. Water release followed by the 2080s flows for optimal hydropower production depicts that it should start in February and achieve its maximum level of about 1,000 m3/s in the month of June and then starts decreasing until October and again increases up to 500 m3/s until December. Electricity production of the 2050s is maximum because of the increase in water flows (Fig. 6) in this period (Fig. 7) while generation decreases in the 2020s and 2080s due to comparatively low flows. The results revealed that the release patterns changed according to the inflows in the reservoir as shown in these figures. The seasonal release patterns of all scenarios differ because of different inflows and storage in the reservoir. Table 2 shows that the maximum electricity production is in rainy years because of maximum flow of water for all seasons. Results revealed that optimal electricity production is affected because of inflows, as water flow decreases in the average and dry years, resulting in a decrease of optimal electricity generation amount in these periods.
The results reveal that we can produce up to 19.23*108kWh using the 2020s runoff in the rainy years, with the release of water starting in February as presented in Fig. 7. The maximum amount of water (up to 2,100 cumec) should be released in the month of June, then decreased in July, and then increased again in the month of August to produce the maximum electricity for the 2020s. Similarly, we can produce maximum electricity for the 2050s and 2080s if we release the water in the similar pattern as given in the figures, respectively.
Conclusions
In the present study, we focused on the climate change impact on water resources of the Xin’anjiang watershed and optimal electricity production using future runoff (for the 2020s, 2050s, and 2080s). The arc SWAT hydrological model, together with change factor downscaling, were applied to detect the runoff and downscaling of future climate variables, respectively. A mathematical model was developed and particle swarm optimization technique was applied to the mathematical model to calculate optimal electricity
generation. The hydrology of the Xin’anjiang watershed was studied by applying the arc SWAT interface using observed and predicted metrological data. The model was successfully calibrated and validated using the arc SWAT-CUP interface tool. The calibration and validation of arc SWAT produced good simulation results. The NS and R2 values for calibration were 84% and 86%, respectively, and 80% and 81%, respectively, for the validation periods.
The results show an increase of up to 5.9ºC in the monthly mean maximum temperature, and up to a 5.58ºC increase in the minimum temperature until the 2080s. There is also an increase in future runoff over the base period (1980s), with increases of 63%, 70%, and 31.4% observed for the 2020s, 2050s, and 2080s, respectively. The particle swarm optimization technique produced only 11.23*108 kWh electricity using past flows (1980s), whereas up to 19.35*108 kWh can be generated using the 2050s runoff for a rainy year. Similarly, the maximum electricity production is 19.23*108 kWh and 14.23*108 kWh from 2020s and 2080s flows, respectively.
The presented study explores the availability of water and hydropower in the area for past and future scenarios. This projected amount of water for past and future scenarios is beneficial to decision makers, water resource planners, and allocators to make plans for the management of water. Some of the future water projections exhibit an alarming increase in future flows, which can be helpful for the water resource planners in making plans to control the predicted volume of water to avoid flooding conditions in the area by improving management strategies and reexamining designs and operations of the existing dams.
This study will also be helpful in estimating maximum electricity generation for the future. The knowledge of future water resources in the area is useful for planning hydropower operations. From a technical point of view, the importance of the presented study lies in the results as well as in the assumed methodology. It has been proved that the selected optimization method is a dominant way to increase reservoir performance. More benefits could be attained in the form of hydropower production by following the optimal water release patterns for future flows as presented in this study. However, other climate change scenarios, that are different, should also be used with other hydrological models and optimization techniques in order to study the impact of climate change on optimal hydropower generation.
Acknowledgements
This work was supported by the National Key Research and Development Program, Research and Development of Green and Highly Efficient Water-Saving Irrigation Equipment for Typical Rural Areas in Northwestern China (No. 2016 YFC 0400202).

2347Investigating Hydrological Responses...
References
1. IPCC, Climate Change 2013: The Physical Science Basis, Contribution of Working Group I to the Fifth Assessment Report of the Intergovernmental Panel of Climate Change, Cambridge University Press,Cambridge, UK, 5, 2013.
2. WANG G.Q., JIN J.L., PAGANO T.C., CALOW R., BAO Z.X., LIU C. S., LIU Y.L., AND YAN X. L. Assessing water resources in China using PRECIS and VIC model. Hydrology and Earth System Science, 16, 231, 2012.
3. ZHANG L., KARTHIKEYAN R., BAI Z., SRINIVASAN R. Analysis of streamflow responses to climate variability and land use change in the Loess Plateau region of China. Catena, 154, 1-11,.2017.
4. IPCC, Climate Change 2007: The Physical Science Basis,Contribution of Working Group I to the Fourth Assessment Report of the Intergovernmental Panel of Climate Change, Cambridge University Press,: Cambridge and New York, 7, 2007.
5. IPCC, Climate Change 2014: Impacts, Adaptation, and Vulnerability, Cambridge University Press. 2014.
6. CÁRDENAS O.L., CAMPOS M.N., SEVILLA P.M., GUERRERO R.R., OCAMPO H.A.G., MORENO M.N.H. Estimating Trends and Return Periods of Daily Extreme Precipitation Associated with Tropical Cyclones in the Core North American Monsoon. Pol. J. Environ. Stud, 25 (6), 2016.
7. DING Y., GUOYU R., ZONGCI Z., YING X., YONG L., QIAOPING L., JIN Z. Detection, causes and projection of climate change over China: an overview of recent progress. Advanced Atmosphere Science, 24, 954, 2007.
8. PIAO S., CIAIS P., HUANG Y., SHEN Z., PENG S., LI J., ZHOU L., LIU H., MA Y., DING Y., FRIEDLINGSTEIN P. The impacts of climate change on water resources and agriculture in China. Nature, 467, 43, 2010.
9. ECSNCCA, (Edition Committee of the Second National Climate Change Assessment).Second National Climate Change Assessment Report: Science Press, Beijing. 2011.
10. DING Y., WANG Z., SUN Y. Inter-decadal variation of the summer precipitation in China and its association with decreasing Asian summer monsoon Part II: Possible causes. International Journal of Climatology, 29 (13), 1926, 2009.
11. SONG Y., ACHBERGER C., LINDERHOLM H.W. Rain-season trends in precipitation and their effect in different climate regions of China during 1961-2008. Environmental Research Letters, 6 (3), 034025, 2011.
12. LUO X., ZHANG Y. Interdecadal change in the seasonality of rainfall variation in South China. Theoretical and Applied Climatology, 119 (1-2), 1, 2015.
13. FISCHER T., GEMMER M., LIU L., SU B. Trends in monthly temperature and precipitation extremes in the Zhujiang River Basin, South China (1961-2007). Advances in Climate Change Research, 1 (2), 63, 2010.
14. WANG S.J., ZHANG X., LIU Z., WANG D. Trend analysis of precipitation in the Jinsha River Basin in China. Journal of Hydrometeorology,14, 290, 2013.
15. MENG F., SU F., YANG D., TONG K., HAO Z. Impacts of recent climate change on the hydrology in the source region of the Yellow River basin. Journal of Hydrology: Regional Studies, 6, 66, 2016.
16. XU Z.X., LIUA Z., FUB G., CHENC Y. Trends of major hydroclimatic variables in the Tarim River basin during the past 50 years. Journal of Arid Environments., 74, 256, 2010.
17. XU C., LIA J., ZHAOA J., GAOA S., CHEN Y. Climate variations in northern Xinjiang of China over the past 50 years under global warming. Quaternary International,. 358, 83, 2015.
18. SU B., HUANG J., ZENG X., GAO C., JIANG T. Impacts of climate change on streamflow in the upper Yangtze River basin. Climatic Change, 1, 2016.
19. JIANG C., ZHANG L., TANG, Z. Multi-temporal scale changes of streamflow and sediment discharge in the headwaters of Yellow River and Yangtze River on the Tibetan Plateau, China. Ecological Engineering, 102, 240, 2017.
20. GU X., ZHANG Q., SINGH V.P., SHI P. Changes in magnitude and frequency of heavy precipitation across China and its potential links to summer temperature. Journal of Hydrology, 547, 718, 2017.
21. ARNELL N.W. Climate change and global water resources: SRES emissions and socio-economic scenarios. Global Environmental Change, 14, 31, 2004.
22. SHEN Y., TAIKAN O.K., UTSUMI, NOBUYUKI N., KANAE S., HANASAKI N. Projection of future world water resources under SRES scenarios: water withdrawal. Hydrological Sciences, 53, 11, 2008.
23. NDRC, (National Development and Reform Commission,People’s Republic of China). China’s Policies and Actions for Addressing Climate Change.Information Office of the State Council. The People’s Republic of China., 2007.
24. XU C. Climate change and hydrologic models: a review of existing gaps and recent research developments. Water Resources Management, 13 (5), 369, 1999.
25. RISBEY J.S., ENTEKHABI D. Observed Sacramento Basin streamflow response to precipitation and temperature changes and its relevance to climate impact studies. Journal of Hydrology, 184 (3-4), 209, 1996.
26. ZHU Y., LIN Z., WANG J., ZHAO Y., HE F. Impacts of Climate Changes on Water Resources in Yellow River Basin, China. Procedia Engineering, 154, 687, 2016.
27. ZEIGER S.J., HUBBART J.A. A SWAT model validation of nested-scale contemporaneous stream flow, suspended sediment and nutrients from a multiple-land-use watershed of the central USA. Science of The Total Environment, 572, 232, 2016.
28. ABBASPOUR K.C., ROUHOLAHNEJAD E., VAGHEFI S., SRINIVASAN R., YANG H., KLØVE B. A continental-scale hydrology and water quality model for Europe: Calibration and uncertainty of a high-resolution large-scale SWAT model. Journal of Hydrology, 524, 733, 2015.
29. SHRESTHA M.K., RECKNAGEL F., FRIZENSCHAF J., MEYER W. Assessing SWAT models based on single and multi-site calibration for the simulation of flow and nutrient loads in the semi-arid Onkaparinga catchment in South Australia. Agricultural Water Management, 175, 61, 2016.
30. MALIEHE M., MULUNGU D.M. Assessment of water availability for competing uses using SWAT and WEAP in South Phuthiatsana catchment, Lesotho. Physics and Chemistry of the Earth, Parts A/B/C. 2017.
31. TAN M.L., FICKLIN D.L., DIXON B., YUSOP Z., CHAPLOT V. Impacts of DEM resolution, source, and resampling technique on SWAT-simulated streamflow. Applied Geography, 63, 357, 2015.
32. OUYANG F., ZHU Y., FU G., LÜ H., ZHANG A., YU Z., CHEN X. Impacts of climate change under CMIP5 RCP scenarios on streamflow in the Huangnizhuang catchment.

2348 Zaman M., et al.
Stochastic environmental research and risk assessment, 29 (7), 1781, 2015.
33. HEJAZI M.I., CAI X.M. Building more realistic reservoir optimization models using data mining - a case study of Shelbyville reservoir. Advances in Water Resources, 34, 701, 2011.
34. HUANG W.C., YUAN L.C. A drought early warning system on real-time multireservoir operations. Water Resources Research, 40, 2004.
35. MOUSAVI S.J., KARAMOUZ M., MENHADJ M.B. Fuzzy-state stochastic dynamic programming for reservoir operation. Journal of Water Resources Planning and Management, 130 (6), 460, 2004.
36. RAHI O.P., CHANDEL A.K., SHARMA M.G. Optimization of hydro power plant design by particle swarm optimization (PSO). Procedia Engineering, 30, 418, 2012.
37. LIMA C.A.S., LAPA C.M.F., DO NA PEREIRA C.M., DA CUNHA J.J., ALVIM A.C.M. Comparison of computational performance of GA and PSO optimization techniques when designing similar systems – Typical PWR core case. Annals of Nuclear Energy, 38 (6), 1339, 2011.
38. REED P.M., HADKA D., HERMAN J.D., KASPRZYK J.R., KOLLAT J.B. Evolutionary multiobjective optimization in water resources: The past, present, and future. Advances in water resources, 51, 438, 2013.
39. KENNEDY J., E.R. Particle swarm optimization. Proc, in IEEE Int. Conf. Neural Networks, Perth, Australia, 1995.
40. MA J., WANG H., FAN K. Dynamic downscaling of summer precipitation prediction over China in 1998 using WRF and CCSM4. Advances in Atmospheric Sciences, 32 (5), 577, 2015.
41. YAN D., SASKIA E.W., LUDWIG F. HE QING HUANG. Hydrological response to climate change: The Pearl River, China under different RCP scenarios. Journal of Hydrology: Regional Studies, 4, 228, 2015.
42. YIN J., YAN D., YANG Z., YUAN Z., YUAN Y., WANG H. SHI X. Research on Historical and Future Spatial-Temporal Variability of Precipitation in China. Advances in Meteorology, 2016.
43. BASHEER A., LU H.S., OMER A., ALI A.B., ABDELGADER A.M.S. Impacts of climate change under CMIP5 RCP scenarios on the streamflow in the Dinder River and ecosystem habitats in Dinder National Park, Sudan. Hydrology & Earth System Sciences Discussions, 12 (10), 2015.
44. ZAMAN M., FANG G., SAIFULLAH M., JAVED Q. Seasonal and annual precipitation trend prediction in Xin’NANJIANG China,Fresenus Environmental Bulletin, 25 (1), 89, 2016.
45. ABBASPOUR K.C., YANG J., MAXIMOV I., SIBER R., BOGNER K., MIELEITNER J., SRINIVASAN R. Spatially-distributed modelling of hydrology and water quality in the prealpine/ alpine Thur watershed using SWAT. Journal of Hydrology, 333, 413, 2007.
46. ARNOLD J.G., MORIASI D.N., GASSMAN P.W., JHA M.K. Swat: Model use, Calibration, and Validation. American Society of Agricultural and Biological Engineers, 55 (4),1491, 2012.
47. VAN LIEW M.W., VIETH T.L., BOSCH D.D., ARNOLD J.G. Suitability of SWAT for the conservation effects assessment project: a comparison on USDA-ARS experimental watersheds. Journal of Hydrological Engineering., 12 (2),173, 2007.
48. NASH J.E., SUTCLIFFE J.V. River flow forecasting through conceptual models, discussion of principles. Journal of Hydrological Engineering, 10 (3), 282, 1970.
49. ZHANG L., KARTHIKEYAN R., BAI Z., SRINIVASAN R. Analysis of streamflow responses to climate variability and land use change in the Loess Plateau region of China. Catena, 154, 1, 2017.
50. ADNAN M., NABI G., KANG S., ZHANG G., ADNAN R.M., ANJUM M.N., MUDASSAR I., ALI A.F. Snowmelt Runoff Modelling under Projected Climate Change Patterns in the Gilgit River Basin of Northern Pakistan. Pol. J. Environ. Stud., 26 (2), 525, 2017.
51. ALEKSANYAN A.S., KHUDAVERDYAN, S.K., VASEASHTA A. Modeling river ecosystem vulnerability assessments due to climate change: case study of Armenia. Pol. J. Environ. Stud. , 24 (2), 871, 2015.
52. JIANG B., CHEN J., LUO Q., LAI J., XU H., WANG Y., YU K. Long-Term Changes in Water Quality and Eutrophication of China’s Liujiang River. Pol. J. Environ. Stud. , 25 (3), 1033, 2016.
53. GU H., YU Z., WANG G., WANG J., JU, Q., YANG C., FAN C. Impact of climate change on hydrological extremes in the Yangtze River Basin, China. Stochastic environmental research and risk assessment, 29 (3), 693, 2015.
54. ZHANG Y., YOU Q., CHEN C., GE J. Impacts of climate change on streamflows under RCP scenarios: A case study in Xin River Basin, China. Atmospheric Research, 178, 521, 2016.
55. BABUR M., BABEL M.S., SHRESTHA S., KAWASAKI A., TRIPATHI, N.K. Assessment of Climate Change Impact on Reservoir Inflows Using Multi Climate-Models under RCPs – The Case of Mangla Dam in Pakistan. Water, 8 (9), 389.2016.