FoxO1 Protein Cooperates with ATF4 Protein in Osteoblasts to ...

Loss of Pdk1-Foxo1 Signaling in Myeloid CellsPredisposes to Adipose Tissue Inflammation andInsulin ResistanceYoshinaga Kawano,
1Jun Nakae,
1Nobuyuki Watanabe,
2Shiho Fujisaka,
3Kristy Iskandar,
4
Risa Sekioka,1Yoshitake Hayashi,
5Kazuyuki Tobe,
3Masato Kasuga,
6Tetsuo Noda,
7
Akihiko Yoshimura,8Masafumi Onodera,
2and Hiroshi Itoh
1
Chronic inflammation in adipose tissue contributes to obesity-related insulin resistance. The 3-phosphoinositide-dependentprotein kinase 1 (Pdk1)/forkhead transcription factor (Foxo1)pathway is important in regulating glucose and energy homeosta-sis, but little is known about this pathway in adipose tissue macro-phages (ATMs). To investigate this, we generated transgenic micethat carried macrophage/granulocyte-specific mutations, includinga Pdk1 knockout (LysMPdk1
2/2), a Pdk1 knockout with trans-activation-defective Foxo1 (D256LysMPdk1
2/2), a constitutivelyactive nuclear (CN) Foxo1 (CNFoxo1LysM), or a transactiva-tion-defective Foxo1 (D256Foxo1LysM). We analyzed glucosemetabolism and gene expression in ATM populations isolatedwith fluorescence-activated cell sorting. The LysMPdk1
2/2 miceexhibited elevated M1 macrophages in adipose tissue and insulinresistance. Overexpression of transactivation-defective Foxo1 res-cued these phenotypes. CNFoxo1LysM promoted transcription ofthe C-C motif chemokine receptor 2 (Ccr2) in ATMs and increasedM1 macrophages in adipose tissue. On a high-fat diet, CNFoxo1LysM
mice exhibited insulin resistance. Pdk1 deletion or Foxo1 acti-vation in bone marrow–derived macrophages abolished insulinand interleukin-4 induction of genes involved in alternative mac-rophage activation. Thus, Pdk1 regulated macrophage infiltrationby inhibiting Foxo1-induced Ccr2 expression. This shows that themacrophage Pdk1/Foxo1 pathway is important in regulating in-sulin sensitivity in vivo. Diabetes 61:1935–1948, 2012
Obesity is a predisposing factor for the develop-ment of type 2 diabetes, hypertension, hyperlip-idemia, and atherosclerosis (1). Chronic activationof intracellular proinflammatory pathways in ad-
ipose tissue contributes to obesity-related insulin resistance.Adipose tissue macrophages (ATMs) are a major source of
proinflammatory cytokines, including interleukin (IL)-6, IL-1b,and tumor necrosis factor (TNF)-a, which can decreaseinsulin sensitivity in insulin target cells (2). However, onlysparse evidence suggests that ATMs may become insulinresistant and play a role in insulin signaling (3–9).
The 3-phosphoinositide-dependent protein kinase 1 (Pdk1)–forkhead transcription factor (Foxo1) signaling path-way regulates energy and glucose metabolism in severalinsulin-responsive tissues, including pancreatic b-cells andproopiomelanocortin and agouti-related protein neurons(10,11). However, few studies investigate this signaling path-way in ATMs. Recent reports suggest that activation ofFoxo1 in macrophages promotes inflammation by inducingIL-1b expression (12) or toll-like receptor 4–mediated sig-naling (13). They show that Foxo1 could induce inflamma-tory cascades, but they do not investigate the role of Foxo1specifically in ATMs in vivo.
In the current study, we generated transgenic mice thatcarried macrophage-specific mutations, including a Pdk1knockout, a constitutively nuclear (CN) Foxo1, or a trans-activation-defective Foxo1. We analyzed insulin sensitivityin these mice in vivo. We found a novel Pdk1-Foxo1 signal-ing mechanism that regulated M1 macrophage recruitment.
RESEARCH DESIGN AND METHODS
Mice. All experimental protocols with mice were approved by the animal ethicscommittees of the Keio University School of Medicine (09134-1). To createmacrophage-specific Pdk1 knockout mice, Pdk1flox/flox mice (11) were crossedwith LysMCre transgenic mice (14). The generation of R26floxneoCNFoxo1 micewas described previously (11). Only animals from the same generation of themixed-background strain were compared. All mice studied were examined ona B6/129 mixed genetic background. Mice were obtained from two inde-pendent cohorts of independent breeders, and littermates were used for everyin vivo study. Animals were housed in sterile cages in a barrier animal facilityat 22–24°C with a 12-h light/dark cycle.Antibodies.All antibodies used in the current study are available upon request.Analytical procedures. For high-fat diet (HFD) studies, we used age-matched(28-week-old) mice. We started the HFD at age 4 weeks for the 24-week HFDand at age 24 weeks for the 4-week HFD. All of the HFD mice were comparedwith age-matched mice fed a normal chow diet (NCD). The HFD was describedpreviously (15). Analysis was limited to male mice because they are moresusceptible to insulin resistance and diabetes. We performed intraperitonealglucose tolerance tests (IPGTTs) after an overnight fast and insulin tolerancetests (ITTs) after fasting for 3–5 h. The area under the curve (AUC) was cal-culated from the level of each measured point by the trapezoidal method.Flow cytometric analysis. Flow cytometric analysis was performed as de-scribed previously (16).Hepatic glycogen content. We measured glycogen content as describedpreviously (17).Immunofluorescence. Double-positive cells were counted and marked digi-tally to prevent multiple counts with Adobe Photoshop CS4 EXTENDED andImageJ software (National Institutes of Health, Bethesda, MD). Cells werecounted in eight mice for each HFD duration. At least 300 cells were counted ineach mouse.
From 1Frontier Medicine on Metabolic Syndrome, Division of Endocrinology,Metabolism, and Nephrology, Department of Internal Medicine, Keio Uni-versity School of Medicine, Tokyo, Japan; the 2Department of Human Ge-netics, National Center for Child Health and Development, Tokyo, Japan;the 3Department of Internal Medicine, University of Toyama, Toyama,Japan; the 4Pediatric Research Office, Department of Child Health, Facultyof Medicine, Universitas Gadjah Mada, Sardjito Hospital, Yogyakarta, Indonesia;the 5Division of Molecular Medicine and Medical Genetics, InternationalCenter for Medical Research and Treatment, Kobe University GraduateSchool of Medicine, Kobe, Japan; the 6Research Institute, International Med-ical Center of Japan, Tokyo, Japan; the 7Department of Cell Biology, JapaneseFoundation for Cancer Research, Cancer Institute, Tokyo, Japan; and the8Department of Microbiology and Immunology, Keio University School ofMedicine, Tokyo, Japan.
Corresponding author: Jun Nakae, [email protected] 6 June 2011 and accepted 6 March 2012.DOI: 10.2337/db11-0770This article contains Supplementary Data online at http://diabetes
.diabetesjournals.org/lookup/suppl/doi:10.2337/db11-0770/-/DC1.� 2012 by the American Diabetes Association. Readers may use this article as
long as the work is properly cited, the use is educational and not for profit,and the work is not altered. See http://creativecommons.org/licenses/by-nc-nd/3.0/ for details.
diabetes.diabetesjournals.org DIABETES, VOL. 61, AUGUST 2012 1935
ORIGINAL ARTICLE

FIG. 1. Characterization of InsR, Pdk1, and Foxo1 in ATMs during an HFD. A: The percentages of InsR+cells among F4/80
+cells in epididymal fat
from age-matched wild-type mice fed an NCD and 24 weeks of an HFD. Values are means + SEM of eight mice. *P < 0.005, **P < 0.01, and ***P <0.05 (one-factor ANOVA). B: Representative immunofluorescence images of epididymal fat double labeled for InsR and F4/80 in wild-type mice fedan HFD for 24 weeks. Cells that exhibit high expression level of InsR protein (top); cells that exhibit low or faint expression level of InsR(bottom). Red, green, and blue indicate InsR, F4/80, and DAPI staining, respectively. C: The percentages of phospho-PDK1
+cells among F4/80
+
cells in epididymal fat from age-matched wild-type mice fed an NCD and 24 weeks of an HFD. Values are means + SEM of eight mice. *P < 0.005,**P < 0.01, ***P < 0.05 (one-factor ANOVA). D: Real-time PCR analysis of Foxo family members in cell populations sorted by flow cytometricanalysis of the SVF from the epididymal fats of wild-type mice fed an HFD for 16 weeks, using anti-F4/80, anti-CD11c, and anti-CD206 antibodies.The levels of each transcript were normalized to the level in M1 macrophages. Values are means + SEM of three mice. *P < 0.05 (one-factorANOVA, M1 vs. M2 macrophages). E: The percentages of nuclear Foxo1
+cells among F4/80
+cells in the epididymal fat of age-matched wild-type
Pdk1-Foxo1-Ccr2 IN ATM
1936 DIABETES, VOL. 61, AUGUST 2012 diabetes.diabetesjournals.org

H2O2 production. Measurement of H2O2 production was performed as de-scribed elsewhere (18). Epididymal fat was dissected from age-matched maleC57BL/6J mice on either an NCD or a 4-24 week HFD.Counting crown-like structures. Measurement of number of crown-likestructures (CLSs) was performed as described previously (16).Cell size measurements. Adipocyte size was measured with FLVFS-LS soft-ware (Flovel, Tokyo, Japan) by manually tracing a minimum of 1,200 adipocytesfor each mouse. We measured adipocytes in at least six mice of each genotype.Isolation of murine bone marrow–derived macrophages. Isolation of bonemarrow–derived macrophages (BMDMs) was performed as described else-where (19).Transwell migration assay. Transwell migration assays were performed aspreviously described (20).Viral transduction. Adenovirus constructs that encoded Foxo1 mutants aredescribed elsewhere (21,22). RAW264.7 cells were infected with adenoviruses(10–100 multiplicity of infection [MOI]) and harvested after 48 h. Forcotransductions, cells were first transduced with an adenovirus that encodedFlag-CNFoxo1 at the indicated MOI for 8 h. The virus was then removed fromthe culture dish, and the cells were transduced with another adenovirus thatencoded HA-D256Foxo1 at the indicated MOI for 8 h.RNA isolation and real-time PCR. The isolation of total RNA and real-timePCR were performed as described previously (15). All primer sequences areavailable upon request.Western blotting. Western blotting was performed as described previously(15). Insulin-stimulated phosphorylation of insulin receptor substrates (IRSs)and Akt were performed as described elsewhere (23).Construction of C-C motif chemokine receptor 2 promoter–directed
luciferase reporter vectors. Several DNA fragments containing the mouseC-C motif chemokine receptor 2 (Ccr2) promoter were PCR-amplified frommouse genomic DNA. After verifying their nucleotide sequences by DNA se-quencing, the Ccr2 promoter fragments were cloned into the luciferase re-porter pGL3-Basic vector (Promega, Madison, WI). All primer sequences areavailable upon request.Site-directedmutagenesis. The QuickChange II site-directed mutagenesis kit(Stratagene, La Jolla, CA) was used to alter the consensus Foxo1 bindingelements in the Ccr2 promoter in PGL3-Basic vectors. Mutated nucleotideswere confirmed with DNA sequencing. All primer sequences are availableupon request.Luciferase assay. The luciferase assay was performed as described pre-viously (22).Electrophoretic mobility shift assay. Electrophoretic mobility shift assay(EMSA) and the super shift assay were performed as described previously (24).Chromatin immunoprecipitation assay. Chromatin immunoprecipitation(ChIP) assay was performed as described previously (22).Statistical analysis. We calculated descriptive statistics with ANOVA fol-lowed by Fisher test (Statview; SAS Institute Inc.). P , 0.05 was consideredsignificant. Differences between two groups or among three groups were in-vestigated with two-way repeated-measures ANOVA with an ad hoc multiplecomparison method (Fisher least significant differences [LSD] test).
RESULTS
Insulin receptor expression and Pdk1 phosphorylationin ATMs during an HFD. To explore the significance ofinsulin signaling pathway in ATM, we examined insulin re-ceptor (InsR) protein expression in ATMs by double im-munofluorescence with anti-InsR and anti-F4/80 antibodies.During the HFD, ATM InsR protein levels were significantlyreduced by ;50% compared with controls (Fig. 1A and B).
Next, we explored Pdk1 expression in ATMs under dif-ferent diets. Immunofluorescence of epididymal fat fromC57BL/6J mice on an HFD for 16 weeks revealed that cellspositive for the macrophage marker CD68 were also positive
for Pdk1 (Fig. 2A, top). Because Pdk1 activity depends on Ser241 phosphorylation (25), we probed with an antiphospho-Pdk1 antibody. On an NCD, ;80% of F4/80+ cells werestained with antiphospho-Pdk1. On an HFD for 24 weeks,the proportion of phospho-Pdk1+ ATMs gradually decreasedfrom 80% to from 40 to 50% (Fig. 1C). These data confirmthat the InsR-Pdk1 pathway was functionally regulated inATMs during the HFD.Foxo1 in ATMs under an HFD. To explore the relativeimportance of Foxo family members in ATMs, we comparedthe expression of Foxo1, Foxo3a, and Foxo4 in M1 and M2macrophages isolated from the stromal vascular fraction(SVF) of epididymal fat from C57BL/6J mice fed an HFD for16 weeks. We defined F4/80+CD11c+CD2062 cells as M1macrophages and F4/80+CD11c2CD206+ cells as M2 mac-rophages (16). M1 macrophages showed significantly in-creased Foxo1 expression compared with M2 macrophages.Foxo3a expression was also increased in M1 comparedwith M2 macrophages but not significantly. In contrast, M1and M2 macrophages showed similar Foxo4 expression(Fig. 1D). These observations suggest that Foxo1 played anessential role in ATMs.
Because Foxo1 activity depends on its subcellular lo-calization (26), we examined Foxo1 with immunofluores-cence in ATMs from age-matched C57BL/6J mice fed anNCD or HFD. Under the NCD,;20% of Foxo1 was localizedto the nucleus. After 24 weeks of an HFD, ;45% of Foxo1was localized to the nucleus (Fig. 1E and F). These datasuggest that Foxo1 was functionally significant in ATMs.
Foxo1 is regulated by oxidative stress through H2O2 pro-duction and the Jun NH2-terminal kinase (JNK)–mammalianSte20-like kinase 1 (MST1) pathway, which induces Foxo1nuclear translocation (27–30). The production of H2O2 signifi-cantly increased at ;24 weeks of HFD (Fig. 1G). Further-more, JNK and MST1 phosphorylation significantly increasedafter 24 weeks of HFD (Fig. 1H and I). These data suggestthat both decreased Pdk1 phosphorylation and activationof the JNK-MST1 pathway may contribute to Foxo1 nuclearlocalization.Deletion of Pdk1 in ATMs causes insulin resistancewith rescue by transactivation-defective Foxo1. Toclarify the function of Pdk1 in ATMs, we generated mice thatlacked Pdk1 in macrophages/granulocytes (LysMPdk1
2/2).Efficient, specific Pdk1 deletion was evidenced by immuno-fluorescence (Fig. 2A) and Western blot analysis (Fig. 2B).Thus, we could study the effects of cell-specific Pdk1deficiency.
The deletion of Pdk1 in ATMs was expected to causenuclear localization of Foxo1. Immunofluorescence withan anti-Foxo1 antibody in epididymal fat revealed that;60–70% of Foxo1 was localized to the nuclei of ATMs inLysMPdk1
2/2 mice (Fig. 2C). We assumed that Foxo1was active in Pdk1-deficient ATMs and that this activitycould be blocked with the dominant-negative form ofFoxo1 (D256Foxo1), which lacked a COOH-terminal trans-activation domain (31). To investigate this, we crossed
mice fed an NCD and 24 weeks of an HFD. Values are means + SEM of eight mice. *P < 0.001, **P < 0.005 (one-factor ANOVA). F: Representativeimmunofluorescence images of epididymal fat double labeled for Foxo1 and F4/80 in wild-type mice fed an HFD for 24 weeks. Cytosolic (top) andnuclear Foxo1 (bottom). Red, green, and blue indicate Foxo1, F4/80, and DAPI staining, respectively. G: The release of H2O2 from epididymal fatsfrom age-matched male C57BL/6J mice fed an NCD or 4–24 weeks of an HFD. Values are expressed as mean 6 SEM of five mice in each condition.*P < 0.001 (one-factor ANOVA). H: Western blotting of epididymal fats from age-matched male C57BL/6J mice fed an NCD or 4–24 weeks of anHFD. After transference to nylon membrane, tissue lysates (200 mg) were blotted to the indicated antibodies. I: Quantitative analysis of JNK andMST1 phosphorylation in epididymal fats. The intensity of each band was measured using NIH Image 1.62, and the intensities of bands of phospho-JNK or phospho-MST1 bands were corrected by total JNK or MST1 and calculated as the fold change from NCD. Data are means + SEM of five micein each genotype. *P< 0.001, **P< 0.005, and ***P < 0.05 (one-factor ANOVA of NCD vs. HFD). WAT, white adipose tissue; P, phospho; W, weeks.(A high-quality digital representation of this figure is available in the online issue.)
Y. KAWANO AND ASSOCIATES
diabetes.diabetesjournals.org DIABETES, VOL. 61, AUGUST 2012 1937

FIG. 2. Effects of the deletion of Pdk1 or inhibition of the transactivation of Foxo1 on glucose metabolism and insulin sensitivity. A: Represen-tative immunofluorescence images of epididymal fat double labeled for CD68 and PDK1 in 24-week-old wild-type and LysMPdk1
2/2mice. Green,
red, and blue indicate CD68, PDK1, and DAPI staining, respectively. B: Expression of Pdk1 in peritoneal macrophages and peripheral tissues.Western blot of Pdk1 and tubulin (loading control) in the white adipose tissue (WAT), liver, spleen, brown adipose tissue (BAT), lungs, heart, andkidneys of control and LysMPdk1
2/2(KO) mice. C: The percentages of nuclear Foxo1
+among F4/80
+cells in epididymal fat of control, LysMPdk1
2/2,
and D256LysMPdk12/2
mice aged 20–24 weeks. Counting of cells stained with anti-F4/80 and anti-FOXO1 are described in RESEARCH DESIGN AND METHODS.Values are means + SEM of three mice in each genotype. *P < 0.005 (one-factor ANOVA). D: Body weight of control, LysMPdk1
2/2, and
D256LysMPdk12/2
fed an NCD. Data are means + SEM of 18–20 mice in each genotype. E: IPGTT of control (open circle), LysMPdk12/2
(redcircle), and D256LysMPdk1
2/2(blue circle) mice fed an NCD. Data are means + SEM of 20–25 mice in each genotype at age 20–24 weeks. *P< 0.05
(two-way repeated-measures ANOVA with an ad hoc multiple comparison method [Fisher LSD test] of LysMPdk12/2
vs. control orD256LysMPdk1
2/2mice). F: Comparison of AUC in control, LysMPdk1
2/2, andD256LysMPdk1
2/2mice during IPGTT. Data are means + SEM of 20–25
mice in each genotype. *P < 0.01 (two-way repeated-measures ANOVA with Fisher LSD test of LysMPdk12/2
vs. D256LysMPdk12/2
mice) and**P < 0.05 (two-way repeated-measures ANOVA with Fisher LSD test of LysMPdk1
2/2vs. control mice). G and H: Insulin secretion (G) of control
(open circle), LysMPdk12/2
(red circle), and D256LysMPdk12/2
(blue circle) mice during IPGTT and blood glucose (H) during ITT. Data are
Pdk1-Foxo1-Ccr2 IN ATM
1938 DIABETES, VOL. 61, AUGUST 2012 diabetes.diabetesjournals.org

R26floxneoD256FoxO1 (11) with LysMCre transgenic mice
to generate R26floxneoD256FoxO1LysMCre (D256Foxo1LysM)
double heterozygotes. Real-time PCR analysis and im-munofluorescence confirmed the macrophage-specific ex-pression of the transgene and the nuclear localization ofFLAG-D256Foxo1, respectively (Supplementary Figs. 1 and 2).We crossed D256Foxo1LysM with Pdk1
flox/+ to generate doublemutant mice (D256Foxo1LysMPdk1+/2). Finally, these micewere crossed with Pdk1
flox/+ to generate D256Fox-o1
LysMPdk1
2/2 (D256LysMPdk12/2) mice (Supplementary
Fig. 3). As expected, D256LysMPdk12/2mice showed excess
nuclear Foxo1 in F4/80+ cells from epididymal fat (Fig. 2C).The LysMPdk1
2/2 and D256LysMPdk12/2 mice exhib-
ited normal body weight when fed an NCD (Fig. 2D), andtheir epididymal fat tissue weight and adipocyte sizes weresimilar to those of control mice (Supplementary Fig. 4Aand B). However, the IPGTTs revealed that LysMPdk1
2/2,but not D256LysMPdk1
2/2, mice exhibited glucose in-tolerance (Fig. 2E and F). Insulin secretion during theIPGTT was higher in LysMPdk1
2/2 mice than in controlsand D256LysMPdk1
2/2 mice, but the difference was notsignificant (Fig. 2G). Furthermore, insulin tolerance sig-nificantly decreased in LysMPdk1
2/2 mice compared withcontrol and D256LysMPdk1
2/2 mice (Fig. 2H). These dataindicate that the deletion of Pdk1 deteriorates insulin sensi-tivity and that the ectopic expression of D256Foxo1ameliorates insulin sensitivity.
To identify the tissues that are responsible for insulinresistance, we investigated insulin-stimulated phosphory-lation of IRS1, IRS2, and/or Akt in epididymal fats, liver,and skeletal muscle from control, LysMPdk1
2/2, andD256LysMPdk1
2/2 mice. In epididymal fat and liver, insulin-stimulated phosphorylation of IRS1 or IRS2 and Akt wassignificantly decreased in LysMPdk1
2/2 mice comparedwith control mice (Fig. 2I). However, insulin-stimulatedphosphorylation of IRS and Akt in epididymal fat and liverfrom D256LysMPdk1
2/2 mice was similar to that of controlmice (Fig. 2I). The expression of G6pc was significantlyincreased in liver from LysMPdk1
2/2 compared withD256LysMPdk1
2/2 mice (Fig. 2J); moreover, the he-patic glycogen content of LysMPdk1
2/2 mice wassignificantly decreased compared with control andD256LysMPdk1
2/2 mice (Fig. 2K). In contrast, Akt phos-phorylation in skeletal muscle from LysMPdk1
2/2 micewas similar to that of control and D256LysMPdk1
2/2 mice(Fig. 2I). These data indicate that the deletion of Pdk1 inATMs led to insulin resistance, mainly in adipose tissue andliver, and that ectopic expression of D256Foxo1 amelio-rated insulin resistance in those tissues.Deletion of Pdk1 caused an increase of M1 macro-phages in adipose tissues. A CLS is the accumulation ofimmune cells around dead adipocytes (32). We found thatthe number of F4/80+ CLSs per field in epididymal fat wassignificantly higher in LysMPdk1
2/2mice than in controland D256LysMPdk1
2/2 mice (Fig. 3A).
The SVF of adipose tissue from 20-week-old mice con-tained a substantially higher proportion of F4/80+ cellsin LysMPdk1
2/2 compared with control mice (Fig. 3B andC). Analysis of macrophage subpopulations in the SVFshowed a higher proportion of F4/80+CD11c+CD2062 cellsin LysMPdk1
2/2 mice than in control mice (Fig. 3B and C).In contrast, the adipose tissue of D256LysMPdk1
2/2 miceshowed significantly reduced proportions of F4/80+
cells and F4/80+CD11c+CD2062 cells compared withLysMPdk1
2/2 mice (Fig. 3B and C). These data suggestthat the deletion of Pdk1 caused a significant increase inthe proportion of M1 macrophages in epididymal fat, andthe proportion was reduced with the overexpression ofD256Foxo1.
Consistent with the above findings, the expression ofchemokine (C-C motif) ligand 2 (Ccl2) (also known asmonocyte chemoattractant protein-1 [Mcp-1]) and Cd68 inepididymal fat (Fig. 3D) and of Ccr2 and Tnfa in SVF fromLysMPdk1
2/2 mice were significantly increased comparedwith control and D256LysMPdk1
2/2 mice (Fig. 3E). Fur-thermore, the expression level of IL-1 receptor antagonist,which is a naturally occurring antagonist of IL-1b andproduced by adipose and other tissues (33), in SVF fromLysMPdk1
2/2 mice was significantly decreased comparedwith control mice (Fig. 3E). These data support the notionthat the deletion of Pdk1 increased the recruitment of M1macrophages to adipose tissues.Macrophage-specific CNFoxo1 transgenic (CNFoxo1
LysM)
mice exhibited insulin resistance. To clarify the func-tion of Foxo1 in ATMs, we generated macrophage-specificCNFoxo1 transgenic mice. We crossed Rosa26-CNFoxo1(11) with LysMCre (CNFoxo1LysM) mice. Real-time PCRrevealed that the transgene was expressed exclusively in thespleen, liver, hypothalamus, and lung and in ATMs from theepididymal fat (Supplementary Fig. 5). These tissues havetissue-specific macrophages, which include the cells in thesinusoidal lining of the spleen, Kupffer cells in the liver,microglia in the hypothalamus, and alveolar macrophages inthe lung (14,34,35). Therefore, resident macrophages likelyaccount for the increased expression of the transgene inthese tissues. Immunofluorescence of the epididymal fatshowed that FLAG-CNFoxo1 was exclusively localized inthe nucleus of F4/80+ macrophages (Supplementary Fig. 6).Furthermore, immunofluorescence revealed that ;50% ofF4/80+ cells in epididymal fat of CNFoxo1
LysM mice werepositive for FLAG (Fig. 4A) and that the percentages ofnuclear Foxo1+ cells in adipose tissue of CNFoxo1LysM fedan HFD for 16 weeks was significantly increased comparedwith control mice fed an HFD or CNFoxo1LysM fed an NCD(Fig. 4B). These results show that CNFoxo1LysM mice werean appropriate model for studying the specific effects ofoverexpressing Foxo1 in ATMs.
On an NCD, CNFoxo1LysM mice exhibited normal bodyweight, glucose tolerance, insulin secretion, and insulinsensitivity (Supplementary Fig. 7A–D). On an HFD, the body
means + SEM of 20–25 mice in each genotype. *P < 0.05 (two-way repeated-measures ANOVA with Fisher LSD test of control vs. LysMPdk12/2
orD256LysMPdk1
2/2mice). I: Insulin-stimulated phosphorylation of IRSs and Akt in epididymal fat (WAT), liver, and skeletal muscle from control,
LysMPdk12/2
, and D256LysMPdk12/2
mice. For Western blotting with phospho- and total Akt, the same filters, in which tissue lysates (200 mg)were transferred, were blotted with the indicated antibodies. For immunoprecipitation of IRSs, tissue lysates (10 mg) were immunoprecipitatedwith the indicated antibodies and blotted with anti-phosphotyrosine antibody and then reblotted with anti-IRS antibody. J: Expression of genesspecific for gluconeogenesis in liver from control, LysMPdk1
2/2, and D256LysMPdk1
2/2mice in the random fed state. Values were normalized to
b-actin expression and represent means + SEM of 8–10 mice in each genotype. *P< 0.05 (one-factor ANOVA of LysMPdk12/2
vs.D256LysMPdk12/2
).K: Hepatic glycogen content. Control (n = 9), LysMPdk1
2/2(n = 9), and D256LysMPdk1
2/2(n = 8) mice were killed in the random fed state for the
determination of glycogen levels in liver extracts. Data are means + SEM of hepatic glycogen content corrected by the weight of liver per genotype.*P < 0.05 (one-factor ANOVA of control vs. LysMPdk1
2/2mice). (A high-quality digital representation of this figure is available in the online
issue.)
Y. KAWANO AND ASSOCIATES
diabetes.diabetesjournals.org DIABETES, VOL. 61, AUGUST 2012 1939

FIG. 3. Effects of Pdk1 deletion or inhibition of the transactivation of Foxo1 on adipose tissue inflammation. A: CLSs in epididymal fats werequantified from eight different fields per mouse and presented as number of CLSs per field. Data are means + SEM of 9–10 mice in each genotype.*P < 0.01 (one-factor ANOVA of LysMPdk1
2/2vs. control mice) and **P < 0.05 (one-factor ANOVA of LysMPdk1
2/2vs. D256LysMPdk1
2/2mice).
B: The expression of F4/80 and CD11c and CD206 in the SVF of epididymal fat from 20- to 24-week-old mice of the indicated genotype as assessedby flow cytometry. C: The percentages of F4/80
+, F4/80
+CD11c
+CD206
2, and F4/80
+CD11c
2CD206
+cells within the viable SVF from 20- to 24-week-
old mice of control, LysMPdk12/2
, and D256LysMPdk12/2
mice. Data are means + SEM of three mice in each genotype analyzed in three in-dependent experiments. *P < 0.05 (one-factor ANOVA of LysMPdk1
2/2vs. control or D256LysMPdk1
2/2mice). D: Expression of genes in the
epididymal fat of control, LysMPdk12/2
, and D256LysMPdk12/2
mice. Values were normalized to b-actin expression and represent the means +SEM of 8–10 mice per genotype. *P < 0.05 (one-factor ANOVA). E: Expression of genes specific for M1 (Ccr2, Il1b, Tnfa, and Il6) or M2 (Il10,Arg1, Mr, and Cd168) macrophage in SVF of epididymal fat in control, LysMPdk1
2/2, and D256LysMPdk1
2/2mice. Values were normalized to
b-actin expression and represent the means + SEM of 8–10 mice per genotype. *P < 0.05 and **P < 0.01 (one-factor ANOVA).
Pdk1-Foxo1-Ccr2 IN ATM
1940 DIABETES, VOL. 61, AUGUST 2012 diabetes.diabetesjournals.org

FIG. 4. Effects of the overexpression of CNFoxo1 in macrophages on glucose metabolism and adipose tissue inflammation. A: The percentages ofnuclear FLAG
+among F4/80
+cells in epididymal fat of CNFoxo1
LysMfed an HFD for 16 weeks. Counting of cells stained with anti-FLAG and anti-
F4/80 are described in RESEARCH DESIGN AND METHODS. B: The percentages of nuclear Foxo1+among F4/80
+cells in epididymal fat of control,
CNFoxo1LysM
fed an NC, and CNFoxo1LysM
mice aged 20 weeks and fed an HFD for 16 weeks. Counting of cells stained with anti-F4/80 and anti-FOXO1 are described in RESEARCH DESIGN AND METHODS. Values are means + SEM of eight mice in each genotype. *P< 0.005 and **P< 0.05 (one-factorANOVA). C: Body weight (BW) of control and CNFoxo1
LysMmice fed an HFD. Data are means + SEM of 18–20 mice in each genotype. *P < 0.05
(two-way repeated-measures ANOVA with an ad hoc multiple comparison method [Fisher LSD test] of control vs. CNFoxo1LysM
mice after 8 weeksof HFD). D: IPGTT of control (open circle) and CNFoxo1
LysM(blue circle) mice fed an HFD. Data are means + SEM of 20–25 mice in each genotype.
E: Comparison of AUC in control and CNFoxo1LysM
mice during IPGTT. Data are means + SEM of 20–25 mice in each genotype. *P < 0.05 (two-wayrepeated-measures ANOVA with Fisher LSD test of control vs. CNFoxo1
LysMmice). F: Insulin secretion of control (open circle) and CNFoxo1
LysM
(blue circle) mice during IPGTT. Data are means + SEM of 20–25 mice in each genotype. *P < 0.05 (two-way repeated-measures ANOVA withFisher LSD test of control vs. CNFoxo1
LysMmice). G: ITT of control (open circle) and CNFoxo1
LysM(blue circle) mice. Data are means + SEM of
20–25 mice in each genotype. *P < 0.01 and **P < 0.05 (two-way repeated-measures ANOVA with Fisher LSD test of control vs. CNFoxo1LysM
mice). H: CLSs in epididymal fats were quantified from eight different fields per mouse and presented as number of CLSs per field. Data are means +SEM of 9–10 mice in each genotype. *P < 0.05 (one-factor ANOVA of control vs. CNFoxo1
LysMmice). I: Expression of F4/80 and CD11c and
CD206 in cells of the SVF of epididymal fat from control and CNFoxo1LysM
mice fed an HFD for 16 weeks as assessed by flow cytometry. J: Thepercentages of F4/80
+, F4/80
+CD11c
+CD206
2, and F4/80
+CD11c
2CD206
+cells within the viable SVF from control and CNFoxo1
LysM20- to 24-week-
old mice fed an HFD for 16 weeks. The percentages of cell population among total SVF cells were calculated in each experiment. Data are means +SEM of fold change of control mice in each genotype (n = 3) analyzed in three independent experiments. *P < 0.05 (one-factor ANOVA of controlvs. CNFoxo1
LysMmice).
Y. KAWANO AND ASSOCIATES
diabetes.diabetesjournals.org DIABETES, VOL. 61, AUGUST 2012 1941

FIG. 5. Foxo1 increases migration capacity by inducing Ccr2 expression. A: Expression of genes specific for M1 (Ccr2, Il1b, Tnfa, and Il6) or M2(Il10, Arg1,Mr, and Cd168) phenotype of cells of the SVF from control and CNFoxo1
LysMmice fed an HFD for 16 weeks. Values were normalized to
b-actin expression and represent the means + SEM of 8–10 mice per genotype. *P < 0.05 (one-factor ANOVA of control vs. CNFoxo1LysM
mice).B: Expression of Ccr2 in ATMs sorted from the SVF of epididymal fat from control and CNFoxo1
LysMmice fed an HFD for 16 weeks. Values were
normalized to b-actin expression and represent the means + SEM of three mice per genotype. *P < 0.05 (one-factor ANOVA of control vs.CNFoxo1
LysMmice). C: Flag-CNFoxo1 protein expression was detected in RAW264.7 cells. Nontransduced RAW264.7 cells (lane 1); RAW264.7
cells transduced with adenovirus encoding CNFoxo1 at 20 and 100 MOI (lanes 2 and 3, respectively). Western blot of cell lysates using anti-tubulinantibody (bottom). D: Expression of Flag-CNFoxo1 gene in RAW264.7 cells transduced with adenoviruses encoding CNFoxo1 at the indicatedMOI. E: Real-time PCR to determine Ccr2 expression in RAW264.7 cells transduced with adenovirus encoding LacZ or CNFoxO1 at the indicated
Pdk1-Foxo1-Ccr2 IN ATM
1942 DIABETES, VOL. 61, AUGUST 2012 diabetes.diabetesjournals.org

and tissue weights of CNFoxo1LysM mice were similar tothose of control mice. However, adipocyte size in the epidid-ymal fat of CNFoxo1LysM mice tended to be larger than thatin control mice (Fig. 4C and Supplementary Fig. 8A–C). Al-though, on the HFD, CNFoxo1LysM and control mice exhib-ited similar glucose tolerance (Fig. 4D), the AUC of theIPGTT was significantly increased in CNFoxo1
LysM comparedwith control mice (Fig. 4E). Furthermore, the CNFoxo1
LysM
mice exhibited significantly increased insulin secretionand decreased insulin sensitivity (Fig. 4F and G). Thesedata suggest that the CNFoxo1 in ATMs caused insulinresistance.M1macrophage population was increased inCNFoxo1
LysM
mice. Adipocyte size and CLS density exhibit a positivecorrelation (32,36). Indeed, under HFD conditions,CNFoxo1
LysM mice had a significantly higher number ofCLSs in epididymal fat than control mice (Fig. 4H). Phe-notypic analysis of ATMs revealed significantly more F4/80+
cells in the SVF of CNFoxo1LysM mice compared with con-trol mice (Fig. 4I and J). Further analysis showed thatCNFoxo1
LysM mice had a significantly higher percentageof F4/80+CD11c+CD2062 and F4/80+CD11c2CD206+ cellscompared with control mice (Fig. 4I and J). These datasuggest that the CNFoxo1LysM mice have increased numbersof macrophages in adipose tissues under HFD conditions.CNFoxo1-induced Ccr2 gene expression. To inves-tigate how CNFoxo1 increased the M1 macrophage sub-population in adipose tissue, we analyzed gene expressionin the SVF of epididymal fat from mice fed an HFD. Real-time PCR demonstrated that CNFoxo1LysM mice expressedsignificantly higher levels of Ccr2 and Tnfa mRNAs thancontrol mice (Fig. 5A). Furthermore, the level of Ccr2expression in F4/80+CD11c+CD2062 cells was significantlyincreased in CNFoxo1
LysM mice compared with controlmice (Fig. 5B). To examine whether CNFoxo1 directlyinduces Ccr2 expression, we infected RAW264.7 cells withan adenovirus encoding b-galactosidase or CNFoxo1.Overexpression of CNFoxo1 in RAW264.7 cells signifi-cantly increased endogenous Ccr2 expression (Fig. 5C–E).These data suggest that the overexpression of CNFoxo1 inATMs increased Ccr2 expression.
Next, we investigated whether D256Foxo1 could blockFoxo1-induced Ccr2 expression. We cotransduced RAW264.7cells with adenoviruses that encoded Flag-CNFoxo1 andHA-D256Foxo1. We found that the presence of D256Foxo1inhibited the expression of endogenous Ccr2 in a dose-dependent manner (Fig. 5F and G). These data indicateand confirm that the D256Foxo1 construct had a dominantnegative effect on Foxo1-induced Ccr2 expression.Insulin- and IL-4–inhibited Ccr2 gene expression. Todetermine whether Foxo1 regulation of Ccr2 expression
was involved in insulin signaling, we tested whether insulinor IL-4 inhibited Ccr2 expression in a Foxo1-dependentmanner. Both insulin and IL-4 could significantly inhibit Ccr2expression in BMDMs from control and D256LysMPdk1
2/2
mice but not in BMDMs from LysMPdk12/2 and CNFox-
o1LysM mice (Fig. 5H). In contrast, insulin and IL-4 did not
affect expression of other genes specifically expressed inM1 macrophages, including Tnfa and Il1b (Fig. 5H).These data indicate that Foxo1-induced Ccr2 expressionwas regulated by both insulin and IL-4.Pdk1 deletion or CNFoxo1 expression enhancedmacrophage migration. To analyze the functional effectsof Pdk1 deficiency in macrophages, we performed transwellmigration assays with BMDMs. Pdk1-deficient BMDMsexhibited significantly more migration than BMDMs fromcontrol and D256LysMPdk1
2/2 mice (Fig. 5I). Further-more, BMDMs from CNFoxo1
LysM mice exhibited signifi-cantly increased MCP-1–stimulated migration capacitycompared with control BMDMs (Fig. 5J). These data con-firm that a Pdk1 deficiency and/or Foxo1 activation inmacrophages resulted in increased migration as a result ofincreased expression of Ccr2.Characterization of the Foxo1 response element withinthe Ccr2 promoter. To characterize the Foxo1 responseelement (FRE) in the Ccr2 promoter, we constructed dif-ferent versions of the mouse Ccr2 promoter by progressivelydeleting portions of the upstream region. The transcriptionalactivity of each mutant promoter in response to CNFoxo1binding was examined in HEK293T cells (Fig. 6A). Ccr2promoters with deletions up to 2291 nucleotides (nt) re-sponded to Foxo1 transactivation. However, further dele-tions, up to 2208 nt, completely abolished transcription ofthe reporter (Fig. 6A). Thus, the FRE was confined to a smallnucleotide region between 2291 and 2208 in the mouseCcr2 promoter. Consistent with this observation, the pro-moter region contained several putative Foxo responseelements (FREs), including GTAAAT from 2254 to 2249 ntand AAACA from 2215 to 2211 nt (Fig. 6A). It is interestingthat the former region is conserved among human, mouse,and rat Ccr2 promoters (Supplementary Fig. 9). To confirmthis finding, we generated one additional truncated mutantpromoter (237Ccr2), which had the latter FRE but not theformer. The 237Ccr2 promoter did not respond to Foxo1induction. These data suggest that the AAACA sequencefrom2215 to2211 was unnecessary for Foxo1 activation ofthe Ccr2 promoter. We also generated two additional mutantCcr2 promoters, one harboring nucleotide substitutions be-tween 2254 and 2249 (254mut) and one with substitutionsbetween 2215 and 2211 (215mut). Foxo1 induced tran-scription from the 215mut but not from the 254mut Ccr2promoter (Fig. 6A). These data suggest that the GTAAAT
MOI. The cells were transduced, incubated in complete medium, and harvested 48 h after transduction. Data (mean 6 SEM) are from three in-dependent experiments and normalized to the amount of b-actin mRNA, expressed as relative to the corresponding LacZ value. *P < 0.05 (one-factor ANOVA of cells transduced with LacZ vs. CNFoxo1 at 20 or 100 MOI). F: Expression of Flag CNFoxO1 and HA-D256FoxO1 at indicated MOIin RAW264.7 cells. Western blot using anti-Foxo1 (N18) antibody, which recognizes the NH2 terminus of Foxo1 (top). Arrows A and B indicateFlag-CNFoxo1 and HA-D256Foxo1, respectively. G: The effects of HA-D256Foxo1 on Flag-CNFoxo1–induced Ccr2 expression in RAW264.7 cells.Data are means + SEM from three independent experiments and are expressed as the fold change from endogenous Ccr2 expression in RAW264.7cells transduced with an adenovirus encoding LacZ. *P < 0.005 and **P < 0.05 (one-factor ANOVA of cells transduced with LacZ vs. Flag-CNFoxo1at MOI 100 and cells transduced with Flag-CNFoxo1 at MOI 100 vs. HA-D256Foxo1 at MOI 50 and 100). H: Expression of genes Ccr2, Tnfa, andIl1b of BMDM from the indicated genotypes. Cells were cultured for 6 days in the presence of PBS, insulin (100 nmol/L), or IL-4 (100 ng/mL).Values were normalized to b-actin expression and represent the means + SEM of fold of PBS in each genotype (8–10 mice per genotype). *P< 0.005(one-factor ANOVA of PBS vs. insulin or IL-4 in control mice), **P < 0.01 (one-factor ANOVA of PBS vs. insulin in D256LysMPdk1
2/2mice), and
***P < 0.05 (one-factor ANOVA of PBS vs. IL-4 in D256LysMPdk12/2
mice). I and J: Migration of BMDM from control, LysMPdk12/2
, andD256LysMPdk1
2/2mice (I) and from control and CNFoxo1
LysMmice (J) through a gelatin matrix was analyzed using a transwell migration assay
at the indicated concentration of MCP-1. Data are means + SEM of cell numbers per 10 high power fields (HPFs) from three independentexperiments. *P < 0.005 (one-factor ANOVA of LysMPdk1
2/2vs. control or D256LysMPdk1
2/2mice at basal condition), **P < 0.01 (one-factor
ANOVA of LysMPdk12/2
vs. D256LysMPdk12/2
mice at 100 ng/mL of MCP-1), and ***P< 0.05 (one-factor ANOVA of LysMPdk12/2
vs. control miceand of control vs. CNFoxo1
LysMmice at 100 ng/mL of MCP-1).
Y. KAWANO AND ASSOCIATES
diabetes.diabetesjournals.org DIABETES, VOL. 61, AUGUST 2012 1943

FIG. 6. Ccr2 as a target gene of Foxo1 and the effects of insulin or IL-4 on genes for M2 signature. A: Effect of Foxo1 on Ccr2 promoter activity.Data were obtained from 10 experiments and are represented as means 6 SEM of fold change from mock vector-transfected activity. *P < 0.001,**P < 0.005, and ***P < 0.05 (one-factor ANOVA of cells transfected with pCMV5/cMyc and pCVM5/cMyc-CNFoxo1 vector). B: EMSA of Foxo1binding to DNA. The DNA probe was derived from a 31–base pair DNA covering the consensus Foxo1 binding site (2267/2237 nt) of the mouseCcr2 promoter (lanes 1–3). A mutant DNA with an altered Foxo1 binding motif was used as a control (lanes 4–6). The position of the slowedcomplex is indicated as A, and the supershifted complex is indicated as B. C: Oligonucleotide probes corresponding to the Foxo1 binding site of theCcr2 promoter were incubated with nuclear extracts in the absence or presence of increasing amounts of unlabeled wild-type (lanes 1–4) ormutant oligonucleotide (lanes 5–8). D: Mouse Ccr2 promoter and primer pairs used in ChIP assay. The magenta box indicates a consensus Foxo1binding site. E: ChIP assays of RAW264.7 cells transduced with an adenovirus encoding CNFoxo1 and harvested 36 h after transduction (left). ThePCR primers amplified the mouse Ccr2 promoter sequence as shown in Fig. 5G. PCR reactions with total input chromatin are shown as control.
Pdk1-Foxo1-Ccr2 IN ATM
1944 DIABETES, VOL. 61, AUGUST 2012 diabetes.diabetesjournals.org

sequence from2254 to2249 nt in the mouse Ccr2 promoterwas the functional FRE.Association of Foxo1 with the Ccr2 promoter. To ex-amine the ability of this putative FRE to bind Foxo1, weconducted an EMSA. Foxo1 caused significant retardationof the FRE DNA (Fig. 6B, lane 1). Inclusion of the anti-cMyc antibody resulted in a supershifted DNA band (Fig.6B, lane 2). The same EMSA was performed using a mu-tant DNA containing five base substitutions within the FREmotif as a control. Alterations in the consensus FRE motifabrogated its ability to bind Foxo1 (Fig. 6B, lane 4). Incu-bating nuclear extracts from cells expressing cMyc-taggedFoxo1 with a probe encoding the 31–base pair FRE DNAsequence yielded a slower complex that was competed outby excess cold probe (Fig. 6C, lanes 1–4) but not mutantprobe (Fig. 6C, lanes 5–8).
We performed a ChIP assay to determine the associationbetween Foxo1 and the Ccr2 promoter in RAW264.7 cells.Because of low levels of Foxo1 expression in RAW264.7cells, we transduced cells with adenovirus encodingCNFoxo1. Using primers flanking the FRE motif within theCcr2 promoter (Fig. 6D), we detected a sequence-specificDNA corresponding to the proximal region (2474/9 nt) ofthe Ccr2 promoter in immunoprecipitates obtained withanti-FLAG antibody (Fig. 6E). We also performed PCRanalysis using a pair of off-target primers flanking distalregions (21857/21667 and 21425/21177 nt). No specificDNA was amplified in the immunoprecipitates using nor-mal mouse IgG or anti-FLAG antibody (Fig. 6E). Thesedata confirm that Foxo1 directly binds the Ccr2 promoterand that Ccr2 is a target gene of Foxo1.The Pdk1-Foxo1 pathway plays a role in alternativemacrophage activation. To determine whether the Pdk1-Foxo1 pathway was essential for alternative activation ofmacrophages, we analyzed macrophage signatures in insulin-or IL-4–stimulated BMDMs from control, LysMPdk1
2/2,CNFoxo1
LysM, and D256LysMPdk12/2 mice. The signature
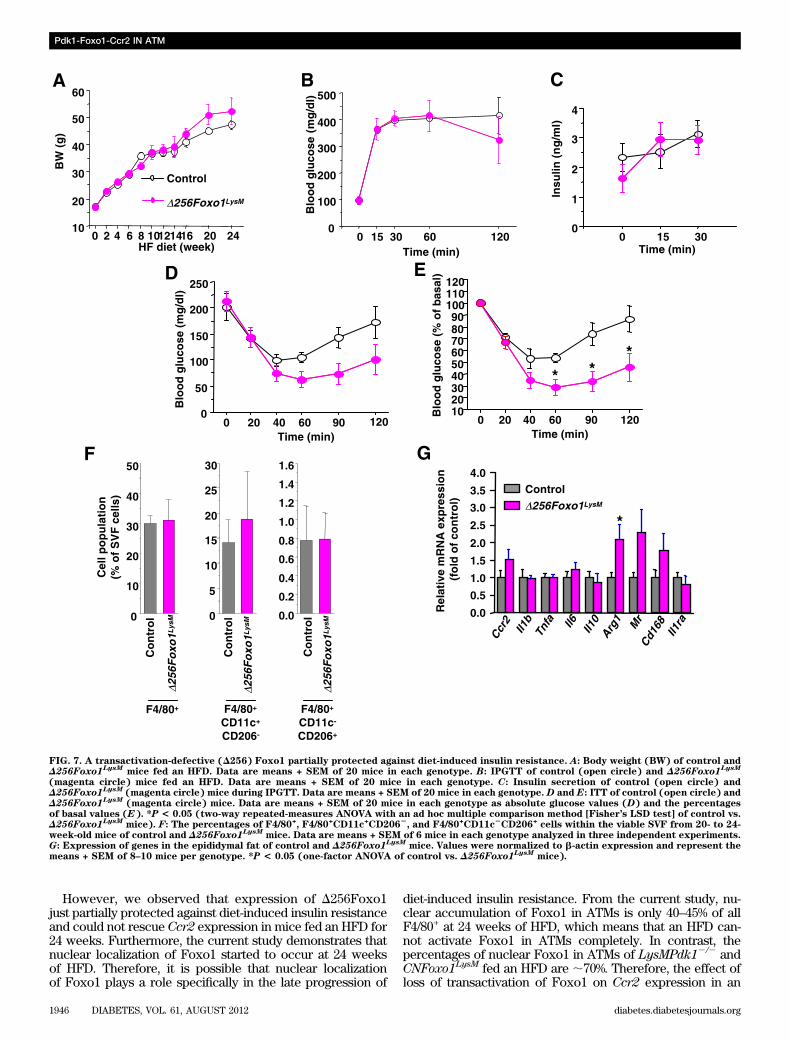
genes, including Arg1, Cd163, Il10, and Mr, were signifi-cantly induced by insulin or IL-4 in BMDMs from controlmice (Fig. 6F). In contrast, Pdk1 deficiency or constitutiveFoxo1 activation completely abolished insulin- or IL-4–stimulated induction of the genes necessary for alternativemacrophage activation (Fig. 6F). It is interesting that theexpression of transactivation-defective (D256) Foxo1 res-cued IL-4–induced, but not insulin-induced, gene expres-sion (Fig. 6F). These data indicate that the Pdk1-Foxo1pathway was required for the activation of macrophagesvia the alternative pathway.A transactivation-defective (D256) Foxo1 partiallyprotected against diet-induced insulin resistance. Todetermine whether blocking Foxo1 transactivation by ex-pressing D256Foxo1 in ATMs would alleviate insulin resis-tance, we compared glucose homeostasis and insulinsensitivity in wild-type and D256Foxo1LysM mice fed anHFD for 24 weeks. We observed no differences in bodyweight, glucose tolerance, or insulin secretion between ge-notypes (Fig. 7A–C). Furthermore, the D256Foxo1LysMmiceshowed a weak but significant improvement in insulinsensitivity compared with wild-type mice (Fig. 7D and E).
After a 24-week HFD, D256Foxo1LysM and wild-type micehad similar proportions of F4/80+, F4/80+CD11c+CD2062,and F4/80+CD11c2CD206+ cells in adipose tissues (Fig. 7F).Moreover, in epididymal fat, no differences were observedin the gene expression profiles of M1 macrophages, in-cluding Ccr2, Il1b, Tnfa, and Il6. However, there wasa significant increase in Arg1 expression in D256Foxo1LysM
compared with control mice (Fig. 7G). Taken together,these data show that overexpression of D256Foxo1 inmacrophages did not prevent glucose intolerance, but it didpartially alleviate insulin resistance.
DISCUSSION
In the current study, we demonstrate that Pdk1 in ATMsinhibits recruitment of M1 macrophages into adipose tis-sues, while Foxo1 antagonizes these processes. Thesefindings suggest that the Pdk1-Foxo1 signaling pathway inATMs is important for regulation of chronic inflammationand insulin sensitivity in vivo (Fig. 8).
The key finding of the current study was that Foxo1targeted Ccr2 expression in macrophages. Ccr2 is theprimary receptor for Mcp1/Ccl2, a member of the chemo-kine family of proteins. Ccr2 is expressed on circulatingmonocytes and ATMs, where it serves as a crucial mono-cyte recruitment factor by directing macrophages to sitesof injury and inflammation. Furthermore, Ccr2 is importantin the regulation of insulin sensitivity in vivo. Obesityincreases the production of Ccl2 in adipose tissues, whichleads to an accumulation of Ccl2-bound macrophages.When recruited macrophages are classically activated, theysecrete proinflammatory cytokines, which leads to insulinresistance in various insulin-responsive tissues (2). Indeed,Ccr2 deletion ameliorated insulin resistance in HFD-induced insulin resistance (37). Therefore, our observa-tion of increased Ccr2 expression in SVF M1 macrophagesin LysMPdk1
2/2 and CNFoxo1LysM mice was an important
cue that insulin resistance had developed. Thus, the cur-rent study directly demonstrates that ATM Foxo1 playeda pivotal role in regulating insulin sensitivity in vivo.
Nuclear accumulation of Foxo1 suddenly increased at24 weeks of HFD, although phosphorylation of Pdk1 wasnot changed. These findings suggest that another signalingpathway may be involved in subcellular localization ofFoxo1 in ATMs. One of the candidates is MST1, whichmediates oxidative stress, phosphorylates FOXO proteins ata conserved site within the forkhead domain, disrupts theirinteraction with 14–3-3 proteins, and promotes FOXO nu-clear translocation (27). Furthermore, JNK is known tophosphorylate and activate MST1 (30). HFD increased oxi-dative stress (18), leading to activation of JNK, MST1, andnuclear accumulation of Foxo1 (27). Of interest, we ob-served that H2O2 significantly increased at 24 weeks of HFDand that phosphorylation of MST1 also significantly in-creased at the same time. Therefore, oxidative stress in HFDmay contribute to nuclear accumulation and activation ofFoxo1. The findings suggest that nuclear accumulation ofFoxo1 contributes to recruitment of M1 macrophages intoadipose tissue during HFD.
Western blotting of transduced CNFoxo1 using anti-FLAG (lane 1) and anti-Foxo1 (lane 2) antibodies (right). The position of CNFoxo1 is in-dicated as A, and endogenous Foxo1 is indicated as B. F: Expression of genes Arg1, Cd163, Il10, and Mr of BMDM from the indicated genotypes.Cells were cultured for 2 days in the presence of PBS (control), insulin (100 nmol/L), or IL-4 (100 ng/mL). Values were normalized to b-actinexpression and represent the means + SEM of fold of PBS in each genotype (8–10 mice per genotype). *P < 0.001, **P < 0.005, ***P < 0.01, and****P < 0.05 (one-factor ANOVA among the indicated genotypes). WT, wild-type.
Y. KAWANO AND ASSOCIATES
diabetes.diabetesjournals.org DIABETES, VOL. 61, AUGUST 2012 1945
However, we observed that expression of D256Foxo1just partially protected against diet-induced insulin resistanceand could not rescue Ccr2 expression in mice fed an HFD for24 weeks. Furthermore, the current study demonstrates thatnuclear localization of Foxo1 started to occur at 24 weeksof HFD. Therefore, it is possible that nuclear localizationof Foxo1 plays a role specifically in the late progression of
diet-induced insulin resistance. From the current study, nu-clear accumulation of Foxo1 in ATMs is only 40–45% of allF4/80+ at 24 weeks of HFD, which means that an HFD can-not activate Foxo1 in ATMs completely. In contrast, thepercentages of nuclear Foxo1 in ATMs of LysMPdk1
2/2 andCNFoxo1
LysM fed an HFD are ;70%. Therefore, the effect ofloss of transactivation of Foxo1 on Ccr2 expression in an
FIG. 7. A transactivation-defective (D256) Foxo1 partially protected against diet-induced insulin resistance. A: Body weight (BW) of control andD256Foxo1LysM mice fed an HFD. Data are means + SEM of 20 mice in each genotype. B: IPGTT of control (open circle) and D256Foxo1LysM
(magenta circle) mice fed an HFD. Data are means + SEM of 20 mice in each genotype. C: Insulin secretion of control (open circle) andD256Foxo1LysM (magenta circle) mice during IPGTT. Data are means + SEM of 20 mice in each genotype. D and E: ITT of control (open circle) andD256Foxo1LysM (magenta circle) mice. Data are means + SEM of 20 mice in each genotype as absolute glucose values (D) and the percentagesof basal values (E). *P < 0.05 (two-way repeated-measures ANOVA with an ad hoc multiple comparison method [Fisher’s LSD test] of control vs.D256Foxo1LysM mice). F: The percentages of F4/80
+, F4/80
+CD11c
+CD206
2, and F4/80
+CD11c
2CD206
+cells within the viable SVF from 20- to 24-
week-old mice of control and D256Foxo1LysM mice. Data are means + SEM of 6 mice in each genotype analyzed in three independent experiments.G: Expression of genes in the epididymal fat of control and D256Foxo1LysM mice. Values were normalized to b-actin expression and represent themeans + SEM of 8–10 mice per genotype. *P < 0.05 (one-factor ANOVA of control vs. D256Foxo1LysM mice).
Pdk1-Foxo1-Ccr2 IN ATM
1946 DIABETES, VOL. 61, AUGUST 2012 diabetes.diabetesjournals.org

HFD is small compared with LysMPdk12/2 mice. Alterna-
tively, nuclear Foxo1 in myeloid cells may promote insulinresistance by other mechanisms than its role in the controlof Ccr2 gene expression. Furthermore, the CNFoxo1
LysM
mice fed an NCD did not exhibit insulin resistance, whileLysMPdk1
2/2 mice exhibited insulin resistance. Thesefindings suggest that Foxo1 per se is not sufficient to
cause HFD-induced insulin resistance, although Foxo1may enhance the negative effect of an HFD on insulinsensitivity.
Our results provide direct evidence for the notion thatATM cell autonomous Pdk1-Foxo1 signaling regulatesadipose tissue inflammation and insulin sensitivity in vivo.This finding may suggest a new target for pharmacological
FIG. 8. Control of ATM function by Pdk1-Foxo1 pathway. Pdk1 is regulated by not only insulin but also cytokines, including IL-4, which is secretedfrom CD4
+T cells or regulatory T cells. Furthermore, Foxo1 is regulated by not only Pdk1 but also oxidative stress through JNK and MST1.
Phosphorylation of Pdk1 gradually declined during the HFD, but oxidative stress suddenly increased at the prolonged HFD, which is consistentwith the time for the increased nuclear accumulation of Foxo1 in ATMs. Foxo1 directly regulates the expression of Ccr2, which upregulates therecruitment of macrophages in adipose tissue. PI3K, phosphatidylinositol 3-kinase.
Y. KAWANO AND ASSOCIATES
diabetes.diabetesjournals.org DIABETES, VOL. 61, AUGUST 2012 1947

intervention that could lead to novel therapeutic strategiesfor treating insulin resistance and type 2 diabetes.
ACKNOWLEDGMENTS
This work was supported by a grant from Nippon BoehringerIngelheim Co., Ltd. to H.I. and a grant from Keio UniversityGrant-in-Aid for Encouragement of Young Medical Scientiststo Y.K. No other potential conflicts of interest relevant to thisarticle were reported.
Y.K. researched data. J.N. conceived the hypothesis,designed and researched data, supervised the analyses,and wrote the manuscript. N.W., S.F., K.I., R.S., Y.H., and K.T.researched data. M.K. and T.N. generated and providedtissue-specific Pdk1 knockout mice. A.Y. provided LysMCremice and helpful discussion regarding experiments. M.O.researched data and assisted with data interpretation. H.I.supervised all experiments and assisted with preparation ofthe manuscript. J.N. is the guarantor of this work and, assuch, had full access to all the data in the study and takesresponsibility for the integrity of the data and the accuracyof the data analysis.
The authors thank Takahito Kaji (Training Department,Customer & Commercial Excellence, MSD K.K.) for analysisof data by two-way repeated-measures ANOVA.
REFERENCES
1. Qatanani M, Lazar MA. Mechanisms of obesity-associated insulin resistance:many choices on the menu. Genes Dev 2007;21:1443–1455
2. Olefsky JM, Glass CK. Macrophages, inflammation, and insulin resistance.Annu Rev Physiol 2010;72:219–246
3. Saltiel AR, Kahn CR. Insulin signalling and the regulation of glucose andlipid metabolism. Nature 2001;414:799–806
4. Welham MJ, Bone H, Levings M, et al. Insulin receptor substrate-2 is themajor 170-kDa protein phosphorylated on tyrosine in response to cyto-kines in murine lymphohemopoietic cells. J Biol Chem 1997;272:1377–1381
5. Frittitta L, Grasso G, Munguira ME, Vigneri R, Trischitta V. Insulin receptortyrosine kinase activity is reduced in monocytes from non-obese normo-glycaemic insulin-resistant subjects. Diabetologia 1993;36:1163–1167
6. Zoppini G, Galante P, Zardini M, Muggeo M. Phosphotyrosine proteinprofiles in monocytes after insulin and IGF-1 stimulation. Eur J Clin Invest1994;24:275–278
7. Liang CP, Han S, Okamoto H, et al. Increased CD36 protein as a response todefective insulin signaling in macrophages. J Clin Invest 2004;113:764–773
8. Han S, Liang CP, DeVries-Seimon T, et al. Macrophage insulin receptordeficiency increases ER stress-induced apoptosis and necrotic core for-mation in advanced atherosclerotic lesions. Cell Metab 2006;3:257–266
9. Senokuchi T, Liang CP, Seimon TA, et al. Forkhead transcription factors(FoxOs) promote apoptosis of insulin-resistant macrophages during cholesterol-induced endoplasmic reticulum stress. Diabetes 2008;57:2967–2976
10. Hashimoto N, Kido Y, Uchida T, et al. Ablation of PDK1 in pancreatic beta cellsinduces diabetes as a result of loss of beta cell mass. Nat Genet 2006;38:589–593
11. Iskandar K, Cao Y, Hayashi Y, et al. PDK-1/FoxO1 pathway in POMCneurons regulates Pomc expression and food intake. Am J Physiol Endo-crinol Metab 2010;298:E787–E798
12. Su D, Coudriet GM, Hyun Kim D, et al. FoxO1 links insulin resistance toproinflammatory cytokine IL-1beta production in macrophages. Diabetes2009;58:2624–2633
13. Fan W, Morinaga H, Kim JJ, et al. FoxO1 regulates Tlr4 inflammatorypathway signalling in macrophages. EMBO J 2010;29:4223–4236
14. Clausen BE, Burkhardt C, Reith W, Renkawitz R, Förster I. Conditional genetargeting in macrophages and granulocytes using LysMcre mice. TransgenicRes 1999;8:265–277
15. Nakae J, Cao Y, Oki M, et al. Forkhead transcription factor FoxO1 in ad-ipose tissue regulates energy storage and expenditure. Diabetes 2008;57:563–576
16. Fujisaka S, Usui I, Bukhari A, et al. Regulatory mechanisms for adiposetissue M1 and M2 macrophages in diet-induced obese mice. Diabetes 2009;58:2574–2582
17. Nakae J, Biggs WH 3rd, Kitamura T, et al. Regulation of insulin action andpancreatic beta-cell function by mutated alleles of the gene encodingforkhead transcription factor Foxo1. Nat Genet 2002;32:245–253
18. Furukawa S, Fujita T, Shimabukuro M, et al. Increased oxidative stress inobesity and its impact on metabolic syndrome. J Clin Invest 2004;114:1752–1761
19. Odegaard JI, Ricardo-Gonzalez RR, Goforth MH, et al. Macrophage-specificPPARgamma controls alternative activation and improves insulin re-sistance. Nature 2007;447:1116–1120
20. Mauer J, Chaurasia B, Plum L, et al. Myeloid cell-restricted insulin receptordeficiency protects against obesity-induced inflammation and systemicinsulin resistance. PLoS Genet 2010;6:e1000938
21. Nakae J, Kitamura T, Silver DL, Accili D. The forkhead transcription factorFoxo1 (Fkhr) confers insulin sensitivity onto glucose-6-phosphatase ex-pression. J Clin Invest 2001;108:1359–1367
22. Nakae J, Cao Y, Daitoku H, et al. The LXXLL motif of murine forkheadtranscription factor FoxO1 mediates Sirt1-dependent transcriptional ac-tivity. J Clin Invest 2006;116:2473–2483
23. Kubota N, Kubota T, Itoh S, et al. Dynamic functional relay between insulinreceptor substrate 1 and 2 in hepatic insulin signaling during fasting andfeeding. Cell Metab 2008;8:49–64
24. Nakae J, Kitamura T, Kitamura Y, Biggs WH 3rd, Arden KC, Accili D. Theforkhead transcription factor Foxo1 regulates adipocyte differentiation.Dev Cell 2003;4:119–129
25. Casamayor A, Morrice NA, Alessi DR. Phosphorylation of Ser-241 is es-sential for the activity of 3-phosphoinositide-dependent protein kinase-1:identification of five sites of phosphorylation in vivo. Biochem J 1999;342:287–292
26. Accili D, Arden KC. FoxOs at the crossroads of cellular metabolism, dif-ferentiation, and transformation. Cell 2004;117:421–426
27. Lehtinen MK, Yuan Z, Boag PR, et al. A conserved MST-FOXO signalingpathway mediates oxidative-stress responses and extends life span. Cell2006;125:987–1001
28. Choi J, Oh S, Lee D, et al. Mst1-FoxO signaling protects naïve T lympho-cytes from cellular oxidative stress in mice. PLoS ONE 2009;4:e8011
29. Yuan Z, Lehtinen MK, Merlo P, Villén J, Gygi S, Bonni A. Regulation ofneuronal cell death by MST1-FOXO1 signaling. J Biol Chem 2009;284:11285–11292
30. Bi W, Xiao L, Jia Y, et al. c-Jun N-terminal kinase enhances MST1-mediatedpro-apoptotic signaling through phosphorylation at Serine 82. J Biol Chem2010;285:6259–6264
31. Nakae J, Barr V, Accili D. Differential regulation of gene expression byinsulin and IGF-1 receptors correlates with phosphorylation of a singleamino acid residue in the forkhead transcription factor FKHR. EMBOJ 2000;19:989–996
32. Murano I, Barbatelli G, Parisani V, et al. Dead adipocytes, detected ascrown-like structures, are prevalent in visceral fat depots of geneticallyobese mice. J Lipid Res 2008;49:1562–1568
33. Sauter NS, Schulthess FT, Galasso R, Castellani LW, Maedler K. The anti-inflammatory cytokine interleukin-1 receptor antagonist protects from high-fat diet-induced hyperglycemia. Endocrinology 2008;149:2208–2218
34. Naito M. Macrophage differentiation and function in health and disease.Pathol Int 2008;58:143–155
35. Hanisch UK, Kettenmann H. Microglia: active sensor and versatile effec-tor cells in the normal and pathologic brain. Nat Neurosci 2007;10:1387–1394
36. Weisberg SP, McCann D, Desai M, Rosenbaum M, Leibel RL, Ferrante AWJr. Obesity is associated with macrophage accumulation in adipose tissue.J Clin Invest 2003;112:1796–1808
37. Weisberg SP, Hunter D, Huber R, et al. CCR2 modulates inflammatoryand metabolic effects of high-fat feeding. J Clin Invest 2006;116:115–124
Pdk1-Foxo1-Ccr2 IN ATM
1948 DIABETES, VOL. 61, AUGUST 2012 diabetes.diabetesjournals.org