Organisational Structure as Barrier or Support in the ...242303/FULLTEXT01.pdfOrganisational...
45
Organisational Structure as Barrier or Support in the Personal Social Services? – Results From a Client Survey Paper presented at: Dilemmas for Human Services 2009, the 13th International Research Conference “Breaking Down the Barriers”, Staffordshire University, 10 - 11 September 2009 (revised version October 2009) Björn Blom Professor in Social Work [email protected] Marek Perlinski Lecturer/Doctoral student [email protected] Stefan Morén Professor in Social Work [email protected] Department of Social Work Umeå University Sweden
Transcript of Organisational Structure as Barrier or Support in the ...242303/FULLTEXT01.pdfOrganisational...
Organisational Structure as Barrier or Support in the Personal
Social Services? – Results From a Client Survey
Paper presented at:
Dilemmas for Human Services 2009, the 13th International Research Conference
“Breaking Down the Barriers”, Staffordshire University, 10 - 11 September 2009
(revised version October 2009)
Björn Blom
Professor in Social Work
Marek Perlinski
Lecturer/Doctoral student
Stefan Morén
Professor in Social Work
Department of Social Work
Umeå University
Sweden

Preface
This paper is a slightly revised version of a paper presented at Dilemmas for Human Services
2009, the 13th International Research Conference “Breaking Down the Barriers”,
Staffordshire University, 10 - 11 September 2009. The changes mostly consist of a number of
additions. The section Not like an average Swede is almost completely rewritten, and
Additional remarks at the end of the paper is all new. A number of minor corrections are also
made.
We want to express our gratitude to a number of persons that made this study possible. First
of all, the participating clients that took time to answer our (probably much too extensive)
questionnaire. And many thanks to the social workers, and the six project assistants that
helped us distribute a lot of the questionnaires. Naturally we are grateful towards the
responsible politicians and managers that gave us their permission to carry out the study in
their respective municipality/PSS-organisation. We also want to thank Minna Lundgren, who
previously worked within our research project, for her valuable work with earlier parts that
this study partly rests upon. We are also greatly indebted to Jonas Karlberg expert on
municipal economy at the Centre for Regional Science (CERUM), Umeå University. With a
very short notice, he helped us interpret the economical key figures for the participating
organisations. We also highly appreciate that Staffan Näslund, PSS-manager in Skellefteå,
and Anders Hanberger associate professor in political Science at Umeå University, read and
commented on the paper.
This study is one of several within a bigger research project named Specialization or
integration in the Personal social services? Effects on interventions and results.
Through this paper (which can be downloaded as a PDF) almost all results from the client
study are freely accessible for a wider audience. The project is funded by the Swedish council
for working life and social research (FAS). We hereby show appreciation to the council for
the support that made the project viable.
Björn Blom, Marek Perlinski and Stefan Morén
Umeå, October 2009
1
Introduction
In Sweden and in many other countries, a strong tendency within social work is to divide the
personal social services (PSS) into specialised units and functions. This tendency is especially
clear in larger municipalities (Bergmark & Lundström, 1998; Doel, 1997; Lundgren, Blom,
Morén & Perlinski, 2009). Common motives are political demands for renewal and increased
efficiency. However, simultaneously there is a need for a holistic view of client work, and a
range of recent textbooks argue for a generalist social work practice (e.g. Miley, O'Melia &
DuBois, 2009; Scales & Wolfer, 2005; Timberlake, Zajicek Farber & Sabatino, 2007; Walsh,
2008; Yanca & Johnson, 2007). In Sweden, there is even a goal in the Higher Education Act
that stipulates that students who complete social work education should achieve a holistic
view of man.1
Obviously, there is a field of tension between predominant organisational models on the one
hand, and the inherent logic of client work on the other. This delicate matter faces us with the
question: What form should the personal social services organisation take, to best meet
clients’ needs? Within the context of the conference, where this paper was presented, the
question is somewhat rephrased: Does it depend on the type of organisation, whether
organisational structure is a barrier or support for clients in the personal social services?
In this paper we try to answer this question in two ways. Firstly by displaying a review of
contemporary research on social work within different forms of organisations, and secondly,
by presenting our survey of clients within PSS in three Swedish municipalities.
The study reported in this paper is part of a larger research project with the aim of describing
and analysing how specialised respectively integrated forms of organisation in the social
services condition social workers‟ interventions and client effects (outcomes).2 The project
was carried out in three Swedish municipalities with different organisational models. Two of
those represent “extremes” as they have pure specialised (problem-divided) respectively
integrated (generic) organisations. The third municipality have chosen a middle way with an
organisation that combines aspects of the two other models. One of the studies within the
project focused on clients‟ opinions on interventions and results, and how they are
conditioned by different organisational structures. This paper presents results from that study.
The paper is structured into the following sections:
• different forms of specialisation and integration
• brief presentation of the Swedish context
• research review
• description of material and method
• results from the client survey
• conclusions and discussion
Appendix
• comparison of economical key figures
• additional remarks
1 The Swedish Higher Education Act, appendix 2, SFS 1993:100, latest revision 2008:944
2 The title of the main project is “Specialization or integration in the Personal social services? Effects on
interventions and results”, and is funded by the Swedish council for working life and social research (FAS).
2
Different forms of specialisation and integration3
In this section we describe different forms of integration and specialisation within the
personal social services in Sweden. In the research literature there are several examples of
how to define specialisation. In this study we have used a definition by Doel (1997), where a
sixth category has been added by Blom (2004) to better fit the Swedish context.
The definition we have used includes six different types of specialisation of social work:
1 Field: hospital, school, etc.
2 Setting: field social work, residential work, etc.
3 Age: children, families, or adult services, etc.
4 Problem: Mental health, alcohol abuse, etc.
5 Methods: Task-centred approach, cognitive therapy, etc.
6 Function/Task: assessment vs. intervention; service vs. treatment
All these forms of specialisation exist in Sweden, though types 3, 4 and type 6 are the main
focus of this paper. A suitable attendant question is what genericism (or generalism) is in
social work then? Despite the great number of textbooks on generalist practice in social work,
there is no agreement on the definition of genericism or generalist practice. In the literature,
generalist practice is said to be almost everything from multi-methods and multilevel (macro,
mezzo, micro) approaches; working with all or most client groups; to having a number of
roles and an eclectic choice of theory base. In this study we regard genericism as what is
carried out within integrated personal social services. That is, an organisation where social
workers – often in several geographical areas/districts – work with all (or almost all) types of
social problems, groups of people and aspects of the work with clients (cp. figure 1 below).
Based on a preceding empirical study (Lundgren, Blom, Morén & Perlinski, 2009) within the
research project, we present five pure examples of how the personal social services can be
organised in Sweden. For the sake of clarity we want to point out that each model exists in a
number of variants around the country.
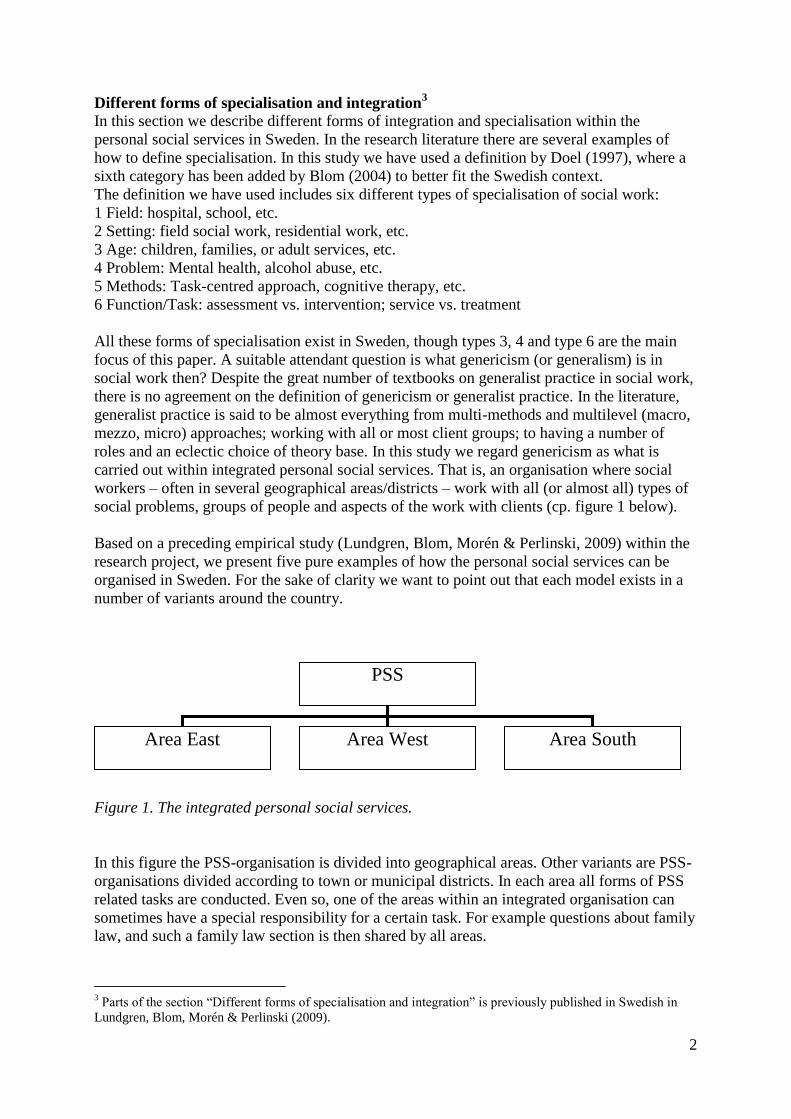
Figure 1. The integrated personal social services.
In this figure the PSS-organisation is divided into geographical areas. Other variants are PSS-
organisations divided according to town or municipal districts. In each area all forms of PSS
related tasks are conducted. Even so, one of the areas within an integrated organisation can
sometimes have a special responsibility for a certain task. For example questions about family
law, and such a family law section is then shared by all areas.
3 Parts of the section “Different forms of specialisation and integration” is previously published in Swedish in
Lundgren, Blom, Morén & Perlinski (2009).
PSS
Area East Area West Area South
3
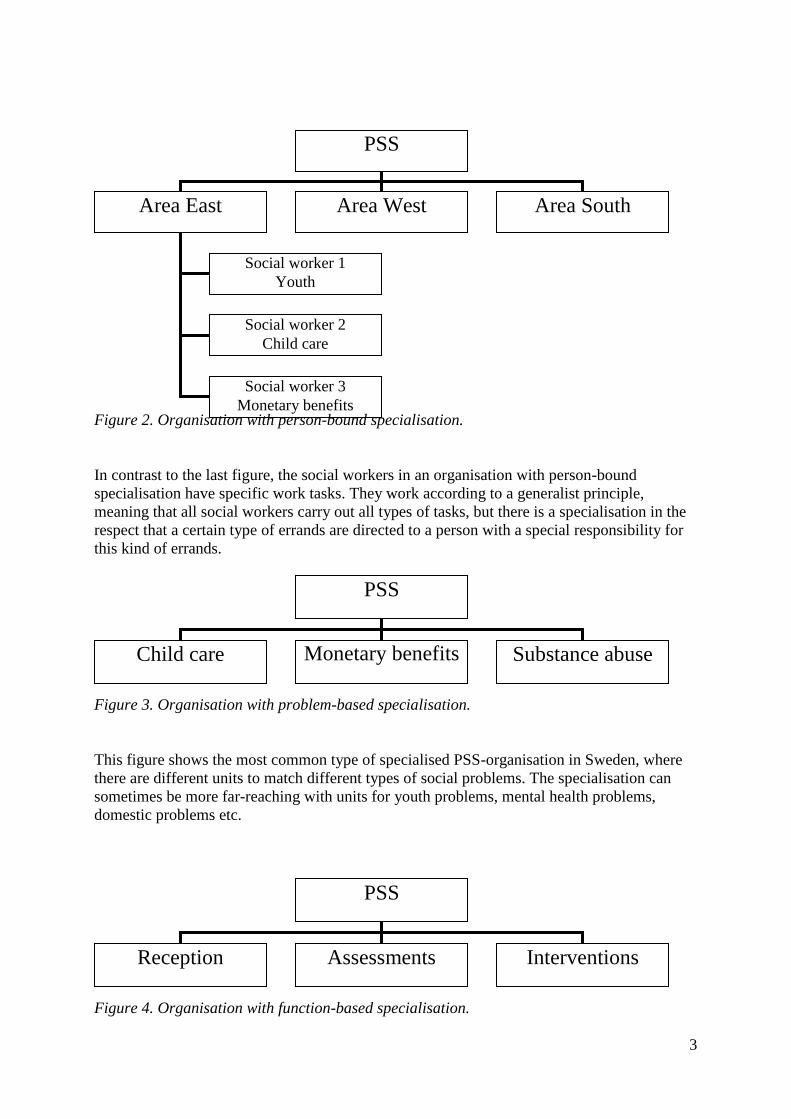
Figure 2. Organisation with person-bound specialisation.
In contrast to the last figure, the social workers in an organisation with person-bound
specialisation have specific work tasks. They work according to a generalist principle,
meaning that all social workers carry out all types of tasks, but there is a specialisation in the
respect that a certain type of errands are directed to a person with a special responsibility for
this kind of errands.
Figure 3. Organisation with problem-based specialisation.
This figure shows the most common type of specialised PSS-organisation in Sweden, where
there are different units to match different types of social problems. The specialisation can
sometimes be more far-reaching with units for youth problems, mental health problems,
domestic problems etc.
Figure 4. Organisation with function-based specialisation.
PSS
Area East Area West Area South
Social worker 1
Youth
Social worker 2
Child care
Social worker 3
Monetary benefits
PSS
Child care Monetary benefits
Substance abuse
PSS
Reception Assessments Interventions
4
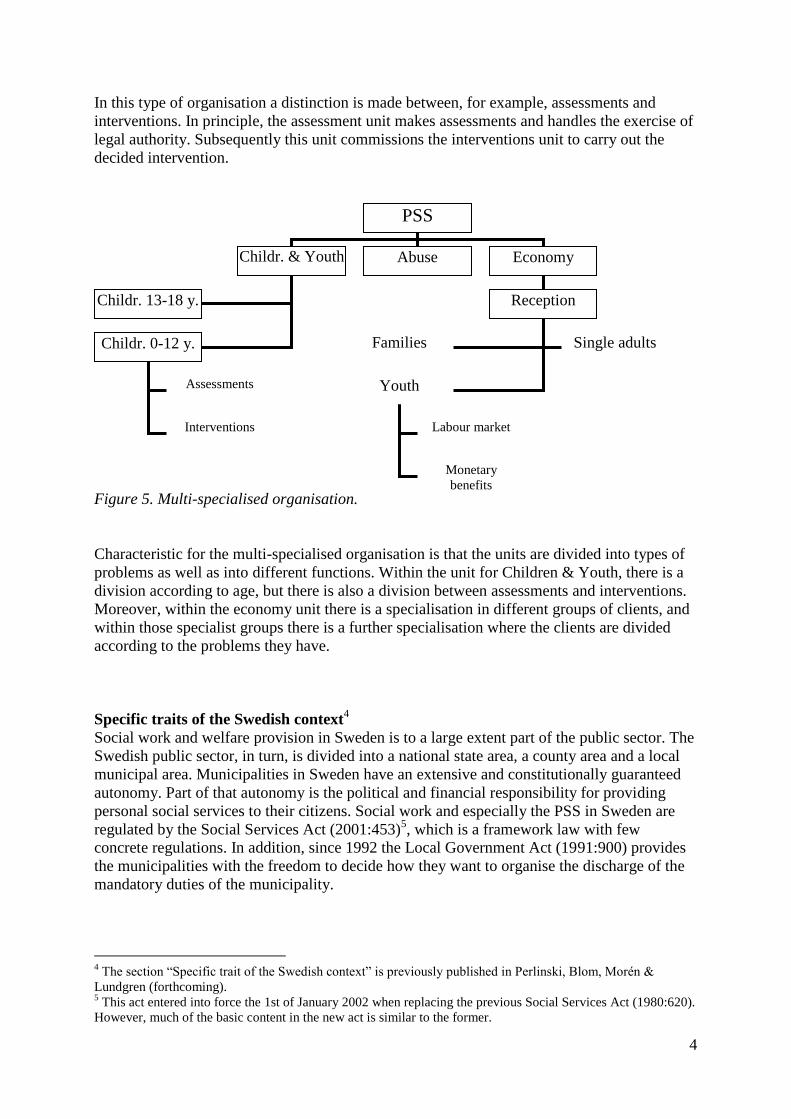
In this type of organisation a distinction is made between, for example, assessments and
interventions. In principle, the assessment unit makes assessments and handles the exercise of
legal authority. Subsequently this unit commissions the interventions unit to carry out the
decided intervention.
Figure 5. Multi-specialised organisation.
Characteristic for the multi-specialised organisation is that the units are divided into types of
problems as well as into different functions. Within the unit for Children & Youth, there is a
division according to age, but there is also a division between assessments and interventions.
Moreover, within the economy unit there is a specialisation in different groups of clients, and
within those specialist groups there is a further specialisation where the clients are divided
according to the problems they have.
Specific traits of the Swedish context4
Social work and welfare provision in Sweden is to a large extent part of the public sector. The
Swedish public sector, in turn, is divided into a national state area, a county area and a local
municipal area. Municipalities in Sweden have an extensive and constitutionally guaranteed
autonomy. Part of that autonomy is the political and financial responsibility for providing
personal social services to their citizens. Social work and especially the PSS in Sweden are
regulated by the Social Services Act (2001:453)5, which is a framework law with few
concrete regulations. In addition, since 1992 the Local Government Act (1991:900) provides
the municipalities with the freedom to decide how they want to organise the discharge of the
mandatory duties of the municipality.
4 The section “Specific trait of the Swedish context” is previously published in Perlinski, Blom, Morén &
Lundgren (forthcoming). 5 This act entered into force the 1st of January 2002 when replacing the previous Social Services Act (1980:620).
However, much of the basic content in the new act is similar to the former.
PSS
Childr. & Youth
Abuse Economy
Childr. 13-18 y.
Childr. 0-12 y.
Assessments
Interventions
Reception
Families Single adults
Youth
Labour market
Monetary
benefits
5
Consequently, there is a large degree of variation in the 290 Swedish municipalities‟ political
and organisational models for PSS. However, all these models have certain features in
common: they all consist of a political part which sets goals and decides budgets, an
administrative and executive managerial part, and a professional part that works directly with
clients. The locally elected political parties that govern the municipality designate the
members of the social welfare committee. As Sweden does not have family courts, the social
welfare committee also (in some instances) makes decisions in specific cases such as
restrictions on parental rights regarding the care of children. The professional part may be
organised in a wide range of ways. However, in the last two decades there has been a clear
trend of abandoning integrated/generic models and instead embracing specialisation – a
movement which in fact echoes the past.
Until the 1960s, social workers in Sweden focused on symptoms and specialised in different
fields: childcare, care for drug abusers and monetary benefits. Each of those fields also had
separate legislations. During the 1960s and 1970s, a holistic idea was introduced, and the
different fields were merged into more integrated and homogenous organisational forms. This
integration of the three areas implied that all social workers were expected to handle all kinds
of problems and types of tasks. Consequently, the range of the social workers‟ responsibility
was significantly expanded. Gradually, this idea of a holistic view and integrated
organisations was questioned and criticised, primarily due to professional strivings and new
influences in the field of organisation. From the 1980s, that is, by the time the new and
integrated Social Services act was introduced, we have once more witnessed an increasing
division into different functions, where individual social workers handle a relatively delimited
part of the work task.
Today, the clearly predominant organisational form is some kind of specialisation, and often
problem specialisation, which implies, for example a division between units working with
different problems (e.g. drug abuse, monetary benefits, unemployment) or categories of
clients (e.g. children, youngsters, immigrants). Nevertheless, specialisation is sometimes
mixed with elements of a generic organisation. In 1989 around 51 percent of Swedish
municipalities had some form of specialised PSS, but in 2007 the number has increased to 93
percent (Lundgren, Blom, Morén & Perlinski, 2009). Accordingly, the generic/integrated
organisation is an “endangered species” that survives mainly in small municipalities.
However, this convergence in the organisational forms of PSS is contrary to what was pointed
out in preparatory work for the former Social Services Act from 1980, where integrated social
work that was free from unnecessary boundaries and the division of functions was advocated.
Hence, the tension between basic ideas in client work and existing organisational models is
still present.
Research review In this part we present a review of research on the specialisation of the Personal Social
Services (PSS).6 The focus on specialisation in this review is considered adequate due to the
6 Parts of the section “Research review” are previously published in Perlinski, Blom, Morén & Lundgren
(forthcoming). The research review was conducted in the following data bases: Academic Search Elite, Applied
Social Sciences Index, Social services abstract, Sociological abstracts, PAIS, Web of science, ERIC and Google
Scholar and the Swedish databases LIBRIS and Artikelsök. The following search terms were used in different
combinations: personal social service, organisation, integrated social service, specialised social service,
6
fact that almost every PSS-organisation in Sweden is specialised, in the sense that they are
divided into units that work with certain problems or groups of clients.
Consequences for the work with clients
There are few empirical studies that unambiguously support specialisation, irrespective of
whether they focus on the PSS or other parts of the social services. A typical conclusion is
that specialised organisations (cp. figure 2-5 above) imply that clients meet with a higher
level of expertise, but this has to be balanced against the fact that specialisation has made it
more difficult/complex for the clients, as they often must have contact with several units and
professionals (Bergmark & Lundström, 2005, 2007). Results from Skogens‟ (2001) study also
point in two directions. It shows that social workers in specialised organisations develop a
more strict assessment with a greater stress on rules and formal demands, whereas social
workers in integrated organisations are more inclined to include caring aspects in their
assessment for monetary benefit. Another study in the same genre, Minas (2005), concludes
that specialised intake-units offer persons who apply for monetary benefits improved
possibilities to find alternative solutions. Simultaneously, such units make so-called ”in
advance assessments” more often, and do this without a face-to-face meeting with the
applicant, which leads to a quicker rate of exclusion or removal from the system. Specialised
intake-units hence function as doorkeepers, which makes it more difficult for applicants to get
into the system and become a client. Consequently, applicants develop different strategies in
order to enter the system.
Cambridge and Parkes (2006) also identified advantages as well as disadvantages in a study
of specialist adult protection co-ordinators (APC), as opposed to mainstream adult protection
competence (through care management). Some of the advantages are: the retainment of
specialist knowledge, gains in objectivity from separating investigations from intervention,
focused help with managing high adult protection caseloads; having someone who can work
with networking between agencies and professionals. Some of the disadvantages are: the
potential de-skilling of managers and practitioners, the blurring of accountability and unclear
authority to delegate, the possible polarisation of responsibilities between residential and
community casework.
Even though there are several studies that present results that point in two directions, there are
studies, e.g. on services for the elderly and of home care workers, that provides comparatively
stronger support for specialisation. Fuller and Tulle-Winton (1996) report that specialisation
was most effective during the assessment and planning stages, while generalisation was most
suitable during the implementation of the services. Astvik and Aronsson (1999) show that
client specialisation in combination with a generalist competence in tasks, provides the best
balance between working conditions and care quality. Yet another study shows that older
Pakistani service users expressed preferences for specialist services (Bowes & Dar, 2000).
In contrast, there are studies that mainly show negative consequences of the specialisation of
the personal social services. There are several studies of organisations with a division between
social workers who are responsible for making assessments (who have the formal
responsibility for cases) and the social workers who carry out interventions (services,
treatments, placements etc.). As a result of such a division, the social workers that are
integration, specialisation, social work, generic social work. Similar terms were used in Swedish. We have also
searched through Swedish doctoral dissertations and research reports in social work.
7
responsible for assessments often lack the necessary knowledge about the clients, and could
not accomplish the work task satisfactorily; knowledge about the extent and character of
problems becomes fragmentary. Specialisation also often implies difficulties in collaborating
within the PSS as well as with external professionals and agencies. As a consequence, clients
face the risk of falling between two stools, i.e., between different functions in such an
organisation (Blom, 1998, 2004; Börjeson & Håkansson, 1990; Danermark & Kullberg;
1999).
A significant theme within research on PSS-organisations concerns how the relationship
between the social workers and clients is influenced by specialisation. The reasons for this
concern seem to be convincing on a theoretical level (Blom, 2002; Blom & Morén
2009/fortcoming, Morén, 1994a) as well as on empirical level. Several studies about human
change, for example, in social work and psychotherapy, demonstrate that in order to succeed
therapists and social workers need to create a relationship of trust, genuineness, caring,
acceptance, empathy and commitment with the care receiver, and moreover employ clear and
explicit procedures (Howe, 1987; Frank and Frank, 1991; Kristiansen, 1999;). In fact,
according to Hubble, Duncan and Miller‟s (1999) summary of 40 years of research in
psychotherapy, some of the most important factors for change are relationship factors. These
relationship factors are estimated to explain approximately 30 percent of the change.
As we understand it, research on PSS-organisations‟ influence on the social worker-client
relationship can be divided into four groups: 1) it is not possible to establish close and
personal relationships within the integrated PSS, 2) specialisation can influence relationships
in a positive way, 3) specialisation can influence relationships in a negative way, 4) it is
possible to establish close and personal relationships within the integrated PSS. Below we
present significant examples of each category.
There are numerous reports that show complications in carrying out successful social work
within the forms of organisation that are associated with personal social services. Criticism
has, among other things, been directed to the social service‟s failure to treat clients in a
satisfactory way. The administrative tradition of how to handle clients and the legal potential,
and sometimes the duty, to perform coercive measures, makes it problematic to create close
and personal relationships with clients, and contribute to change (e.g. Billquist, 1999; Cohen,
1998; Morén, 1944b; Pettersson, 1986; Sunesson, 1985, 1990). Several authors come to the
conclusion that it is not possible to carry out social work successfully within a generalist PSS-
organisation (cp. figure 1 above). Consequently, the assessment/exercise of public authority
has to be detached from treatment/supportive social work (Lorentzon, 1991; Wächter, 1998).
There are also studies that have highlighted positive relationships between social workers and
clients, when the specialisation implies that the social workers only work with support and
treatment (e.g. Blom & Morén, 2007; Bernler, Johnsson & Skårner, 1993).
However, Söderfeldt (1997) provides evidence that shows that specialisation is correlated
with the dissociation of social worker and client within the personal social services. Social
workers with more specialised work tasks face an increased risk of dissociating themselves
from their clients. Those at most risks are social workers that deal solely with monetary
benefits. Likewise, Froggett (1996) writes that the instrumentalisation of social work might be
destructive both to those who work in such organisations and to their clients because
instrumentalisation threatens the inter-subjective sense making. A common feature of
specialised organisations is that the clients often have to meet several specialists who work
within different delimited functions. Studies that focus on the clients‟ perspectives show that
8
clients want a key-person that maintains the relationship between different functions within
the social services. When many social workers become involved, clients experience that the
situation is muddled, and that there is a lack of personal interest. According to clients, it is of
utmost importance to meet social workers who are committed in a personal way (Boklund,
1995; Howe, 1987).
Furthermore, there are studies that show that it is feasible to successfully combine support and
treatment with statutory assessments within the personal social services (Bernler et al., 1993,
Blom & Morén, 2007, Morén & Blom, 2003). According to these studies, it is possible to
establish good conditions for treatment, i.e. close, positive and durable relationships within
the personal social services, even if social workers handle several aspects of the work task
such as statutory assessment and treatment. Similar findings can be found in a larger research
project, which this study is a part of. Within the main project we compare three different PSS
organisations (specialised, integrated and combined). A previous study, where we studied the
social workers‟ activities (Morén, Blom, Lundgren & Perlinski, forthcoming), revealed that
different organisational models lead to significant consequences for the work with clients. In
the specialised and the combined organisations clients meet several social workers in different
units (e.g. due to a separation between statutory assessments and treatment) that in different
ways try to collaborate with one another and to synchronise their interventions with the
purpose of achieving a holistic view and coherent help. In the integrated organisation the
clients meet one or two social workers with a clearly defined responsibility that handles
almost all kinds of tasks (including statutory assessments and treatment). When necessary
they create temporary teams of colleagues within the PSS with peak competences in order to
fulfil the client‟s needs. The integrated PSS is quite successful in achieving a holistic view on
the client‟s situation and offering help that is coherent. It is somewhat more difficult in the
combined organisation and considerably more difficult in the specialised organisation. The
study also reveals that clients participate to a greater extent in their own process of change in
the integrated and the combined organisations compared to the specialised.
Our review hence demonstrates that different organisational models can be advantageous in
some respects, but not in other. The focus of our interest is organisational consequences for
work with clients within the PSS, and even on this point there is a split in the previous
research. There are results that speak for as well as against specialisation and integration. One
reason for the lack of clarity in the research is probably that the research object is ambiguous
– there are several types of specialised organisations, and the content of social work can vary
significantly. Moreover, different aspects have been studied in different ways. It is therefore
difficult to make direct comparisons between different studies. In summary, we note that the
development towards the specialisation of the PSS is unambiguous in Sweden, but that the
effects are quite ambiguous. Thus, the initially posed research question (Does it depend on the
type of organisation, whether organisational structure is a barrier or support for clients in
the personal social services?) is not sufficiently answered by this review. Obviously there is a
need for more research about clients‟ experiences and attitudes within this area. This unclear
state of research presents a starting-point for our study of clients in the personal social
services, which is presented in the following sections.
9
Material and method
Setting
The study was conducted in three Swedish municipalities with different organisational models
within the personal social services: 1) specialised organisation, 2) integrated organisation, and
3) a “combined” organisation with a mix between integration and specialisation.
The specialised organisation is divided into four problem areas: Youth and Adult support,
Monetary benefits, Children and family support and Social psychiatric support. Within those
areas there is also a certain division according to age (children, youth, adult) and division in
functions as reception, assessments and interventions. In the integrated organisation there is
no formal organisational division at all, consequently every social worker has to work with all
kinds of work tasks. However, in practice a certain degree of individually based specialisation
has evolved. In the combined or mixed organisation there is basically a function-based
specialisation, inasmuch as there is a division between reception and assessments on the one
side, and advice and resources (treatment) on the other side. There are also a certain division
into age and problems within those units. At the same time it is explicitly stated that this
organisation should have a holistic view on the clients‟ need, and as a way to assure this, there
is a special function named “the dialogue”. This is a forum where social workers from the
reception/assessments unit respectively the advice/resources unit must meet as a way to
achieve holism in individual cases.
These PSS-organisations were chosen as they represent highly significant examples in each
category. The sampling was based on a former study where we had mapped all 290 PSS-
organisations in Sweden (Lundgren, Blom, Morén & Perlinski, 2009). Together, these three
organisations represent the present most common ways to organise social work within the
personal social services in Sweden.
Participants, sampling and data collection
The tool for data collection was a questionnaire comprising 94 items/questions with fixed
answers, scales and possibility of long free text answers up to 450 typographical points. The
questionnaire was designed in such a way that it worked both as an Internet based on-line
survey saving data directly on a server and as a traditional printed survey questionnaire. Both
variants were almost identical. The paper version could be described as a series of “frozen”
computer-screen pictures.
It‟s common knowledge among social workers and researchers that studying clients is
notoriously difficult. Clients have little interest in participating in research and it takes a lot of
resources to get a sample large enough to be meaningful to analyse. We have used three non-
random (non probability) sampling procedures, mostly convenience sample (or accidental
sampling) with traits of judgement sample.
The first procedure comprised research assistants approaching clients leaving the PSS-office
and asking the clients to spend some time in front of a computer answering an on-line survey.
The research assistants were ready to help the clients in handling both the computer and
eventual difficulties in understanding the survey questionnaire. This procedure met rather
large reluctance from the clients and generated only 27 answers (14 percent of the answers in
the final sample of 191 clients).
10
The second step was to ask social workers to distribute the questionnaire (with stamped
envelopes) to their clients. Social workers stressed that participation was completely
voluntary and anonymous, that the research was completely independent of the social services
organization in the parish and that there is no way to check if the client responded to the
survey or not. This procedure was somewhat more successful and generated 100 answers (52
percent of the answers in the final sample).
Third sampling procedure comprised asking PSS-organisations to sample about 200 of their
clients, if possible representing all the different categories of errands. The exact details of
sampling were left to the judgement of each of the PSS-organisation. Survey questionnaire
with a stamped envelope was then posted to clients in question. In total we posted 600 letters
with questionnaires and stamped envelopes for returning post. The response frequency for this
procedure was also rather low (11 percent), partly depending on the fact that PSS-offices
sometimes did not have their client‟s factual addresses (interesting indeed). Only 64 clients
answered the survey, which accounts for 34 percent of the final sample.
All the answers to the “paper version” of the survey were typed in manually into the on-line
version of the questionnaire. In that way a common data matrix for all survey data was
created.
Analysis
The processing of data has so far been restricted to univariate and bivariate analysis. The
bivariate analysis was made as cross tabulations using type of PSS-organisation as an
independent variable. Despite the fact that significance testing using Chi2 is a violation of
assumptions (because of the non-random sample) we used such testing in a heuristic way.
11
Results from a client survey In this part of the paper we present the results from our client survey. The section starts with a
description of background data about the participating group of clients. Subsequently we
display a number of results about the interventions and the encounter/treatment that the clients
received. Finally we present results about the client effects achieved in the three
organisations.
Characteristics of the sample of clients
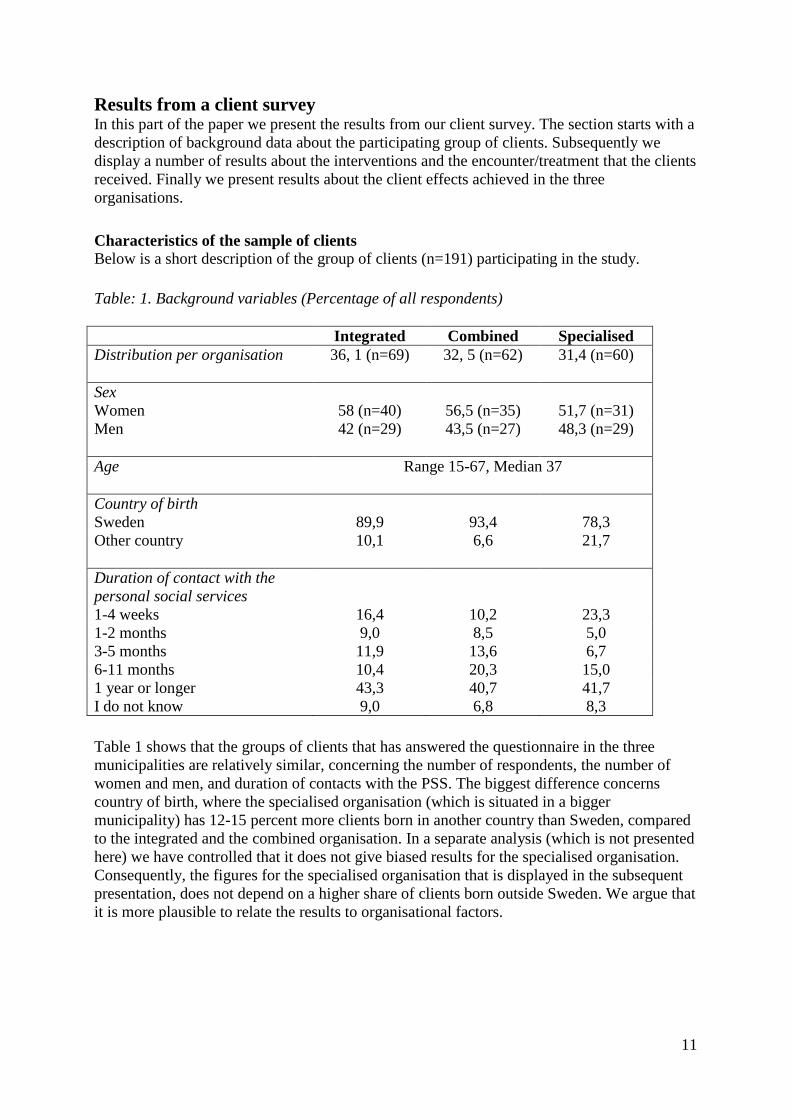
Below is a short description of the group of clients (n=191) participating in the study.
Table: 1. Background variables (Percentage of all respondents)
Integrated Combined Specialised
Distribution per organisation
36, 1 (n=69) 32, 5 (n=62) 31,4 (n=60)
Sex
Women
58 (n=40)
56,5 (n=35)
51,7 (n=31)
Men
42 (n=29) 43,5 (n=27) 48,3 (n=29)
Age
Range 15-67, Median 37
Country of birth
Sweden
89,9
93,4
78,3
Other country
10,1 6,6 21,7
Duration of contact with the
personal social services
1-4 weeks 16,4 10,2 23,3
1-2 months 9,0 8,5 5,0
3-5 months 11,9 13,6 6,7
6-11 months 10,4 20,3 15,0
1 year or longer 43,3 40,7 41,7
I do not know 9,0 6,8 8,3
Table 1 shows that the groups of clients that has answered the questionnaire in the three
municipalities are relatively similar, concerning the number of respondents, the number of
women and men, and duration of contacts with the PSS. The biggest difference concerns
country of birth, where the specialised organisation (which is situated in a bigger
municipality) has 12-15 percent more clients born in another country than Sweden, compared
to the integrated and the combined organisation. In a separate analysis (which is not presented
here) we have controlled that it does not give biased results for the specialised organisation.
Consequently, the figures for the specialised organisation that is displayed in the subsequent
presentation, does not depend on a higher share of clients born outside Sweden. We argue that
it is more plausible to relate the results to organisational factors.
12
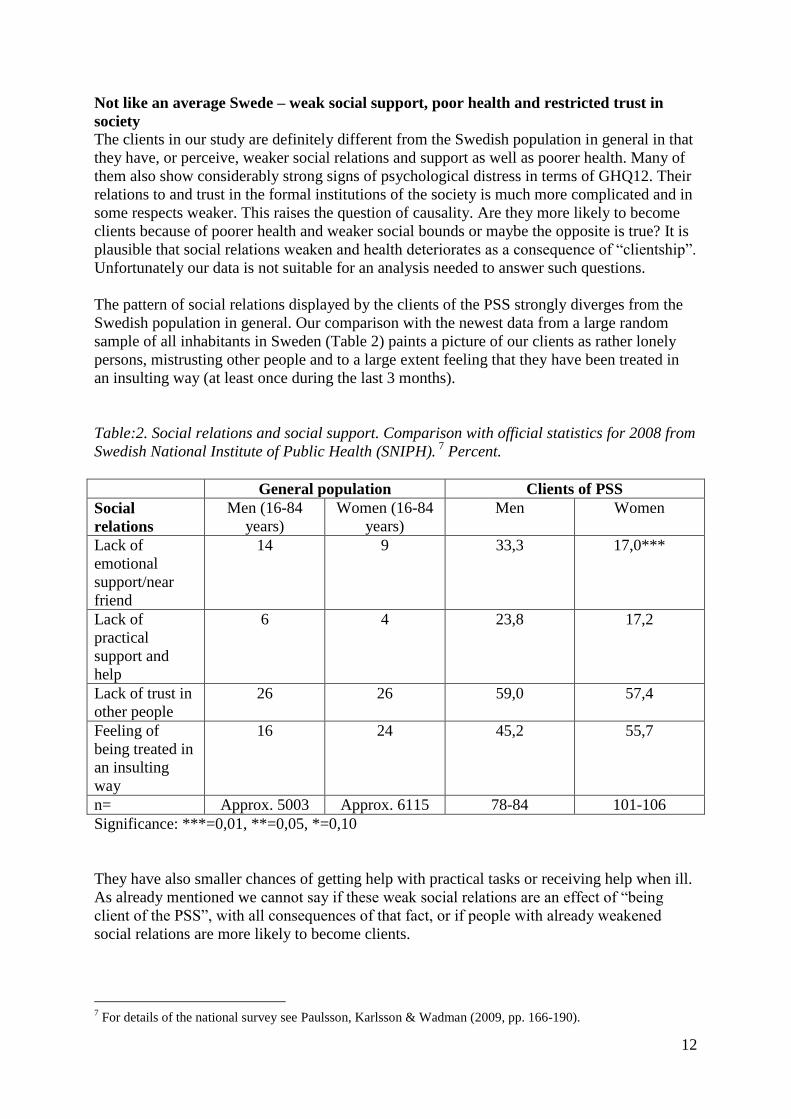
Not like an average Swede – weak social support, poor health and restricted trust in
society
The clients in our study are definitely different from the Swedish population in general in that
they have, or perceive, weaker social relations and support as well as poorer health. Many of
them also show considerably strong signs of psychological distress in terms of GHQ12. Their
relations to and trust in the formal institutions of the society is much more complicated and in
some respects weaker. This raises the question of causality. Are they more likely to become
clients because of poorer health and weaker social bounds or maybe the opposite is true? It is
plausible that social relations weaken and health deteriorates as a consequence of “clientship”.
Unfortunately our data is not suitable for an analysis needed to answer such questions.
The pattern of social relations displayed by the clients of the PSS strongly diverges from the
Swedish population in general. Our comparison with the newest data from a large random
sample of all inhabitants in Sweden (Table 2) paints a picture of our clients as rather lonely
persons, mistrusting other people and to a large extent feeling that they have been treated in
an insulting way (at least once during the last 3 months).
Table:2. Social relations and social support. Comparison with official statistics for 2008 from
Swedish National Institute of Public Health (SNIPH). 7
Percent.
General population Clients of PSS
Social
relations
Men (16-84
years)
Women (16-84
years)
Men Women
Lack of
emotional
support/near
friend
14 9 33,3 17,0***
Lack of
practical
support and
help
6 4 23,8 17,2
Lack of trust in
other people
26 26 59,0 57,4
Feeling of
being treated in
an insulting
way
16 24 45,2 55,7
n= Approx. 5003 Approx. 6115 78-84 101-106
Significance: ***=0,01, **=0,05, *=0,10
They have also smaller chances of getting help with practical tasks or receiving help when ill.
As already mentioned we cannot say if these weak social relations are an effect of “being
client of the PSS”, with all consequences of that fact, or if people with already weakened
social relations are more likely to become clients.
7 For details of the national survey see Paulsson, Karlsson & Wadman (2009, pp. 166-190).
13
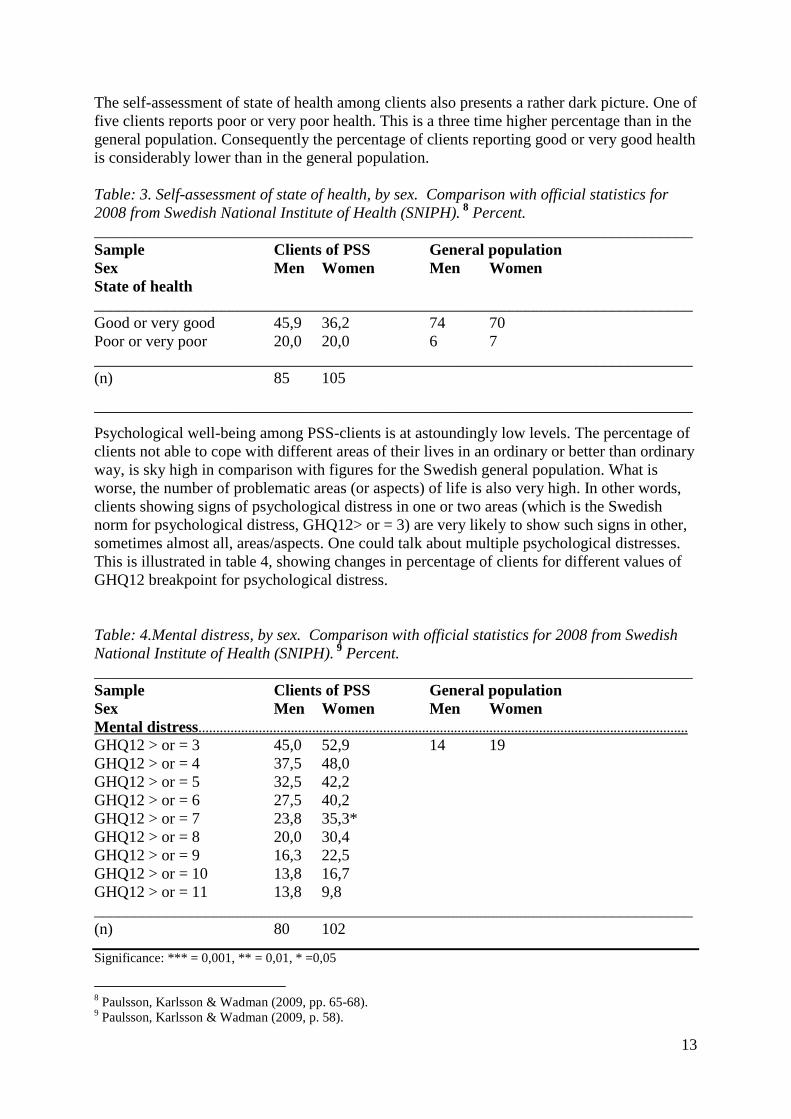
The self-assessment of state of health among clients also presents a rather dark picture. One of
five clients reports poor or very poor health. This is a three time higher percentage than in the
general population. Consequently the percentage of clients reporting good or very good health
is considerably lower than in the general population.
Table: 3. Self-assessment of state of health, by sex. Comparison with official statistics for
2008 from Swedish National Institute of Health (SNIPH). 8
Percent.
___________________________________________________________________________
Sample Clients of PSS General population
Sex Men Women Men Women
State of health
___________________________________________________________________________
Good or very good 45,9 36,2 74 70
Poor or very poor 20,0 20,0 6 7
___________________________________________________________________________
(n) 85 105
___________________________________________________________________________
Psychological well-being among PSS-clients is at astoundingly low levels. The percentage of
clients not able to cope with different areas of their lives in an ordinary or better than ordinary
way, is sky high in comparison with figures for the Swedish general population. What is
worse, the number of problematic areas (or aspects) of life is also very high. In other words,
clients showing signs of psychological distress in one or two areas (which is the Swedish
norm for psychological distress, GHQ12> or = 3) are very likely to show such signs in other,
sometimes almost all, areas/aspects. One could talk about multiple psychological distresses.
This is illustrated in table 4, showing changes in percentage of clients for different values of
GHQ12 breakpoint for psychological distress.
Table: 4.Mental distress, by sex. Comparison with official statistics for 2008 from Swedish
National Institute of Health (SNIPH). 9
Percent.
___________________________________________________________________________
Sample Clients of PSS General population
Sex Men Women Men Women
Mental distress…………………………………………………………………………………………………………………………
GHQ12 > or = 3 45,0 52,9 14 19
GHQ12 > or = 4 37,5 48,0
GHQ12 > or = 5 32,5 42,2
GHQ12 > or = 6 27,5 40,2
GHQ12 > or = 7 23,8 35,3*
GHQ12 > or = 8 20,0 30,4
GHQ12 > or = 9 16,3 22,5
GHQ12 > or = 10 13,8 16,7
GHQ12 > or = 11 13,8 9,8
___________________________________________________________________________
(n) 80 102
Significance: *** = 0,001, ** = 0,01, * =0,05
8 Paulsson, Karlsson & Wadman (2009, pp. 65-68).
9 Paulsson, Karlsson & Wadman (2009, p. 58).
14
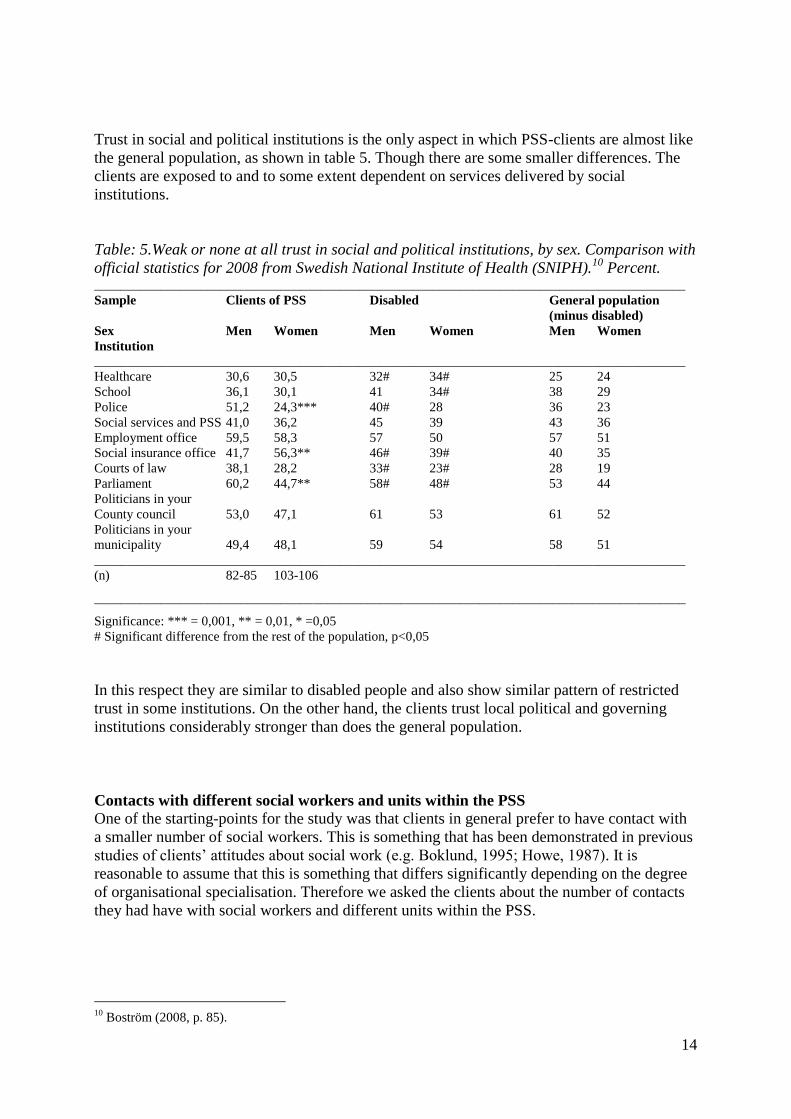
Trust in social and political institutions is the only aspect in which PSS-clients are almost like
the general population, as shown in table 5. Though there are some smaller differences. The
clients are exposed to and to some extent dependent on services delivered by social
institutions.
Table: 5.Weak or none at all trust in social and political institutions, by sex. Comparison with
official statistics for 2008 from Swedish National Institute of Health (SNIPH).10
Percent. _________________________________________________________________________________________
Sample Clients of PSS Disabled General population
(minus disabled)
Sex Men Women Men Women Men Women
Institution
_________________________________________________________________________________________
Healthcare 30,6 30,5 32# 34# 25 24
School 36,1 30,1 41 34# 38 29
Police 51,2 24,3*** 40# 28 36 23
Social services and PSS 41,0 36,2 45 39 43 36
Employment office 59,5 58,3 57 50 57 51
Social insurance office 41,7 56,3** 46# 39# 40 35
Courts of law 38,1 28,2 33# 23# 28 19
Parliament 60,2 44,7** 58# 48# 53 44
Politicians in your
County council 53,0 47,1 61 53 61 52
Politicians in your
municipality 49,4 48,1 59 54 58 51
_________________________________________________________________________________________
(n) 82-85 103-106
_________________________________________________________________________________________
Significance: *** = 0,001, ** = 0,01, * =0,05
# Significant difference from the rest of the population, p<0,05
In this respect they are similar to disabled people and also show similar pattern of restricted
trust in some institutions. On the other hand, the clients trust local political and governing
institutions considerably stronger than does the general population.
Contacts with different social workers and units within the PSS
One of the starting-points for the study was that clients in general prefer to have contact with
a smaller number of social workers. This is something that has been demonstrated in previous
studies of clients‟ attitudes about social work (e.g. Boklund, 1995; Howe, 1987). It is
reasonable to assume that this is something that differs significantly depending on the degree
of organisational specialisation. Therefore we asked the clients about the number of contacts
they had have with social workers and different units within the PSS.
10
Boström (2008, p. 85).
15
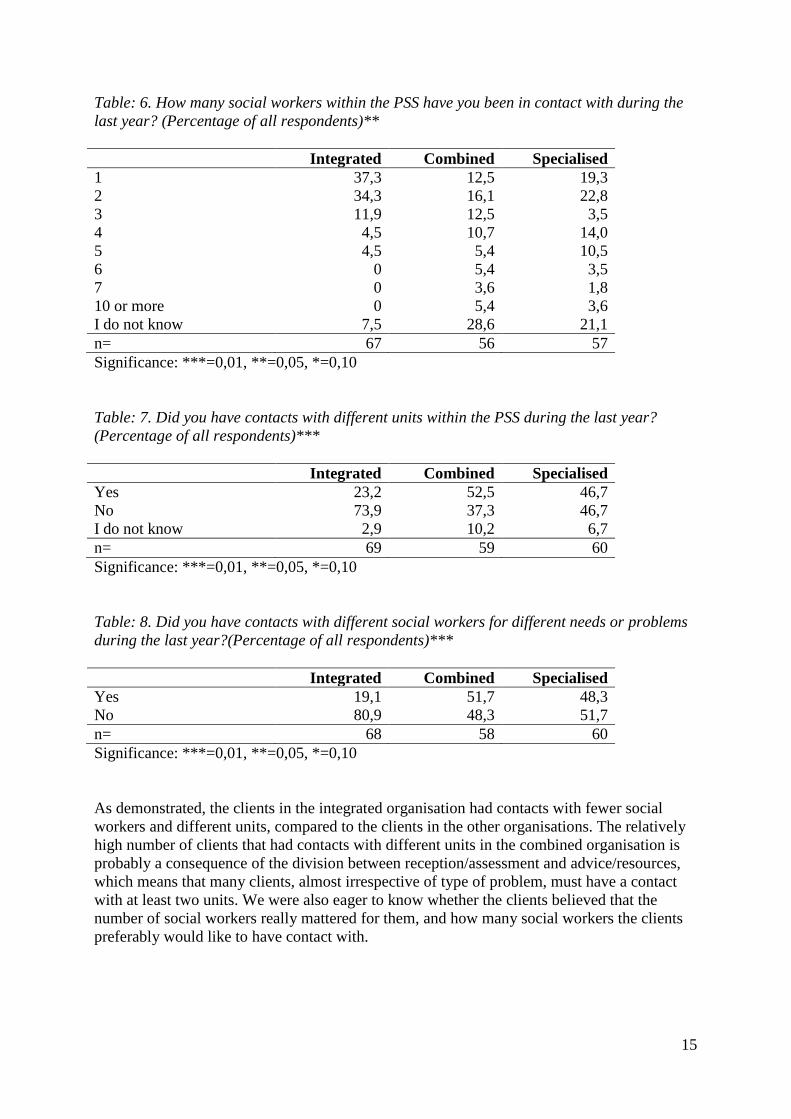
Table: 6. How many social workers within the PSS have you been in contact with during the
last year? (Percentage of all respondents)**
Integrated Combined Specialised
1 37,3 12,5 19,3
2 34,3 16,1 22,8
3 11,9 12,5 3,5
4 4,5 10,7 14,0
5 4,5 5,4 10,5
6 0 5,4 3,5
7 0 3,6 1,8
10 or more 0 5,4 3,6
I do not know 7,5 28,6 21,1
n= 67 56 57
Significance: ***=0,01, **=0,05, *=0,10
Table: 7. Did you have contacts with different units within the PSS during the last year?
(Percentage of all respondents)***
Integrated Combined Specialised
Yes 23,2 52,5 46,7
No 73,9 37,3 46,7
I do not know 2,9 10,2 6,7
n= 69 59 60
Significance: ***=0,01, **=0,05, *=0,10
Table: 8. Did you have contacts with different social workers for different needs or problems
during the last year?(Percentage of all respondents)***
Integrated Combined Specialised
Yes 19,1 51,7 48,3
No 80,9 48,3 51,7
n= 68 58 60
Significance: ***=0,01, **=0,05, *=0,10
As demonstrated, the clients in the integrated organisation had contacts with fewer social
workers and different units, compared to the clients in the other organisations. The relatively
high number of clients that had contacts with different units in the combined organisation is
probably a consequence of the division between reception/assessment and advice/resources,
which means that many clients, almost irrespective of type of problem, must have a contact
with at least two units. We were also eager to know whether the clients believed that the
number of social workers really mattered for them, and how many social workers the clients
preferably would like to have contact with.
16
Table: 9. Has the number of social workers you have been seeing last year been important to
you? (Percentage of all respondents)***
Integrated Combined Specialised
Yes, very much important 23,9 13,6 19,6
Yes, pretty much
important
9,0 8,5 19,6
Partly important 7,5 20,3 23,2
No, hardly not important 13,4 27,1 5,4
No, not important at all 34,3 16,9 23,2
I do not know 11,2 13,6 8,9
n= 67 59 56
Significance: ***=0,01, **=0,05, *=0,10
Table: 10. How many social workers would you like to have contact with, regarding help and
support to you? (Percentage of all respondents)
Integrated Combined Specialised
It does not matter 10,4 22,8 12,1
I do not know 9,0 8,8 13,8
1 social worker 64,2 52,6 56,9
2 social workers 16,4 15,8 15,5
3 social workers 0 0 1,7
n= 67 57 58
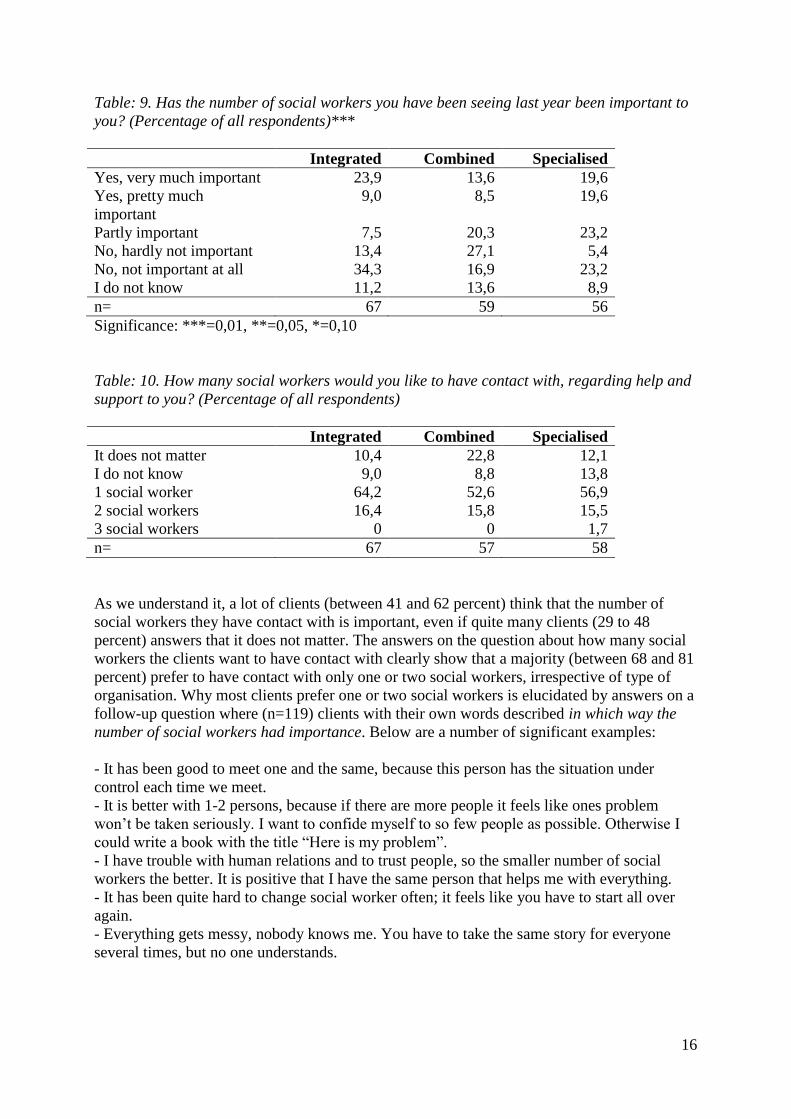
As we understand it, a lot of clients (between 41 and 62 percent) think that the number of
social workers they have contact with is important, even if quite many clients (29 to 48
percent) answers that it does not matter. The answers on the question about how many social
workers the clients want to have contact with clearly show that a majority (between 68 and 81
percent) prefer to have contact with only one or two social workers, irrespective of type of
organisation. Why most clients prefer one or two social workers is elucidated by answers on a
follow-up question where (n=119) clients with their own words described in which way the
number of social workers had importance. Below are a number of significant examples:
- It has been good to meet one and the same, because this person has the situation under
control each time we meet.
- It is better with 1-2 persons, because if there are more people it feels like ones problem
won‟t be taken seriously. I want to confide myself to so few people as possible. Otherwise I
could write a book with the title “Here is my problem”.
- I have trouble with human relations and to trust people, so the smaller number of social
workers the better. It is positive that I have the same person that helps me with everything.
- It has been quite hard to change social worker often; it feels like you have to start all over
again.
- Everything gets messy, nobody knows me. You have to take the same story for everyone
several times, but no one understands.
17
However, there are also a number of answers that expresses positive experiences of
specialisation, for example:
- They were specialists on different areas that I needed help with.
- They helped us with different needs in our family. It has felt secure that different units have
been involved.
- Each of them are good in their area of expertise, they are super!
All in all, the quantitative and qualitative answers on these questions show that clients in
general prefer contacts with a smaller number of social workers, as a way to achieve
continuity and trusting relationships. On that point, our results are fully in line with results
from previous studies.
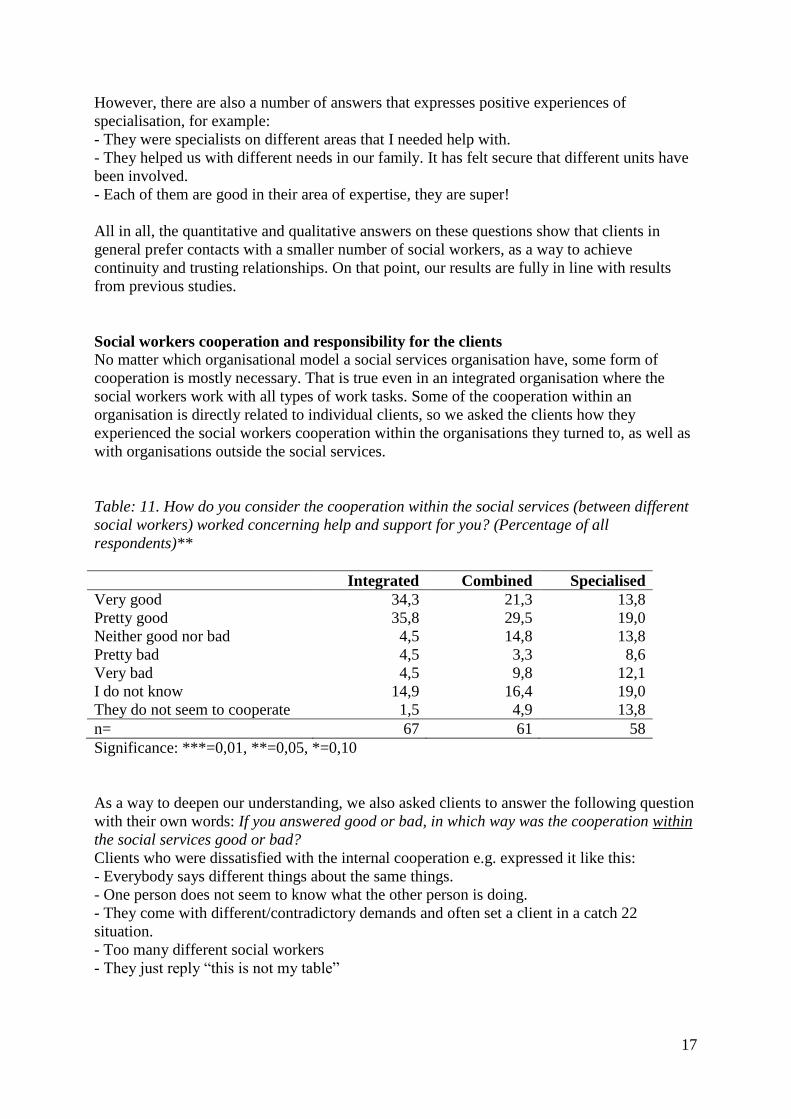
Social workers cooperation and responsibility for the clients
No matter which organisational model a social services organisation have, some form of
cooperation is mostly necessary. That is true even in an integrated organisation where the
social workers work with all types of work tasks. Some of the cooperation within an
organisation is directly related to individual clients, so we asked the clients how they
experienced the social workers cooperation within the organisations they turned to, as well as
with organisations outside the social services.
Table: 11. How do you consider the cooperation within the social services (between different
social workers) worked concerning help and support for you? (Percentage of all
respondents)**
Integrated Combined Specialised
Very good 34,3 21,3 13,8
Pretty good 35,8 29,5 19,0
Neither good nor bad 4,5 14,8 13,8
Pretty bad 4,5 3,3 8,6
Very bad 4,5 9,8 12,1
I do not know 14,9 16,4 19,0
They do not seem to cooperate 1,5 4,9 13,8
n= 67 61 58
Significance: ***=0,01, **=0,05, *=0,10
As a way to deepen our understanding, we also asked clients to answer the following question
with their own words: If you answered good or bad, in which way was the cooperation within
the social services good or bad?
Clients who were dissatisfied with the internal cooperation e.g. expressed it like this:
- Everybody says different things about the same things.
- One person does not seem to know what the other person is doing.
- They come with different/contradictory demands and often set a client in a catch 22
situation.
- Too many different social workers
- They just reply “this is not my table”
18
Clients who were satisfied with the internal cooperation expressed themselves like this:
+ Good communication, coordinated meetings
+ My two social workers cooperate well and they kick ideas between them
+ Good that they have their morning meetings so that all know what it is about
+ Fine ability to cooperate, everyone strive for the same goal.
+ I did not have to tell my story all over again.
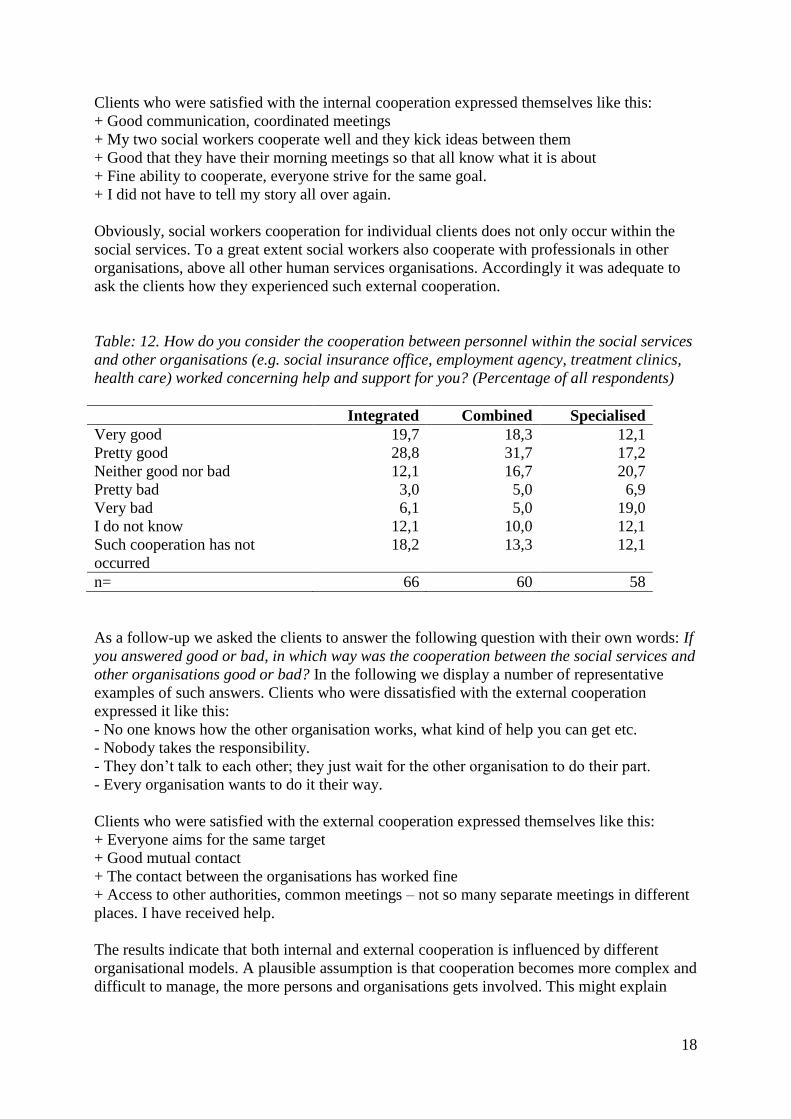
Obviously, social workers cooperation for individual clients does not only occur within the
social services. To a great extent social workers also cooperate with professionals in other
organisations, above all other human services organisations. Accordingly it was adequate to
ask the clients how they experienced such external cooperation.
Table: 12. How do you consider the cooperation between personnel within the social services
and other organisations (e.g. social insurance office, employment agency, treatment clinics,
health care) worked concerning help and support for you? (Percentage of all respondents)
Integrated Combined Specialised
Very good 19,7 18,3 12,1
Pretty good 28,8 31,7 17,2
Neither good nor bad 12,1 16,7 20,7
Pretty bad 3,0 5,0 6,9
Very bad 6,1 5,0 19,0
I do not know 12,1 10,0 12,1
Such cooperation has not
occurred
18,2 13,3 12,1
n= 66 60 58
As a follow-up we asked the clients to answer the following question with their own words: If
you answered good or bad, in which way was the cooperation between the social services and
other organisations good or bad? In the following we display a number of representative
examples of such answers. Clients who were dissatisfied with the external cooperation
expressed it like this:
- No one knows how the other organisation works, what kind of help you can get etc.
- Nobody takes the responsibility.
- They don‟t talk to each other; they just wait for the other organisation to do their part.
- Every organisation wants to do it their way.
Clients who were satisfied with the external cooperation expressed themselves like this:
+ Everyone aims for the same target
+ Good mutual contact
+ The contact between the organisations has worked fine
+ Access to other authorities, common meetings – not so many separate meetings in different
places. I have received help.
The results indicate that both internal and external cooperation is influenced by different
organisational models. A plausible assumption is that cooperation becomes more complex and
difficult to manage, the more persons and organisations gets involved. This might explain
19
why clients in the specialised organisation are less satisfied with the cooperation, than the
clients in the other organisations.
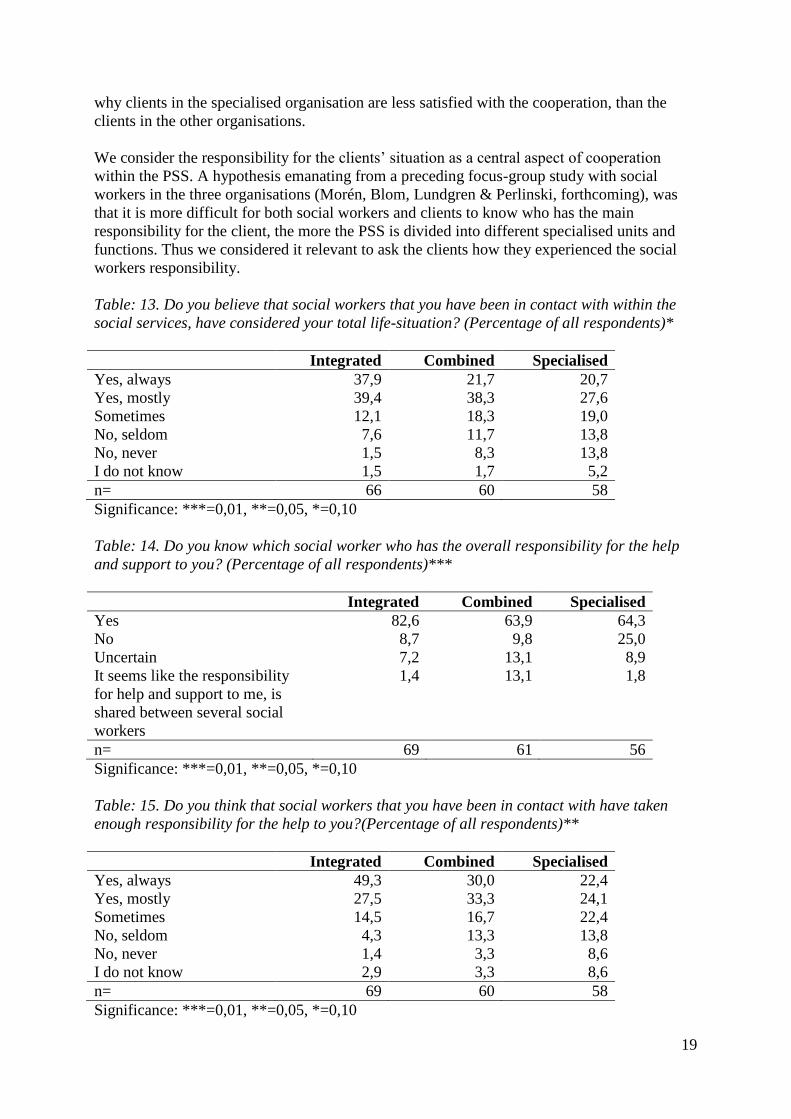
We consider the responsibility for the clients‟ situation as a central aspect of cooperation
within the PSS. A hypothesis emanating from a preceding focus-group study with social
workers in the three organisations (Morén, Blom, Lundgren & Perlinski, forthcoming), was
that it is more difficult for both social workers and clients to know who has the main
responsibility for the client, the more the PSS is divided into different specialised units and
functions. Thus we considered it relevant to ask the clients how they experienced the social
workers responsibility.
Table: 13. Do you believe that social workers that you have been in contact with within the
social services, have considered your total life-situation? (Percentage of all respondents)*
Integrated Combined Specialised
Yes, always 37,9 21,7 20,7
Yes, mostly 39,4 38,3 27,6
Sometimes 12,1 18,3 19,0
No, seldom 7,6 11,7 13,8
No, never 1,5 8,3 13,8
I do not know 1,5 1,7 5,2
n= 66 60 58
Significance: ***=0,01, **=0,05, *=0,10
Table: 14. Do you know which social worker who has the overall responsibility for the help
and support to you? (Percentage of all respondents)***
Integrated Combined Specialised
Yes 82,6 63,9 64,3
No 8,7 9,8 25,0
Uncertain 7,2 13,1 8,9
It seems like the responsibility
for help and support to me, is
shared between several social
workers
1,4 13,1 1,8
n= 69 61 56
Significance: ***=0,01, **=0,05, *=0,10
Table: 15. Do you think that social workers that you have been in contact with have taken
enough responsibility for the help to you?(Percentage of all respondents)**
Integrated Combined Specialised
Yes, always 49,3 30,0 22,4
Yes, mostly 27,5 33,3 24,1
Sometimes 14,5 16,7 22,4
No, seldom 4,3 13,3 13,8
No, never 1,4 3,3 8,6
I do not know 2,9 3,3 8,6
n= 69 60 58
Significance: ***=0,01, **=0,05, *=0,10
20
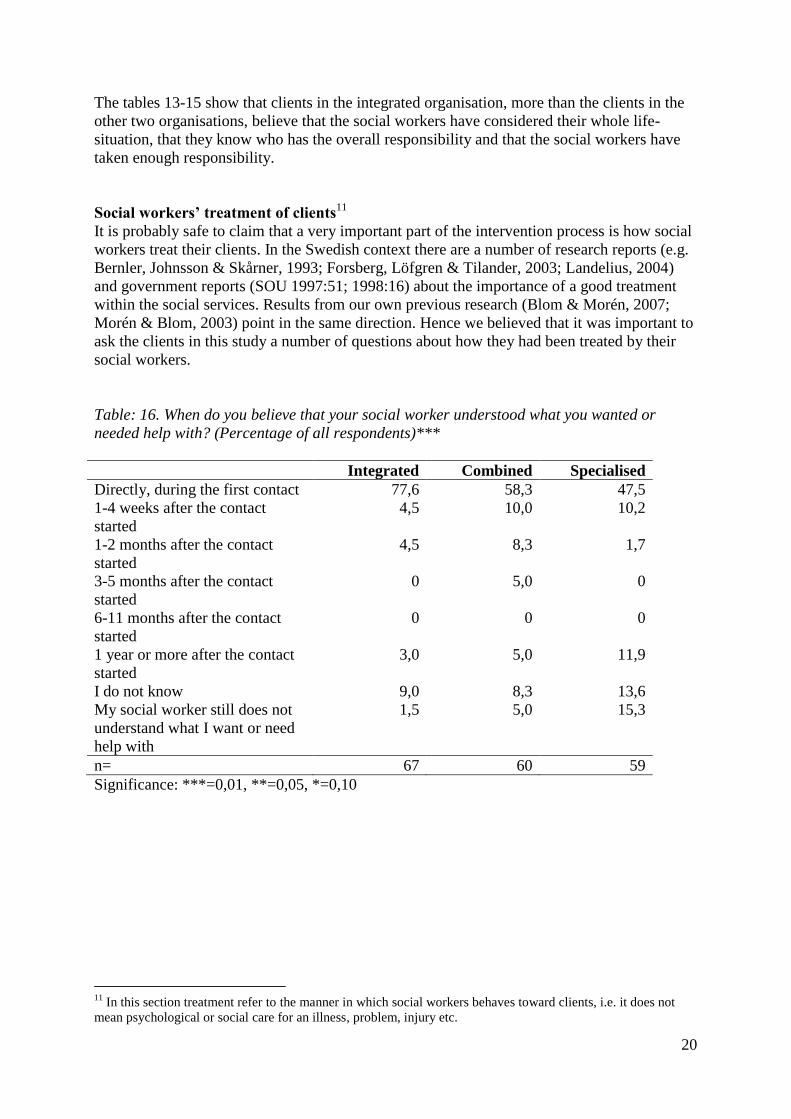
The tables 13-15 show that clients in the integrated organisation, more than the clients in the
other two organisations, believe that the social workers have considered their whole life-
situation, that they know who has the overall responsibility and that the social workers have
taken enough responsibility.
Social workers’ treatment of clients11
It is probably safe to claim that a very important part of the intervention process is how social
workers treat their clients. In the Swedish context there are a number of research reports (e.g.
Bernler, Johnsson & Skårner, 1993; Forsberg, Löfgren & Tilander, 2003; Landelius, 2004)
and government reports (SOU 1997:51; 1998:16) about the importance of a good treatment
within the social services. Results from our own previous research (Blom & Morén, 2007;
Morén & Blom, 2003) point in the same direction. Hence we believed that it was important to
ask the clients in this study a number of questions about how they had been treated by their
social workers.
Table: 16. When do you believe that your social worker understood what you wanted or
needed help with? (Percentage of all respondents)***
Integrated Combined Specialised
Directly, during the first contact 77,6 58,3 47,5
1-4 weeks after the contact
started
4,5 10,0 10,2
1-2 months after the contact
started
4,5 8,3 1,7
3-5 months after the contact
started
0 5,0 0
6-11 months after the contact
started
0 0 0
1 year or more after the contact
started
3,0 5,0 11,9
I do not know 9,0 8,3 13,6
My social worker still does not
understand what I want or need
help with
1,5 5,0 15,3
n= 67 60 59
Significance: ***=0,01, **=0,05, *=0,10
11
In this section treatment refer to the manner in which social workers behaves toward clients, i.e. it does not
mean psychological or social care for an illness, problem, injury etc.
21
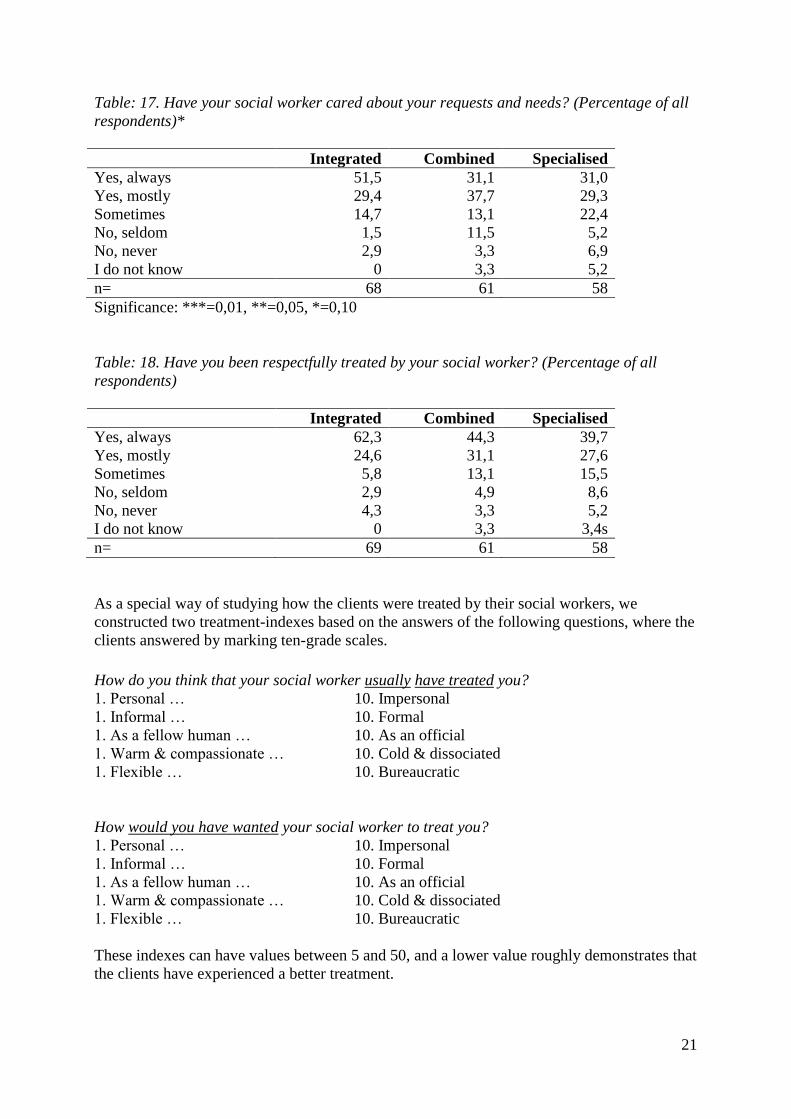
Table: 17. Have your social worker cared about your requests and needs? (Percentage of all
respondents)*
Integrated Combined Specialised
Yes, always 51,5 31,1 31,0
Yes, mostly 29,4 37,7 29,3
Sometimes 14,7 13,1 22,4
No, seldom 1,5 11,5 5,2
No, never 2,9 3,3 6,9
I do not know 0 3,3 5,2
n= 68 61 58
Significance: ***=0,01, **=0,05, *=0,10
Table: 18. Have you been respectfully treated by your social worker? (Percentage of all
respondents)
Integrated Combined Specialised
Yes, always 62,3 44,3 39,7
Yes, mostly 24,6 31,1 27,6
Sometimes 5,8 13,1 15,5
No, seldom 2,9 4,9 8,6
No, never 4,3 3,3 5,2
I do not know 0 3,3 3,4s
n= 69 61 58
As a special way of studying how the clients were treated by their social workers, we
constructed two treatment-indexes based on the answers of the following questions, where the
clients answered by marking ten-grade scales.
How do you think that your social worker usually have treated you?
1. Personal … 10. Impersonal
1. Informal … 10. Formal
1. As a fellow human … 10. As an official
1. Warm & compassionate … 10. Cold & dissociated
1. Flexible … 10. Bureaucratic
How would you have wanted your social worker to treat you?
1. Personal … 10. Impersonal
1. Informal … 10. Formal
1. As a fellow human … 10. As an official
1. Warm & compassionate … 10. Cold & dissociated
1. Flexible … 10. Bureaucratic
These indexes can have values between 5 and 50, and a lower value roughly demonstrates that
the clients have experienced a better treatment.
22
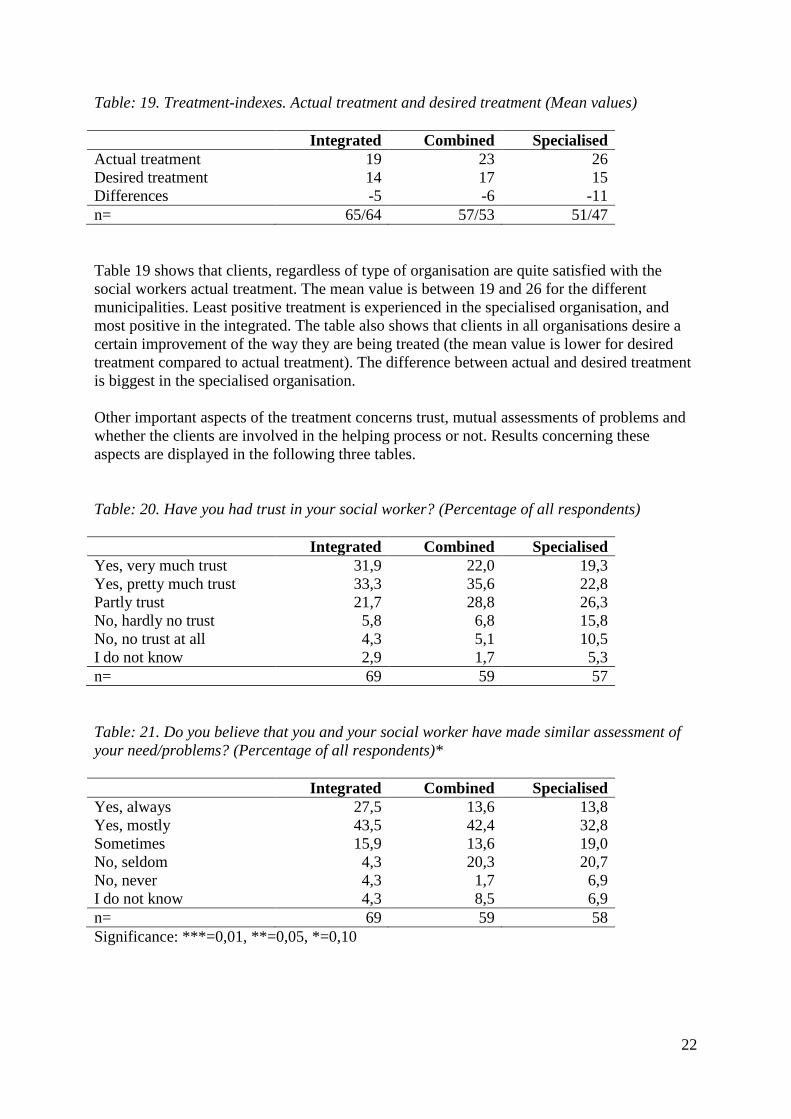
Table: 19. Treatment-indexes. Actual treatment and desired treatment (Mean values)
Integrated Combined Specialised
Actual treatment 19 23 26
Desired treatment 14 17 15
Differences -5 -6 -11
n= 65/64 57/53 51/47
Table 19 shows that clients, regardless of type of organisation are quite satisfied with the
social workers actual treatment. The mean value is between 19 and 26 for the different
municipalities. Least positive treatment is experienced in the specialised organisation, and
most positive in the integrated. The table also shows that clients in all organisations desire a
certain improvement of the way they are being treated (the mean value is lower for desired
treatment compared to actual treatment). The difference between actual and desired treatment
is biggest in the specialised organisation.
Other important aspects of the treatment concerns trust, mutual assessments of problems and
whether the clients are involved in the helping process or not. Results concerning these
aspects are displayed in the following three tables.
Table: 20. Have you had trust in your social worker? (Percentage of all respondents)
Integrated Combined Specialised
Yes, very much trust 31,9 22,0 19,3
Yes, pretty much trust 33,3 35,6 22,8
Partly trust 21,7 28,8 26,3
No, hardly no trust 5,8 6,8 15,8
No, no trust at all 4,3 5,1 10,5
I do not know 2,9 1,7 5,3
n= 69 59 57
Table: 21. Do you believe that you and your social worker have made similar assessment of
your need/problems? (Percentage of all respondents)*
Integrated Combined Specialised
Yes, always 27,5 13,6 13,8
Yes, mostly 43,5 42,4 32,8
Sometimes 15,9 13,6 19,0
No, seldom 4,3 20,3 20,7
No, never 4,3 1,7 6,9
I do not know 4,3 8,5 6,9
n= 69 59 58
Significance: ***=0,01, **=0,05, *=0,10
23
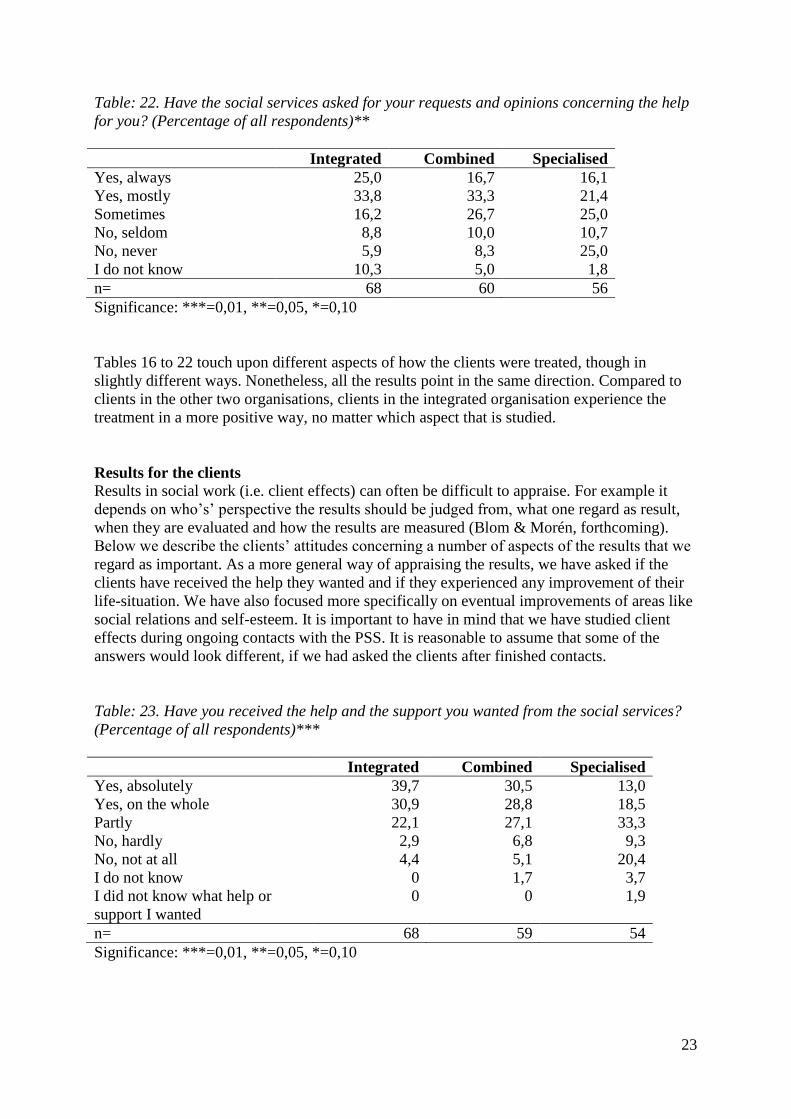
Table: 22. Have the social services asked for your requests and opinions concerning the help
for you? (Percentage of all respondents)**
Integrated Combined Specialised
Yes, always 25,0 16,7 16,1
Yes, mostly 33,8 33,3 21,4
Sometimes 16,2 26,7 25,0
No, seldom 8,8 10,0 10,7
No, never 5,9 8,3 25,0
I do not know 10,3 5,0 1,8
n= 68 60 56
Significance: ***=0,01, **=0,05, *=0,10
Tables 16 to 22 touch upon different aspects of how the clients were treated, though in
slightly different ways. Nonetheless, all the results point in the same direction. Compared to
clients in the other two organisations, clients in the integrated organisation experience the
treatment in a more positive way, no matter which aspect that is studied.
Results for the clients
Results in social work (i.e. client effects) can often be difficult to appraise. For example it
depends on who‟s‟ perspective the results should be judged from, what one regard as result,
when they are evaluated and how the results are measured (Blom & Morén, forthcoming).
Below we describe the clients‟ attitudes concerning a number of aspects of the results that we
regard as important. As a more general way of appraising the results, we have asked if the
clients have received the help they wanted and if they experienced any improvement of their
life-situation. We have also focused more specifically on eventual improvements of areas like
social relations and self-esteem. It is important to have in mind that we have studied client
effects during ongoing contacts with the PSS. It is reasonable to assume that some of the
answers would look different, if we had asked the clients after finished contacts.
Table: 23. Have you received the help and the support you wanted from the social services?
(Percentage of all respondents)***
Integrated Combined Specialised
Yes, absolutely 39,7 30,5 13,0
Yes, on the whole 30,9 28,8 18,5
Partly 22,1 27,1 33,3
No, hardly 2,9 6,8 9,3
No, not at all 4,4 5,1 20,4
I do not know 0 1,7 3,7
I did not know what help or
support I wanted
0 0 1,9
n= 68 59 54
Significance: ***=0,01, **=0,05, *=0,10
24
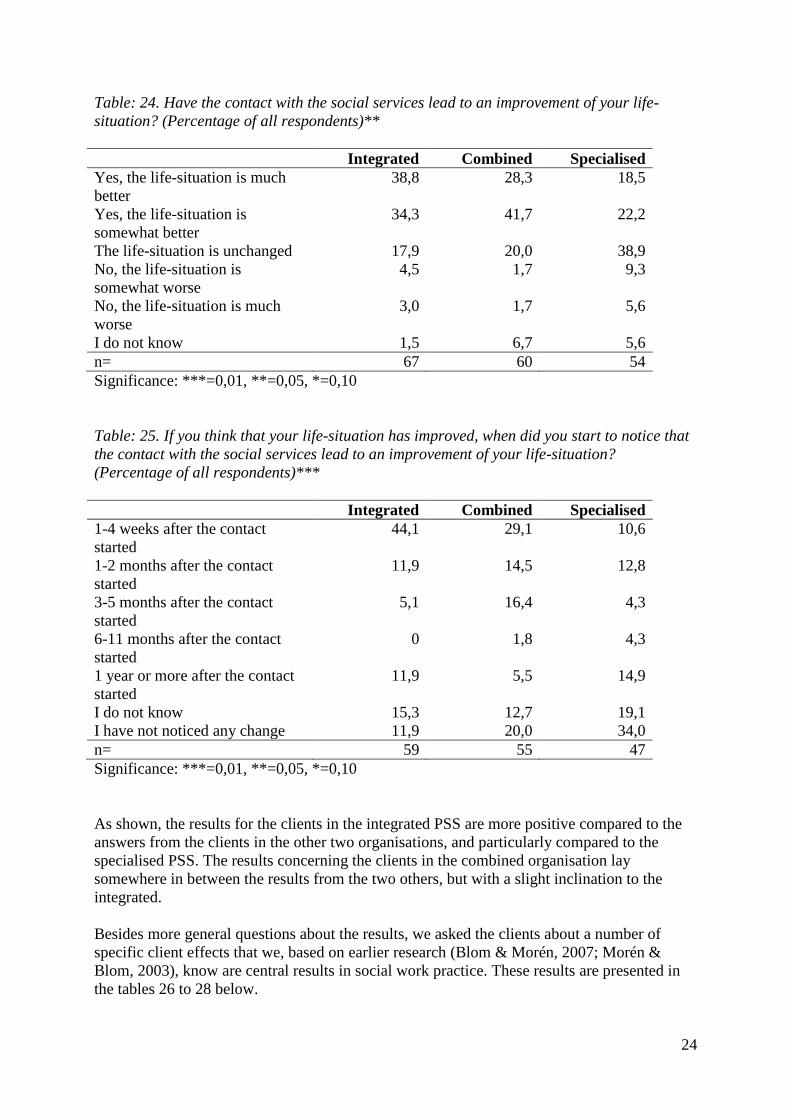
Table: 24. Have the contact with the social services lead to an improvement of your life-
situation? (Percentage of all respondents)**
Integrated Combined Specialised
Yes, the life-situation is much
better
38,8 28,3 18,5
Yes, the life-situation is
somewhat better
34,3 41,7 22,2
The life-situation is unchanged 17,9 20,0 38,9
No, the life-situation is
somewhat worse
4,5 1,7 9,3
No, the life-situation is much
worse
3,0 1,7 5,6
I do not know 1,5 6,7 5,6
n= 67 60 54
Significance: ***=0,01, **=0,05, *=0,10
Table: 25. If you think that your life-situation has improved, when did you start to notice that
the contact with the social services lead to an improvement of your life-situation?
(Percentage of all respondents)***
Integrated Combined Specialised
1-4 weeks after the contact
started
44,1 29,1 10,6
1-2 months after the contact
started
11,9 14,5 12,8
3-5 months after the contact
started
5,1 16,4 4,3
6-11 months after the contact
started
0 1,8 4,3
1 year or more after the contact
started
11,9 5,5 14,9
I do not know 15,3 12,7 19,1
I have not noticed any change 11,9 20,0 34,0
n= 59 55 47
Significance: ***=0,01, **=0,05, *=0,10
As shown, the results for the clients in the integrated PSS are more positive compared to the
answers from the clients in the other two organisations, and particularly compared to the
specialised PSS. The results concerning the clients in the combined organisation lay
somewhere in between the results from the two others, but with a slight inclination to the
integrated.
Besides more general questions about the results, we asked the clients about a number of
specific client effects that we, based on earlier research (Blom & Morén, 2007; Morén &
Blom, 2003), know are central results in social work practice. These results are presented in
the tables 26 to 28 below.
25
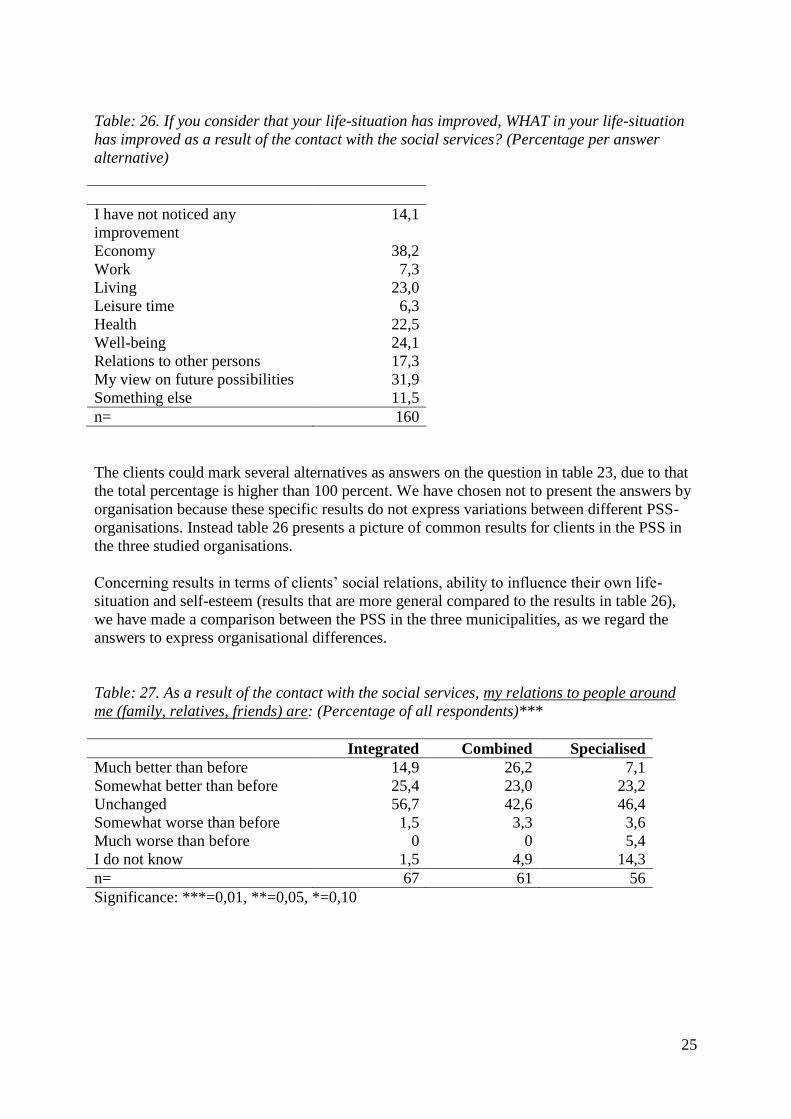
Table: 26. If you consider that your life-situation has improved, WHAT in your life-situation
has improved as a result of the contact with the social services? (Percentage per answer
alternative)
I have not noticed any
improvement
14,1
Economy 38,2
Work 7,3
Living 23,0
Leisure time 6,3
Health 22,5
Well-being 24,1
Relations to other persons 17,3
My view on future possibilities 31,9
Something else 11,5
n= 160
The clients could mark several alternatives as answers on the question in table 23, due to that
the total percentage is higher than 100 percent. We have chosen not to present the answers by
organisation because these specific results do not express variations between different PSS-
organisations. Instead table 26 presents a picture of common results for clients in the PSS in
the three studied organisations.
Concerning results in terms of clients‟ social relations, ability to influence their own life-
situation and self-esteem (results that are more general compared to the results in table 26),
we have made a comparison between the PSS in the three municipalities, as we regard the
answers to express organisational differences.
Table: 27. As a result of the contact with the social services, my relations to people around
me (family, relatives, friends) are: (Percentage of all respondents)***
Integrated Combined Specialised
Much better than before 14,9 26,2 7,1
Somewhat better than before 25,4 23,0 23,2
Unchanged 56,7 42,6 46,4
Somewhat worse than before 1,5 3,3 3,6
Much worse than before 0 0 5,4
I do not know 1,5 4,9 14,3
n= 67 61 56
Significance: ***=0,01, **=0,05, *=0,10
26
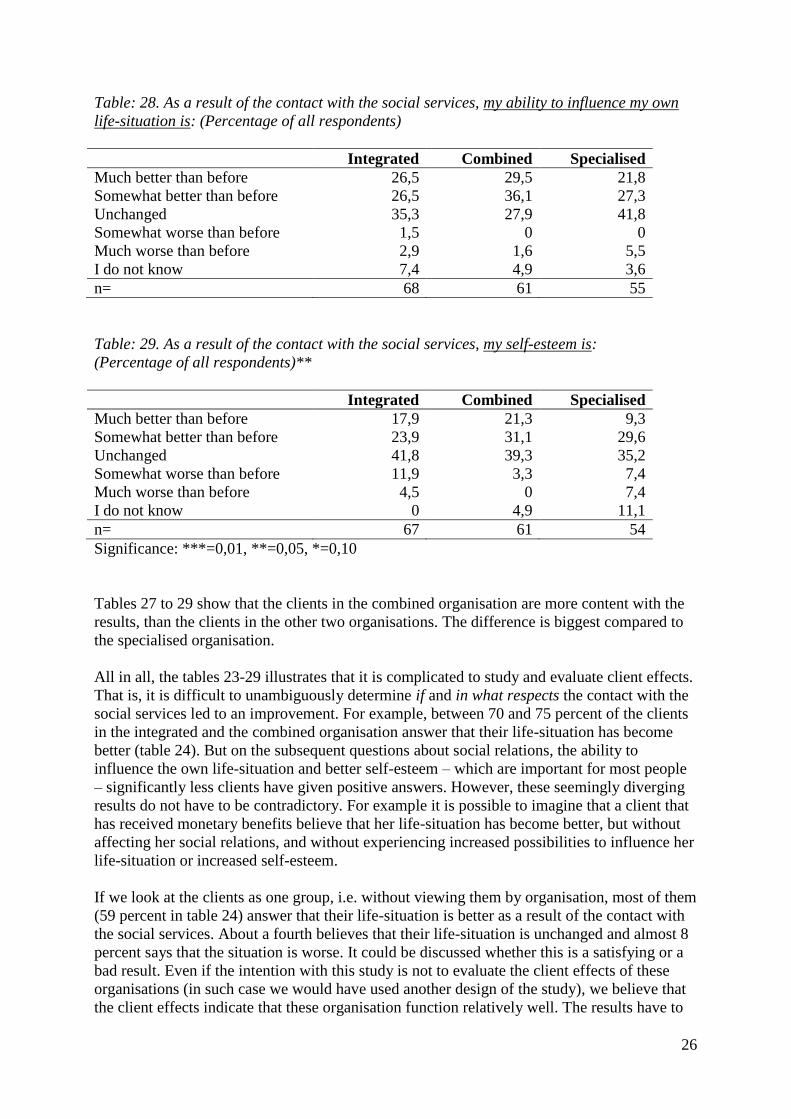
Table: 28. As a result of the contact with the social services, my ability to influence my own
life-situation is: (Percentage of all respondents)
Integrated Combined Specialised
Much better than before 26,5 29,5 21,8
Somewhat better than before 26,5 36,1 27,3
Unchanged 35,3 27,9 41,8
Somewhat worse than before 1,5 0 0
Much worse than before 2,9 1,6 5,5
I do not know 7,4 4,9 3,6
n= 68 61 55
Table: 29. As a result of the contact with the social services, my self-esteem is:
(Percentage of all respondents)**
Integrated Combined Specialised
Much better than before 17,9 21,3 9,3
Somewhat better than before 23,9 31,1 29,6
Unchanged 41,8 39,3 35,2
Somewhat worse than before 11,9 3,3 7,4
Much worse than before 4,5 0 7,4
I do not know 0 4,9 11,1
n= 67 61 54
Significance: ***=0,01, **=0,05, *=0,10
Tables 27 to 29 show that the clients in the combined organisation are more content with the
results, than the clients in the other two organisations. The difference is biggest compared to
the specialised organisation.
All in all, the tables 23-29 illustrates that it is complicated to study and evaluate client effects.
That is, it is difficult to unambiguously determine if and in what respects the contact with the
social services led to an improvement. For example, between 70 and 75 percent of the clients
in the integrated and the combined organisation answer that their life-situation has become
better (table 24). But on the subsequent questions about social relations, the ability to
influence the own life-situation and better self-esteem – which are important for most people
– significantly less clients have given positive answers. However, these seemingly diverging
results do not have to be contradictory. For example it is possible to imagine that a client that
has received monetary benefits believe that her life-situation has become better, but without
affecting her social relations, and without experiencing increased possibilities to influence her
life-situation or increased self-esteem.
If we look at the clients as one group, i.e. without viewing them by organisation, most of them
(59 percent in table 24) answer that their life-situation is better as a result of the contact with
the social services. About a fourth believes that their life-situation is unchanged and almost 8
percent says that the situation is worse. It could be discussed whether this is a satisfying or a
bad result. Even if the intention with this study is not to evaluate the client effects of these
organisations (in such case we would have used another design of the study), we believe that
the client effects indicate that these organisation function relatively well. The results have to
27
be related to the fact that the PSS often work with people with very difficult problems (e.g.
drug abuse, child abuse, racial conflicts, which have aggravated under long periods). Thus
one cannot expect that all clients at a certain occasion (i.e. the period when the questionnaire
was distributed) answers that the contact has led to an improvement. Moreover, from our
previous studies (Blom & Morén, 2007, Morén & Blom, 2003) we know that clients during
the initial phase of the contact with the PSS can feel that life has become worse, e.g. because
they have to quit abusing drugs. Maybe that is one of the reasons way so many as 16 percent
of the clients in the integrated organisation believe that their self-esteem (table 29) is worse as
a result of the social services. It could – how strange this may seem – be an indication of
successful social work.
Summing-up
Taken as a whole, the results show – almost throughout – that clients in the integrated
organisation, compared to the clients in the combined and the specialised organisation:
- have had contacts with fewer social workers and units within the PSS
- have experienced the PSS‟ internal and external cooperation as better
- have experienced the social workers holistic view and responsibility as better
- have received a better encounter/treatment and been more involved in the helping process
- are more satisfied with the results (except that clients in the combined organisation are more
satisfied in some respects, cp. tables 27-29)
- seem to have understood the PSS-organisation, the helping process and their own situation
in a better way (fewer clients have answered I do not know on questions about concrete
circumstances as well on questions concerning attitudes).
Hence, there are a number of significant differences between the clients in the studied
municipalities, which can be related to how the PSS is organised. The results indicate that the
integrated organisation is the most advantageous (or less disadvantageous) from a client
perspective. Anew we want to emphasize that the results has to be interpreted carefully,
considering that the sample was not fully randomized and the limited number of respondents.
Nevertheless, due to the fact that the results from the client study are fully in line with the
results from the other studies within the project (studies of social workers, politicians and
superiors)12
, we regard the reliability of the study as acceptable.
The focus of this paper is if organisational structure is a barrier or support for clients in the
personal social service, and more specifically whether this depends on the type of
organisation. Based on the results presented above, we discuss this question in the next part of
the paper.
The PSS as barrier or support?
In the title of this paper we put forward the question if organisational structure is a barrier or
support in the personal social services. Generally regarded, the obvious answer is that the
PSS‟ organisational structure function as support as well as barrier, irrespective of which
organisational model one have in mind. The answer on that question, among other things,
depends on who‟s‟ perspective (e.g. politicians‟, social workers‟ or clients‟) the matter is
viewed from, what one mean by support and barrier (e.g. for management or interventions),
and what organisational tasks that is in focus (e.g. prevention, treatment or care).
12
Morén, S., Blom, B., Lundgren, M. & Perlinski, M. (forthcoming); Perlinski, Blom & Morén (2009);
Perlinski, Blom, Morén & Lundgren (forthcoming).
28
In a previous interview study (Perlinski, Blom, Morén & Lundgren, forthcoming), with
politicians and managers in the three municipalities, it became clear that the current PSS-
organisations are based on very different logics. The specialised organisation was primarily
designed with regard to the management‟s and the social workers‟ desires for management,
control, delimitation and focusing. On the contrary, the combined and the integrated
organisations were planned with the clients‟ and the social workers‟ needs for holism as the
starting-point, (even though these organisations in practice were designed differently).
In this paper the clients are in focus, hence our appraisal of whether organisational structure is
a barrier or support in the personal social services, is made with a client perspective (as far as
it is possible for a researcher).
Figure 6 below, illustrates how the degree of specialisation (i.e. the extent of which the work
tasks are divided into categories or functions), approximately relates to what we denominate
the degree of barrierisation (i.e. the extent of which clients meet organisational hindrances).
We have chosen to name one of the dimension barrierisation, as the PSS in varying degree
always is a kind of hindrance to clients. That is, even though we regard the social services in
general as supporting, there are always different sorts of barriers (laws, rules, guidelines,
routines, social and material structures etc.) that the clients have to adapt to/overcome, in
order to receive help. By way of example, there are limits for how much monetary benefit a
client can receive each month. And to get help, a client usually must come to meetings at
appointed time, be sober, pass through a reception and so on. Moreover, as our study reveals,
a high degree of specialisation means a number of different barriers, among other things that
the clients must have contact with several social workers who‟s‟ cooperation and
responsibility for the clients are not as good as in the integrated organisation. (Table 10 shows
that the majority of all clients – regardless of organisational model – prefer to have contact
with only one or two social workers).

29
D
egre
e of
spec
iali
sati
on
High
Specialised PSS
Combined PSS
Low
Integrated PSS
Low High
Degree of ”barrierisation”
Figure 6. Approximate relations between organisational specialisation and ”barrierisation”
for clients in three Swedish PSS-organisations.
The integrated PSS-organisation is characterised both by a low degree of specialisation and a
low degree of barrierisation. The specialised organisation is something of an antipode and is
thus characterised by a high degree of specialisation and barrierisation. Consequently, the
combined PSS lies somewhere in between in this figure, which means that it in some respects
are more like the integrated and in other respects more like the specialised.
The organisations’ exterior manifestations
Two of the authors of this paper visited the three municipalities in order to interview the
social workers (for another study within the project). We then noticed that organisational
differences concretely manifested in how the social services‟ material premises (receptions,
offices and so on) were designed. This was the case both regarding formal structures and
social atmosphere. As a visitor in the specialised and the combined organisation, we faced a
traditional reception with a receptionist behind security glass that checked who we were and
then let us pass the locked doors. There we experienced organisational barriers, very concrete,
already from the beginning. The locked doors are there to protect the social workers from
aggressive clients, but paradoxically they can evoke aggressiveness duo to the fact that clients
as a result sometimes feel locked out, dangerous, depreciated etc.
In the integrated organisation, there was no reception at all. As a visitor you directly walk into
a waiting room, which is located immediately to the social workers coffee room, even without
a wall between. It felt like entering the waiting room to a bigger hairdressers‟ shop or
something similar. Initially we actually had difficulties understanding if we really had come
to the social services – it almost felt too open and welcoming. The social workers in this PSS,
hence, get a direct contact with the clients regardless of the clients‟ condition. Nonetheless,
according to the social workers opinion, this open atmosphere has a calming effect on the
30
clients. This statement is supported by some of the open answers that clients gave on one of
the questions in the questionnaire, e.g.: “It is quite homelike there, it feels warm, not sterile”.
“It is very positive that one can come and go as you like without bars and looked corridors. It
feels like you are met as a human and nor like a criminal which they suspect to be mean, and
have to put up bars before.”
We cannot say if it generally is better or not with open doors at the social services, but we
argue that it is an important factor to take into consideration. This is something that we also
noticed in a previous research project where clients‟ experiences of the social services were
studied (Blom & Morén, 2007).
Bear in mind the main purpose with the PSS
One of our earlier studies within the project (Lundgren, Blom, Morén & Perlinski, 2009)
shows that specialisation of the PSS has increased during the last two decades, and some form
of specialisation exists in the majority (93 %) of the Swedish municipalities. Only a small
number (7 %) of municipalities – mostly with a population not bigger than 25 000 – have an
integrated organisation. Thus it is a clear development towards different types of
specialisation, at the same time as we notice that previous research about successful
organisational models for the PSS is everything but unambiguous. In other words, there is no
obvious scientific evidence showing that specialisation is the most appropriate way to go
when organising PSS. Our empirical studies and the research review in this paper,
demonstrates that the increasing specialisation within the PSS is not based on previous
research about different organisations adequacy for the clients. Simply because such clear
research evidence does not exist. On the other hand, in the literature (both in scientific reports
and press connected to the social workers‟ trade unions), there are a number of arguments for
specialisation that are largely intra-organisational. Although these arguments mainly seem
based in the organisation‟s and the social workers‟ demands, rather than the client‟s needs.
These arguments are often about the social services internal requirements to handle
contradictory demands, e.g. between responsibility and resources, between tasks and
problems, between different groups‟ needs and demands and between different logics
(Johansson, 2002). Consequently, we assume that specialisation is, at least partly, a response
to feelings that are caused by such contradictory demands. This assumption is supported by
Challis and Ferlie (1988), who studied the increased specialisation in social work in Great
Britain. They mention a number of reasons behind specialisation such as ”a search for
structure, the need to define more realistic boundaries to the work expected (…), and to
develop appropriate techniques of intervention, and to liaise effectively with relevant external
agencies and professionals.” (p. 20).
However, the increasing specialisation of the Swedish PSS cannot be understood isolated
from external factors in the surrounding world. The process has to be located in a context
where organisations successively change as a response to the needs and expectations in the
society. Significant examples of such factors are: political changes, changed economical
conditions, professional aspirations and claims, changed demands, “new” social problems,
other organisations‟ shortages (Perlinski, Blom, Morén & Lundgren, forthcoming).
Accordingly, there is a wide array of internal and external reasons for specialising the PSS. It
is understandable that responsible politicians and officials approach these by successively
adapting the organisations. Even so, we argue that different organisational models adequacy
for the clients must be given a higher priority when PSS is reorganised. Or in other words – it
31
is important that the PSS-organisation, as little as possible constitute a barrier for the clients.
The reason is simply because the PSS exist to help the clients.
One of the most common expressed assumptions behind specialising the PSS, is that a limited
number of work tasks for the individual social worker leads to a better competence within a
specific area, and that the clients as a result will receive better help (Bergmark & Lundström,
2005; Perlinski, Blom, Morén & Lundgren, forthcoming). In other words, the idea is that
social workers become experts within a concentrated area, if they do not have to work with all
types of social problems, different groups of clients, all kind of work tasks etc. We admit that
this can be the case for social workers. But at the same time, for individual clients and
families with multi-facetted problem situations, this can imply that clients need to have
contact with several different social workers and units within an organisation, in order to get
help with the whole situation. This also means that the client‟s situation tends to become
defined and categorised according to the PSS-organisation, instead of the opposite. As the
client study in this paper reveals, that affects the quality of the interventions as well as the
results.
We hence want point to the fact that there are a number of things that questions the – almost
taken for granted – idea of specialisation of the PSS, when focusing on the appropriateness for
clients. At least this is true for the types of specialisation discussed in this paper. This does
not mean that we think that every PSS-organisation must be integrated. But we argue that it is
necessary to keep in mind that the primary objective for the social services is to help socially
vulnerable people, and that the organisation is a means to achieve that. Otherwise there is a
risk for the reversal of means and objectives that already Max Weber wrote about. This means
that the main objective becomes to make the organisation effective, the social workers
satisfied and so on. Which in turn implies that the clients and their problems are divided into
and handled as categories that suit the organisation, rather than the clients. Hence we agree
with the client that expressed herself this way, when answering our questionnaire: “Within the
social services, the client should be more important than the social workers job situation”.
In our research project, taken as a whole, we have identified something of a paradox. In the
specialised organisation, the current PSS-organisation to a great extent was introduced as a
way to make the working situation better for the social workers. But in this organisation, both
social workers and clients are less satisfied compared to those groups in the other two
organisations. In the integrated and the combined PSS, the present organisations were
introduced for the sake of clients (Perlinski, M., Blom, B., Morén, S. & Lundgren, M.,
forthcoming). In those organisations the social workers as well as the clients are more
satisfied. All in all, there is empirical support for the idea that the clients‟ needs and desires is
the appropriate starting-point, when creating PSS-organisations that offer support with as low
barriers as possible.
n

32
Appendix How much does the PSS cost? A comparison of key figures for the three studied
organisations
It can be assumed that some of the readers of our paper will react something like this: “You
have shown that there are significant differences between clients‟ descriptions, experiences
and attitudes, but what about the costs for the PSS in these organisations, do they differ? As a
reply on that anticipated question we have compared the organisations with reference to a
number of key figures. The comparison builds upon public statistics from Statistics Sweden
[in Swedish abbr. SCB] and Swedish Association of Local Authorities and Regions [in
Swedish abbr. SKL], which are compiled in their annual reports (SCB & SKL 2007, 2008,
2009).
Initially we want to emphasize that it is difficult to make completely fair economical
comparisons between PSS-organisations. Among other things, because they are situated in
municipalities which are different in a number of respects (geography, population,
infrastructure, level of tax and so on). Moreover, PSS-organisations that look similar on the
surface, can in practice be designed in several specific ways. I.e. all specialised PSS-
organisations does not have exactly the same model, there are variants adapted to local
contexts. The same is true for the integrated and the combined PSS-organisations. Moreover,
based on our study of politicians and managers (Perlinski, Blom, Morén & Lundgren,
forthcoming) we believe that public statistics might have certain flaws, in that respect that it
does not reflect cost-generating features of importance for how much service is given to the
clients. For instance, high personnel turnover creates cost for introduction of new social
workers while low turnover creates continuity and more time for clients. To make a
comparison as fair as possible, ideally one would have to identify a number of PSS-
organisations (i.e. other specialised, integrated and combined), which are almost structurally
identical with the one we have studied. Due to the fact that municipalities as well as PSS-
organisations vary in a number of respects, and because it is complicated to get such
information that is detailed enough, we have chosen to base our comparison on existing
public statistics. In spite of these reservations, we believe that a comparison of key figures is
interesting and relevant if it is related to the results from our different studies within the
research project.13
A possible argument to our defence, is that the difficulty to compare
probably also applies for the overall comparisons of the municipalities; the kind of generally
accepted comparisons that are regularly produced by SCB and SKL.
Some definitions and explanations
The comparison includes a number of typical areas within the Swedish PSS. Due to that we
present definitions used by SCB and SKL in their reports (SCB & SKL, 2007, 2008, 2009
tables 4 and 9). This is followed by explanations concerning different measures of costs in
table A below (columns 6-8).
Child and youth care
Costs for the care and support that the PSS offers to children and youth 0-20 years old, in
terms of institutional care, family care and non-institutional (outpatient) care.
13
The client study as well as the following: Morén, S., Blom, B., Lundgren, M. & Perlinski, M. (forthcoming);
Perlinski, Blom & Morén (2009); Perlinski, Blom, Morén & Lundgren (forthcoming).
33
Addiction treatment for adults
Costs for the care and support that the PSS offers to adult addicts in terms of institutional
institutional care, family care or different forms of outpatient care.
Other adult care
Costs for the care and support that the PSS offers to adults with psychiatric or other social
problems that are not related to addiction. In terms of individually assessed institutional care,
outpatient care or other non-institutional interventions.
Family law
Costs for the work that the PSS conduct based on The Children and Parents Code
[Föräldrabalken] and the Social Services Act [SoL] in terms of family counselling and other
tasks as: establishing of paternity, cooperation agreements, assessments and agreements on
custody, guardianship, the residence of the child, maintenance and access.
Monetary benefits
Costs for assessments and payment of support for daily living and other monetary support.
Monetary support to refugees is not included in the costs for PSS.
Gross and net costs
In the columns 6-7 the running costs for the PSS are presented. The principles for the
distribution of costs means that all direct and indirect costs (e.g. administration and common
services) are divided on all the municipal sectors, like the PSS. Gross cost refers to the
municipalities‟ costs for their own consumption. Net costs are received by decreasing gross
costs with the total amount of incomes, mainly focused on governmental subsidies, taxes and
fees, rental revenues and other revenues from selling.
Difference between actual costs and standard costs
Column 8 presents an indication that shows if a municipality has a higher or lower actual net
cost than motivated by the municipal owns structure, according to the governmental cost-
equalization system (i.e. the municipal standard costs). The principles for the distribution of
costs means that all direct and indirect costs (e.g. administration and common services) are
divided on all the municipal sectors, like the PSS. The municipal net cost is received by
decreasing the costs for a certain area with its incomes, which mainly consists of earmarked
governmental subsidies, fees, rental revenues and other revenues from selling.
Standard cost: the cost equalization consists of different sub-models where every sub-model
covers different areas as child-care, compulsory school etc. Somewhat simplified, cost
equalization means that municipalities with a higher share of children youth and senior
citizens, compared with the national average, receive subsidies. Municipalities with a lower
share of children youth and senior citizens, compared with the national average, have to pay.
Share of the population 16-64 years, unemployed and in programs depending on the trade
cycle, %
The sum of unemployed and persons in programs depending on the trade cycle, in relation to
persons 16-64 years, annual average.
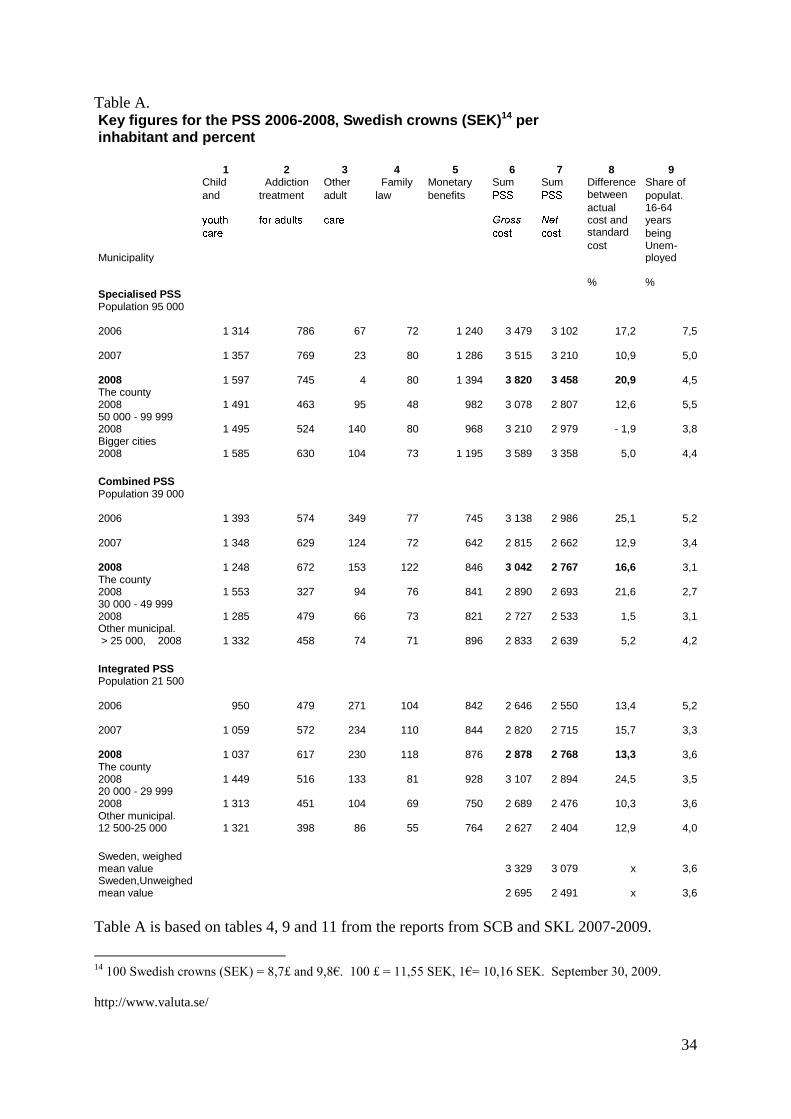
34
Table A. Key figures for the PSS 2006-2008, Swedish crowns (SEK)14 per inhabitant and percent
1
Child 2
Addiction 3
Other 4
Family 5
Monetary 6
Sum 7
Sum 8
Difference 9
Share of
and treatment adult law benefits between populat.
actual cost and
16-64 years
standard being
Municipality cost Unem-
ployed
% %
Specialised PSS Population 95 000
2006 1 314 786 67 72 1 240 3 479
3 102
17,2 7,5
2007 1 357 769 23 80 1 286 3 515
3 210
10,9 5,0
2008 1 597 745 4 80 1 394 3 820
3 458
20,9 4,5 The county 2008 1 491 463 95 48 982 3 078
2 807
12,6 5,5
50 000 - 99 999 2008 1 495 524 140 80 968 3 210
2 979
- 1,9 3,8
Bigger cities 2008 1 585 630 104 73 1 195 3 589
3 358
5,0 4,4
Combined PSS Population 39 000
2006 1 393 574 349 77 745 3 138
2 986
25,1 5,2
2007 1 348 629 124 72 642 2 815
2 662
12,9 3,4
2008 1 248 672 153 122 846 3 042
2 767
16,6 3,1 The county 2008 1 553 327 94 76 841 2 890
2 693
21,6 2,7
30 000 - 49 999 2008 1 285 479 66 73 821 2 727
2 533
1,5 3,1
Other municipal. > 25 000, 2008 1 332 458 74 71 896 2 833
2 639
5,2 4,2
Integrated PSS Population 21 500
2006 950 479 271 104 842 2 646
2 550
13,4 5,2
2007 1 059 572 234 110 844 2 820
2 715
15,7 3,3
2008 1 037 617 230 118 876 2 878
2 768
13,3 3,6 The county 2008 1 449 516 133 81 928 3 107
2 894
24,5 3,5
20 000 - 29 999 2008 1 313 451 104 69 750 2 689
2 476
10,3 3,6
Other municipal. 12 500-25 000 1 321 398 86 55 764 2 627
2 404
12,9 4,0
Sweden, weighed mean value 3 329
3 079
x 3,6
Sweden,Unweighed mean value 2 695
2 491
x 3,6
Table A is based on tables 4, 9 and 11 from the reports from SCB and SKL 2007-2009.
14
100 Swedish crowns (SEK) = 8,7£ and 9,8€. 100 £ = 11,55 SEK, 1€= 10,16 SEK. September 30, 2009.
http://www.valuta.se/
35
The table shows that there are variations from year to year, within the organisations,
concerning how much different areas cost. It also shows that there are significant differences
between the organisations regarding the distribution of the costs. By way of example, in the
specialised organisation, Other adult care, costed 4 SEK per inhabitant, whereas the same area
in the other municipalities costed between 153 and 230 SEK per inhabitant.
We consider it more adequate to compare the total costs for the PSS (Table A, columns 6-7)
in the studied organisations during one year (e.g. because different organisational models can
imply that the distribution of costs vary between different PSS), instead of comparing each
sub-area within the PSS, between the organisations. In the table, the total costs for the PSS,
and difference between actual costs and standard costs, for 2008 are made bold (columns 6-8).
This is to indicate that these figures are compared with key figures from 2008 in other
municipalities. The figures for each PSS show how the studied PSS during 2008 related: to
each other, to the average costs in respective county, to the average costs in other
municipalities with similar number of inhabitants, and to other municipalities of the same type
(according to the Swedish division of groups of municipalities).15
The average cost for the
PSS in Sweden is shown at the bottom of the table.
As we can see, the gross cost for the PSS is highest in the specialised organisation and lowest
in the integrated organisation. When looking at the net costs, they are almost identical in the
integrated and the combined, and they are more than 700 SEK lower than in the specialised.
Moreover, all three organisations have higher costs than their respective reference
municipalities 2008, with the exception that the integrated organisation is below the average
cost in its county. What is more, the combined and the integrated is below the weighed mean
value in Sweden, both concerning gross and net costs.
Another possibility to compare is to look at differences in percent, between actual (i.e.
declared) costs and so called standard costs. That is a measure that considers and compensates
for significant structural differences between the municipalities (column 8). Table A, shows
that each of the three municipalities have higher costs than the standard cost that is motivated
by its own structure (according to the governmental cost equalizing system). During 2008 the
integrated organisation was 13 percent higher, the combined nearly 17 percent higher and the
specialised almost 21 percent.
The figures in the columns 7 and 8, consider in different ways a number of structural
characteristics in the municipalities, which in principle, means that it is possible to compare
the studied PSS-organisations with each other, based on these key figures. A comparison of
the total net cost shows that the integrated and the combined organisation had almost identical
costs 2008, and that they were about 700 SEK lower than the specialised organisation.
Even though we are using generally accepted ways of calculating municipal costs, which in
fact compensate for much of the structural differences, it is not unproblematic to compare
municipalities with such different characters. As an effort to handle this problem (at least
partly), we present another table (B) below, where we compare each organisation with
municipalities of the same size (almost the same number of inhabitants) and municipalities of
the same type, both concerning total net costs and differences in relation to standard costs.
This comparison has similarities with the one in column 8 in table A, but it illustrates the
differences in costs in a slightly different way.
15
Established by the Swedish Association of Local Authorities and Regions. http://www.skl.se/
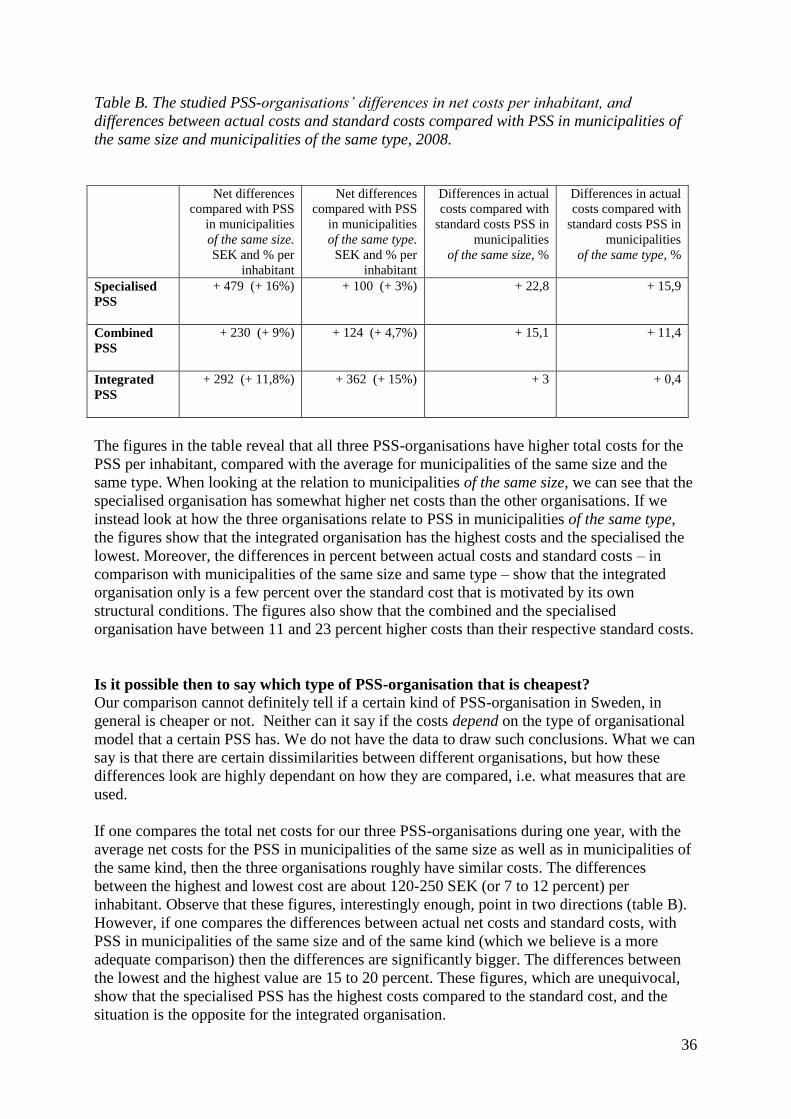
36
Table B. The studied PSS-organisations’ differences in net costs per inhabitant, and
differences between actual costs and standard costs compared with PSS in municipalities of
the same size and municipalities of the same type, 2008.
Net differences
compared with PSS
in municipalities
of the same size.
SEK and % per
inhabitant
Net differences
compared with PSS
in municipalities
of the same type.
SEK and % per
inhabitant
Differences in actual
costs compared with
standard costs PSS in
municipalities
of the same size, %
Differences in actual
costs compared with
standard costs PSS in
municipalities
of the same type, %
Specialised
PSS
+ 479 (+ 16%) + 100 (+ 3%) + 22,8 + 15,9
Combined
PSS
+ 230 (+ 9%) + 124 (+ 4,7%) + 15,1 + 11,4
Integrated
PSS
+ 292 (+ 11,8%) + 362 (+ 15%) + 3 + 0,4
The figures in the table reveal that all three PSS-organisations have higher total costs for the
PSS per inhabitant, compared with the average for municipalities of the same size and the
same type. When looking at the relation to municipalities of the same size, we can see that the
specialised organisation has somewhat higher net costs than the other organisations. If we
instead look at how the three organisations relate to PSS in municipalities of the same type,
the figures show that the integrated organisation has the highest costs and the specialised the
lowest. Moreover, the differences in percent between actual costs and standard costs – in
comparison with municipalities of the same size and same type – show that the integrated
organisation only is a few percent over the standard cost that is motivated by its own
structural conditions. The figures also show that the combined and the specialised
organisation have between 11 and 23 percent higher costs than their respective standard costs.
Is it possible then to say which type of PSS-organisation that is cheapest?
Our comparison cannot definitely tell if a certain kind of PSS-organisation in Sweden, in
general is cheaper or not. Neither can it say if the costs depend on the type of organisational
model that a certain PSS has. We do not have the data to draw such conclusions. What we can
say is that there are certain dissimilarities between different organisations, but how these
differences look are highly dependant on how they are compared, i.e. what measures that are
used.
If one compares the total net costs for our three PSS-organisations during one year, with the
average net costs for the PSS in municipalities of the same size as well as in municipalities of
the same kind, then the three organisations roughly have similar costs. The differences
between the highest and lowest cost are about 120-250 SEK (or 7 to 12 percent) per
inhabitant. Observe that these figures, interestingly enough, point in two directions (table B).
However, if one compares the differences between actual net costs and standard costs, with
PSS in municipalities of the same size and of the same kind (which we believe is a more
adequate comparison) then the differences are significantly bigger. The differences between
the lowest and the highest value are 15 to 20 percent. These figures, which are unequivocal,
show that the specialised PSS has the highest costs compared to the standard cost, and the
situation is the opposite for the integrated organisation.
37
If the differences in key figures are related to our research results (i.e. all studies within our
project) it is possible to express the differences like this. No matter which category we have
studied (clients, social workers, managers or politicians) and how we have studied them (by
questionnaires, interviews or focus groups) and which kind of questions we have asked (about
actual conditions, experiences or attitudes), the research results points in the same direction.
The integrated PSS-organisation appears to be more advantageous (or less disadvantageous)
for clients and social workers, than the other two organisations. For the specialised
organisation, the situation is the opposite. Thus, the combined PSS is somewhere in between.
All in all, most of the key figures show that the integrated organisation costs almost as much
as the combined organisation – and nearly as much as PSS in municipalities of the same size
and of the same type – and that these two organisations has lower costs than the specialised
organisation. However, the comparison of differences in relation to the standard costs,
indicate that the differences, in fact, are bigger. Here the integrated PSS diverges from the
combined and the specialised, by being very close to other organisations in comparable
Swedish municipalities. Viewed this way, the integrated PSS appear less costly than the other
two organisations.
Nevertheless, it is important to remember that the key figures on costs only show one side of
the coin. In this case the costs must be related to our research results that show that the quality
(at least the aspects we have studied)16
of the social work, is higher in the integrated
organisation. Considered that the costs appear to be lower (or at least not higher) and the
quality is higher, it is possible to assume that the integrated organisation offers most value for
money, the specialised least and the combined something in between. It is difficult to pinpoint
the characteristics of the combined organisation. Throughout the entire research project, the
combined PSS partly demonstrates similarities with the integrated, and partly similarities with
the specialised organisation. Even if the results and key figures are not directly generalizeable
to other similar PSS-organisations, at least they demonstrate that it in fact is possible to
organise the PSS, in a way that benefits clients as well as social workers, without
automatically having much higher costs than in comparable municipalities.
In order to describe how costs and quality of services relate to each other in different types of
PSS-organisations in general, it is necessary to study a larger number of statistically
representative organisations. We believe that our research project17
– in which the client study
is one of the parts – has laid a foundation for that by producing a number of significant results
that can work as hypotheses in future research projects in this area.
Additional remarks
One person, which commented on the previous version of this paper, argued that the work
climate within a PSS-organisation is by far more important for the results, than the actual
organisational model. Work climate is in this context regarded as the social workers‟ working
environment, primarily interpersonal factors, e.g. leadership. We have also noticed the
importance of the work climate in a study made by Armelius (2002) who studied the effect of
treatment at psychiatric treatment clinics. That study showed that the work climate – in terms
of the staffs‟ experienced influence, demands and support – had greater impact on the results,
16
We are aware of that quality in social work can be studied in different ways (e.g. Kazi, 2003; Osborne, 1992;
Unrau, Gabor & Grinnel, 2006). 17
The main project is “Specialization or integration in the Personal social services? Effects on interventions and
results”.
38
than the actual treatment. Consequently, there seems to be reason to reflect upon the idea that
the work climate is more important for the results, than the organisational model.
Let us make a thought experiment and imagine a really negative work climate for the social
workers in the integrated organisation.18
Should the clients then be that content with the
interventions and the results? We consider that highly unlikely. Logically regarded, the work
climate hence is an important aspect of a successful PSS. If we instead imagine an excellent
work climate in the specialised organisation, would that have resulted in clients being as
satisfied as the clients in the integrated organisation? That is hardly plausible, because too
much of the clients‟ expressed dissatisfaction relates to such organisational characteristics that
a positive work climate per se hardly can remedy. By way of example, organisational
specialisation leads to contacts with more units and persons, which is something most clients
disapprove of. Consequently, there are organisational characteristics – analytically separable
from the work climate – that influence the clients‟ experiences of the interventions and the
results.
However, almost irrespective of which kind of organisation that is being studied, it is
reasonable to believe that the variables work climate and organisational model each
influences the result, in different ways. It can also be assumed that the organisational model
exerts an influence on the work climate. But it can also be the other way around; sometimes
work climate influences the concrete tailoring of a certain model, i.e. the organising process
in practice. Such dialectical processes probably influence the results further. Consequently we
agree with the standpoint that the work climate has significant bearing on the results.
Nevertheless, that does not contradict the fact that the organisational model in itself is very
important. This intricate connection between work climate, organisational model and results,
is thus something that deserves to be studied more in detail later on.
18
For pedagogical reasons only the extremes are discussed here, i.e. the specialised and the integrated
organisation.
39
References
Armelius, B-Å. (2002). Effekten av vård på psykiatriska behandlingshem. Slutrapport nr 25
från behandlingshemsprojektet. Umeå: Umeå universitet, Institutionen för psykologi.
Astvik, W., & Aronsson, G. (1999). Home Care Workers as Specialists or Generalists -
Quality in Work and Care. In Proceedings / Work, Stress and Health ´99, Organisation of
Work in a Global Economy, 11-13 March 1999, Baltimore, Maryland, USA.
Bergmark, Å., & Lundström, T. (1998). Metoder i socialt arbete [Methods in social work],
Socialvetenskaplig Tidskrift, 5, pp. 291-314.
Bergmark, Å. & Lundström, T. (2005). En sak i taget? Om specialisering inom socialtjänstens
individ- och familjeomsorg. [One Thing at the Time. On Specialisation Within the Personal
Social Services]. Socialvetenskaplig tidskrift, 2-3, 125-148.
Bergmark, Å. & Lundström, T. (2007). Unitarian ideals and professional diversity in social
work practice the case of Sweden. European Journal of Social Work, Vol. 10, No. 1, pp. 55-
72.
Bernler, G., Johnsson, L., Skårner, A. (1993). Behandlingens villkor [Conditions for
Treatment], Stockholm, Natur och Kultur.
Billquist, L. (1999). Rummet, mötet och ritualerna. [The Room, the Meeting and the Rituals],
Doctoral thesis, Department of Social Welfare, Göteborg University, Sweden.
Blom, B. (1998). Marknadsorientering av socialtjänstens individ- och familjeomsorg [Market
Orientation of the Personal Social Services]. Doctoral thesis, Department of Social Welfare,
Umeå University, Sweden.
Blom, B. (2002). The social worker-client relationship – a Sartrean approach. European
Journal of Social Work, vol 5, no 3: 23-31
Blom, B. (2004). Specialisation in social work practice – effects on interventions in the
personal social services. Journal of Social Work (vol 4:1), 25-46.
Blom, B. & Morén, S. (2007). Insatser och resultat i socialt arbete [Interventions and Results
in Social Work Practice]. Lund, Studentlitteratur.
Blom, B. & Morén, S. (2009/fortcoming) Explaining social work practice – the CAIMeR-
theory. Journal of Social work (accepted September, 2008).
Boklund, A. (1995). Olikheter som berikar? [Enriching Dissimilarities?], Doctoral thesis,
Department of Social Welfare, Stockholm University, Sweden.
Boström, G. (2008). Hälsa på lika villkor? [Health on equal terms? Health and living
conditions among disabled people]. Östersund, Statens folkhälsoinstitut (Swedish National
Institute of Public Health) 2008:17.
Bowes, A. M., & Dar, N. S. (2000). Researching social care for minority ethnic older people:
implications of some Scottish research, British Journal of Social Work, 3, pp. 305-321.
40
Börjeson, B., & Håkansson, H. (1990). Hotade, Försummade, Övergivna [Threatened,
Neglected, Abandoned], Stockholm, Rabén & Sjögren.
Cambridge, P. & Parkes, T. A. (2006). The Tension between Mainstream Competence and
Specialisation in Adult Protection: An Evaluation of the Role of the Adult Protection Co-
ordinator. British Journal of Social Work, 36, 299–321.
Challis, D. & Ferlie, E. (1988). „The myth of generic practice: specialisation in social work‟,
Journal of Social Policy , vol. 17, pp. 1 22.
Children and Parents Code (SFS 1949:381).
Danermark, B., & Kullberg, C. (1999). Samverkan – välfärdsstatens nya arbetsform [Co-
operation – the New Work Form of the Welfare State], Lund, Studentlitteratur.
Doel, M. (1997). Social Work Practice Revisited: Generalist and Specialist Practice.
Occasional Monograph, Faculty of Health and Community Care, University of Central
England in Birmingham.
Forsberg, E., Löfgren, U.-B., & Tilander, K. (2003). ”Ja handläggaren är ju bra men hon är
ju ändå en del av systemet". En studie om socialbidrag och bemötande (Arbetsrapport
2003:3). Karlstad: Karlstads universitet, Institutionen för samhällsvetenskap.
Frank, J.D., & Frank, J. B. (1991). Persuasion and Healing. A Comparative Study of
Psychotherapy, Baltimore, The John Hopkins University Press.
Froggett, L. (1996). Instrumentalism, knowledge and gender in social work, Journal of Social
Work Practice, 2, pp. 119-127.
Fuller, R. & Tulle-Winton, E. (1996). Specialism, genericism and others: Does it make a
difference? A study of social work services to elderly people, British Journal of Social Work,
5, pp. 679-698.
Healy, K. & Meagher G. (2007). „Social Workers‟ Preparation for Child Protection:
Revisiting the Question of Specialization,‟ Australian Social Work, 60(3): 321-335.
Howe, D. (1987). An Introduction to Social Work Theory, Aldershot, Ashgate.
http://www.skl.se/
Hubble, M.A., Duncan, B.L. and Miller, S.D. (eds) (1999). The Heart and Soul of Change.
What Works in Therapy. Washington, DC, American Psychological Association.
Johansson, S. (2002). Socialtjänsten som organisation - En forskningsöversikt [The Social
Services as Organisation – A Research review]. Stockholm, Socialstyrelsen.
Kazi, M.A.F. (2003). Realist evaluation in practice: health and social work. London: Sage.
41
Kristiansen, A. (1999). Fri från narkotika [Free from drugs]. Doctoral thesis, Department of
Social Welfare, Umeå University, Sweden.
Landelius, P.-S. (2004). Sexuell läggning och bemötande i socialtjänsten. Stockholm,
Socialstyrelsen.
Local Government Act (SFS 1991:900)
Lorentzon, L. (1991) Vredens pedagogik [The Pedagogy of Wrath]. Stockholm, Rabén &
Sjögren.
Lundgren, M., Blom, B., Morén, S., & Perlinski M. (2009). Från integrering till
specialisering – om organisering av socialtjänstens individ- och familjeomsorg 1988-2008.
Socialvetenskaplig tidskrift, 16:2, 162-183.
Miley, K. K., O'Melia, M. W. & DuBois, B. L. (2009). Generalist Social Work Practice: An
Empowering Approach (6th Ed.). Boston, Allyn & Bacon.
Minas, R. (2005). Administrating poverty: studies of intake organisation and social
assistance in Sweden, akademisk avhandling, Institutionen för socialt arbete, Stockholms
universitet, Stockholm.
Morén, S. (1994a). „Social work is beautiful. On the characteristics of social work‟,
Scandinavian Journal of Social Welfare, 3, pp. 158-66.
Morén, S. (1994b). „Social work organisations from within‟, International Social Work, 3, pp.
277-293.
Morén, S. & Blom, B. (2003). Explaining human change. On generative mechanisms in social
work practice. Journal for Critical Realism 2:1, 37-61.
Morén, S., Blom, B., Lundgren, M. & Perlinski, M. (forthcoming). Specialisering eller
integration? En studie av socialarbetares arbetssätt och attityder i tre organisationsformer.
[Specialisation or Integration? A Study of Social Workers Working Modes and Attitudes in
three forms of organisations].
Osborne. S.P. (1992). The quality dimension. Evaluating quality of service and quality of life
in human services. British Journal of Social Work, 22, 437-453.
Paulsson, K, Karlsson, A-S. & Wadman, C (2009). Hälsa på lika villkor. Resultat från
Nationella folkhälsoenkäten – 2008 (Health on equal terms. Results from the national health
survey – 2008).Östersund, Statens folkhälsoinstitut (Swedish National Institute of Public
Health). An on-line version accessible: http://www.fhi.se/Documents/Statistik-
uppfoljning/Folkhalsoenkaten/Resultat-2008/Halsa-pa-lika-villkor-2008.pdf
or: http://www.fhi.se/Documents/Statistik-uppfoljning/Folkhalsoenkaten/Resultat-
2008/Sociala-relationer-090511.pdf
Perlinski, M., Blom, B. & Morén, M. (2009). Om specialisering och integration i
socialtjänstens IFO. En totalundersökning av socialarbetares klientarbete attityder och hälsa
i tre kommuner. Working paper. http://www8.umu.se/socw/personal/Socialtj.pdf
42
Perlinski, M., Blom, B., Morén, S. & Lundgren, M. (forthcoming). The dialectics between
specialisation and integration. Politicians‟ and managers‟ views on forms of organisation in
the Swedish social services. Administration in social work.
Pettersson, U. (1986). Socialtjänsten i praktiken [The Social Services in Practice], Stockholm,
Skeab förlag.
Scales, T. L. & Wolfer, T. A. (2005). Decision Cases for Generalist Social Work Practice:
Thinking Like a Social Worker. Belmont, Calif:, Thomson.
SCB & SKL (2007). Vad kostar verksamheten i Din kommun? Bokslut 2006. Stockholm:
Statistiska centralbyrån och Sveriges Kommuner och Landsting.
SCB & SKL (2008). Vad kostar verksamheten i Din kommun? Bokslut 2007. Stockholm:
Statistiska centralbyrån och Sveriges Kommuner och Landsting.
SCB & SKL (2009). Vad kostar verksamheten i Din kommun? Bokslut 2008. Stockholm:
Statistiska centralbyrån och Sveriges Kommuner och Landsting.
SFS 1993:100, latest revision 2008:944
Skogens, L. (2001). Olika organisationsformer – olika bemötande?[Different Organisational
Forms – Different Treatment?], Institutionen för socialt arbete, Stockholms universitet,
Stockholm.
Social Services Act (SFS 2001:453)
SOU [Government report] 1997:51
SOU [Government report] 1998:16
Sunesson, S. (1985). Ändra allt! En uppmaning till socialarbetare [Change Everything! A
Call to Social Workers], Stockholm, Liber förlag.
Sunesson, S. (1990). Familjevården, en del av individ- och familjeomsorgen i socialtjänsten
[Family Care, a Part of the Personal Social Services], in Sju perspektiv på barns och
ungdomars levnadsförhållanden, SoS-rapport 1990:5. Stockholm, Socialstyrelsen.
Swedish Higher Education Act, appendix 2,
Söderfäldt, M. (1997). Burnout? (Meddelanden från Socialhögskolan 1997:2), Lund, Lunds
universitet.
Timberlake, E. M, Zajicek Farber, M. & Sabatino, C. A. (2007). Generalist Social Work
Practice: A Strengths-Based Problem Solving Approach (5th Edition). Boston, Allyn &
Bacon.

43
Unrau, Yvonne, Gabor Peter A. & Grinnel, Richard (2006). Evaluation in Social Work: The
Art and Science of Practice. (4th ed.) Oxford University Press.
Walsh, J. (2008). Generalist Social Work Practice: Intervention Methods. Pacific Grove,
Calif., Brooks Cole.
Wächter, R. (1998). Utredning. [Investigation], In V. Denvall & T. Jacobsson (Red.),
Vardagsbegrepp i socialt arbete. Ideologi, teori och praktik. Stockholm, Norstedts Juridik.
Yanca, S. J. & Johnson, L. C (2007). Generalist Social Work Practice with Families. Boston,
Allyn & Bacon.