ORGANISATIONAL CULTURE AS A PREDICTOR OF …
77
ORGANISATIONAL CULTURE AS A PREDICTOR OF PERFORMANCE: A CASE STUDY IN LIBERTY LIFE Tania Geldenhuys A research project submitted to the Gordon Institute of Business Science, University of Pretoria, in partial fulfilment of the requirements for the degree of MASTERS OF BUSINESS ADMINISTRATION. NOVEMBER 2006 © University of Pretoria
Transcript of ORGANISATIONAL CULTURE AS A PREDICTOR OF …

ORGANISATIONAL CULTURE AS A PREDICTOR OF
PERFORMANCE: A CASE STUDY IN LIBERTY LIFE
Tania Geldenhuys
A research project submitted to the Gordon Institute of Business Science,
University of Pretoria, in partial fulfilment of the requirements for the degree of
MASTERS OF BUSINESS ADMINISTRATION.
NOVEMBER 2006
©© UUnniivveerrssiittyy ooff PPrreettoorriiaa

ii
ABSTRACT
______________________________________________________________
Organisational culture is widely celebrated as a legitimate source of corporate
success. The study aimed to investigate the possible relationship between
organisational culture and performance among four departments within Liberty
Life’s Operations division. The objectives were twofold:
The first was to investigate which culture was dominant in each department.
Information from the administration of Wallach’s (1983) organisational culture
index questionnaire to measure the existing organisational culture in the
various departments was obtained from a sample of 170 employees in Liberty
Life.
The second was to assess how the dominant culture affected the
department’s performance in terms of adhering to the agreed service level
agreement. Daily service level agreement adherence results for each
department were used as the performance measure.
The findings from the research indicated that departments with an innovative
culture had a lower percentage of cases outside the agreed service level
agreement than the departments with a bureaucratic or supportive culture.
Recommendations with regard to changing organisational culture to support
high adherence to service level agreement are also discussed.

iii
DECLARATION
______________________________________________________________
I declare that this research project is my own work. It is submitted in partial
fulfilment of the requirements for the degree of Master of Business
Administration at the Gordon Institute of Business Science, University of
Pretoria. It has not been submitted before for any degree or examination in
any other University.
____________________
Tania Geldenhuys
14 November 2006
iv
ACKNOWLEDGEMENTS
______________________________________________________________
I would like to acknowledge and thank the following people for their valued
assistance.
Terrence Taylor of the Gordon Institute of Business Science for his
enthusiastic commitment as my supervisor and for his valuable comments.
The management team and staff at Liberty Life who supported me through the
process and who participated in the surveys.
My family & fiancé for their continuous support and encouragement.

v
TABLE OF CONTENTS
ABSTRACT...................................................................................................... ii ACKNOWLEDGEMENTS ............................................................................... iv TABLE OF CONTENTS................................................................................... v CHAPTER 1.....................................................................................................1
DEFINITION OF THE PROBLEM ................................................................1 1.1 INTRODUCTION............................................................................1 1.2 PREVIOUS RESEARCH ...............................................................1 1.3 ORGANISATIONAL CULTURE & PERFORMANCE.....................2 1.4 MOTIVATION FOR RESEARCH ...................................................3 1.5 THE RESEARCH PROBLEM ........................................................4
CHAPTER 2.....................................................................................................5
LITERATURE REVIEW................................................................................5 2.1 ORGANISATIONAL CULTURE .....................................................5
2.1.1 DEFINITIONS OF ORGANISATIONAL CULTURE.....................5 2.1.2 APPROACHES TO ORGANISATIONAL CULTURE..................7 2.1.3 MULTIPLE LEVELS OF ORGANISATIONAL CULTURE...........9 2.1.4 ORGANISATIONAL CULTURE TYPES...................................12
2.1.4.1 CULTURE TYPES..............................................................12 2.1.4.2 SINGLE OR MULTIPLE CULTURE TYPES .......................17
2.1.5 ORGANISATIONAL CULTURE AS A COMPETITIVE ADVANTAGE ...........................................................................18
2.2 PERFORMANCE...........................................................................19 2.2.1 DEFINITION OF PERFORMANCE ...........................................19 2.2.2 FACTORS AFFECTING PERFORMANCE ...............................21
2.3 ORGANISATIONAL CULTURE AND PERFORMANCE..................22 2.3.1 INTRODUCTION.......................................................................22 2.3.2 INNOVATIVE CULTURE AND PERFORMANCE .....................23 2.3.3 SUPPORTIVE CULTURE AND PERFORMANCE....................24 2.3.4 STRENGTH OF CULTURE AND PERFORMANCE ................25
2.4 CONCLUSION .............................................................................26 CHAPTER 3...................................................................................................28
RESEARCH PROBLEM.............................................................................28 3.1 RESEARCH QUESTIONS ...........................................................28
3.1.1 Research question 1: What culture type is the most dominant in each department within Liberty Life Operations?......................28
3.1.2 Research question 2: Will an innovative culture result in a higher .......................................................................................28
3.2 PROPOSED OUTCOME OF RESEARCH...................................29
vi
CHAPTER 4...................................................................................................30 PROPOSED RESEARCH METHODOLOGY.............................................30
4.1 RESEARCH METHODOLOGY....................................................30 4.1.1 ORGANISATIONAL CULTURE RESEARCH...........................30 4.1.2 PERFORMANCE INDICATORS...............................................31
4.2 POPULATION..............................................................................31 4.3 SAMPLING METHOD..................................................................32 4.4 DATA COLLECTION & ANALYSIS..............................................33 4.5 POTENTIAL RESEARCH LIMITATIONS.....................................35
CHAPTER 5...................................................................................................37
RESEARCH RESULTS..............................................................................37 5.1 INTRODUCTION..........................................................................37 5.2 FIRST RESEARCH QUESTION ..................................................37
5.2.1 DOMINANT CULTURE IN CLAIMS DEPARTMENT ................37 5.2.2 DOMINANT CULTURE TYPE IN DISBURSEMENTS & POLICY
CHANGES DEPARTMENT ......................................................38 5.2.3 DOMINANT CULTURE TYPE IN DECENTRALISED
OPERATIONS..........................................................................38 5.2.4. DOMINANT CULTURE TYPE IN ACTUARIAL DEPARTMENT
.................................................................................................39 5.3 SECOND RESEACH QUESTION................................................40
5.3.1 CLAIMS DEPARTMENT ..........................................................41 5.3.2 DISBURSEMENTS & POLICY CHANGES DEPARTMENT......43 5.3.4 DECENTRALISED OPERATIONS DEPARTMENT .................45 5.3.5 ACTUARIAL DEPARTMENT ....................................................47
CHAPTER 6...................................................................................................50
DISCUSSION OF RESULTS......................................................................50 6.1 DOMINANT CULTURE TYPE PER DEPARTMENT....................50 6.2 RELATIONSHIP BETWEEN ORGANISATIONAL CULTURE AND
PERFORMANCE ........................................................................51 CHAPTER 7...................................................................................................54
CONCLUSION ...........................................................................................54 REFERENCES...........................................................................................56
APPENDIX 1: ORGANISATIONAL CULTURE INDEX .................................62 APPENDIX 2: ORGANISATIONAL CULTURE INDEX RESULTS................63 APPENDIX 3: PERFORMANCE RESULTS..................................................66

1
CHAPTER 1
DEFINITION OF THE PROBLEM
1.1 INTRODUCTION
As recently as January 2006, the president of a global human resources
consulting company stated that high performance is more than a dream; it is a
culture (Rogers 2006). This statement forms the basis of this research.
The study aims to investigate the possible relationship between organisational
culture and performance among four departments within Liberty Life’s
Operations division. The objectives are twofold: firstly it will attempt to
investigate which culture is dominant in each department and secondly it will
attempt to assess how culture affects the department’s performance in terms
of adhering to the agreed service level agreements (SLA).
1.2 PREVIOUS RESEARCH
Most previous research in this field focused on the impact of corporate culture
on financial performance (Kotter & Heskett 1992; Denison, 1990). In these
studies financial performance was based on return on assets and return on
investment. This research explores the impact of organisational culture on
non-financial performance indicators. Even though non-adherence to service
level agreements can result in reputational damage and will ultimately effect
the bottom-line of the organisation, this study will not focus on the effect on
the financial bottom-line.

2
1.3 ORGANISATIONAL CULTURE & PERFORMANCE
When organisations attempt to improve their operations in response to new
data from the economic, political and technological environment, we realise
the critical role that culture plays in this process (Schein, 1996). This is
exactly the situation that the long-term insurance sector finds itself in. For the
first time, long-term insurance companies must operate in a sustained period
of low inflation and a low interest rate environment. Liberty Life, like many
others in the sector, is forced to improve its operations to remain profitable.
This view was supported by an international study commissioned by Deloitte
in 2004 where 80 senior insurance executives where asked whether improved
operations will improve profitability. Eighty six percent (86%) were of the
opinion that it would (Ryan, 2004).
Chart 1: "Improved insurance operations are the best route to strong profitability"
disagree 14%
agree 86%

3
It is important that managers understand that if adherence to service level
agreements is important, a sure way to achieve this is by ensuring that the
prevailing culture in the department supports this goal. Organisational culture
is one of many factors that can influence performance, but if the behaviour
and attitudes of the employees are supporting an adherence to service level
agreements, a major obstacle has been overcome. Organisational culture
serves as a control mechanism that guides and shapes the attitudes and
behaviour of employees (Nayager & Van Vuuren, 2005). Culture allows
organisations to develop a core set of assumptions, understandings and
implicit rules that govern day-to-day behaviour in the workplace (Robbins,
1996 ). An innovative culture that encourages entrepreneurial intensity has a
direct and positive influence on company performance (Morris & Kuratko,
2002). This research will focus on whether an innovative culture in Liberty
Life Operations will have a positive effect on the performance of the
department.
1.4 MOTIVATION FOR RESEARCH
• Insurance companies are operating in a highly regulated environment
where policyholders have become more sophisticated and better
informed. The greater sophistication of policyholders resulted in a
demand for a higher and faster level of service. This research will
show that creating the appropriate organisational culture in an
organisation can improve service.
• The need for insurance companies to raise profitability by increasing
efficiency in core processes.
4
• Due to the increase in competitiveness between insurance companies
it is not viable for insurance companies to compete on products.
Companies are now forced to compete on service. By ensuring that the
dominant culture supports performance on service delivery, companies
can gain a sustainable competitive advantage.
1.5 THE RESEARCH PROBLEM
The objective of the study will therefore be the assessment of the impact of
organisational culture on a department’s ability to adhere to the internal
service level agreement of five days.
The research will attempt to answer the following questions:
• What culture type is the most dominant in each department?
• Will an innovative culture result in a higher adherence to the service
level agreement than bureaucratic and supportive cultures?
5
CHAPTER 2
LITERATURE REVIEW
The literature review will cover three main areas of theories. The aim of the
first section, which is related to the definition and understanding of
organisational culture, is to provide some insight on the theory of
organisational culture and the various ways of categorising culture types.
The second section covers the principles of performance. The purpose of this
section was to provide insight into the definition of performance for purposes
of this research.
The theory on the relationship between organisational culture and
performance forms the basis of the third area of the literature review. This
section aimed to provide insight into the various views of the relationship
between culture and performance.
2.1 ORGANISATIONAL CULTURE
2.1.1 DEFINITIONS OF ORGANISATIONAL CULTURE
Corporate culture has been defined in many ways by various authors and
researchers. According to Bagraim (2001), there is no single universally
accepted definition of the term and this has lead to a great deal of conceptual
confusion and ambiguity in the literature. At the most fundamental level,
organisational culture refers to a set of values that are shared by a group of

6
people that persist over time, even when there is a change in group members.
At the more visible level, culture refers to a set of behaviours that are common
among members of a group because these behaviours are expected by
everyone (Kotter, 1995).
The earliest and most prominent researcher on organisational culture was
Schein. Edgar Schein (1984) defines organisational culture as the pattern of
basic assumptions that a given group has invented, discovered, or developed
in learning, and that has worked well enough to be considered valid and
therefore to be taught to new members. It becomes the common language
and the common background. Culture therefore arises out of what has been
successful for the organisation.
A culture is formed as a result of solutions to problems that the group is
facing. Therefore, culture can also be defined as the solution to the problems
that a group will face. Schein (1984) identifies two problems that a group can
face: The first kind of problem is related to the basic survival of the group.
This will include problems relating to their primary task, basic function and the
ultimate mission of the group. The second kind of problem is related to the
ability of the group to function as a group. In this study, each department was
presented with a problem that needed solving. Each department had to strive
to adhere to the agreed service level agreement. The dominant culture in
each department will be an indicator of firstly how they will perform their task
to achieve this goal and secondly how they function as a group. According to
Van der Post, de Coning and Smit (1998) culture is, to the organisation, what

7
personality is to the individual. It is a hidden but unifying force that provides
meaning and direction that is based on the system of shared meanings,
values and beliefs that ultimately shapes employees’ behaviour.
Van den Berg defines organisational culture as shared perceptions of
organisational work practices within organisational units that may differ from
other organisational units (Van den Berg & Wilder, 2004). It appears that
organisational culture is unique to a particular unit. It is therefore possible that
for purposes of this research each department can have a unique culture.
According to Van der Berg (2004) organisational values are expressed in
organisational practices that can be derived from the existing practice within
the organisation, department or work unit. This view is support Schein’s
statement that “there cannot be a culture unless there is a group that owns it
(1984, p3). According to Schein (1984) a given group is a set of people that
have been together long enough to have shared significant problems; who
had the opportunities to solve these problems and finally who have taken new
members.
2.1.2 APPROACHES TO ORGANISATIONAL CULTURE
Smircich (1983) drew a clear distinction between two approaches in
understanding organisational culture. One approach assumes that
organisational culture is a root metaphor, while the other approach assumes
that organisational culture is a variable.

8
The first approach adopts a structural-functionalist view (Bagraim, 2001). This
approach views culture as something an organisation “has” as opposed to
something that the organisation “is” (Smircich, 1983). It emphasises that
organisations are producers of culture that maintain social structures. The
assumption here is that the organisation “has” a certain collective culture and
the particular culture was created to support the existing structure or strategy.
The second approach views organisational culture as another internal variable
that will affect performance. The reason is that culture is merely another
variable in the set of relationships organisations have with their environment
(Maull, Brown & Cliff, 2001). As an internal variable, organisational culture can
be managed and designed for organisational success and performance. This
research will focus on organisational culture as an internal variable that has
special causal importance for organisational performance.

9
2.1.3 MULTIPLE LEVELS OF ORGANISATIONAL CULTURE
Organisational culture can be analysed at several different levels, as shown in
figure 1. This implies that there are different levels of cultural phenomena in
organisations (Schein, 1984 & Bagraim, 2001).
Figure 1: Levels of Corporate Culture
Artefacts
Norms
Values
Basic Assumptions

10
a) Artefacts: This is the tangible and visible aspects of culture shared by
members of organisations that are the manifestations of the culture
(Denison, 1990). Examples are office layout, manner of dress, public
documents such as charters, employee orientation material (Schein,
1984). This visible level is easily obtainable hence artefacts are at the
highest level of cultural awareness. Artefacts are difficult to interpret
as it is not easily understandable why offices are laid out in a certain
manner and why people dress in a certain way. The underlying logic is
derived from the next layer.
b) Norms: The second layer of cultural awareness is the norms that are
guiding members regarding the appropriate behaviour in a particular
situation (Cummings & Worley, 2005). This will involve how members
define and interpret situations of organisational life and prescribe the
bounds of acceptable behaviour (Denison, 1990). These represent the
unwritten rules of behaviour.
c) Values: Culture is created as a result of solutions to problems that the
group are facing. Values reflect the members’ preferred means of
resolving the problems that the group are facing (Denison, 1990). The
values are the guiding principles of the group’s behaviour, irrespective
of whether they are right or wrong, or whether they include the values
that ought to be in the organisation.

11
d) Assumptions: At the deepest level of cultural awareness are taken-
for-granted assumptions about how organisational problems should be
solved (Cummings & Worley, 2005). According to Schein (1984) to
really understand a culture and to understand the group’s values and
behaviours, it is imperative to delve into the underlying assumptions
which are typically unconscious but which actually determine how
group members perceive, think and feel. These assumptions are not
easily recognisable and difficult to change (Bagraim, 2001). If
assumptions at the deepest level of cultural awareness are the most
difficult to change, artefacts must be the easiest to change. It appears
to be logical as dress codes, office layout and charters are easy to
change. The difficulty lies in changing the underlying values and
behaviours underlying the artefacts.
The above four levels of culture are arranged in order of abstractness with
artefacts as the most apparent manifestation of culture (Denison, 1990). In
contrast to Schein’s typology of organisational culture, Denison’s typology
focuses on the concrete actions, conditions, and practices that are rooted in
an organisation’s value system. Denison (1982) divided culture in the
following levels:
• The values and beliefs that underlie actions;
• The patterns of behaviour that reflect and reinforce those values; and
• The set of conditions, created by these patterns of behaviour, within
which organisational members must function.
12
The difference between the abstract (Schein) and concrete (Denison) is
relevant when research methodology is considered. The concrete
classification of culture may be more warranted when the level of culture
being researched is more concrete than abstract (Denison, 1990). The more
concrete the culture, the easier is will be to do comparative research between
various cultures. Wallach’s organisational culture index, which will be used in
this research, focuses on the more concrete levels of culture. The downside
of this research methodology is that detail is being compromised for
generalisation.
2.1.4 ORGANISATIONAL CULTURE TYPES
Organisational literature acknowledges the difficulty of identifying a typical
framework for different organisational culture types mainly because the
shared assumptions and understanding lie beneath the conscious level of
individuals (Lund, 2003). There are multiple classifications of organisational
culture types. This culture type classification by Wallach (1983), Denison
(1990), Cameron and Freedman (1991) and Deshpande & Farley (1999) will
be used in this research.
2.1.4.1 CULTURE TYPES
Wallach’s (1983) organisational culture index profiles cultures in three
stereotypical dimensions:
• bureaucratic;
• innovative; and
13
• supportive
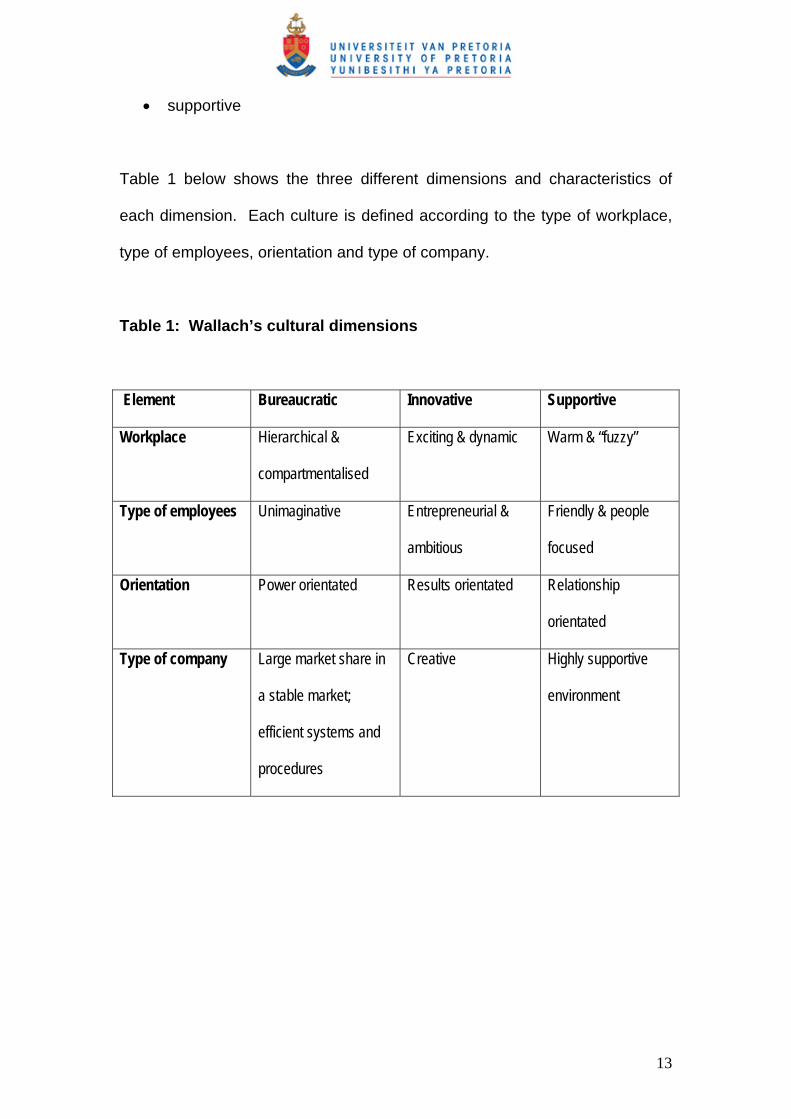
Table 1 below shows the three different dimensions and characteristics of
each dimension. Each culture is defined according to the type of workplace,
type of employees, orientation and type of company.
Table 1: Wallach’s cultural dimensions
Element Bureaucratic Innovative Supportive
Workplace Hierarchical &
compartmentalised
Exciting & dynamic Warm & “fuzzy”
Type of employees Unimaginative Entrepreneurial &
ambitious
Friendly & people
focused
Orientation Power orientated Results orientated Relationship
orientated
Type of company Large market share in
a stable market;
efficient systems and
procedures
Creative Highly supportive
environment

14
Denison (1990) followed by classifying culture into four “hypotheses”:
Table 2: Denison’s four “hypothesis”
“Hypotheses” Characteristics
Involvement • members are involved in decision-making process;
• leaders are elected by the members;
• informal control system;
• high degree of “self-management”.
Consistency • internal control system based on shared system of values,
beliefs and symbols;
• values are widely understood in organisation;
• high ability to reach consensus on decisions;
• clear set of “do’s” and “don’ts”.
Adaptability • system of norms that will allow organisation to interpret
signals from external environment and promote internal
behaviour changes that increase chances of survival;
• capacity to restructure and reinstitutionalise a set of
behaviours and processes that allow organisation to adapt.
Mission • importance of a shared definition on the function and
purpose of the organisation;
• clear direction and goals.

15
Cameron and Freeman (1991) identified four organisational culture types:
• clan;
• adhocracy;
• hierarchy;
• market
The model below shows the dominant attributes, leader style, basis for
coupling and strategic emphasis of each culture type as per Cameron &
Freeman.
Table 3: Model of organisational culture types
Type: Clan Type: Adhocracy Type: Hierarchy Type: Market
ATTRIBUTES cohesiveness,
participation,
teamwork,
sense of family
entrepreneurship,
creativity,
adaptability
order, rules and
regulation,
uniformity
competitiveness,
goal
achievement
LEADER
STYLE
mentor,
facilitator,
parent-figure
entrepreneur,
innovator, risk
taker
coordinator,
administrator
decisive,
achievement
orientated
COUPLING loyalty,
tradition,
interpersonal
cohesion
entrepreneurship,
flexibility, risk
rules, policies and
procedures
goal orientation,
production,
competition
EMPHASIS
focusing on
developing
focusing on
innovation, growth,
focusing on
stability,
focusing on
competitive

16
human
resources,
commitment &
morale
new resources predictability,
smooth operations
advantage and
market
superiority
Source: Adapted from Lund (2003)
In later research the authors (Deshpande & Farley 1999) identified four types
of cultures:
• competitive;
• entrepreneurial;
• bureaucratic; and
• consensual.
In the competitive culture, values relating to demanding goals, competitive
advantage, marketing superiority and profits were emphasized. If one
compares this to the classification of Wallach and Cameron, the competitive
culture equals elements of the innovative culture of Wallach, market culture of
Cameron and adaptability culture of Denison.
Cameron’s adhocracy culture type and Wallach’s innovative culture contains
elements of entrepreneurial culture as defined by Deshpande et al. According
to him the emphasis in the entrepreneurial culture was on innovation, risk
taking, high levels of dynamism and creativity. Both Deshpande and Wallach
identified a bureaucratic culture type where values like formalisation, rules and

17
standard operating procedures were important (Rashid, Sambasivan and
Johari 2003). The elements of this culture type compare to Cameron’s
hierarchy culture type.
In the consensual culture, elements of tradition, loyalty, personal commitment
and extensive socialisation are important in the organisational values. Similar
values are important to the organisation in Cameron’s clan culture type,
Wallach’s supportive culture type and Denison’s involvement culture.
It is clear from the above classification that even though authors classify
culture types differently, the elements that define the culture types are similar.
It is merely a different name for the same culture type. For purposes of this
research, the framework as presented by Wallach will be used to identify the
dominant culture type per department.
2.1.4.2 SINGLE OR MULTIPLE CULTURE TYPES
Organisational culture represents a common and shared perception held by
members. However, this does not mean that there cannot be subcultures
within any given culture (Tsosa, 2004). Organisations may comprise of
several sub-cultures rather than a single, unified culture (Bagraim, 2001).
Lund extended this view in 2003 when he stated that it is even possible that in
a department attributes of several cultures may be present, some of which
may have opposing values and emphasis. Contradictory interests between
departments, consumers and top management may result in different notions
of what is good, important and appropriate (Bagraim, 2001).

18
It is therefore possible that Liberty Life Operations can consist of various
culture types compared to one uniform culture and that in every department,
more than one culture type might be present. However, for purposes of this
research the dominant culture, which expresses the core values that are
shared by the majority of the department, as well as the subcultures within the
department will be identified, but will not be analysed.
2.1.5 ORGANISATIONAL CULTURE AS A COMPETITIVE ADVANTAGE
Organisational cultural issues are becoming increasingly important as culture
is used as a source of strategic competitive advantage (Martins, 2002).
According to Martins, in order to increase competitiveness in the market
place, organisations are required to adapt to dramatic changes in strategy,
technology, working systems and management styles. An organisation’s
culture must be of such a nature that it can accommodate drastic and
continuous changes. It therefore appears that an innovative culture is a
minimum requirement to achieve a sustainable competitive advantage when
competing on service.

19
2.2 PERFORMANCE
Because this research is performance research with culture as the “cause”
and adherence to service level agreement as the “effect”, it is important to
discuss the main issues relating to performance.
2.2.1 DEFINITION OF PERFORMANCE
The first problem in defining performance is that the definition of performance
will depend on the stakeholder involved. Organisations inevitably have an
array of stakeholders, and any particular measure of performance often tends
to compete against another (Denison, 1990). Shareholders prefer
performance in dividends, while managers regard performance in operational
processes as important. From a traditional perspective, organisational
performance is commonly referred to as financial performance where
considerations of budgets and assets are crucial in determining the overall
bottom-line of an organisation (Yeo, 2003). In this research, performance will
be defined in terms of adherence to the agreed five-day service level
agreement.
According to Langton (2000) performance implies the action of doing things,
using things, and attending to conditions, processing, communicating, and
achieving results. It is not a static concept, but an active concept.
Langdon (2000) describes performance as consisting of four dimensions:
20
a) behaviour;
b) standards;
c) support;
d) human relations.
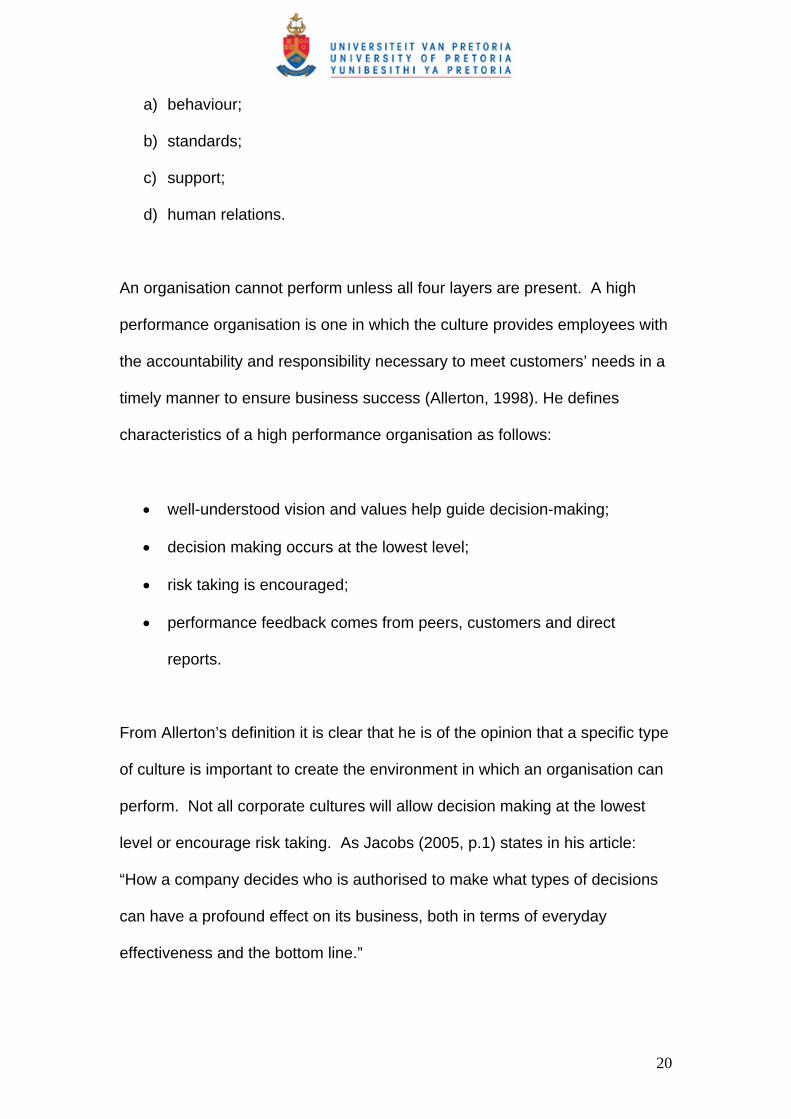
An organisation cannot perform unless all four layers are present. A high
performance organisation is one in which the culture provides employees with
the accountability and responsibility necessary to meet customers’ needs in a
timely manner to ensure business success (Allerton, 1998). He defines
characteristics of a high performance organisation as follows:
• well-understood vision and values help guide decision-making;
• decision making occurs at the lowest level;
• risk taking is encouraged;
• performance feedback comes from peers, customers and direct
reports.
From Allerton’s definition it is clear that he is of the opinion that a specific type
of culture is important to create the environment in which an organisation can
perform. Not all corporate cultures will allow decision making at the lowest
level or encourage risk taking. As Jacobs (2005, p.1) states in his article:
“How a company decides who is authorised to make what types of decisions
can have a profound effect on its business, both in terms of everyday
effectiveness and the bottom line.”

21
2.2.2 FACTORS AFFECTING PERFORMANCE
Cummings & Worley (2005) advocated that six factors other than culture can
affect the performance of organisations. The key components of the six
elements are as follow:
a) Context: Context refers to the environment in which the organisation
operates and includes both external and internal environments.
Organisational characteristics such as business strategy, strategy and
structure as well as organisational culture form part of the context.
b) Purpose: This will represent the goals and objectives of the
organisation. In this study it will focus on the objective of achieving a
five-day service level agreement.
c) Composition & Diversity: The demographics of the group will be
identified in this variable.
d) Structure: Size of the group will be taken into account.
e) Processes: The formation and socialisation processes play a critical
role in the performance of an organisation. This ties back to Schein’s
(1984) where he stated that a group must be together for a long
enough time to resolve problems. It can therefore be concluded that
performance can be determined by the length of time that a group has
been working together.
f) Leadership: The type of leadership behaviour will have an influence
on performance. Research has shown that a transformational
leadership style does result in increased performance (Lok & Crawford,
2004).
22
It can be concluded that culture is an important contributor to performance,
but not the sole contributor.
2.3 ORGANISATIONAL CULTURE AND PERFORMANCE
2.3.1 INTRODUCTION
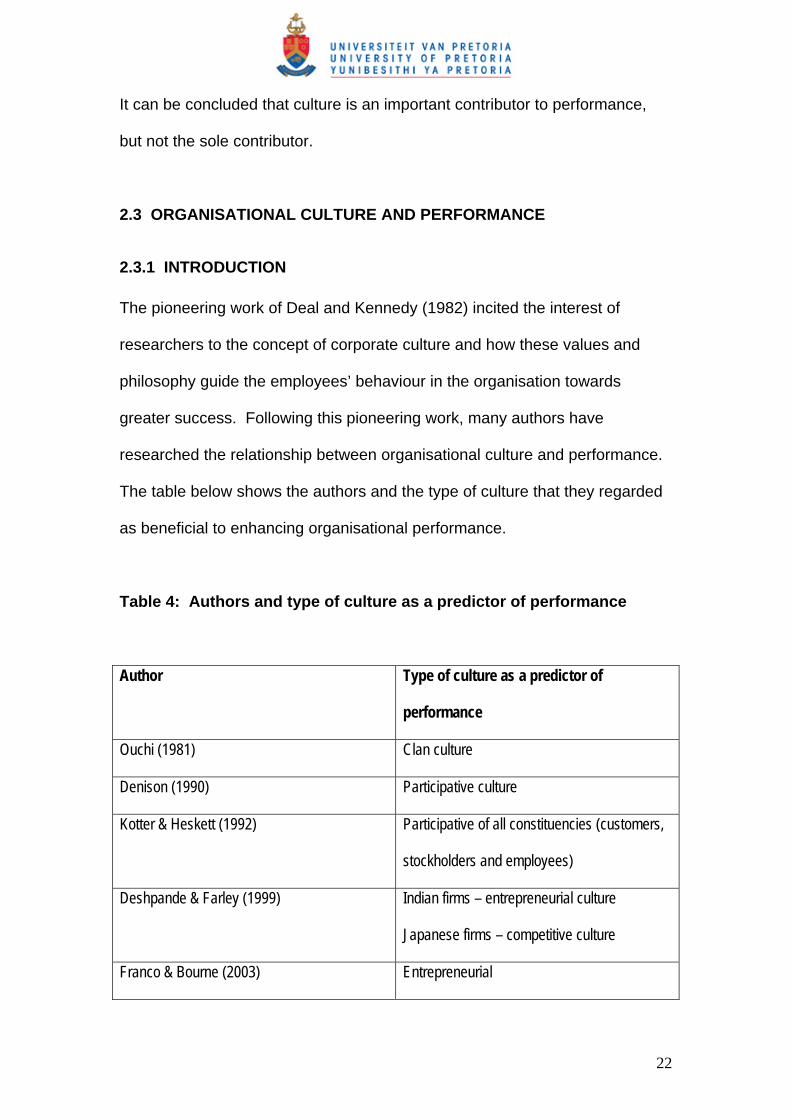
The pioneering work of Deal and Kennedy (1982) incited the interest of
researchers to the concept of corporate culture and how these values and
philosophy guide the employees’ behaviour in the organisation towards
greater success. Following this pioneering work, many authors have
researched the relationship between organisational culture and performance.
The table below shows the authors and the type of culture that they regarded
as beneficial to enhancing organisational performance.
Table 4: Authors and type of culture as a predictor of performance
Author Type of culture as a predictor of
performance
Ouchi (1981) Clan culture
Denison (1990) Participative culture
Kotter & Heskett (1992) Participative of all constituencies (customers,
stockholders and employees)
Deshpande & Farley (1999) Indian firms – entrepreneurial culture
Japanese firms – competitive culture
Franco & Bourne (2003) Entrepreneurial

23
2.3.2 INNOVATIVE CULTURE AND PERFORMANCE
Empirical studies by Franco & Bourne (2003) provided evidence that a
paternalistic culture that does not punish people’s mistakes and encourages
discussion and analysis, can lead to a successful performance measurement
strategy. They considered corporate culture as one of the critical factors for
successful performance adherence. Franco and Bourne (2003) are of the
opinion that an organisation will need a culture that supports team-work,
ownership and entrepreneurship as well as a culture that focuses on
continuous improvements. This study will aim to support Franco & Bourne’s
viewpoint.
Even though Denison (1990) came to the conclusion that a supportive culture
will result in higher performance than any other culture type, he still supported
the notion that an innovative culture can lead to increased performance. He
believed that an organisation must have the ability to restructure itself in times
of change and the only way to achieve this is by fostering an innovative
culture. Denison (1990) believed that two aspects of adaptability are likely to
have an impact on the organisation’s performance: The first impact was the
ability of the organisation to perceive and respond to the external
environment. Second was the ability to respond to internal customers. If a
department isolates itself from other departments it will negatively affect
performance. Martins (2002) supported Denison’s view in suggesting that the
willingness of employees to adapt to change will affect the performance of the
organisation.

24
2.3.3 SUPPORTIVE CULTURE AND PERFORMANCE
Denison (1990) refers to the supportive culture as involvement culture.
According to him a culture that focuses on a high level of involvement and
participation creates a sense of ownership which will result in greater
commitment to the organisation and increased performance. This implies that
staff members are inspired to better their performance based on voluntary and
implicit values rather than bureaucratic control systems. Ouchi (1981)
described high-involvement organisations as having the characteristics of a
“clan” rather than a formal bureaucracy. Ouchi also argued that in a clan
organisation transactions are governed primarily by values, beliefs, norms and
traditions.
Transaction costs are minimised as members act from an intuitive value
consensus rather than from the bureaucratic set of rules laid down by
management (Denison, 1990). This implies that the transaction costs in a
bureaucratic culture are higher than in a supportive culture. The benefit of the
supportive culture is therefore two-fold. According to Denison (1990) a
supportive culture will result in increased financial performance and a
decrease in transactional costs. Handy (1985) supported Denison’s view that
a supportive or participative culture performed better than other cultural types.
According to Handy (1985), in a supportive culture, work is performed out of
enjoyment of the activity for its own sake and out of concern and respect for
the needs and values of the other people involved.

25
2.3.4 STRENGTH OF CULTURE AND PERFORMANCE
According to Robbins (1996) an organisation culture is “strong” if it is
distinctive and characterised by a significant consensus between
organisational members regarding their beliefs, values, norms and ideals.
A culture will therefore be strong if all members in the organisation are in
agreement on the way they should act and behave and agree that the
particular behaviour will be beneficial to the greater good of the organisation.
A strong culture can have a positive impact on the effectiveness of the
organisation (Denison, 1990). An organisation is postulated to have a “strong
culture” when the culture is widely shared among employees (Lee & Yu 2004).
Peters and Waterman (1982) claimed as early as 1982 that there is a link
between a strong culture and superior performance. Kilman (1985) supported
this view that strong culture can have a major impact on the success of the
business due to its persuasive influence throughout any organisation.
Schein (1984) opposed this view. According to Schein organisational culture
in the whole, and not cultural strengths, may or may not be a predictor of
performance. This view was supported by Van der Berg & Wilderom (2004).
According to them cultural strength only indicates the degree of employee
consensus and such consensus does not indicate the level of organisational
culture, i.e. strong or weak.
This study will not focus on the strength of the culture but it is important to
recognise that various authors have considered this as an important factor.
26
2.4 CONCLUSION A review of the literature has shown that an innovative culture is the most
desirable culture where an organisation wants to increase performance.
Organisational culture is regarded as another variable that managers need to
take note of when faced with the problem of increasing performance. If culture
is regarded as a variable, it assumes that culture, like any of the other
variables, can be controlled to an extent by the manager. This study will not
focus on the role of leadership on organisational culture; however previous
research has shown that a leader can have a negative or positive effect on
culture (Lok & Crawford, 2004).
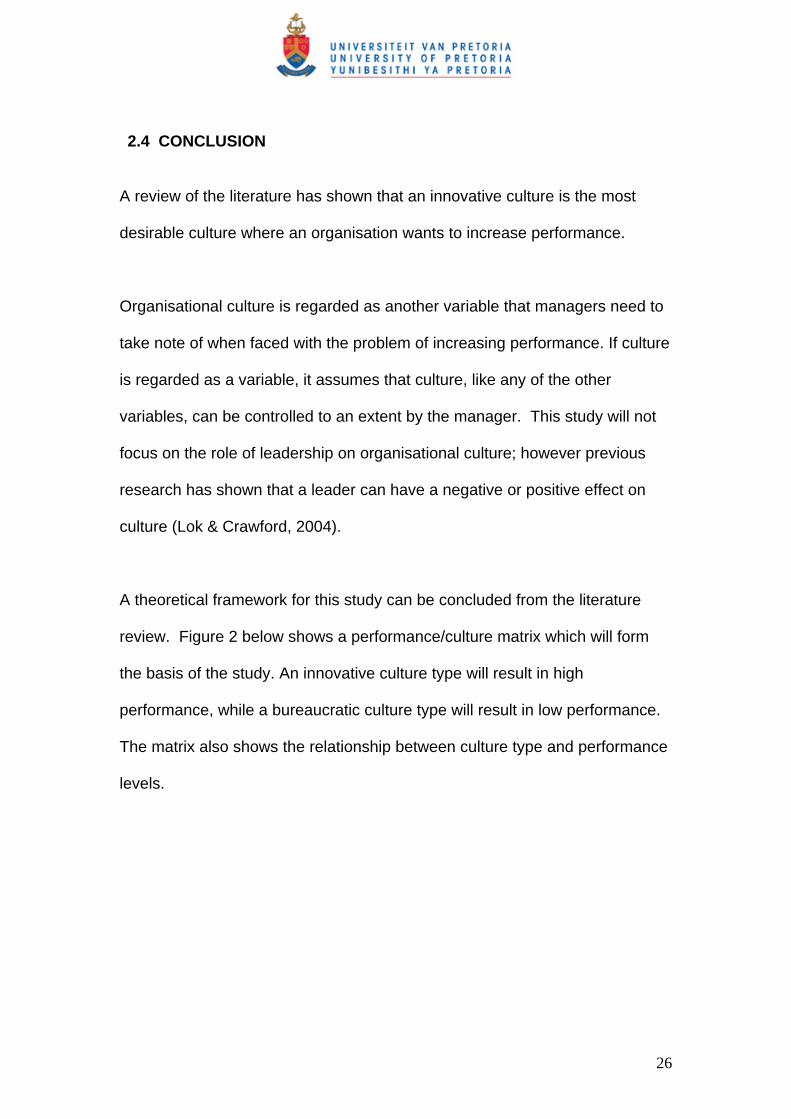
A theoretical framework for this study can be concluded from the literature
review. Figure 2 below shows a performance/culture matrix which will form
the basis of the study. An innovative culture type will result in high
performance, while a bureaucratic culture type will result in low performance.
The matrix also shows the relationship between culture type and performance
levels.

27
Figure 2: Performance/Culture matrix
High
MiddlePERFORMANCELEVELS
Low
Bureaucratic Supportive Innovative
CULTURE TYPE

28
CHAPTER 3
RESEARCH PROBLEM
The objectives of this research are twofold: firstly it will attempt to investigate
which culture is dominant in each department and secondly, it will attempt to
assess how culture affects the department’s performance in terms of adhering
to the agreed service level agreements.
In essence this study will establish whether organisational culture is a
predictor of performance by evaluating the adherence of each department to
the agreed service level agreement. The study is concerned with the cause-
effect relationship between culture and performance.
3.1 RESEARCH QUESTIONS
Three research questions were formulated based on the literature review in
Chapter 2, which has shown that innovative culture is the most desirable
culture for increased performance. The research will attempt to answer the
following questions:
3.1.1 Research question 1: What culture type is the most dominant in
each department within Liberty Life Operations?
3.1.2 Research question 2: Will an innovative culture result in a higher
adherence to the service level agreement than a bureaucratic and
supportive culture?

29
3.2 PROPOSED OUTCOME OF RESEARCH
The research aims to show the link between organisational culture and
performance by evaluating statistics that will show the department’s
adherence to service level agreement and by evaluating a questionnaire that
will indicate the dominant culture type and multiple culture types (if applicable)
in each department.

30
CHAPTER 4
PROPOSED RESEARCH METHODOLOGY
4.1 RESEARCH METHODOLOGY
This research seeks to identify the dominant culture in each department and
whether the prevailing culture can be used as a predictor of performance.
4.1.1 ORGANISATIONAL CULTURE RESEARCH
According to Bagraim (2001), practitioners that diagnose a corporate culture
based exclusively on a series of interviews and a weekend retreat with top
management, falsely assume that top management fully reflect the culture of
the organisation. In order to avoid this, this research will only focus on
quantitative research. This view is supported by Van den Berg & Wilder (2004
p. 576) where they “stress that academic organisational culture research be
based on quantifiable data”.
Wallach’s (1983) Organisational Culture Index survey was used. A Likert
scale was used where a score of 0 indicates that the participant strongly
disagrees with the statement and a score of 3 indicates that the participant
strongly agrees with the statement. The dominant cultural dimension per
department was identified by the survey. An example is given in Appendix 1.
31
4.1.2 PERFORMANCE INDICATORS
Adherence to the service level agreement is regarded as the most critical
performance indicator for every department within Liberty Life Operations. The
information on adherence to service level agreements was sourced from a
Liberty Life internal web-based system that updates progress on all work
items within Operations. Data over the three months (July to September) was
deemed to cover a suitable time frame.
4.2 POPULATION
The population for this study consisted of four departments within Liberty Life
Operations. The departments were chosen because all four departments had
to adhere to a five-day service level agreement.
Questionnaires were distributed via the relevant managers to all staff within
the department. A response rate of between 38% and 58% were achieved.
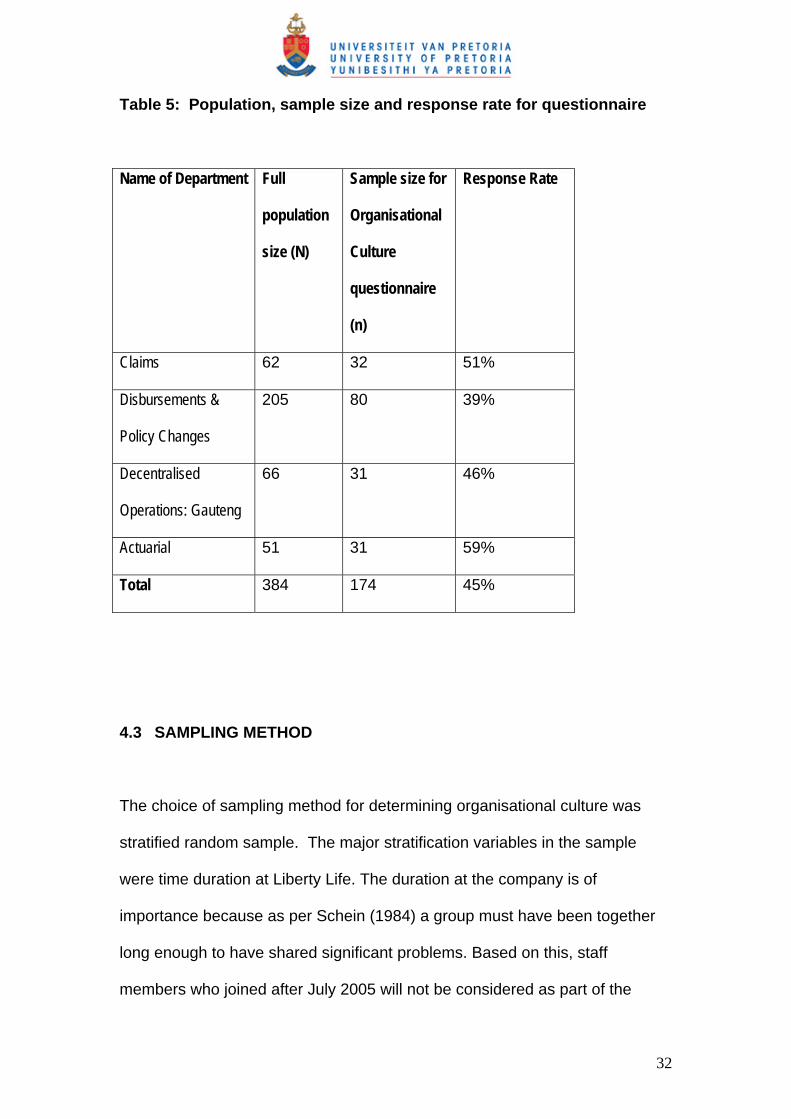
The table below indicates the population of the study (N=385), sample size
(n=170) and the applicable response rate.
32
Table 5: Population, sample size and response rate for questionnaire
Name of Department Full
population
size (N)
Sample size for
Organisational
Culture
questionnaire
(n)
Response Rate
Claims 62 32 51%
Disbursements &
Policy Changes
205 80 39%
Decentralised
Operations: Gauteng
66 31 46%
Actuarial 51 31 59%
Total 384 174 45%
4.3 SAMPLING METHOD
The choice of sampling method for determining organisational culture was
stratified random sample. The major stratification variables in the sample
were time duration at Liberty Life. The duration at the company is of
importance because as per Schein (1984) a group must have been together
long enough to have shared significant problems. Based on this, staff
members who joined after July 2005 will not be considered as part of the

33
sample as they would have been part of their department for less than one
year.
4.4 DATA COLLECTION & ANALYSIS
The data needed for this study will be gathered from two sources, namely
• Daily reports on percentage of cases outside service level agreement;
• All staff (broadband B2 and below) will complete the Organisational
Culture Index
The daily percentages of cases violating the service level agreement were
plotted against a graph, which indicated the department with the lowest
percentage. The four departments were then rated using the average monthly
percentage of cases outside the service level agreement as the measure of
performance.
In order to determine the most dominant culture type in a department, the
results per question from the Organisational Culture Index questionnaires
were added together in the following categories:

34
• Innovative culture: All responses to questions 1, 6,7,11,13,18,19 &
23 were added together to acquire a total value.
Table 6: Innovative culture questions
Number Question
1 risk taking6 results-orientated7 creative
11 pressurised13 stimulating18 challenging19 enterprising23 driving
• Bureaucratic culture: All responses to questions 3, 4, 10,
12,14,20,21 & 24 were added together to acquire a total value.
Table 7: Bureaucratic culture questions
Number Question
3 hierarchical4 procedural
10 structured12 ordered14 regulated20 established, solid21 cautious24 power-orientated

35
• Supportive culture: All responses to questions 2,5,8,9,15,16,17 & 22
were added together to acquire a total value.
Table 8: Supportive culture questions
Number Question
2 collaborative5 relationships-orientated8 encouraging9 sociable
15 personal freedom16 equitable17 safe22 trusting
The culture type with the highest value was then regarded as the most
dominant culture type.
4.5 POTENTIAL RESEARCH LIMITATIONS
• The population is limited to one company which may limit the relevance
of this research.
• Service level agreement adherence for a short period of time will be
used and this might not be an indicator of future performance.
• Decentralised Operations is a division with staff members throughout
the country. It was decided to use only the Gauteng based staff to
participate in this research because of convenience. The result of the
Decentralised Operations division might not be a true reflection as a
huge part of the population will be excluded.

36
• Over-reliance on a single indicator of performance.
• The quality aspect of output has been ignored even though Michela
and Burke (2000) argued that quality and innovative culture are
inextricably intertwined.
37
CHAPTER 5
RESEARCH RESULTS
5.1 INTRODUCTION
In this chapter, the results of the study will be presented with respect to the
two research problems as discussed in Chapter 3.
5.2 FIRST RESEARCH QUESTION The first research problem relating to the most dominant culture type in each
department within Liberty Life Operations shows the following results per
department:
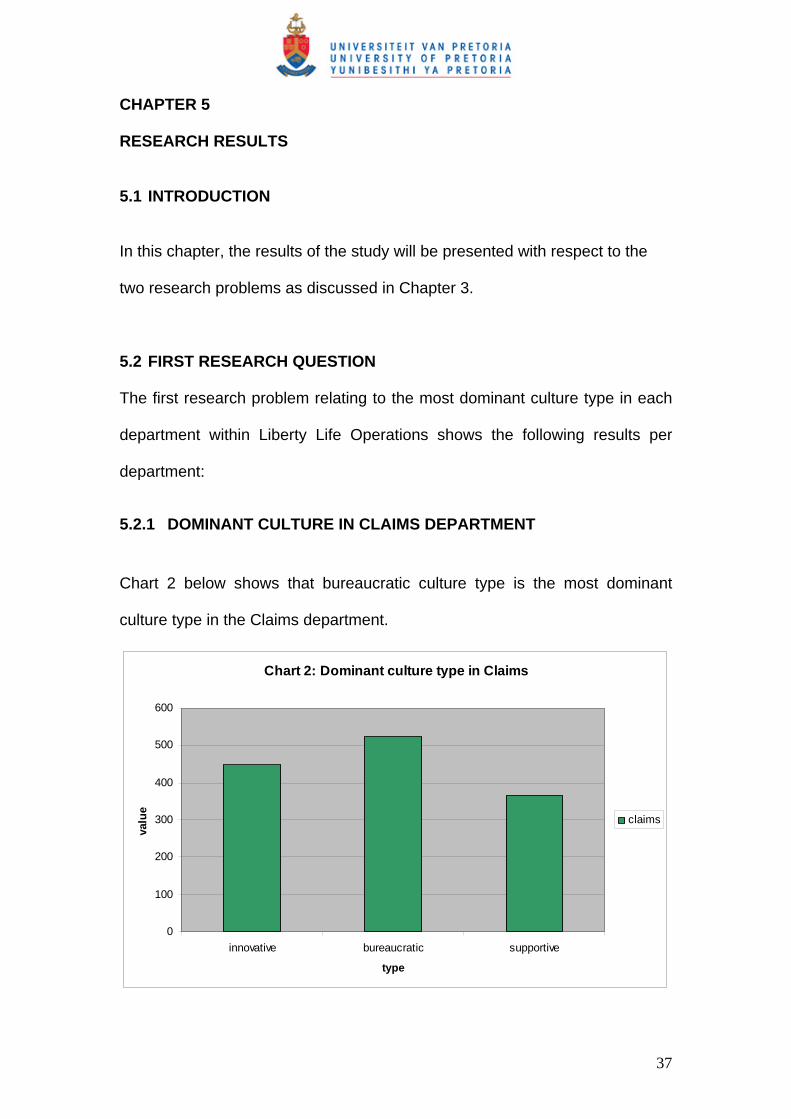
5.2.1 DOMINANT CULTURE IN CLAIMS DEPARTMENT
Chart 2 below shows that bureaucratic culture type is the most dominant
culture type in the Claims department.
Chart 2: Dominant culture type in Claims
0
100
200
300
400
500
600
innovative bureaucratic supportive
type
valu
e
claims

38
5.2.2 DOMINANT CULTURE TYPE IN DISBURSEMENTS & POLICY
CHANGES DEPARTMENT
Chart 3 indicates that innovative culture type is the most dominant culture type
in Disbursements & Policy Changes, followed by bureaucratic and supportive
culture.
Chart 3: Dominant culture type in Disbursements & Policy Changes
1160
1180
1200
1220
1240
1260
1280
1300
1320
1340
innovative bureaucratic supportive
culture type
valu
e
Disbursements & Policy Changes
5.2.3 DOMINANT CULTURE TYPE IN DECENTRALISED OPERATIONS
The chart below indicates that innovative culture is the most dominant in
decentralised operations. It is interesting to note the slight difference in value
between bureaucratic culture type and supportive culture type in
Decentralised Operations.

39
Chart 4: Dominant culture type Decentralised Operations
0
100
200
300
400
500
600
700
innovative bureaucratic supportive
type of culture
valu
e
Decentralised operations
5.2.4. DOMINANT CULTURE TYPE IN ACTUARIAL DEPARTMENT
Chart 5 indicates that supportive culture is the most dominant culture type in
the Actuarial department by a significant margin.
Chart 5: Dominant culture type in Actuarial
460
480
500
520
540
560
580
600
innovative bureaucratic supportive
type of culture
valu
e
actuarial

40
The above results are summarised in Table 5 below.
Table 8: Dominant culture type per department
Department Organisational culture type
Claims Bureaucratic
Disbursements & Policy changes Innovative
Decentralised Operations: Gauteng Innovative
Actuarial Supportive
5.3 SECOND RESEACH QUESTION
The second research question enquires about the relationship between
organisational culture and adherence to the service level agreement. In order
to determine the relationship, an analysis of the daily reports on adherence to
service level agreements was done.
Graphs 1 to 12 below indicate the percentage of cases per department that
violated the agreed five-day service level agreement for the period July 2006
to September 2006.
41
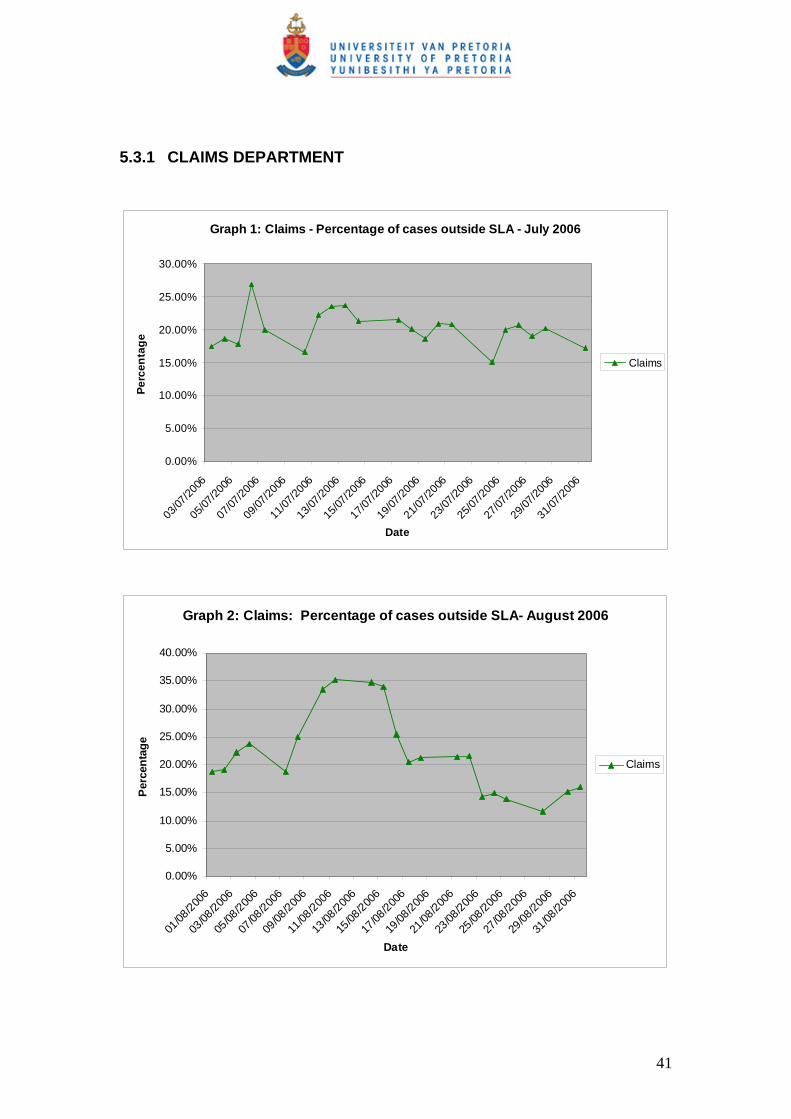
5.3.1 CLAIMS DEPARTMENT
Graph 1: Claims - Percentage of cases outside SLA - July 2006
0.00%
5.00%
10.00%
15.00%
20.00%
25.00%
30.00%
03/07
/200
6
05/07
/200
6
07/07
/200
6
09/07
/200
6
11/07
/200
6
13/07
/200
6
15/07
/200
6
17/07
/200
6
19/07
/200
6
21/07
/200
6
23/07
/200
6
25/07
/200
6
27/07
/200
6
29/07
/200
6
31/07
/200
6
Date
Perc
enta
ge
Claims
Graph 2: Claims: Percentage of cases outside SLA- August 2006
0.00%
5.00%
10.00%
15.00%
20.00%
25.00%
30.00%
35.00%
40.00%
01/08
/200
6
03/08
/200
6
05/08
/200
6
07/08
/200
6
09/08
/200
6
11/08
/200
6
13/08
/200
6
15/08
/200
6
17/08
/200
6
19/08
/200
6
21/08
/200
6
23/08
/200
6
25/08
/200
6
27/08
/200
6
29/08
/200
6
31/08
/200
6
Date
Per
cent
age
Claims

42
Graph 3: Claims: Percentage of cases outside SLA - September 2006
0.00%
5.00%
10.00%
15.00%
20.00%
25.00%
30.00%
01/09
/200
6
03/09
/200
6
05/09
/200
6
07/09
/200
6
09/09
/200
6
11/09
/200
6
13/09
/200
6
15/09
/200
6
17/09
/200
6
19/09
/200
6
21/09
/200
6
23/09
/200
6
25/09
/200
6
27/09
/200
6
29/09
/200
6
Date
Perc
enta
ge
Claims
The table below shows the average percentage of cases outside SLA for
claims for the period July 2006 to August 2006.
Table 9: Average percentage outside SLA for Claims
Month Average percentage outside SLA
July 2006 20.11%
August 2006 21.94%
September 2006 16.39%

43
5.3.2 DISBURSEMENTS & POLICY CHANGES DEPARTMENT
Graph 4 : Policy Changes & Disbursements: Percentage of cases outside SLA - July 2006
0.00%
2.00%
4.00%
6.00%
8.00%
10.00%
12.00%
03/07
/200
6
05/07
/200
6
07/07
/200
6
09/07
/200
6
11/07
/200
6
13/07
/200
6
15/07
/200
6
17/07
/200
6
19/07
/200
6
21/07
/200
6
23/07
/200
6
25/07
/200
6
27/07
/200
6
29/07
/200
6
31/07
/200
6
Date
Perc
enta
ge o
utsi
de S
LA
Policy changes &Disbursements
Graph 5: Policy changes & Disbursements: Percentage of cases outside SLA - August 2006
0.00%
0.50%
1.00%
1.50%
2.00%
2.50%
3.00%
3.50%
4.00%
01/08
/200
6
03/08
/200
6
05/08
/200
6
07/08
/200
6
09/08
/200
6
11/08
/200
6
13/08
/200
6
15/08
/200
6
17/08
/200
6
19/08
/200
6
21/08
/200
6
23/08
/200
6
25/08
/200
6
27/08
/200
6
29/08
/200
6
31/08
/200
6
Date
Per
cent
age
outs
ide
SLA
Policy changes &Disbursements

44
Graph 6: Policy changes & disbursements: Percentage of cases outside SLA - September 2006
0.00%
1.00%
2.00%
3.00%
4.00%
5.00%
6.00%
7.00%
8.00%
01/09
/200
6
03/09
/200
6
05/09
/200
6
07/09
/200
6
09/09
/200
6
11/09
/200
6
13/09
/200
6
15/09
/200
6
17/09
/200
6
19/09
/200
6
21/09
/200
6
23/09
/200
6
25/09
/200
6
27/09
/200
6
29/09
/200
6
Date
Per
cent
age
Policy changes &disbursements
The table below shows the average percentage of cases outside SLA for
Disbursements & Policy Changes for the period July 2006 to August 2006.
Table 10: Average percentage outside SLA for Disbursements & Policy
Changes
Month Average percentage outside SLA
July 2006 5.13%
August 2006 2.03%
September 2006 3.28%
45
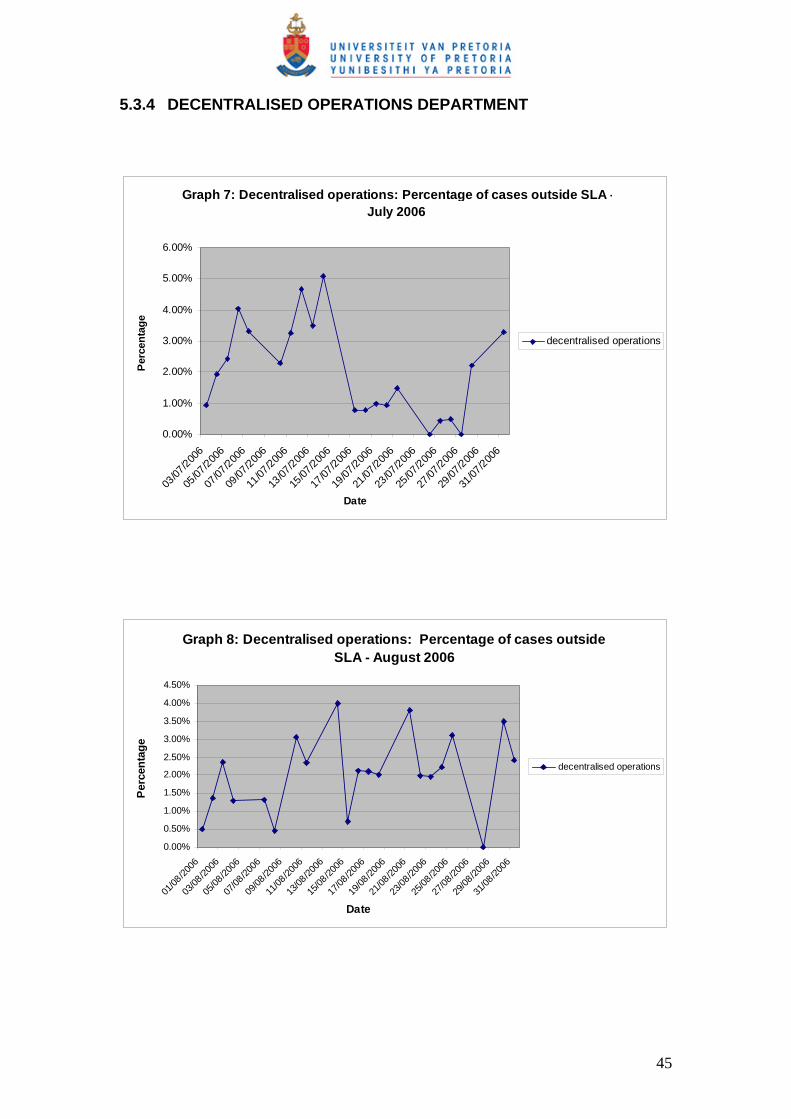
5.3.4 DECENTRALISED OPERATIONS DEPARTMENT
Graph 7: Decentralised operations: Percentage of cases outside SLA -July 2006
0.00%
1.00%
2.00%
3.00%
4.00%
5.00%
6.00%
03/07
/200
6
05/07
/200
6
07/07
/200
6
09/07
/200
6
11/07
/200
6
13/07
/200
6
15/07
/200
6
17/07
/200
6
19/07
/200
6
21/07
/200
6
23/07
/200
6
25/07
/200
6
27/07
/200
6
29/07
/200
6
31/07
/200
6
Date
Perc
enta
ge
decentralised operations
Graph 8: Decentralised operations: Percentage of cases outside SLA - August 2006
0.00%
0.50%
1.00%
1.50%
2.00%
2.50%
3.00%
3.50%
4.00%
4.50%
01/0
8/200
6
03/0
8/200
6
05/0
8/200
6
07/0
8/200
6
09/0
8/200
6
11/0
8/200
6
13/0
8/200
6
15/0
8/200
6
17/0
8/200
6
19/0
8/200
6
21/0
8/200
6
23/0
8/200
6
25/0
8/200
6
27/0
8/200
6
29/0
8/200
6
31/0
8/200
6
Date
Perc
enta
ge
decentralised operations

46
Graph 9: Decentralised operations: Percentage of cases outside SLA - September 2006
0.00%
2.00%
4.00%
6.00%
8.00%
10.00%
12.00%
01/09
/200
6
03/09
/200
6
05/09
/200
6
07/09
/200
6
09/09
/200
6
11/09
/200
6
13/09
/200
6
15/09
/200
6
17/09
/200
6
19/09
/200
6
21/09
/200
6
23/09
/200
6
25/09
/200
6
27/09
/200
6
29/09
/200
6
Date
Per
cent
age
decentralised operations
The table below shows the average percentage of cases outside SLA for
Decentralised Operations for the period July 2006 to August 2006.
Table 11: Average percentage outside SLA for Decentralised Operations
Month Average percentage outside SLA
July 2006 2.04%
August 2006 2.03%
September 2006 4.89%

47
5.3.5 ACTUARIAL DEPARTMENT
Graph 10: Actuarial: Percentage of cases outside SLA - July 2006
0.00%
5.00%
10.00%
15.00%
20.00%
25.00%
30.00%
03/07
/200
6
05/07
/200
6
07/07
/200
6
09/07
/200
6
11/07
/200
6
13/07
/200
6
15/07
/200
6
17/07
/200
6
19/07
/200
6
21/07
/200
6
23/07
/200
6
25/07
/200
6
27/07
/200
6
29/07
/200
6
31/07
/200
6
Date
Per
cent
age
Actuarial
Graph 11: Actuarial: Percentage of cases outside SLA - August 2006
0.00%
2.00%
4.00%
6.00%
8.00%
10.00%
12.00%
14.00%
16.00%
01/08
/200
6
03/08
/200
6
05/08
/200
6
07/08
/200
6
09/08
/200
6
11/08
/200
6
13/08
/200
6
15/08
/200
6
17/08
/200
6
19/08
/200
6
21/08
/200
6
23/08
/200
6
25/08
/200
6
27/08
/200
6
29/08
/200
6
31/08
/200
6
Date
Per
cent
age
Actuarial
48
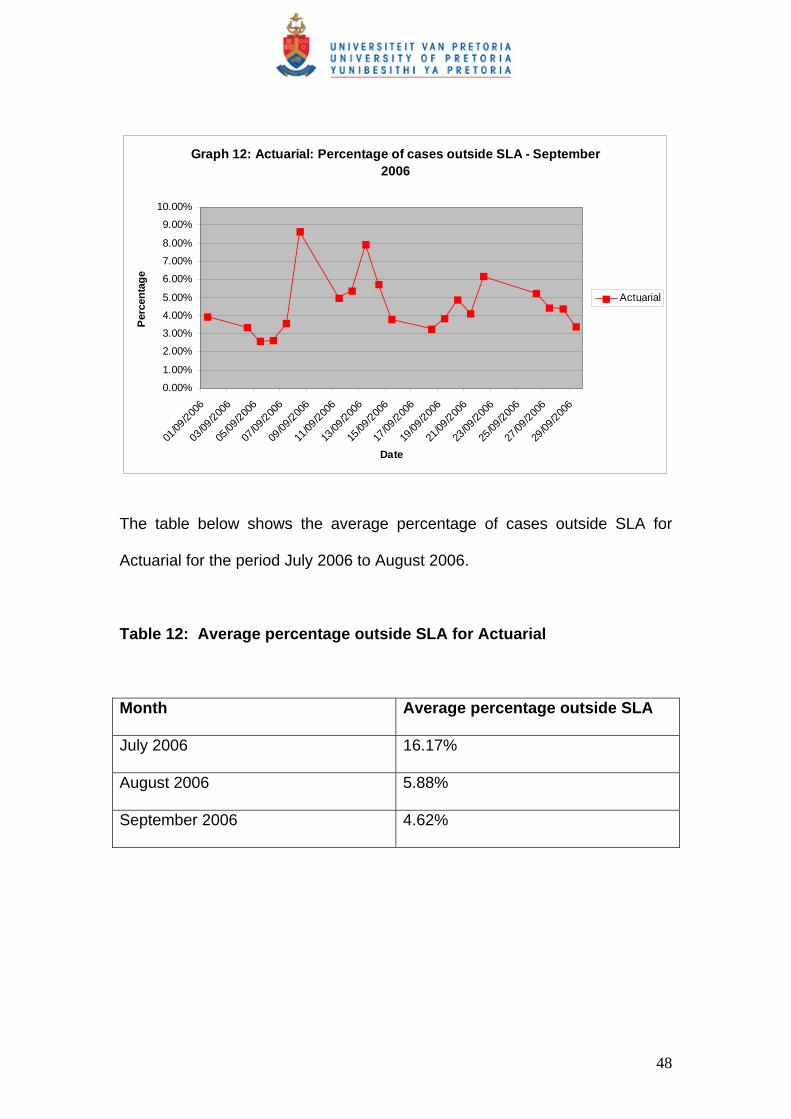
Graph 12: Actuarial: Percentage of cases outside SLA - September 2006
0.00%
1.00%
2.00%
3.00%
4.00%
5.00%
6.00%
7.00%
8.00%
9.00%
10.00%
01/09
/200
6
03/09
/200
6
05/09
/200
6
07/09
/200
6
09/09
/200
6
11/09
/200
6
13/09
/200
6
15/09
/200
6
17/09
/200
6
19/09
/200
6
21/09
/200
6
23/09
/200
6
25/09
/200
6
27/09
/200
6
29/09
/200
6
Date
Per
cent
age
Actuarial
The table below shows the average percentage of cases outside SLA for
Actuarial for the period July 2006 to August 2006.
Table 12: Average percentage outside SLA for Actuarial
Month Average percentage outside SLA
July 2006 16.17%
August 2006 5.88%
September 2006 4.62%
49
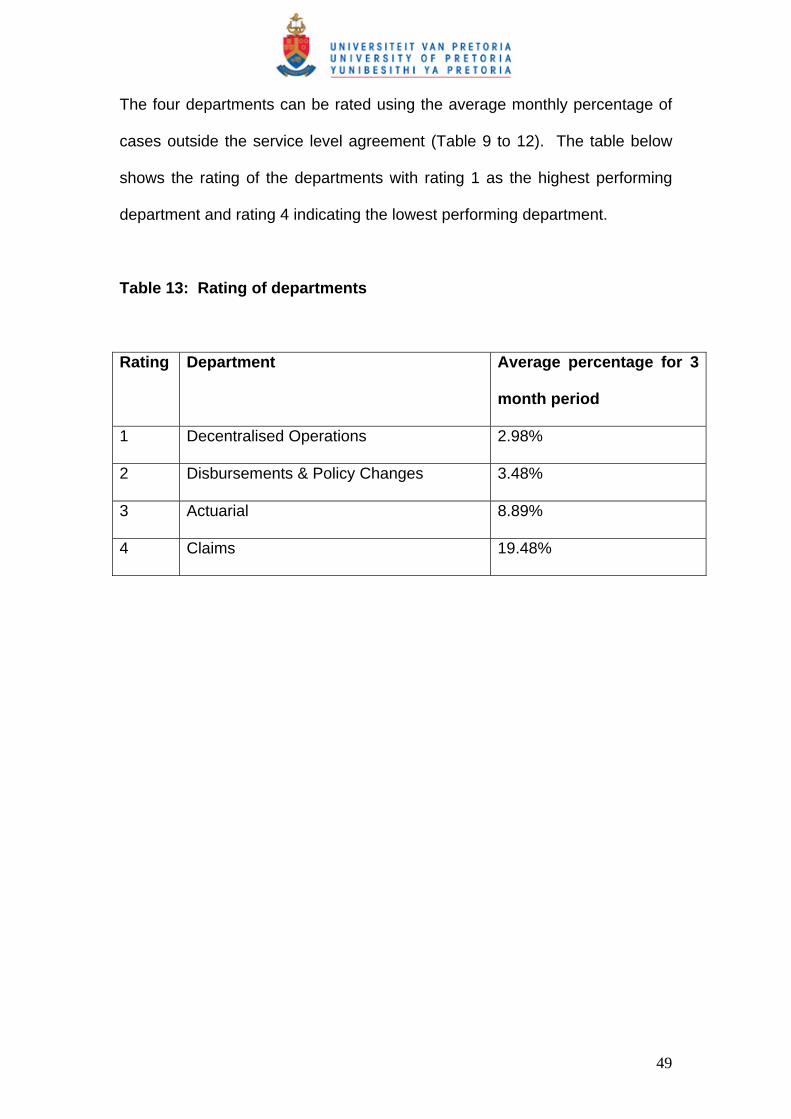
The four departments can be rated using the average monthly percentage of
cases outside the service level agreement (Table 9 to 12). The table below
shows the rating of the departments with rating 1 as the highest performing
department and rating 4 indicating the lowest performing department.
Table 13: Rating of departments
Rating Department Average percentage for 3
month period
1 Decentralised Operations 2.98%
2 Disbursements & Policy Changes 3.48%
3 Actuarial 8.89%
4 Claims 19.48%

50
CHAPTER 6
DISCUSSION OF RESULTS
6.1 DOMINANT CULTURE TYPE PER DEPARTMENT
The main purpose of the first research question was to determine the
dominant culture type in each department. As indicated in table 8, all three
culture types as described by Wallach in table 1 were found to be a dominant
culture type.
The results of the Organisational Culture Index questionnaire in Charts 2 to 5
give strong support to Lund’s (2003) view that it is possible that in a
department attributes of several cultures may be present. All four
departments show a dominant culture followed by two sub-cultures. This
finding further contributes to Bagraim’s (2001) theory that organisations may
comprise of several sub-cultures rather than a single, unified culture.
Charts 2 to 5 also indicate the degree that a specific culture type is more
dominant than the other culture types. Even thought the extent of dominance
of a specific culture type did not form part of this research, the charts clearly
show the value difference between the dominant culture and sub-cultures.
One can make the observation from chart 2 that even though bureaucratic
culture was at the time of the study the most dominant culture, innovative
culture was less than 100 base points below. It indicates that if management
regards culture as a variable that can be controlled, it implies that it can be
changed; it is possible that the dominant culture can be changed from

51
bureaucratic to innovative culture. The same observation will apply to Chart 4
where the value differences between bureaucratic and supportive cultures as
the two sub-cultures are very small. No previous research has been done to
determine the effect of sub-cultures on performance, but if the proposed
outcome of this research shows that a dominant supportive culture type will
result in a middle performance level while a dominant bureaucratic culture
type will result in a low performance level, one can assume that sub-cultures
will also have an effect on performance levels. Management of the
Decentralised Operations department should attempt to change the first sub-
culture from bureaucratic to supportive. Further research is recommended to
determine the impact of sub-cultures on performance.
6.2 RELATIONSHIP BETWEEN ORGANISATIONAL CULTURE AND
PERFORMANCE
The second research question was whether an innovative culture result in
higher adherence to the service level agreement than a bureaucratic and
supportive culture.
If one combines the results in table 8 with the results in table 13, it is clear that
the research question can be answered. An innovative culture does result in a
higher adherence to the SLA than a supportive and bureaucratic culture.

52
Table 14: Combination of performance and culture type
Rating Average percentageoutside SLA for 3 months
Culture type Department
1 2.98% Innovative Decentralised
Operations
2 3.48% Innovative Disbursements &
Policy Changes
3 8.89% Supportive Actuarial
4 19.48% Bureaucratic Claims
It is clear from the above table that this research supports Denison’s (1990)
and Martins’ (2002) view that an innovative culture will result in increased
performance. Table 14 also give strong support to the performance/culture
matrix as indicated in figure 3, which was used as the basis of this research.
Figure 3: Performance/Culture matrix with research results
High Decentralised Operations andDisbursements &Policy Changes
MiddlePERFORMANCE ActuarialLEVELS department
LowClaims department
Bureaucratic Supportive Innovative
CULTURE TYPE

53
The result that innovative culture will result in higher performance also
supports Allerton’s (1998) view that a high performance organisation must
have the characteristics of decision making at the lowest level and risk taking
is encouraged. Both these characteristics are elements of the innovative
culture type. The results further support Franco and Bourne (2003) in their
opinion that a paternalistic culture that does not punish people’s mistake and
encourages discussion and analysis, can lead to a successful performance
strategy.

54
CHAPTER 7 CONCLUSION
The purpose of this study was to establish the dominant culture type in the
four departments within Liberty Life Operations division and secondly to
assess how culture affects the department’s performance in terms of adhering
to the service agreement of five days.
In terms of the first research aim of establishing the dominant culture type, the
comprehensive literature review on the subject of various culture types
together with the administration of Wallach’s Organisational Culture Index
questionnaire achieved this aim. In summary, the literature review suggested
that, even though authors classified culture types differently, the elements that
define the three culture types used in the questionnaire – innovative,
supportive and bureaucratic – were similar.
The findings from the administration of the Organisational Culture Index
questionnaire clearly indicated the dominant culture type per department.
The second research aim was to assess how culture affects the department’s
performance. The literature review clearly showed that an innovative culture
will result in higher performance than a supportive or bureaucratic culture
type. Interpretation of each department’s adherence to the service level
agreement clearly indicated that the department with an innovative culture had
the lowest percentage of cases outside the service level agreement. This
research results therefore supported the literature review

55
The implication of the findings in the current study should be noted by
management of Liberty Life. The research clearly showed that an innovative
culture does result in increased performance. Therefore it will be beneficial to
the organisation if management embrace the challenge of changing the
culture in the departments with a supportive culture, and more especially the
departments with a bureaucratic culture. The culture literature traditionally
has stated almost unanimously that culture change is difficult and time
consuming (Lewis, 1996). However, review of literature has shown that if
culture change is rooted in the business strategy and communication from the
sponsor in support of the change is understood, change is possible (Smith,
2003).
This research only focussed on the causal effect of the dominant
organisational culture on performance. Further research is suggested in
establishing the effect of sub-cultures on performance.
Additional research to establish the importance of culture in the effectiveness
of large-scale organisational change programs is also suggested.
In conclusion, organisational culture can be used as a predictor of
performance in an organisation.

56
REFERENCES
Allerton, H.E. (1998) High performance. Training & Development, July 1998.
vol.7, p11-13
Bagraim, J.J. (2001) Organisational psychology and workplace control: the
instrumentality of corporate culture. South African Journal of Psychology, Vol
31, Issue 3, Aug, 43-49
Cameron, K.S. & Freedman, S.J. (1991) Cultural congruence, strength, and
type: relationship to effectiveness. Research in Organizational Change and
Development, 5, 23-58.
Cummings, T.G & Worley, C.G (2005) Organization Development & Change
8th ed. Ohio: South-Western College Publishing
Deal, T and Kennedy, A. (1982) Corporate Cultures, Addison-Wesley.
Reading, MA.
Denison. D.R (1982) The climate, culture and effectiveness of work
organizations: A study of organizational behavior and financial performance.
Ph.D. diss, University of Michigan.
Denison, D.R. (1990) Corporate Culture and organizational effectiveness,
New York: Wiley.

57
Deshpande, R & Farley, J (1999) Executive insights: corporate culture and
market orientation: comparing Indian and Japanese firms. Journal of
International Marketing. Vol.7. 111-127.
Franco, M. & Bourne, M. (2003) Factors that play a role in managing through
measures, Management Decision, Vol 41, No 8, 698-710
Handy, C.B. (1985) Understanding Organisations. Harmondsworth: Penguin
Harkness.
Jacobs, P. (2005) Decision Rights: Who Gives the Green Light?. Boston:
HBS Working Knowledge, http:/www.hbsworkingknowledge.hbs.edu/cgi-bin
(accessed 07/08/06)
Killmann, R. H & associates (1985) Gaining Control of the Corporate Culture,
San Francisco: Jossey-Bass.
Kotter, J & Heskett, J. (1992) Corporate Culture and Performance, New York:
Free Press.
Kotter, J.P. (1995) Leading Change. Harvard Business Review, March-April.
Langton, D. (2000) Aligning Performance: improving people, systems, and
organizations, San Francisco: Jossey-Bass.

58
Lee, S & Yu, K. (2004) Corporate culture and organizational performance.
Journal of Managerial Psychology. Volume 19 (4), 340-359
Lewis, D. (1996) The organizational culture saga – from OD to TQM: a critical
review of the literature. Part 2 – applications. Leadership & Organization
Development Journal. 17(2), 9-16
Lok, P. & Crawford, J. (2004) The effect of organisational culture and
leadership style on job satisfaction and organisational commitment. Journal of
Management Development, 23(4), 321-338.
Lund, D.B. (2003) Organizational culture and job satisfaction. Journal of
Business & Industrial Marketing, 18, 219-236.
Maull, R. Brown, P. and Cliffe, R. (2001) Organisational culture and quality
improvement. International Journal of Operations & Production Management,
21(3), 302-326.
Martins, E & Martins, N (2002) An Organisational Culture Model to promote
Creativity and Innovation, SA Journal of Industrial Psychology, 28,4,58-65.
Michela, J.L & Burke, W.W. (2000) Organizational culture and climate in
transformations for quality and innovation. In N.M. Ashkanasy (Eds).
Handbook of organisational culture and climate. California: Sage

59
Morris, M.H. & Kuratko, D.F. (2002) Corporate Entrepreneurship. Florida:
Harcourt College Publishers.
Nayager, T & Van Vuuren, J.J. (2005) An Analysis of an Organisational
Strategy, Structure and Culture that supports Corporate Entrepreneurship in
Established Organisations. SAJEMS, 8,1,29-38.
Ouchi, W.G. (1981) Markets, bureaucracies, and clans. Administrative
Science Quarterly, 25, 129-141.
Peters, T.J. & Waterman, R.H. (1982), In Search of Excellence. New York:
Harper & Row.
Rashid, Z.A., Sambasivan, M. and Johari, J. (2003) The influence of corporate
culture and organisational commitment on performance. Journal of
Management Development, 22(8), 708-728.
Robbins, S.P. (1996) Organizational behaviour. (7th edition). Englewood Cliffs,
NJ: Prentice Hall.
Rogers, B. (2006) High Performance Is More Than a Dream – It’s a Culture.
T&D, January 2006, 12.

60
Ryan , O (2004) Back to the Business of Insurance, A Global Insurance
Industry Benchmarking Survey. New York; Deloitte. http://www.deloitte.com
(accessed 10/08/06)
Schein, E. (1984) Coming to a New Awareness of Organizational Culture.
Sloan Management Review, Winter.
Schein, E. (1996) Culture: The Missing Concept in Organization Studies.
Administrative Science Quarterly, 41, 229-240
Smircich, L. (1983) Concepts of culture and organizational analysis.
Administrative Science Quarterly, 28, 339-358.
Smith, M.E. (2003) Changing an organisation’s culture: correlates of success
and failure. Leadership & Organization Development Journal, 24(5), 249-261
.
Tsosa, P.J (2004) The Interactive Role of Organisational Strategy and
Culture. Journal of Contemporary Management, 1, 82-98.
Van den Berg, P. & Wilderom, C. (2004) Defining, Measuring, and Comparing
Organisational Cultures. Applied Psychology: An International Review, 53(4),
570-582

61
Van der Post, W.Z., de Coning, T.J. and Smit, E.V. (1998) The relationship
between organisational culture and financial performance: some South African
evidence. South African Journal of Business Management, 22, 30-41.
Wallach, E. (1983) Individuals and organization: the cultural match. Training
and Development Journal, 12, 28-36.
Yeo, R. (2003) The tangibles and intangibles of organisational performance.
Team Performance Management: An international Journal, 9(7), 199-204.

62
APPENDIX 1: ORGANISATIONAL CULTURE INDEX
ORGANISATIONAL CULTURE INDEX
Please indicate your department with an X:
1 Claims2 Disbursement & Policy changes3 Decentralised Operations4 Actuarial
Years in Liberty Life 1 less than 1 year2 1-5 years3 5-10 years4 10-15 years5 15-20 years6 20 plus years
Please circle a score from the scale below which most closely correspond with how you see your department
0 = does not describe my department1 = describes my department a little2 = describes my department a fair amount3 = describes my department most of the time
1 risk taking 0 1 2 32 collabaorative 0 1 2 33 hierarchical 0 1 2 34 procedural 0 1 2 35 relationships-orientated 0 1 2 36 results-orientated 0 1 2 37 creative 0 1 2 38 encouraging 0 1 2 39 sociable 0 1 2 3
10 structured 0 1 2 311 pressurised 0 1 2 312 ordered 0 1 2 313 stimulating 0 1 2 314 regulated 0 1 2 315 personal freedom 0 1 2 316 equitable 0 1 2 317 safe 0 1 2 318 challenging 0 1 2 319 enterprising 0 1 2 320 established, solid 0 1 2 321 cautious 0 1 2 322 trusting 0 1 2 323 driving 0 1 2 324 power-orientated 0 1 2 3

63
APPENDIX 2: ORGANISATIONAL CULTURE INDEX RESULTS 1. CLAIMS DEPARTMENT
Years in Liberty QUESTIONS1 2 3 4 5 6 7 8 9 10 11 12 13 14 15 16 17 18 19 20 21 22 23 24
3 2 2 1 3 3 3 3 3 3 3 1 0 3 3 2 2 3 3 3 3 1 3 3 33 0 0 0 1 1 1 1 1 1 3 1 1 1 2 1 1 1 1 1 1 2 1 1 32 0 1 3 0 0 1 0 0 0 0 3 0 0 0 0 0 0 0 0 0 0 0 0 35 3 2 0 3 2 3 1 1 1 2 3 3 0 2 3 2 3 3 3 1 3 2 3 22 2 1 3 3 0 3 0 0 0 1 3 1 0 3 2 2 2 0 0 2 2 0 0 32 3 1 3 2 1 3 1 2 2 1 3 2 2 3 1 2 2 3 2 2 3 2 2 33 0 2 3 0 0 2 2 0 0 3 3 0 0 0 2 0 1 0 0 1 1 2 0 33 1 3 2 3 3 3 2 3 3 2 3 3 2 3 3 3 3 2 0 1 2 2 3 33 3 2 2 3 1 3 1 1 2 3 3 2 1 3 1 1 1 3 3 1 2 1 1 33 3 2 3 2 2 3 3 2 2 2 3 3 3 3 2 2 2 3 3 3 3 3 3 33 3 2 0 3 2 3 2 2 2 2 3 2 2 2 2 0 2 2 0 0 0 2 2 04 2 0 3 3 1 2 1 0 1 0 3 0 0 0 2 0 0 2 1 0 2 0 3 36 2 1 2 3 1 3 0 2 1 2 3 1 0 2 1 1 1 0 0 1 1 0 3 36 0 2 2 3 0 3 2 2 1 2 3 2 2 1 1 2 1 3 2 2 2 1 2 15 2 1 2 2 2 3 0 0 1 1 3 1 3 3 0 0 1 3 2 0 1 1 2 13 0 2 2 3 1 1 0 2 1 3 1 3 1 2 1 1 1 1 1 3 2 1 1 32 0 1 3 2 0 1 0 0 1 2 3 2 0 1 0 3 2 1 2 2 1 0 0 35 3 2 3 3 2 3 1 1 1 2 3 3 0 2 3 2 3 3 3 1 3 2 3 22 1 2 2 3 2 2 2 2 2 2 3 2 2 3 2 1 2 1 0 3 2 2 2 24 2 0 3 3 1 2 1 1 1 3 3 3 0 2 2 0 0 2 1 2 2 0 3 32 1 1 2 3 1 2 0 2 1 2 3 1 0 2 1 1 1 1 0 1 2 0 3 33 0 0 2 3 1 1 2 1 2 0 3 0 0 1 1 1 2 2 0 2 2 1 1 15 3 1 2 3 1 2 1 1 2 1 3 2 1 3 1 2 2 1 2 2 2 1 2 25 3 2 3 3 1 3 1 1 1 3 3 2 1 3 2 2 3 2 1 2 3 1 3 35 2 2 2 3 1 2 2 2 1 2 3 2 2 2 2 2 3 2 2 2 2 2 1 12 2 2 3 3 2 3 1 2 2 2 3 2 2 2 2 2 2 3 2 2 2 2 2 33 2 0 0 2 2 1 2 1 1 2 3 3 1 2 0 2 2 1 0 2 2 1 1 13 2 1 3 3 1 1 1 0 0 1 3 0 3 0 0 0 1 3 1 3 1 1 1 12 2 1 3 2 1 2 2 1 3 3 2 1 2 1 3 2 2 1 3 3 3 2 2 23 1 3 2 3 2 1 2 3 3 3 1 3 1 2 1 3 3 2 3 3 2 3 2 32 2 1 3 3 2 3 1 1 2 3 2 2 1 2 1 2 2 1 2 2 3 2 3 33 1 2 2 2 3 2 1 1 3 2 3 3 2 3 3 2 1 2 1 3 3 1 2 3
53 45 69 81 43 71 39 41 47 63 86 55 38 63 48 46 55 57 44 56 62 42 60 76
innovativebureaucraticsupportive

64
2. DISBURSEMENTS & POLICY CHANGES
years in Liberty QUESTIONS1 2 3 4 5 6 7 8 9 10 11 12 13 14 15 16 17 18 19 20 21 22 23 24
4 3 2 3 3 0 1 2 2 2 2 3 3 1 3 1 1 1 2 0 1 3 1 1 32 3 2 2 3 1 3 1 2 2 3 3 2 2 2 1 1 2 3 3 3 3 2 3 22 0 1 2 2 0 3 1 1 0 2 3 1 1 1 2 2 3 1 0 2 3 2 1 22 2 2 2 3 3 3 1 2 3 2 1 2 2 2 3 2 2 3 2 2 3 3 2 12 0 3 2 3 3 3 3 3 3 2 2 2 2 2 1 2 2 2 2 2 2 1 2 22 0 2 3 3 1 3 0 1 0 3 3 3 1 2 0 2 3 3 1 3 2 0 3 34 2 2 1 3 2 3 2 3 3 3 2 2 2 2 1 2 1 2 2 3 2 2 2 22 1 3 3 3 3 3 2 3 3 2 3 3 2 3 1 2 3 3 0 3 3 3 3 32 1 3 2 3 3 3 2 3 3 2 3 3 2 3 1 2 3 3 0 3 3 3 3 34 2 3 0 3 3 3 3 3 3 2 2 3 2 2 2 2 3 2 2 2 2 2 2 22 0 0 2 3 2 3 1 1 2 3 3 3 0 3 1 1 0 0 1 3 1 1 1 02 3 2 3 3 3 3 1 1 2 2 2 2 1 2 1 2 3 2 0 3 2 2 1 32 2 2 2 2 3 3 2 3 3 3 3 2 2 2 2 2 2 3 2 2 3 3 3 22 2 3 2 3 3 3 2 2 3 3 3 2 2 3 1 2 2 3 2 2 2 2 3 13 1 1 2 2 1 2 1 0 1 2 3 2 2 2 1 1 2 2 2 2 2 1 0 32 2 1 1 3 2 3 2 1 2 3 3 1 2 2 1 3 3 3 2 2 2 3 3 25 2 2 3 3 2 2 1 1 2 2 3 2 1 2 1 1 1 1 1 2 2 2 1 13 1 2 2 2 2 3 0 2 2 2 3 3 1 2 1 1 2 2 2 3 1 1 3 32 2 3 2 3 0 3 1 2 2 3 1 0 2 3 1 0 0 3 0 0 2 1 0 03 1 1 1 1 0 1 1 1 1 0 2 1 0 1 2 0 2 1 1 1 2 0 0 32 2 2 2 3 2 2 1 2 2 3 3 3 2 2 1 2 2 3 3 3 3 3 3 32 2 1 1 2 2 3 2 2 1 2 3 2 3 2 1 2 1 3 3 2 1 2 3 12 3 3 2 3 1 0 0 1 1 2 3 2 2 2 1 1 3 2 0 3 1 1 1 23 3 1 1 1 2 3 2 1 1 1 3 1 3 1 1 1 1 3 3 1 2 2 3 22 2 0 0 2 2 2 3 1 1 0 2 1 3 2 0 1 2 3 2 0 1 2 2 12 3 1 2 1 1 3 3 2 1 1 3 1 3 1 1 2 3 2 3 3 1 3 3 23 1 3 3 3 3 3 1 3 2 3 3 3 2 3 3 3 3 3 2 3 2 2 2 23 3 1 1 1 2 3 2 1 1 1 3 1 3 1 1 1 1 3 3 1 2 2 3 24 2 3 0 3 3 3 3 3 3 2 2 3 2 2 2 2 3 2 2 2 2 2 2 22 3 2 1 2 3 2 3 1 2 1 3 2 3 1 2 2 2 3 2 1 1 3 2 22 3 2 1 2 3 3 3 2 2 2 3 2 3 2 2 1 1 3 3 2 2 3 3 02 1 2 1 3 2 3 1 1 1 2 2 1 1 2 1 1 1 2 2 2 2 1 2 22 1 3 2 3 3 3 2 2 2 3 2 3 2 2 2 2 1 2 3 3 3 3 3 12 2 2 2 2 3 3 3 2 2 2 3 2 3 2 2 2 1 3 3 2 1 2 3 12 2 2 2 3 2 3 2 2 2 3 3 3 2 2 2 2 2 2 2 2 2 2 2 13 2 2 2 3 3 2 2 3 2 2 3 3 2 2 2 3 1 2 2 2 2 3 2 22 3 2 3 3 2 3 1 1 1 3 3 2 2 3 1 2 2 2 0 2 3 1 1 12 3 1 2 2 2 3 2 2 1 2 3 1 3 2 1 2 2 3 2 1 1 2 3 12 1 2 0 0 3 2 1 3 2 3 2 2 2 2 2 2 3 3 2 2 3 3 3 22 0 0 0 3 3 3 3 3 3 3 3 3 1 3 3 0 3 3 3 3 3 3 3 02 3 0 1 2 3 3 3 2 3 2 3 2 2 3 3 0 2 2 3 2 1 2 3 13 2 1 2 2 2 3 2 1 2 1 3 1 3 2 3 1 1 3 1 2 1 2 2 14 3 2 2 2 1 3 3 2 2 2 3 1 3 2 2 1 1 3 2 2 1 2 3 12 2 2 2 2 2 2 2 3 3 3 3 2 3 2 2 2 2 2 2 3 3 3 3 22 1 3 2 3 3 3 3 3 3 1 3 3 3 3 1 2 3 3 3 3 3 3 3 22 1 3 2 3 3 3 2 2 3 1 3 3 2 2 1 2 3 3 2 3 3 3 3 22 1 2 1 3 3 3 3 3 2 2 3 2 3 3 2 3 2 3 2 2 3 3 2 12 3 2 1 2 2 3 1 1 1 2 3 2 2 3 1 2 2 3 1 3 3 3 3 33 1 3 2 2 3 2 2 3 2 1 2 2 3 2 3 3 3 2 2 3 2 3 2 22 2 3 3 2 2 2 2 3 3 2 3 2 2 3 2 3 3 2 3 2 3 2 2 32 2 3 3 3 3 2 1 3 2 2 2 3 1 3 3 3 2 3 2 2 3 2 1 23 1 3 0 1 3 2 2 3 3 2 2 2 2 3 2 3 3 2 1 2 2 3 2 23 3 2 3 3 1 1 0 1 1 1 3 0 0 0 2 0 2 0 1 3 3 1 1 12 0 2 2 3 2 3 1 1 2 2 2 2 2 2 1 1 1 3 1 3 3 2 2 32 1 2 2 2 3 3 1 0 2 1 3 1 0 1 2 0 1 0 2 1 3 0 0 31 1 2 0 3 2 3 2 3 3 3 0 3 3 1 3 0 3 3 0 3 1 3 1 04 0 1 1 1 2 2 2 1 1 1 2 2 2 2 2 2 2 2 2 2 2 1 1 21 2 2 0 0 0 0 2 2 2 2 2 2 2 0 0 2 2 1 2 2 2 2 1 13 0 2 2 3 1 3 2 2 2 2 3 0 2 0 0 2 2 2 3 3 0 2 2 22 1 1 1 2 2 3 1 1 1 2 1 2 1 3 1 0 2 2 0 2 0 1 1 33 2 3 2 3 3 3 2 2 3 3 3 3 2 3 1 2 2 3 2 3 2 2 3 13 0 1 1 2 2 3 2 2 2 2 3 2 2 2 1 2 1 1 1 2 2 1 2 33 0 2 1 1 0 0 0 1 1 1 1 2 2 2 0 0 1 1 1 2 2 1 2 22 0 0 3 0 0 3 0 0 0 0 3 3 0 0 0 0 2 0 0 0 3 0 0 01 0 2 0 0 2 3 2 1 1 2 1 2 2 2 3 2 3 2 2 2 2 2 2 02 1 0 2 3 3 3 2 2 3 3 2 2 1 2 3 2 2 2 2 2 1 2 1 02 0 3 2 2 2 2 3 2 3 3 2 2 2 2 3 2 2 2 2 1 1 1 1 11 3 2 0 3 3 3 2 3 3 2 2 2 2 2 2 2 3 3 2 1 3 3 1 12 0 3 2 2 3 2 2 3 3 2 0 2 2 2 1 2 2 2 2 2 2 3 2 24 0 3 3 3 3 3 3 3 3 3 2 3 3 3 2 2 2 2 1 2 1 2 2 24 0 2 3 3 2 3 2 2 2 2 0 3 2 3 0 3 3 2 2 3 1 3 2 02 0 2 0 2 2 2 2 1 2 2 3 2 2 1 2 0 2 2 1 0 2 1 1 14 1 0 0 3 2 3 0 3 1 0 3 0 2 0 2 0 0 2 0 0 0 1 0 02 2 2 2 2 3 3 3 2 2 2 3 2 3 2 2 2 1 3 3 2 1 2 3 12 2 2 2 3 2 3 3 2 2 3 3 3 2 1 2 2 2 2 2 1 2 2 2 11 2 3 2 2 1 2 3 2 1 2 1 3 3 2 1 1 3 2 3 1 3 3 3 23 2 3 2 3 3 3 2 2 3 3 3 3 2 3 1 2 2 3 2 3 2 2 3 12 3 2 3 3 2 3 1 3 2 1 2 1 3 2 1 3 3 2 3 1 2 2 2 23 2 3 2 3 1 2 3 2 2 3 1 2 3 2 1 3 2 2 2 3 2 1 3 23 2 3 3 3 3 3 2 2 3 2 3 3 1 3 1 2 2 3 2 3 3 2 3 1
124 157 135 189 169 207 145 155 160 163 196 165 159 162 121 131 160 181 140 166 162 159 162 131innovativebureaucraticsupportive
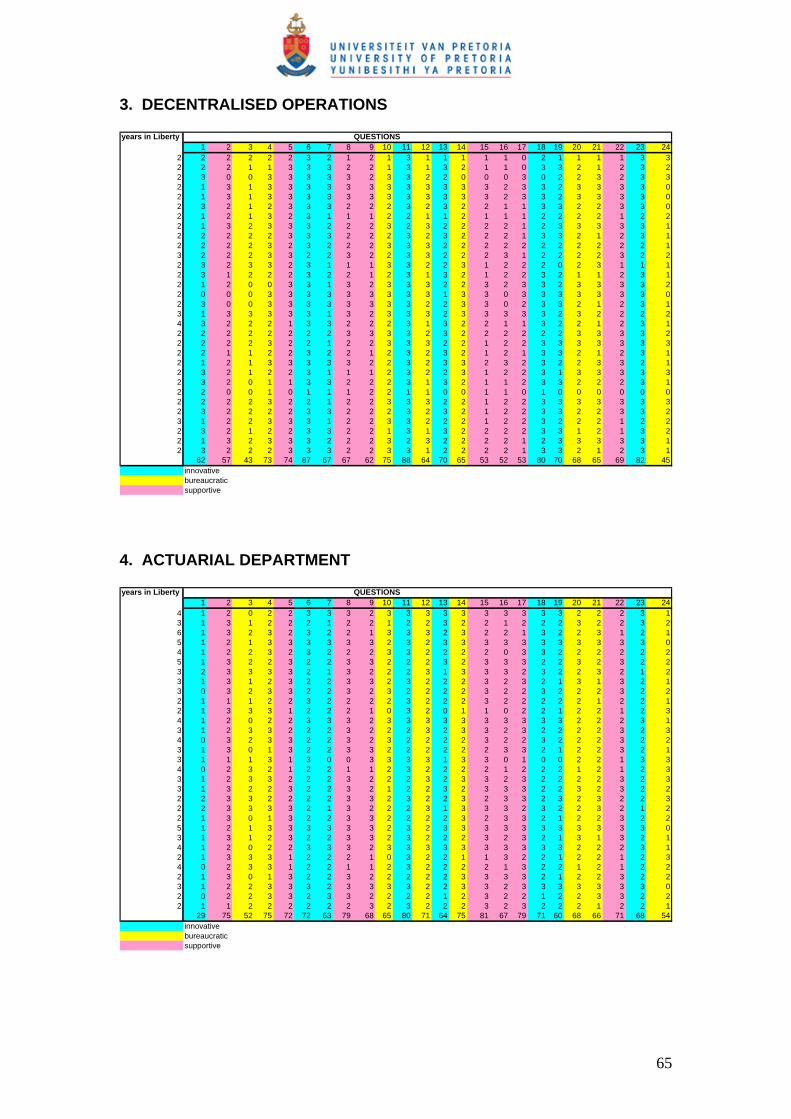
65
3. DECENTRALISED OPERATIONS
years in Liberty QUESTIONS1 2 3 4 5 6 7 8 9 10 11 12 13 14 15 16 17 18 19 20 21 22 23 24
2 2 2 2 2 2 3 2 1 2 1 3 1 1 1 1 1 0 2 1 1 1 1 3 32 2 2 1 1 3 3 3 2 2 1 3 1 3 2 1 1 0 3 3 2 1 2 3 22 3 0 0 3 3 3 3 3 2 3 3 2 2 0 0 0 3 0 2 2 3 2 3 32 1 3 1 3 3 3 3 3 3 3 3 3 3 3 3 2 3 3 2 3 3 3 3 02 1 3 1 3 3 3 3 3 3 3 3 3 3 3 3 2 3 3 2 3 3 3 3 02 3 2 1 2 3 3 3 2 2 2 3 2 3 2 2 1 1 3 3 2 2 3 3 02 1 2 1 3 2 3 1 1 1 2 2 1 1 2 1 1 1 2 2 2 2 1 2 22 1 3 2 3 3 3 2 2 2 3 2 3 2 2 2 2 1 2 3 3 3 3 3 12 2 2 2 2 3 3 3 2 2 2 3 2 3 2 2 2 1 3 3 2 1 2 3 12 2 2 2 3 2 3 2 2 2 3 3 3 2 2 2 2 2 2 2 2 2 2 2 13 2 2 2 3 3 2 2 3 2 2 3 3 2 2 2 3 1 2 2 2 2 3 2 22 3 2 3 3 2 3 1 1 1 3 3 2 2 3 1 2 2 2 0 2 3 1 1 12 3 1 2 2 2 3 2 2 1 2 3 1 3 2 1 2 2 3 2 1 1 2 3 12 1 2 0 0 3 3 1 3 2 3 3 3 2 2 3 2 3 3 2 3 3 3 3 22 0 0 0 3 3 3 3 3 3 3 3 3 1 3 3 0 3 3 3 3 3 3 3 02 3 0 0 3 3 3 3 3 3 3 3 2 2 3 3 0 2 3 3 2 1 2 3 13 1 3 3 3 3 3 1 3 2 3 3 3 2 3 3 3 3 3 2 3 2 2 2 24 3 2 2 2 1 3 3 2 2 2 3 1 3 2 2 1 1 3 2 2 1 2 3 12 2 2 2 2 2 2 2 3 3 3 3 2 3 2 2 2 2 2 2 3 3 3 3 22 2 2 2 3 2 2 1 2 2 3 3 3 2 2 1 2 2 3 3 3 3 3 3 32 2 1 1 2 2 3 2 2 1 2 3 2 3 2 1 2 1 3 3 2 1 2 3 12 1 2 1 3 3 3 3 3 2 2 3 2 3 3 2 3 2 3 2 2 3 3 2 12 3 2 1 2 2 3 1 1 1 2 3 2 2 3 1 2 2 3 1 3 3 3 3 32 3 2 0 1 1 3 3 2 2 2 3 1 3 2 1 1 2 3 3 2 2 2 3 12 2 0 0 1 0 1 1 1 2 2 1 1 0 0 1 1 0 1 0 0 0 0 0 02 2 2 2 3 2 2 1 2 2 3 3 3 2 2 1 2 2 3 3 3 3 3 3 32 3 2 2 2 2 3 3 2 2 2 3 2 3 2 1 2 2 3 3 2 2 3 3 23 1 2 2 3 3 3 1 2 2 3 3 2 2 2 1 2 2 3 2 2 2 1 2 22 3 2 1 2 2 3 3 2 2 1 3 1 3 2 2 2 2 3 3 1 2 1 3 22 1 3 2 3 3 3 2 2 2 3 2 3 2 2 2 2 1 2 3 3 3 3 3 12 3 2 2 2 3 3 3 2 2 3 3 1 2 2 2 2 1 3 3 2 1 2 3 1
62 57 43 73 74 87 67 67 62 75 88 64 70 65 53 52 53 80 70 68 65 69 82 45innovativebureaucraticsupportive
4. ACTUARIAL DEPARTMENT
years in Liberty QUESTIONS1 2 3 4 5 6 7 8 9 10 11 12 13 14 15 16 17 18 19 20 21 22 23 24
4 1 2 0 2 2 3 3 3 2 3 3 3 3 3 3 3 3 3 3 2 2 2 3 13 1 3 1 2 2 2 1 2 2 1 2 2 3 2 2 1 2 2 2 3 2 2 3 26 1 3 2 3 2 3 2 2 1 3 3 3 2 3 2 2 1 3 2 2 3 1 2 15 1 2 1 3 3 3 3 3 3 2 3 2 3 3 3 3 3 3 3 3 3 3 3 04 1 2 2 3 2 3 2 2 2 3 3 2 2 2 2 0 3 3 2 2 2 2 2 25 1 3 2 2 3 2 2 3 3 2 2 2 3 2 3 3 3 2 2 3 2 3 2 23 2 3 3 3 3 2 1 3 2 2 2 3 1 3 3 3 2 3 2 2 3 2 1 23 1 3 1 2 3 2 2 3 3 2 3 2 2 2 3 2 3 2 1 3 1 3 2 13 0 3 2 3 3 2 2 3 2 3 2 2 2 2 3 2 2 3 2 2 2 3 2 22 1 1 1 2 2 3 2 2 2 2 3 2 2 2 3 2 2 2 2 2 1 2 2 12 1 3 3 3 1 2 2 2 1 0 3 2 0 1 1 0 2 2 1 2 2 1 2 34 1 2 0 2 2 3 3 3 2 3 3 3 3 3 3 3 3 3 3 2 2 2 3 13 1 2 3 3 2 2 2 3 2 2 2 3 2 3 3 2 3 2 2 2 2 3 2 34 0 3 2 3 3 2 2 3 2 3 2 2 2 2 3 2 2 3 2 2 2 3 2 23 1 3 0 1 3 2 2 3 3 2 2 2 2 2 2 3 3 2 1 2 2 3 2 13 1 1 1 3 1 3 0 0 3 3 3 3 1 3 3 0 1 0 0 2 2 1 3 34 0 2 3 2 1 2 2 1 1 2 3 2 2 2 2 1 2 2 2 1 2 1 2 33 1 2 3 3 2 2 2 3 2 2 2 3 2 3 3 2 3 2 2 2 2 3 2 33 1 3 2 2 3 2 2 3 2 1 2 2 3 2 3 3 3 2 2 3 2 3 2 22 2 3 3 2 2 2 2 3 3 2 3 2 2 3 2 3 3 2 3 2 3 2 2 32 2 3 3 3 3 2 1 3 2 2 2 3 1 3 3 3 2 3 2 2 3 2 1 22 1 3 0 1 3 2 2 3 3 2 2 2 2 3 2 3 3 2 1 2 2 3 2 25 1 2 1 3 3 3 3 3 3 2 3 2 3 3 3 3 3 3 3 3 3 3 3 03 1 3 1 2 3 2 2 3 3 2 3 2 2 2 3 2 3 2 1 3 1 3 2 14 1 2 0 2 2 3 3 3 2 3 3 3 3 3 3 3 3 3 3 2 2 2 3 12 1 3 3 3 1 2 2 2 1 0 3 2 2 1 1 3 2 2 1 2 2 1 2 34 0 2 3 3 1 2 2 1 1 2 3 2 2 2 2 1 3 2 2 1 2 1 2 22 1 3 0 1 3 2 2 3 2 2 2 2 2 3 3 3 3 2 1 2 2 3 2 23 1 2 2 3 3 3 2 3 3 3 3 2 2 3 3 2 3 3 3 3 3 3 3 02 0 2 2 3 3 2 3 3 2 2 2 2 1 2 3 2 2 1 2 2 3 3 2 22 1 1 2 2 2 2 2 2 3 2 3 2 2 2 3 2 3 2 2 2 1 2 2 1
29 75 52 75 72 72 63 79 68 65 80 71 64 75 81 67 79 71 60 68 66 71 68 54innovativebureaucraticsupportive

66
APPENDIX 3: PERFORMANCE RESULTS 1. CLAIMS
Claims: July 2006
Date Total cases Total cases outside SLA Date Percentage outside SLA
03/07/2006 773 135 03/07/2006 17.46%04/07/2006 803 150 04/07/2006 18.68%05/07/2006 828 147 05/07/2006 17.75%06/07/2006 809 218 06/07/2006 26.95%07/07/2006 746 149 07/07/2006 19.97%10/07/2006 806 134 10/07/2006 16.63%11/07/2006 804 179 11/07/2006 22.26%12/07/2006 804 189 12/07/2006 23.51%13/07/2006 774 183 13/07/2006 23.64%14/07/2006 671 143 14/07/2006 21.31%17/07/2006 693 149 17/07/2006 21.50%18/07/2006 711 143 18/07/2006 20.11%19/07/2006 671 125 19/07/2006 18.63%20/07/2006 704 147 20/07/2006 20.88%21/07/2006 701 146 21/07/2006 20.83%24/07/2006 703 106 24/07/2006 15.08%25/07/2006 747 149 25/07/2006 19.95%26/07/2006 708 146 26/07/2006 20.62%27/07/2006 698 133 27/07/2006 19.05%28/07/2006 697 141 28/07/2006 20.23%31/07/2006 738 127 31/07/2006 17.21%
Claims: August 2006
Date Total cases Total cases outside SLA Date Percentage outside SLA
01/08/2006 691 130 01/08/2006 18.81%02/08/2006 832 159 02/08/2006 19.11%03/08/2006 896 199 03/08/2006 22.21%04/08/2006 853 202 04/08/2006 23.68%07/08/2006 878 165 07/08/2006 18.79%08/08/2006 861 215 08/08/2006 24.97%10/08/2006 918 307 10/08/2006 33.44%11/08/2006 907 319 11/08/2006 35.17%14/08/2006 851 295 14/08/2006 34.67%15/08/2006 823 280 15/08/2006 34.02%16/08/2006 843 214 16/08/2006 25.39%17/08/2006 806 165 17/08/2006 20.47%18/08/2006 767 163 18/08/2006 21.25%21/08/2006 751 161 21/08/2006 21.44%22/08/2006 641 138 22/08/2006 21.53%23/08/2006 491 70 23/08/2006 14.26%24/08/2006 577 86 24/08/2006 14.90%25/08/2006 610 84 25/08/2006 13.77%28/08/2006 634 74 28/08/2006 11.67%30/08/2006 623 95 30/08/2006 15.25%31/08/2006 622 99 31/08/2006 15.92%

67
Claims: September 2006
Date Total cases Total cases outside SLA Date Percentage outside SLA
01/09/2006 583 95 01/09/2006 16.30%04/09/2006 603 81 04/09/2006 13.43%05/09/2006 673 107 05/09/2006 15.90%06/09/2006 695 83 06/09/2006 11.94%07/09/2006 723 96 07/09/2006 13.28%08/09/2006 660 127 08/09/2006 19.24%11/09/2006 554 89 11/09/2006 16.06%12/09/2006 642 76 12/09/2006 11.84%13/09/2006 548 44 13/09/2006 8.03%14/09/2006 530 55 14/09/2006 10.38%15/09/2006 571 91 15/09/2006 15.94%18/09/2006 526 83 18/09/2006 15.78%19/09/2006 578 99 19/09/2006 17.13%20/09/2006 615 95 20/09/2006 15.45%21/09/2006 613 85 21/09/2006 13.87%22/09/2006 583 93 22/09/2006 15.95%26/09/2006 673 127 26/09/2006 18.87%27/09/2006 669 166 27/09/2006 24.81%28/09/2006 595 152 28/09/2006 25.55%29/09/2006 565 159 29/09/2006 28.14%
2. DISBURSEMENTS & POLICY CHANGES
Disbursements & Policy Changes: July 2006
Date Total cases Total cases outside SLA Date Percentage outside SLA
03/07/2006 4036 65 03/07/2006 1.61%04/07/2006 4026 203 04/07/2006 5.04%05/07/2006 4069 415 05/07/2006 10.20%06/07/2006 4029 361 06/07/2006 8.96%07/07/2006 3548 377 07/07/2006 10.63%10/07/2006 3201 170 10/07/2006 5.31%11/07/2006 3176 203 11/07/2006 6.39%12/07/2006 3089 195 12/07/2006 6.31%13/07/2006 3223 201 13/07/2006 6.24%14/07/2006 2661 193 14/07/2006 7.25%17/07/2006 2562 118 17/07/2006 4.61%18/07/2006 2495 126 18/07/2006 5.05%19/07/2006 2378 94 19/07/2006 3.95%20/07/2006 2164 89 20/07/2006 4.11%21/07/2006 1794 92 21/07/2006 5.13%24/07/2006 1542 40 24/07/2006 2.59%25/07/2006 1804 66 25/07/2006 3.66%26/07/2006 1743 59 26/07/2006 3.38%27/07/2006 1861 57 27/07/2006 3.06%28/07/2006 2523 69 28/07/2006 2.73%31/07/2006 2250 34 31/07/2006 1.51%
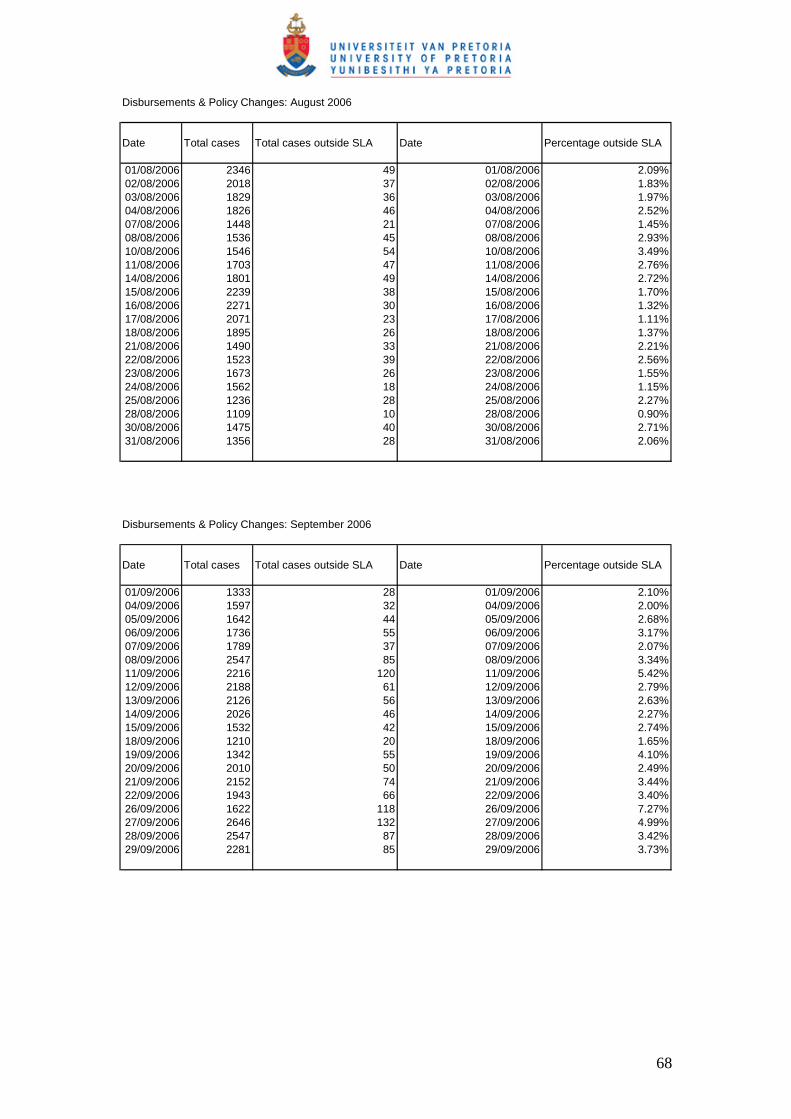
68
Disbursements & Policy Changes: August 2006
Date Total cases Total cases outside SLA Date Percentage outside SLA
01/08/2006 2346 49 01/08/2006 2.09%02/08/2006 2018 37 02/08/2006 1.83%03/08/2006 1829 36 03/08/2006 1.97%04/08/2006 1826 46 04/08/2006 2.52%07/08/2006 1448 21 07/08/2006 1.45%08/08/2006 1536 45 08/08/2006 2.93%10/08/2006 1546 54 10/08/2006 3.49%11/08/2006 1703 47 11/08/2006 2.76%14/08/2006 1801 49 14/08/2006 2.72%15/08/2006 2239 38 15/08/2006 1.70%16/08/2006 2271 30 16/08/2006 1.32%17/08/2006 2071 23 17/08/2006 1.11%18/08/2006 1895 26 18/08/2006 1.37%21/08/2006 1490 33 21/08/2006 2.21%22/08/2006 1523 39 22/08/2006 2.56%23/08/2006 1673 26 23/08/2006 1.55%24/08/2006 1562 18 24/08/2006 1.15%25/08/2006 1236 28 25/08/2006 2.27%28/08/2006 1109 10 28/08/2006 0.90%30/08/2006 1475 40 30/08/2006 2.71%31/08/2006 1356 28 31/08/2006 2.06%
Disbursements & Policy Changes: September 2006
Date Total cases Total cases outside SLA Date Percentage outside SLA
01/09/2006 1333 28 01/09/2006 2.10%04/09/2006 1597 32 04/09/2006 2.00%05/09/2006 1642 44 05/09/2006 2.68%06/09/2006 1736 55 06/09/2006 3.17%07/09/2006 1789 37 07/09/2006 2.07%08/09/2006 2547 85 08/09/2006 3.34%11/09/2006 2216 120 11/09/2006 5.42%12/09/2006 2188 61 12/09/2006 2.79%13/09/2006 2126 56 13/09/2006 2.63%14/09/2006 2026 46 14/09/2006 2.27%15/09/2006 1532 42 15/09/2006 2.74%18/09/2006 1210 20 18/09/2006 1.65%19/09/2006 1342 55 19/09/2006 4.10%20/09/2006 2010 50 20/09/2006 2.49%21/09/2006 2152 74 21/09/2006 3.44%22/09/2006 1943 66 22/09/2006 3.40%26/09/2006 1622 118 26/09/2006 7.27%27/09/2006 2646 132 27/09/2006 4.99%28/09/2006 2547 87 28/09/2006 3.42%29/09/2006 2281 85 29/09/2006 3.73%
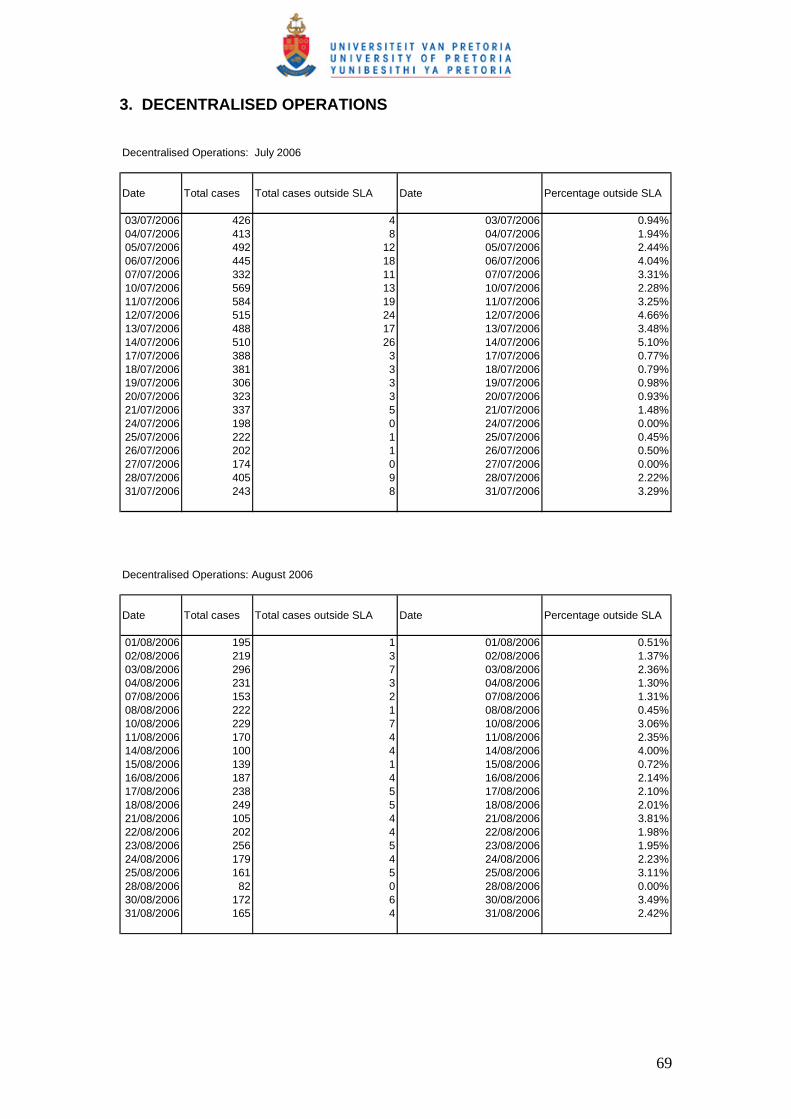
69
3. DECENTRALISED OPERATIONS
Decentralised Operations: July 2006
Date Total cases Total cases outside SLA Date Percentage outside SLA
03/07/2006 426 4 03/07/2006 0.94%04/07/2006 413 8 04/07/2006 1.94%05/07/2006 492 12 05/07/2006 2.44%06/07/2006 445 18 06/07/2006 4.04%07/07/2006 332 11 07/07/2006 3.31%10/07/2006 569 13 10/07/2006 2.28%11/07/2006 584 19 11/07/2006 3.25%12/07/2006 515 24 12/07/2006 4.66%13/07/2006 488 17 13/07/2006 3.48%14/07/2006 510 26 14/07/2006 5.10%17/07/2006 388 3 17/07/2006 0.77%18/07/2006 381 3 18/07/2006 0.79%19/07/2006 306 3 19/07/2006 0.98%20/07/2006 323 3 20/07/2006 0.93%21/07/2006 337 5 21/07/2006 1.48%24/07/2006 198 0 24/07/2006 0.00%25/07/2006 222 1 25/07/2006 0.45%26/07/2006 202 1 26/07/2006 0.50%27/07/2006 174 0 27/07/2006 0.00%28/07/2006 405 9 28/07/2006 2.22%31/07/2006 243 8 31/07/2006 3.29%
Decentralised Operations: August 2006
Date Total cases Total cases outside SLA Date Percentage outside SLA
01/08/2006 195 1 01/08/2006 0.51%02/08/2006 219 3 02/08/2006 1.37%03/08/2006 296 7 03/08/2006 2.36%04/08/2006 231 3 04/08/2006 1.30%07/08/2006 153 2 07/08/2006 1.31%08/08/2006 222 1 08/08/2006 0.45%10/08/2006 229 7 10/08/2006 3.06%11/08/2006 170 4 11/08/2006 2.35%14/08/2006 100 4 14/08/2006 4.00%15/08/2006 139 1 15/08/2006 0.72%16/08/2006 187 4 16/08/2006 2.14%17/08/2006 238 5 17/08/2006 2.10%18/08/2006 249 5 18/08/2006 2.01%21/08/2006 105 4 21/08/2006 3.81%22/08/2006 202 4 22/08/2006 1.98%23/08/2006 256 5 23/08/2006 1.95%24/08/2006 179 4 24/08/2006 2.23%25/08/2006 161 5 25/08/2006 3.11%28/08/2006 82 0 28/08/2006 0.00%30/08/2006 172 6 30/08/2006 3.49%31/08/2006 165 4 31/08/2006 2.42%
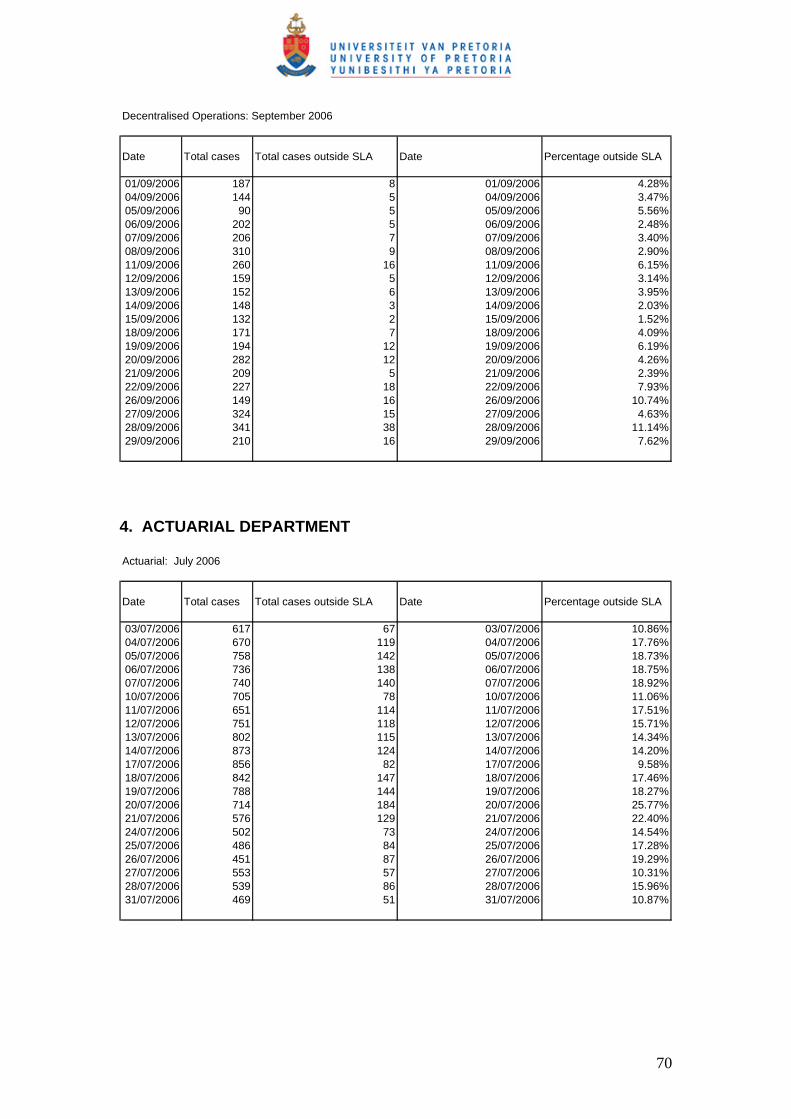
70
Decentralised Operations: September 2006
Date Total cases Total cases outside SLA Date Percentage outside SLA
01/09/2006 187 8 01/09/2006 4.28%04/09/2006 144 5 04/09/2006 3.47%05/09/2006 90 5 05/09/2006 5.56%06/09/2006 202 5 06/09/2006 2.48%07/09/2006 206 7 07/09/2006 3.40%08/09/2006 310 9 08/09/2006 2.90%11/09/2006 260 16 11/09/2006 6.15%12/09/2006 159 5 12/09/2006 3.14%13/09/2006 152 6 13/09/2006 3.95%14/09/2006 148 3 14/09/2006 2.03%15/09/2006 132 2 15/09/2006 1.52%18/09/2006 171 7 18/09/2006 4.09%19/09/2006 194 12 19/09/2006 6.19%20/09/2006 282 12 20/09/2006 4.26%21/09/2006 209 5 21/09/2006 2.39%22/09/2006 227 18 22/09/2006 7.93%26/09/2006 149 16 26/09/2006 10.74%27/09/2006 324 15 27/09/2006 4.63%28/09/2006 341 38 28/09/2006 11.14%29/09/2006 210 16 29/09/2006 7.62%
4. ACTUARIAL DEPARTMENT
Actuarial: July 2006
Date Total cases Total cases outside SLA Date Percentage outside SLA
03/07/2006 617 67 03/07/2006 10.86%04/07/2006 670 119 04/07/2006 17.76%05/07/2006 758 142 05/07/2006 18.73%06/07/2006 736 138 06/07/2006 18.75%07/07/2006 740 140 07/07/2006 18.92%10/07/2006 705 78 10/07/2006 11.06%11/07/2006 651 114 11/07/2006 17.51%12/07/2006 751 118 12/07/2006 15.71%13/07/2006 802 115 13/07/2006 14.34%14/07/2006 873 124 14/07/2006 14.20%17/07/2006 856 82 17/07/2006 9.58%18/07/2006 842 147 18/07/2006 17.46%19/07/2006 788 144 19/07/2006 18.27%20/07/2006 714 184 20/07/2006 25.77%21/07/2006 576 129 21/07/2006 22.40%24/07/2006 502 73 24/07/2006 14.54%25/07/2006 486 84 25/07/2006 17.28%26/07/2006 451 87 26/07/2006 19.29%27/07/2006 553 57 27/07/2006 10.31%28/07/2006 539 86 28/07/2006 15.96%31/07/2006 469 51 31/07/2006 10.87%

71
Actuarial: August 2006
Date Total cases Total cases outside SLA Date Percentage outside SLA
01/08/2006 425 56 01/08/2006 13.18%02/08/2006 431 61 02/08/2006 14.15%03/08/2006 420 45 03/08/2006 10.71%04/08/2006 331 35 04/08/2006 10.57%07/08/2006 283 11 07/08/2006 3.89%08/08/2006 261 13 08/08/2006 4.98%10/08/2006 289 13 10/08/2006 4.50%11/08/2006 287 8 11/08/2006 2.79%14/08/2006 284 6 14/08/2006 2.11%15/08/2006 318 18 15/08/2006 5.66%16/08/2006 352 10 16/08/2006 2.84%17/08/2006 342 18 17/08/2006 5.26%18/08/2006 356 9 18/08/2006 2.53%21/08/2006 310 11 21/08/2006 3.55%22/08/2006 318 25 22/08/2006 7.86%23/08/2006 385 33 23/08/2006 8.57%24/08/2006 453 17 24/08/2006 3.75%25/08/2006 366 13 25/08/2006 3.55%28/08/2006 376 9 28/08/2006 2.39%30/08/2006 353 21 30/08/2006 5.95%31/08/2006 377 18 31/08/2006 4.77%
Actuarial: September 2006
Date Total cases Total cases outside SLA Date Percentage outside SLA
01/09/2006 378 15 01/09/2006 3.97%04/09/2006 385 13 04/09/2006 3.38%05/09/2006 503 13 05/09/2006 2.58%06/09/2006 491 13 06/09/2006 2.65%07/09/2006 363 13 07/09/2006 3.58%08/09/2006 300 26 08/09/2006 8.67%11/09/2006 464 23 11/09/2006 4.96%12/09/2006 373 20 12/09/2006 5.36%13/09/2006 378 30 13/09/2006 7.94%14/09/2006 330 19 14/09/2006 5.76%15/09/2006 314 12 15/09/2006 3.82%18/09/2006 276 9 18/09/2006 3.26%19/09/2006 284 11 19/09/2006 3.87%20/09/2006 266 13 20/09/2006 4.89%21/09/2006 268 11 21/09/2006 4.10%22/09/2006 243 15 22/09/2006 6.17%26/09/2006 210 11 26/09/2006 5.24%27/09/2006 293 13 27/09/2006 4.44%28/09/2006 273 12 28/09/2006 4.40%29/09/2006 382 13 29/09/2006 3.40%