Oregon Economic and Revenue Forecast - State...
59
Oregon Economic and Revenue Forecast March 2014 Volume XXXIV, No. 1 Release Date: February 12, 2014 Michael Jordan John A. Kitzhaber, MD Prepared By: Chief Operating Officer Governor Office of Economic Analysis DAS Director Department of Administrative Services
Transcript of Oregon Economic and Revenue Forecast - State...

Oregon Economic and
Revenue Forecast
March 2014
Volume XXXIV, No. 1 Release Date: February 12, 2014
Michael Jordan John A. Kitzhaber, MD Prepared By:
Chief Operating Officer Governor Office of Economic Analysis
DAS Director Department of Administrative Services

2
Department of Administrative Services
Michael Jordan DAS Director
Chief Operating Officer
Office of Economic Analysis
Mark McMullen, State Economist Josh Lehner, Senior Economist
Kanhaiya Vaidya, Senior Demographer Michael Kennedy, Senior Economist
Kris Klemm, Executive Assistant
http://oregon.gov/DAS/OEA http://oregoneconomicanalysis.com http://twitter.com/OR_EconAnalysis

3
Foreword This document contains the Oregon economic and revenue forecasts. The Oregon economic forecast is published to provide information to planners and policy makers in state agencies and private organizations for use in their decision making processes. The Oregon revenue forecast is published to open the revenue forecasting process to public review. It is the basis for much of the budgeting in state government. The report is issued four times a year; in March, June, September, and December. The economic model assumptions and results are reviewed by the Department of Administrative Services Economic Advisory Committee and by the Governor's Council of Economic Advisors. The Department of Administrative Services Economic Advisory Committee consists of 15 economists employed by state agencies, while the Governor's Council of Economic Advisors is a group of 12 economists from academia, finance, utilities, and industry. Members of the Economic Advisory Committee and the Governor's Council of Economic Advisors provide a two-way flow of information. The Department of Administrative Services makes preliminary forecasts and receives feedback on the reasonableness of such forecasts and assumptions employed. After the discussion of the preliminary forecast, the Department of Administrative Services makes a final forecast using the suggestions and comments made by the two reviewing committees. The results from the economic model are in turn used to provide a preliminary forecast for state tax revenues. The preliminary results are reviewed by the Council of Revenue Forecast Advisors. The Council of Revenue Forecast Advisors consists of 15 specialists with backgrounds in accounting, financial planning, and economics. Members bring specific specialties in tax issues and represent private practices, accounting firms, corporations, government (Oregon Department of Revenue and Legislative Revenue Office), and the Governor’s Council of Economic Advisors. After discussion of the preliminary revenue forecast, the Department of Administrative Services makes the final revenue forecast using the suggestions and comments made by the reviewing committee. Readers who have questions or wish to submit suggestions may contact the Office of Economic Analysis by telephone at 503-378-3405.
Michael Jordan DAS Director Chief Operating Officer

4
Table of Contents
EXECUTIVE SUMMARY .………………………………………….……...…….…….....……………. 5
ECONOMIC OUTLOOK ……………………………………………………………….………………. 6
U.S. Economy ……………………………………………………………..….…………………… 6
Oregon Economy ……………………………………………………………...…………………. 9
Oregon Labor Market …………………………………………….……………..………............. 10
Leading Indicators ……………………………………………………………..…………………. 12
Short-term Outlook ………………………………………………………………..………………. 13
Forecast Risks ………………………………………………………………..………….............. 15
Alternative Scenarios ………………………………………………………..…………………… 17
Extended Outlook ……………………………………………………………..………………….. 18
Exports ………………………………………………………………..……………………………. 19
Regional Trends ……………………………………………..……………………………………. 20
State Comparisons ………………………………………………………………………………… 24
REVENUE OUTLOOK ………………………………………………………………………… 25
General Fund Revenues, 2013-15 ………………………..……………………………………. 25
Extended Outlook ………………………………………..……………………………………….. 27
Tax Law Assumptions …………………………………..………………………………............. 27
Alternative Scenarios ……………………………………..……………………………………… 28
Lottery Outlook …………………………………………..……………………………….............. 29
Budgetary Reserves …………………………………..………………………..……….............. 31
POPULATION AND DEMOGRAPHIC OUTLOOK ………………………………………… 32
APPENDIX A: ECONOMIC …………………………………………………………………… 34
APPENDIX B: REVENUE …………………………………………………………………...... 42
APPENDIX C: DEMOGRAPHIC ………….………………………………………………..... 55

5
Executive Summary
March 2014
As the nationwide economic expansion enters its sixth year, signs continue to emerge that growth will improve
relative to the lackluster rates seen during the recovery to date. Much of the improvement seen in the economic
landscape thus far was expected, and can be traced to the housing rebound and improvements in state and local
government budgets. In recent months, the increasingly optimistic outlook among forecasters and economists is
largely attributable to the resolution of the budget impasse in Washington D.C. and the continuation of the strong
manufacturing cycle.
The federal budget passed in late 2013 reduces the near-term fiscal drag by half relative to the cuts called for by
the sequester plan that had been in place at the time. The budget deal also alleviated some of the uncertainty
surrounding the policy environment that was dampening private investment activity. Combined with the strong
manufacturing sector, the overall forecast remains relatively bright. Both new manufacturing orders and actual
deliveries remain near all-time highs. Bad weather in early 2014 has grounded some manufacturing indicators in
the most recent period. However, this will likely prove temporary.
In Oregon, the economy has already experienced an acceleration in job growth in 2013. Similar to the U.S. as a
whole, this was largely due to improvement in housing and the public sector. As a result, more regions of the state
began adding jobs. The question then becomes: Can the state expect a further increase in the rate of growth?
The likely answer is yes. Early in recovery, the Portland metropolitan area was responsible for nearly all jobs gained
statewide. This changed in 2013. Portland continued to add jobs at a steady and healthy rate, however other areas
including Bend and Medford began adding jobs as well. In the past few months, Bend and Medford have slowed as
the nationwide housing rebound stalled as these metros are among the most heavily influenced by an influx of
migrants and housing activity. Statewide growth did not decelerate along with these two areas however, since
private sector job gains in the Salem area accelerated strongly to pick up the slack. However, not all regions of the
state are on board yet. In particular, Eugene has further room for growth, as do many of the state’s more rural areas.
Looking forward growth is likely to pick up a bit further, into the 40,000 jobs per year range, or an annual growth
rate of 2.4 percent in 2015
Despite the improved economic outlook, expectations for General Fund revenue growth have remained largely
unchanged since the December 2013 quarterly forecast. The additional job growth reflected in the March 2014
forecast will bring with it substantial state tax collections. However, these additional revenues are expected to be
largely offset by the impact of recent tax collections, which have been coming in well below expectations.
Despite rising stock market and housing prices, the outlook for taxable investment income remains subdued in the
near term. Many Oregonians cashed out capital gains in 2012 in anticipation of federal tax rate increases, leaving
fewer gains to be realized for tax purposes going forward. However, if equity markets are able to hold on to much
of their recent appreciation, personal income tax
payments will grow rapidly once again in April 2015.
Although the revenue outlook remains on track, the
2013-15 biennium is still young, and therefore
significant uncertainty remains. Two income tax
filing seasons remain between now and the end of
the biennium. As such, many risks to the outlook
remain. On the upside, if asset markets continue to
boom or if Oregon’s traditionally strong migration
trends and labor force growth reappear, a short-term
spike in revenues remains possible during the 2013-
15 budget period. At this point, it would take only
about $100 million in unanticipated revenue to trigger
the kicker law.
(Millions)
March 2014
Forecast
Change from
Prior Forecast
Change from
COS Forecast
Structural Revenues
Personal Income Tax $13,771.6 $55.5 $213.4
Corporate Income Tax $1,005.9 -$24.6 -$50.7
All Other Revenues $1,004.4 -$11.9 -$23.5
Gross GF Revenues $15,781.9 $19.0 $139.3
Offsets and Transfers -$67.3 $0.2 $53.5
Administrative Actions1 -$12.7 $0.9 $5.6
Legislative Actions -$136.9 $0.0 $0.0
Net Available Resources $16,027.0 $20.1 $116.9
Confidence Intervals
67% Confidence +/- 6.6% $1,034.9
95% Confidence +/- 13.1% $2,069.9
2013-15 General Fund Forecast Summary

6
ECONOMIC OUTLOOK
U.S. Economic Summary
As the nationwide economic expansion enters its sixth year, signs continue to emerge that growth will improve
relative to the lackluster rates seen during the recovery to date. Much of the improvement seen in the economic
landscape thus far was expected, and can be traced to the housing rebound and improvements in state and local
government budgets. In recent months, the increasingly optimistic outlook among forecasters and economists is
largely attributable to the resolution of the budget impasse in Washington D.C. and the continuation of the strong
manufacturing cycle.
The federal budget passed in late 2013 reduces the near-term fiscal drag by half relative to the cuts called for by
the sequester plan that had been in place at the time. The budget deal also alleviated some of the uncertainty
surrounding the policy environment that was dampening private investment activity. Longer run fiscal challenges
remain, although those prospects have improved considerably in recent years with a more bullish economic outlook,
already enacted spending cuts and revenue increases and slower growth in healthcare costs. Combined with the
strong manufacturing sector, the overall forecast remains relatively bright. Both new manufacturing orders and
actual deliveries remain near all-time highs. Bad weather in early 2014 has grounded some manufacturing indicators
in the most recent period. However, this will likely prove temporary.
Alongside continued improvement in housing markets, these factors result in a stronger outlook. National job growth
is expected to improve to nearly 250,000 jobs per month by 2015 – above the recent trend of 180,000 – and GDP
growth will pick up to around 3 percent per year. None of these figures indicate the recovery has reached escape
velocity, however they do represent marked improvement relative to recovery to date.
U.S. Economic Detail
The economic landscape continues to brighten
as more signs are emerging that growth will
accelerate this year and next. While the housing
rebound has big regional implications for the
hardest hit areas of the country that are now
returning to growth, the two main sources of
increased optimism in recent months are a
more certain and less austere federal spending
environment, and the continued strength in
manufacturing.
Most businesses remain profitable and have
access to ample capital. With less uncertainty
about the future, and production nearing
capacity limits in many industries, it is likely that
more businesses will take the leap and expand
their operations thorugh investment and hiring.
Despite the gridlock and political polarization in
the nation’s capitol in recent years, the budget deal reached just before the close of 2013 has two primary
implications for the economy. The first is more qualitative and subjective as being able to reach any agreement is
good news and hopefully signals that some of the brinkmanship has subsided. The debt ceiling debacle in 2011
and the federal government shutdown in 2013 had measureable impacts on consumer and business sentiment
surveys. Whether these short lived events impacted economic growth directly is open to some debate, however
they did have pyschological effects on how businesses and workers viewed the outlook. Second, and most
importantly in the near term, the budget deal reduced the fiscal drag on the recovery. Economic estimates indicate
that the federal austerity – the combination of tax increases and spending cuts – in 2013 reduced GDP growth by
-
50,000
100,000
150,000
200,000
250,000
300,000
1.0%
1.5%
2.0%
2.5%
3.0%
3.5%
4.0%
2011Q1 2012Q3 2014Q1 2015Q3
U.S. Growth Poised to Accelerate
Monthly Job Gains (rhs) Real GDP (lhs)
Forecast -->
Source: IHS Economics

7
approximately 1.5 percentage points1, which is the largest since World War II. Revised estimates for 2014 after the
budget deal show a fiscal drag of approximately 0.5 percentage points. The net swing of one full percentage point,
all other things being equal, is enough to propel the economy from the subdued, lackluster growth seen in recent
years to something more in line with historical averages or closer to potential growth. This alone is not enough for
the economy to reach escape velocity, however it does help short-run growth prospects. Longer-term, the federal
government needs to ensure that deficit and debt projections are manageable given the economic outlook and
improving conditions. In recent years these projections have been brought down due to a stronger economy,
increased revenue projections and slower growth in healthcare costs.
The second main source of increased optimism is the continued strength in manufacturing, which not only results
in stronger domestic growth, but also improves the
trade balance. After declining sharply in mid-2012,
new orders for nondefense capital goods exlcuding
aircraft have rebounded strongly in 2013. The series
is currently at or near an all-time high. Other
manufacturing indices, such as the ISM Purchasing
Mangagers Index, also remain in expansion
territory, although the January 2014 figures are
down from recent months, primarly due to unusually
bad weather across the country. These indicators,
along with continued growth in employment and
wages, point toward the continuation of the
manufacturing cycle which is good news for overall
economic growth.
One manner in which the manufacturing cycle will
manifest itself into stronger growth is through business investment in new plants and equipment. Currently U.S.
corporate profits are at a record high both in terms of dollar value and as a share of the economy. Large profits and
liquid assets on corporate balance sheets indicate firms are not investing much and this potential source of stronger
economic growth is on the sidelines. One likely reason this has been the case is that these firms do not need to
invest in new plants and equipment if they are not already using their existing facilities (and employees) at full
capacity. As measured by the Federal Reserve, industrial production and capacity utilization are either back, or
nearly back, to pre-recession levels in aggregate. Does this mean the U.S. economy is running into some supply
constraints and should business investment pick up in the near future as demand increases?
Fortunately, the likely answers are yes, and yes. Industries currently operating at capacity utilization rates at or
above levels where they have historically began expanding and adding to capacity, are doing just that today. This
growth and investment are uneven across industries, just as the recession and recovery have been. However,
should the expansion continue – and all indications are that it will – a further increase in many of these
manufacturing industries is likely.
This is good news for the economy as production in many industries is reaching expansion levels. Over half of the
industries are currently adding to their supply capacity, and outside of a few industries including Oil & Gas and
Computer & Electronics2, this increase should continue as demand grows.
1 https://www.economy.com/mark-zandi/documents/2013-10-21-budget-battle-postmortem.pdf 2 Oil and gas firms have made big investments and capital expenditures in recent years. A slowdown may be in the works simply due to this unsustainably high levels of investment and the fact that production from these new investments has not kept pace. Computer & Electronics as an industry, and specifically here in Oregon, has likewise in recent years undertaken a massive expansion in both capacity and new technology, even as the PC market’s fortunes have waned. Until market conditions improve or the new technology starts to become obsolete, expectations are for lower levels of investment as these new technologies begin entering the market.
$30
$35
$40
$45
$50
$55
$60
$65
$70
$75
Jan-92 Jan-96 Jan-00 Jan-04 Jan-08 Jan-12
Bill
ion
s
Manufacturers' New OrdersNondefense Capital Goods ex Aircraft

8
To date, these increases in capacity appear to be mostly incremental, leaving more room for growth moving forward.
This is particularly true in the cases of the Chemicals, Fabricated Metals, Food, Plastics & Rubber and Primary
Metals industries3. Many of these can be considered “newly constrained” meaning they are either just around the
breakeven point in terms of new investment or have just reached this level of utilization within the past year or so.
Two industries that have increased
production (and employment)
considerably but have yet to add
much to capacity are fabricated and
primary metal producers. Should
demand for these industries’
products continue to grow, a supply
response is likely in the near future.
Similarly, many of these “newly
constrained” industries should be
the main beneficiaries of cheaper
energy costs driven by both
increased domestic production and
ebbing global prices.
Many of the industries in the lower
left hand quadrant – Apparel, Paper,
Printing, Textiles and maybe
Furniture – are in longer run
structural declines. Expecting a lot
of new investment in these
industries may be too optimistic.
However, the outlook for Other
Mining (mostly utilities) and Wood
Products have improved somewhat,
yet prospects remain weaker than in
other industries barring some major
market changes or new legislation.
The industrial production data point to tightening conditions across most industries, many of which are now being
supply constrained, or close to it. Further increases in demand are likely to result in increased investment and
additional capacity. The real question becomes whether or not this next round of investment will occur in the U.S.,
which would be great news for economic growth and would help return corporate profits to the domestic economy
in a productive manner. In recent years, the tendency has been for increased U.S. demand to be satisfied by
increased imports. Domestic industrial capacity did not expand much during the 2000’s, as many investments were
made overseas. Should this investment pattern continue, the larger manufacturing recovery will have a muted
impact on overall U.S. growth.
Thankfully, there are a number of reasons to suspect that this expansion will be different from the last. In particular,
the costs of doing business – namely exchange rates, labor costs and energy costs, are all working in the U.S.’
favor, at least more than they did a decade ago. As some other researchers have noted – Goldman Sachs among
them – these advantages may not result in the so-called manufacturing renaissance others have hoped for, or even
expected. This is true. Typically, manufacturers will first look for productivity enhancements before hiring or
expanding domestic facilities. However, in a relative sense, it is not unreasonable to expect industrial production
and capacity to increase in the coming decade at a better rate than the last decade. Growth may not reach the 5%+
rates of the 1990s, but the economy is already matching the 2.5% growth seen during the 2000s.
3 Possibly Electronic Products and Petroleum & Coal as well.
Oil & Gas
Other Mining
Food
Textiles
ApparelWood Products
Paper
Printing
Petrol/Coal
Chemical
Plastic/Rub
Nonmetallic Min
Primary Metal
Fab Metal
Machinery
Comp & Elec
Elec Equip
Motor Vehicle
Aerospace
Furniture
-15%
-10%
-5%
0%
5%
10%
15%
-10% -5% 0% 5% 10% 15% 20%20
13
q4
Uti
lizat
ion
Rat
e R
elat
ive
to H
isto
ric
Leve
ls w
hen
Cap
acit
y b
egin
s to
Ris
e
Capacity Change from 2011q4 to 2013q4
Constrained Industries Adding to Capacity

9
Given that the “newly constrained” industries are likely to undergo an expansion in the near future, and provided
that expansion happens in the U.S., industrial production and business investment should accelerate in 2014 and
2015. This acceleration in production activity could easily add an additional one half of one percent to GDP growth
as well. Seeing corporations and firms reinvest their profits instead of largely leaving them on the sideline will further
reinforce the economic expansion, helping provide growth above the lackluster rates seen so far in recovery.
Unfortunately, these events alone do not mean the economy has reached escape velocity. GDP growth in the 3
percent range is more in line with historical averages, but not yet in strong expansion territory. However, this
acceleration will result improved job and wage growth and will begin to help heal some of the remaining wounds of
the Great Recession.
Oregon Economy
In Oregon, the economy has already experienced an acceleration in job growth in 2013. This was largely expected
as the housing market and industry rebounded and the public sector cuts slowed across the state. As a result,
more regions of the state began adding jobs. The question then becomes: Can the state expect a further increase
in the rate of growth?
The likely answer is yes. Early in recovery, the Portland
metropolitan area was responsible for nearly all jobs
gained statewide. This changed in 2013. Portland
continued to add jobs at a steady and healthy rate,
however other areas including Bend and Medford began
adding jobs as well. In the past few months, Bend and
Medford have slowed as the nationwide housing
rebound stalled. These metros are among the most
heavily influenced by an influx of migrants and housing
activity, so as the broader housing rebound slowed, so
too did Bend and Medford. Statewide growth did not
decelerate along with these two areas however, since
private sector job gains in the Salem area accelerated
strongly to pick up the slack. All told, the 2013
acceleration in job growth was expected. However, not
all regions of the state are on board yet. In particular,
Eugene has further room for growth, as do many of the
state’s more rural areas. Looking forward to 2014 and
2015, as growth prospects improve for the underlying
economy, and with all of Oregon’s regions adding jobs,
growth is likely to pick up a bit further, into the 40,000
jobs per year range, or an annual growth rate of 2.4
percent in 2015.
To capture how each region within the state has fared
during the Great Recession and so far in recovery, the
graph on the right illustrates both the depth of job losses
and where each region is today relative to pre-recession
levels. The Columbia Gorge is currently at an all-time
high in terms of employment. The Portland area has
nearly regained all its recessionary job losses and will
likely surpass its previous peak within a few months. The
regions which have shown the most improvement are
Central Oregon and Southern Oregon, primarily due to
the aforementioned growth in Bend and Medford. All
0
5,000
10,000
15,000
20,000
25,000
30,000
35,000
40,000
Jan-11 Jan-12 Jan-13 Jan-14
Private Sector Job Growth in Oregon
Portland All Other Oregon
-20% -15% -10% -5% 0% 5%
Columbia Gorge
Portland MSA
Northeast Oregon
Oregon Statewide
North Coast
Willamette Valley
Southeast Oregon
Sourthern Oregon
Central Oregon
South Coast
Employment by Region
Recession Losses Dec '13 Relative to Peak

10
regions have improved at least somewhat from the depths of the recession, however the state’s more rural areas
have improved the least.
Many regional economies in rural Oregon are approaching a crossroads. Soon, policymakers and businesses will
need to decide whether to invest or divest in in many areas before the damage done to workforces and infrastructure
becomes irreversible.
In order to make a broad-based impact on rural economic performance, policymakers must focus on investments
that have the potential to improve the productive capacity of a wide range of households and local industries.
Typically, investments in infrastructure projects and in the education of the local workforce cast the widest net.
Infrastructure investments are of particular importance for many of Oregon’s isolated regions, where the ease of
access for people and goods is of paramount concern. As our rural infrastructure ages, capital improvements and
repairs have become a difficult sell in areas that have suffered losses of major employers and skilled workers. Public
infrastructure funds tend to flow to regions that are experiencing immediate capacity constraints.
Oregon’s Labor Force
One of Oregon’s economic strengths is the fact that in good times and in bad, people want to live in the state and
move here. In particular, the state is able to
attract working age, generally educated,
individuals and households which increases both
the size of the workforce and, in theory, the
quality of the workers as well. With an ample
supply of skilled labor, Oregon is also an
attractive location for firms.
The concern is that in recent years, Oregon’s
labor force as fallen4. Not just the labor force
participation rate5 – like elsewhere across the
country – but the actual number of Oregonians
with a job or looking for work. With fewer
individuals in the labor market, this potentially
reduces longer run growth, hurting the state’s
economy. Is this trend likely to persist or will it
improve?
The good news is it will likely improve and turn
around in 2014 and/or 2015. As job opportunities
continue to improve, more Oregonians will be
drawn into the labor market. The growth rate
differential between job growth and labor force
growth today is as bad as it has ever been, with
a gap of approximately four percentage points.
Job growth has historically led labor force growth
in Oregon, with a one or two year lead time. This
4 Much of this decline is confined to the past year, for which the data is yet to be officially revised by the Bureau of Labor Statistics. Revisions will be released in March, 2014. While the revisions may be an improvement over the currently published data, they are unlikely to reveal outright labor force growth. 5 The vast majority of which can be explained by demographics, as the Baby Boomers age into their retirement years, and young Oregonians attending school more. These trends explain approximately three-quarters, or more, of the labor force participation rate decline.
-8%
-6%
-4%
-2%
0%
2%
4%
6%
8%
10%
Jan-78 Jan-83 Jan-88 Jan-93 Jan-98 Jan-03 Jan-08 Jan-13
Oregon's Labor Market6 MMA, Year-over-Year Growth
Labor Force Total Nonfarm
-10%
-8%
-6%
-4%
-2%
0%
2%
4%
6%
Jan-78 Jan-83 Jan-88 Jan-93 Jan-98 Jan-03 Jan-08 Jan-13
Labor Force Growth on the Way?Oregon Job Growth Minus Labor Force Growth

11
general pattern6 was seen following both the severe early 1980s recession in the state and following the dotcom
recession in the early 2000s. Today, the state is one year into this improved job growth rate, and the unemployment
rate is only about a percentage point higher than normal. As such, expectations are for the labor force to stop
declining in the near future, as the economic expansion continues, and workers become harder to find leading to
wage gains. The labor force will begin growing again by the end of 2014 or early 2015, based on these historic
relationships.
Additional factors influencing the labor force are related to population growth, migration and demographics. Despite
staying in the workforce longer than past generations, many aging Baby Boomers are retiring, thus pulling down
the labor force. Millenials and young Oregonians, are aging into their prime working years, thus adding to the labor
force. A continued influx of migrants should likewise boost the state’s labor force moving forward. Net migration
plummeted by more than 30,000 migrants per year leading up to the Great Recession, to a pace of approximately
7,000 per year in 2010 and 2011. In 2013, net migration into Oregon picked up to more than 22,000 migrants. This
influx of households into the state is expected to strengthen as the economic recovery continues, further supporting
labor force growth in the coming years.
Oregon Housing Outlook
One major driver of the economy in recent years
has been the ongoing housing rebound. This has
been particularly important in Oregon’s
statewide job growth acceleration as the state’s
two hardest hit housing metros – Bend and
Medford – have begun growing strongly in the
past 18 months, and the bleeding has stopped in
many other housing-dependent areas.
Unfortunately, the run-up in mortgage rates and
strong home price appreciation in 2013
downshifted the housing recovery into neutral
late in the year. Housing affordability declined
sharply and would-be buyers faced sticker shock
at the financing costs. As such, housing permits,
starts and sales all stalled out in recent months.
In the big picture, this is likely not too much of a
concern for the national economy as this
slowdown will likely prove temporary and the
overall housing outlook is bright.
Although likely short-lived, this national
slowdown is being felt in the Top 50 hardest hit
housing metros in the country7. Through 2012
and the first half of 2013, these metros were
growing more quickly than the rest of the country
in terms of employment and their housing
markets where improving at an above-average
rate as well. As the broader housing market
stalled, growth rates fell dramatically in these
6 In consultation with the University of Oregon, an impulse response function of employment and labor force growth finds that an increase in job growth corresponds with a rise in the labor force. Correspondingly a rise in the labor force, does result in stronger employment, however the relationship is not as strong and has a longer lag time. 7 See this report for more on these Top 50 hardest hit housing metros in the country. http://oregoneconomicanalysis.com/2013/11/07/hardest-hit-housing-metros/
2%
3%
4%
5%
6%
-10%
-5%
0%
5%
10%
15%
20%
25%
30%
Jan-10 Jan-11 Jan-12 Jan-13
Interest Rates Slow Housing's Rebound
Mortgage Rate -->30 Yr Fixed
<-- Housing MetrosPermit GrowthDifferential
0
0.5
1
1.5
2
2.5
0
5,000
10,000
15,000
20,000
25,000
30,000
35,000
2005Q1 2008Q1 2011Q1 2014Q1
Housing Starts Forecast
Oregon (lhs) U.S. (millions, rhs)

12
areas. Likewise, employment stopped growing as well in many. Bend and Medford are no exception. Since late
summer, neither metropolitan area has added much, if any, employment.
Again, in the big picture this slowdown is likely to prove fleeting. The housing market will settle as buyers become
accustomed to higher interest rates – which should also slow price gains, holding affordability somewhat steady.
Increased demand growth will flow from both a stronger economy (more jobs and income) and a pick up in
household formation as demographics are favorable for the industry today, with the Millenials entering into their
root-setting years of 25-34 years old8.
The biggest takeaway here is that while the outlook for Oregon’s rural and regional economies have improved,
along with the housing recovery and public sector turnaround, there are still risks to the outlook.
Oregon Labor Market
The Office of Economic Analysis examines four main sources for jobs data: the monthly payroll employment survey,
the monthly household survey, monthly withholding tax receipts and the quarterly census of employment and
wages. Right now all four measures of the labor
market are showing steady improvements with
jobs being added, wages increasing and the
unemployment rate declining, albeit are slower
rates than customarily occurring at similar
points in previous business cycles. Currently,
wages in Oregon are increasing at
approximately 4 percent per year, while in the
previous expansion the gains were 6 percent
per year and in the 1990s the gains were 8
percent per year.
The most recent job growth rankings, published
by Arizona State University’s W.P. Carey
School of Business, places Oregon 3rd in the
nation for job growth in December. Over the
past year the state has added 38,800 jobs, or an increase of 2.35 percent. A year ago, Oregon ranked 31st fastest
with growth of 0.9 percent.
Relative to most other states, Oregon’s current employment growth rate is substantially below rates seen during
the peak of the housing boom. In fact, Oregon ranks among the bottom half of states when comparing current rates
with growth during 2005 and 2006. While the West overall is the fastest growing region, it still has not reached the
growth seen during the past expansion, unlike the Northeast and Midwest regions.
Overall, getting a handle of the health of Oregon’s labor market is being somewhat complicated by technical issues
within the underlying payroll jobs data. For this reason the employment data in our office’s forecast is adjusted for
two important technical purposes: seasonality at the detailed industry level and the upcoming benchmark revisions9.
8 See this report for more on demographics and housing demand. http://oregoneconomicanalysis.com/2013/07/15/housing-demand-demographics/ 9 Each year the U.S. Bureau of Labor Statistics revise the employment data – a process known as benchmarking. The current establishment survey (CES), also known as the monthly payroll survey, is benchmarked against the quarterly census of employment and wages (QCEW), a series that contains all employees covered by unemployment insurance. The monthly CES is based on a sample of firms, whereas the QCEW contains approximately 96 percent of all employees, or nearly a complete count of employment in Oregon. The greatest benefit of the CES is the timeliness – monthly employment estimates are available with only a one month lag – and these estimates are reasonably accurate. However the further removed from the latest benchmark, the larger the errors. The QCEW is less timely as the data is released publically approximately 3-4 months following the end of the quarter. The greatest benefit of the QCEW is that is a near 100 percent count of statewide employment. For these reasons, the CES is usually used to discuss recent monthly employment trends, however once a year the data is revised to match the historical QCEW employment trends. The last month of official
-8%
-6%
-4%
-2%
0%
2%
4%
6%
8%
10%
12%
1998Q1 2002Q1 2006Q1 2010Q1
Oregon Wage Growth4 Qtr Rolling Average, Y/Y
BEA Wages Withholding

13
In the fourth quarter, total nonfarm employment
increased 2.1 percent over the past year with
the private sector growing at 2.7 percent and the
public sector falling 0.5 percent. This marks the
smallest level of public sector cuts in nearly
three years, as state and local government
budgets continue to improve.
The graph on the left illustrates the number of
job gains by major industry by the length of the
bar. The percentage increase these changes
represent is noted as well. The bars are color
coded by growth rate relative to total
employment growth. Industries with blue
colored bars are growing at faster rates than
total employment, yellow bars represent
industries which are growing approximately in
line with average, while grey bar industries are
growing at rates significantly less than the
average.
As has been the case in the recovery to date,
the professional and business services and
leisure and hospitality industries have led
growth in terms of outright job gains and have
posted above average growth rates. These
industries have gained 7,800 and 6,300 jobs
respectively in the past year and account for 40
percent of all job gains across the state. The
good news is this represents the smallest share
these industries have contributed so far since
employment began growing, as other industries
continue to strengthen. Mining and logging,
construction, nondurable goods manufacturing,
retail and wholesale industries are all growing at
rates significantly faster than average.
In terms of illustrating how each industry has
fared over the Great Recession and so far in
recovery, the second graph on the left shows
both the depths of recessionary losses10 and
where each industry stands today relative to
pre-recession peak levels.
Currently, five major industries, which account
for 39 percent of statewide jobs, are at all-time highs. Private sector education, health, and food manufacturing
never really suffered recessionary losses – although growth did slow during the Great Recession. Professional and
benchmark data is September 2012. The QCEW is currently available through September 2013, thus the preliminary benchmark used here covers the October 2012 – September 2013 period. 10 Each industry’s pre-recession peak was allowed to vary as, for example, construction and housing-related industries began losing jobs earlier than other industries or the recession’s official start date per NBER.
4.3%
7.6%
3.6%
2.9%
3.3%
4.0%
3.7%
1.9%
2.0%
1.8%
1.5%
-0.6%
-1.0%
1.2%
-0.5%
(4,000) - 4,000 8,000 12,000
Natural ResourcesConstruction
Durable GoodsNondurable Goods
RetailWholesale
T/W/UInformation
FinancialProfessional & Business
Education ServicesHealth Services
Leisure & HospitalityOther Services
Public Sector
Oregon Employment Growth2012q4 to 2013q4
-50% -40% -30% -20% -10% 0% 10% 20%
EducationHealthFood
Prof, Biz ServLeisure & Hospitality
Total NonfarmPrivate
WholesaleRetail
Other ServicesPublic
Trans, Ware, UtilMetals & Machinery
InformationComp & Elec
Other NondurablesManufacturing
Financial ServicesMining & Logging
Other DurablesConstruction
Wood ProductsTransp Equip
Oregon Employment by Industry
Great Recession Losses 2013q4 Relative to Peak

14
business services and leisure and hospitality have each regained all their recessionary losses and are leading
growth today.
With the Great Recession being with it a financial crisis and housing bubble, it is no surprise to see wood products,
construction, mining and logging and financial services (losses are mostly real estate agents) among the hardest
hit industries. These housing and related sectors are just now beginning to recover, and have much ground to
makeup during the recovery. Transportation equipment manufacturing suffered the worst and is likely a structural
decline due to the RV industry’s collapse11. With that being said, the subsectors tied to aerospace are doing well
and the ship and boat building subsector is growing again. Metals and machinery manufacturing, along with mining
and logging, have shown the largest improvements since the depths of the recession.
All told, each of Oregon’s major industries has experienced some growth in recovery, albeit uneven. As the economy
continues to recover there will be net winners and net losers when it comes to jobs, income and sales as business
cycles have a way of restructuring the economy. With that being said, coming off such a deep recession, and with
a strong manufacturing cycle today, the goods-producing industries have and will exhibit stronger growth than in
past cycles.
For additional information on the most recent quarter’s employment forecast errors, please refer to Table A.1 in
Appendix A.
Leading Indicators
At the end of the year, both the
Oregon-specific leading indicator
series, plus the U.S. leading
indicators, were signaling continued
economic growth. Our office’s
Oregon Index of Leading Indicators
(OILI) and the University of Oregon’
Index of Economic Indicators have
exhibited the same general pattern of
fits and starts, as has the economy, in
recent years. As such, just three
months ago nearly all indicators were
signaling green, while in recent
months many of these have
downshifted to yellow. The rate of
improvement in indicators like
consumer sentiment, housing permits
and manufacturing hours worked
have all slowed. While these have not
fallen and are not signaling
recessionary warnings, their positive
momentum has stalled.
In terms of the manufacturing and
goods producing outlook, the various
indicators are a mixed bag. Measures
of current output, such as industrial
production and air freight tonnage,
are doing well or continuing to
advance, which also bodes well for
11 http://oregoneconomicanalysis.com/2012/07/10/rv-workers-and-reemployment/
0%
10%
20%
30%
40%
50%
60%
70%
80%
90%
100%
-15%
-10%
-5%
0%
5%
10%
Jan-97 Jan-01 Jan-05 Jan-09 Jan-13
Leading Indicators
Recession Probability (Right) OILI UO Index US Leading Index
Sustained Improvement OILI (OEA)
Continued, Choppy Growth Industrial Production
Slowing or Slight Decline Air Freight Tonnage
No Improvement Book-To-Bill Ratio
Help Wanted Ads
Univ Oregon Index Initial Unemployment Claims
Initial Unemployment Claims Withholding
Interest Rate Spread Consumer Sentiment
Capital Goods Orders Housing Permits
Consumer Sentiment Oregon Dollar Index
Employment Services Purchasing Mangers Index
Housing Permits New Incorporations
Manufacturing Hrs Worked
Weight Distance Tax
Individual Indicators

15
near term overall growth. More forward looking
manufacturing indicators are up (book-to-bill ratio)
and down (purchasing managers index). One other
item to keep an eye on, in particular in times like today
of global turmoil, particularly in emerging markets, is
the Oregon dollar index. Overall the Oregon dollar
continues to appreciate in the past year. This is
primarily due to both the U.S. being the brightest
economic spot in a dim-lit global field, but also as the
Fed continues to taper, capital is flowing out of
emerging markets, driving down their currencies. As
expected, as a currency appreciates, exports slow.
Both the U.S. and Oregon exports are growing less
briskly than in the recent past. While a stronger dollar may weigh on export growth, the overall manufacturing cycle
may or may not slow as a result. The external portion likely will. As detailed in the U.S. economic outlook (see pages
7 and 8) the domestic manufacturing industry has been a source of growth and will likely continue to be moving
forward.
At the national level, the Federal Reserve Bank of Philadelphia’s leading index incorporates many of the same
variables, in particular housing permits, new claims for unemployment insurance, the Institute of Supply
Management survey and the interest rate spread. These indicators similarly point toward continued expansion for
the U.S. Furthermore the most recent probability of recession12, calculated in real time by University of Oregon
professor Jeremy Piger, is just 0.1 percent in November for the U.S. and 0.0 percent for Oregon.
Short-term Economic Outlook
After private sector growth accelerated in early 2013, total employment in Oregon is expected to grow just a bit
more rapidly in 2014 and 2015. After which longer-run demographic trends will weigh on growth. These additional
job gains in the short term are nearly evenly split between the private and public sectors. At an annual rate, this
represents approximately 3,000 additional jobs in both the private and public sectors over the next 18 months above
the current levels of gains.
Private sector growth, measured by the number of jobs created, will be dominated by the large, service sector
industries like professional and business services, leisure and hospitality and health. Nevertheless, goods-
producing industries, while smaller, are expected to grow at above average rates. Job growth in mining and logging,
construction and manufacturing – led by durable goods – will outpace the average industry in both 2014 and 2015
as the recovery continues to strengthen.
The public sector will soon begin adding jobs in Oregon, as state and local revenues continue to grow along with
an improving economy. Public sector job cuts have slowed considerably relative to recent years and, in fact,
preliminary estimates for the most recent few months indicate even a few job gains. Over the forecast horizon,
government employment growth is expected to stay in line with population growth and increased demand for public
services.
Along with an improving labor market, stronger personal income gains will come. 2013 personal income is estimated
to have increased by just 3.1 percent. This largely reflects the pulling forward of investment-type income into 2012
in anticipation of increased federal tax rates in 2013. Personal income is expected to increase by 4.5 percent in
2014, 5.3 percent in 2015 and 5.7 percent in 2016.
As the economy continues to improve it will help drive up demand for new houses as household formation increases.
Household formation has remained suppressed as individuals and families turned to rental markets and doubled
up during the recession. As these individuals find work in an improving economy, their desire to live on their own or
away from their parents will lead to increased housing demand.
12 http://pages.uoregon.edu/jpiger/us_recession_probs.htm/
80
100
120
140
160
180
Jan-95 Jan-98 Jan-01 Jan-04 Jan-07 Jan-10 Jan-13
Oregon Dollar IndexMarch 1995=100

16
Housing starts today in Oregon total just more than 14,000 at an annualized rate, which represents growth of over
80 percent from the recessionary lows of 2009 and 2010. A level of about 21,000 is the long-run average for the
state prior to the housing bubble, and the forecast calls for strong growth in the coming few years with starts reaching
15,900 in 2014 and 19,600 in 2015. Over the extended horizon, starts are expected to average a little more than
23,000 per year to meet demand for a larger population and also, partially, to catch-up for the underbuilding that
has occurred in recent years. As of today, new home construction is cumulatively about one year behind the stable
growth levels of prior decades even after accounting for the overbuilding during the boom.
Forecast Changes Relative to the Previous Outlook
Overall, the character of the outlook is similar to recent forecasts, but somewhat stronger in 2014 and 2015 due to
an improved outlook for job growth. Even as recent forecasts have tracked well, this increased growth results from
continuing signs of optimism in the economy – primarily related to the manufacturing cycle and the federal
government in recent months – that the recovery will gather a bit more steam moving forward. The recent turmoil
in emerging markets, and the two most recent national employment reports are likely temporary swoons that do not
mark a fundamental change downward in the recovery.
Many of the other changes to the outlook follow from the improved employment forecast. The unemployment rate
is expected to decrease at a faster rate than the previous outlook. Personal income is likewise revised upward. This
revision is concentrated in wages and salaries, given the stronger jobs forecast. The inflation forecast is lowered
relative to three months ago, thus raising real personal income more than nominal personal income.
Due to the housing stall to end the year, the housing starts forecast is lowered a few percent each year. The longer
run outlook and trajectory for housing starts remains intact, however the growth path has been altered slightly due
to recent events.
A more complete summary of the Oregon economic outlook and forecast changes relative to the previous outlook
– our office’s previous Table O.3 and O.4 – are available as Table A.2 and A.3 in Appendix A.
Forecast Comparison
Besides the Oregon Office of Economic Analysis, there are a number of other economic forecasters who produce
an Oregon outlook. A comparison of these forecasts is provided below for employment growth and personal income
Economic Forecast Summary
2013:3 2013:4 2014:1 2014:2 2014:3 2012 2013 2014 2015 2016
Personal Income, Nominal U.S. 4.0 2.5 5.9 4.9 5.1 4.2 2.9 4.6 5.0 5.3
% change Oregon 4.4 1.7 4.8 5.1 5.5 4.6 3.1 4.5 5.3 5.7
Wages and Salaries, Nominal U.S. 2.6 3.9 5.0 4.9 5.3 4.3 3.1 4.5 5.3 5.3
% change Oregon 3.4 1.1 2.0 4.5 5.0 4.2 3.6 3.5 5.3 5.3
Population U.S. 0.8 0.8 0.8 0.8 0.8 0.7 0.8 0.8 0.8 0.8
% change Oregon 1.3 1.0 0.9 1.1 1.3 0.7 0.9 1.1 1.1 1.2
Housing Starts U.S. 0.87 0.88 1.02 1.06 1.12 0.78 0.93 1.16 1.47 1.62
U.S. millions, Oregon thousands Oregon 14.6 14.2 14.3 14.6 15.6 10.9 14.4 15.9 19.6 23.1
Unemployment Rate U.S. 7.6 7.3 7.1 6.8 6.6 8.1 7.4 6.5 5.9 5.4
Oregon 7.8 8.0 7.3 6.9 6.8 8.7 7.9 6.8 6.6 6.6
Total Nonfarm Employment U.S. 1.4 1.8 1.6 1.6 2.1 1.7 1.6 1.7 2.0 2.0
% change Oregon 1.7 1.7 2.3 2.4 2.5 1.2 2.1 2.2 2.4 2.2
Private Sector Employment U.S. 1.7 2.1 1.8 1.9 2.5 2.2 2.0 2.0 2.3 2.3
% change Oregon 1.9 1.9 2.6 2.8 2.8 1.8 2.7 2.5 2.7 2.4
Quarterly Annual

17
growth. Arizona State University compiles these outlooks as part of the Western Blue Chip13, with the exception
being HIS Economics (formerly IHS Global Insight).
Overall, each forecast expects the economic expansion to continue with improved growth in 2014 relative to recent
years. The range of estimates for job growth this year start in the low two percent range, which marks a little
stronger growth than 2012 and 2013, moving up to around three percent. The effective differences in these outlooks
are large. Growth of approximately 2 percent is just strong enough to lower the unemployment rate but makes no
meaningful impact on the feel-good nature of the expansion, whereas if growth does reach 3 percent, it would
represent a typical expansion year in Oregon, or a return to the relatively good old days. Even so, personal income
growth is expected to remain relatively modest, topping out in the low 5 percent range. Previous expansions in
Oregon saw growth routinely in the 6 to 8 percent range. Two contributing factors here is lower rates of inflation
(the forecasts are nominal, not real) than in previous decades and lower wage gains for nearly all workers in the
slack labor market.
Forecast Risks
The economic and revenue outlook is never certain. Our office will continue to monitor and recognize the potential
impacts of risk factors on the Oregon economy. Although far from comprehensive, we have identified several major
risks now facing the Oregon economy in the list below:
Federal fiscal policy. While the recent federal budget deal reduces the cuts relative to the status quo level of
spending reductions set by the sequester, federal fiscal policy remains a risk. The good news for Oregon is
that outside of outright land ownership, the federal government has a relatively small physical presence in the
state. This means that direct spending reductions are less likely to hurt Oregon. Of course, it also limits the
local benefit from any potential increases in federal spending. In terms of federal grants as a share of state
revenue, Oregon ranks 29th highest. For federal procurement as a share of the economy, Oregon ranks 48th
highest. Oregon ranks below average in terms of military-dependent industries as well. The one area that
Oregon ranks above average is in terms of direct federal employment, ranking 19th highest among all states.
Oregon also is exposed to an above-average share of federal transfer payments to households. Overall, the
direct impact may be less than in other states but the impact will be felt nevertheless, particularly as our closest
neighbors have large federal and military workforces.
Strength and durability of housing market recovery. The housing market that was growing briskly in terms
of home sales and new construction in 2012 and much of 2013, has recently stalled out. How long this lasts
has direct implications for regional economies within in the state – namely the medium sized metros and
more rural areas. Once the market adjusts to the new realities of higher interest rates and higher prices,
some of the same underlying dynamics of growth will reappear. Chief among them is low inventory, which
is not keeping up with demand. As such home prices are rising. The higher interest rates and slowdown in
sales will likely keep prices to more moderate increases in 2014, however demand is still outstripping
13 http://wpcarey.asu.edu/bluechip/western/oregon.cfm
Forecaster 2014 2015 2016 2014 2015 2016
IHS Global Insight 2.2 2.4 2.4 4.9 5.0 5.3
Conerly Consulting 3.1 5.2
Forefront Economics 2.7 4.5
Portland General Electric 3.0 5.5
Wells Fargo & Co. 2.3 2.4 4.8 5.2
Oregon Office of Economic Analysis 2.2 2.4 2.2 4.5 5.4 5.7
Western Blue Chip Consensus 2.6 2.3 5.0 5.3
Employment Personal Income
Comparing Oregon Forecasts, February 2014

18
supply. There remains much more room for improvement before the market (sales of both existing homes
and new construction activity) reflects anything approaching normal levels. While foreclosures and long-
term delinquency rates remain relatively high, when compared with pre-recession levels, the market has
passed the peak of foreclosures and is working through the backlog of distressed properties. Oregon, with
the rest of the nation, will see sizable improvements of construction activity in 2014, 2015 and 2016.
Ongoing European debt problems and potential financial market contagion or instability. The European high
debt, low growth, austerity cycle has continued, more or less, for the past three or four years. So long as
Europe is able to continue to muddle through the process, the situation acts as a drag on domestic and global
economic growth, however no more so than it already is. With that being said, the potential for another
financial crisis unfortunately still looms large as a catastrophic scenario. Domestic credit markets are easing,
but consumers and businesses still have difficulty getting loans. To the extent that credit markets take longer
to come back to some sort of state of normalcy, the current recovery could be slower than projected or thrown
off track. In such a scenario, Oregon will suffer the consequences along with the rest of the nation.
Commodity price inflation. Prices for many major commodities are trending down, but remain atypically high
from a historical perspective. Future commodity prices will be tied to growth. Should the global expansion pick
up speed, a return to high rates of commodity inflation is possible. Always worrisome is the possibility of higher
oil (and gasoline) prices. While consumer spending has held up pretty consistently in this recovery, anytime
there is a surge in gas prices, it eats away at consumers’ disposable income, leaving less income to spend
on all other, non-energy related goods and services.
Federal timber payments. With the temporary reinstatement over, the loss of these federal funds is impacting
Oregon counties, particularly in the southern region of the state. It is clear that federal policymakers will not
reinstate the program the same as before, however negotiations are ongoing for more sustainable timber
harvests and related revenue. In the meantime, reductions in public employment and services are being felt
in the impacted counties. For more information from a historical perspective, see two recent blog posts, here
and here14.
Global Spillovers Both Up and Down. The international list of risks seems to change by the day: sovereign
debt problems in Europe, equity and property bubbles in places like South America and Asia, political unrest
in the Middle East, and commodity price spikes and inflationary pressures in emerging markets. In particular,
with China now a top destination for Oregon exports, the state of the Chinese economy has spillover effects
to the Oregon economy. The recent economic slowdown across much of Asia is a growing threat to the Pacific
Northwest’s growth prospects.
Undoing the Federal Policy Used to Combat the Financial Crisis and Recession. Bailouts, tax cuts, monetary
quantitative easing, and other fiscal packages most likely prevented a more serious economic downturn. But
the clean-up after the storm can have its own risks to the economy. Exit strategies will have to be carefully
implemented to prevent premature tightening and choking off the recovery or acting too late to avoid an
inflationary environment. All states, including Oregon, face the same risks.
Initiatives, referendums, and referrals. Generally, the ballot box and legislative changes bring a number of
unknowns that could have sweeping impacts on the Oregon economy and revenue picture.
Alternative Scenarios
The baseline forecast is our projection of the most likely outcome for the Oregon economy. As with any forecast,
however, many other scenarios are possible. In conjunction with the Legislative Revenue Office, this forecast
provides three alternative scenarios, which are modeled on growth patterns over previous business cycles.
14 http://oregoneconomicanalysis.wordpress.com/2012/01/23/historical-look-at-oregons-wood-product-industry http://oregoneconomicanalysis.wordpress.com/2013/05/28/timber-counties/

19
Optimistic Scenario: The recovery gathers steam and pulls the economy further away from the aftermath of the
Great Recession and into a stronger cyclical expansion. The lackluster economic growth seen in recent years
recedes into the rearview mirror of history and the U.S. economy builds momentum through the first of half of 2014.
With the housing recovery reignited and, the federal budget deal mostly removing the fiscal drag, the economy is
soon firing on all cylinders. Economic growth is above potential in 2014 and 2015, resulting in stronger job and
income gains. This stronger growth leads to more consumer spending and more business investment.
In Oregon, job gains are broad based with strong growth in all private sector industries. The unemployment rate
declines faster than under the baseline scenario as individuals are able to find employment more readily and income
growth accelerates. The increase in employment and income support a self-sustaining economic expansion in
which new income fuels increased consumer spending (and debt reduction) which begets further increases in
employment. Such an expansion increases housing demand as newly employed households (and increasing
income for existing households) find their own homes after doubling-up with family and friends during the recession.
This results in working down the existing inventory overhang more quickly and new construction returns to normal
levels by late 2014 or early 2015.
Mild Recession Scenario: The slow employment and GDP growth in recent years continues in 2014. The housing
stall persists, removing one major driver of growth. The emerging market turmoil proves more worrisome than first
thought as the Fed’s tapering wreaks havoc on international markets, due to capital flight. The U.S. dollar
strengthens, helping to choke off the manufacturing cycle by the end of the year. These factors are enough weight
on the lackluster recovery that by late 2014 or early 2015 the economy slides slowly back into recession. Job losses
ensue in 2015 and 2016, and while not severe – about 15,000 jobs in Oregon – it takes a toll on business income,
housing starts and personal income. The unemployment rate returns to nearly 9 percent. The net effect of the mild
recession is an extended period of prolonged economic weakness, not unlike Japan’s so-called Lost Decade(s).
Although inflation is expected to remain positive, avoiding the deflationary cycle Japan experienced.
Severe Recession Scenario: The recent slow economic growth, coupled with a stalled housing recovery and severe
turmoil in domestic and international markets, sends the economy into free-fall. While the catalyst may be different,
the economic effect is similar to late 2008 and early 2009, although not quite as severe when the dust settles. This
is little comfort when the unemployment spikes back to nearly 11 percent and more than 100,000 Oregonians lose
their jobs in 2014-15. Besides the domestic economic headwinds, the likely culprit in this scenario is a meltdown of
the financial markets sparked by the European sovereign debt crisis. Economic growth in the U.S., while fairly
steady, is not nearly strong enough to withstand an external financial shock of this magnitude. Further economic
effects of a recession this size are personal income losses of around 4.8 percent, about three-quarters the size of
the Great Recession losses in Oregon. Housing starts plummet to near historical low levels of construction and
home prices decline further. On the bright side, when construction does rebound, it will result in a surge of new
home building that will rise above the state’s long term average level of building due to pent-up demand for housing
and the fact that the state will have under built housing during this time period.
2014 2015 2016 2017
Employment
Baseline 2.2% 2.4% 2.2% 2.0%
Optimistic 3.5% 4.3% 2.1% 1.9%
Mild Recession 2.0% -0.1% -0.2% 2.2%
Severe Recession 1.1% -5.2% 0.7% 3.2%
Personal Income
Baseline 4.5% 5.3% 5.7% 5.8%
Optimistic 7.9% 7.3% 5.8% 5.6%
Mild Recession 4.4% 2.7% 3.8% 7.1%
Severe Recession 3.9% -3.5% 4.7% 8.1%
March 2014Alternative Scenarios
1,500,000
1,600,000
1,700,000
1,800,000
1,900,000
2000 2003 2006 2009 2012 2015
Total Nonfarm Employment
Baseline Optimistic Mild Recession Severe Recession

20
Extended Outlook
IHS Economics projects Oregon’s economy to fare well relative to the rest of the country in the coming years. The
state’s Real Gross State Product is projected to be the strongest among all states across the country in terms of
growth with gains averaging 4.1 percent through 2018. Total employment is expected to be the ninth strongest
among all states while manufacturing employment will lead the nation. Total personal income growth is expected
to be sixteenth fastest among all states.
OEA is somewhat less bullish, but expects Oregon to maintain a growth advantage relative to other states. However,
this advantage will be somewhat smaller than the state has enjoyed in past decades.
Oregon has typically benefitted from an influx of households from other states, including an ample supply of skilled
workers. Households continue to move to Oregon even when local jobs are scarce, as long as the unemployment
rate is equally bad elsewhere (particularly in California). Relative prices of housing also contribute to migration flows
in and out of the state. For Oregon’s recent history – data available from 1976 – the labor force in the state has both
grown faster than the nation overall and the labor force participation rate has been higher. However three recent
trends show potentially worrisome signs. First, the labor force participation rate has declined significantly during
and after the Great Recession at both the national and state level. Second, since 2005, Oregon’s labor force
participation rate no longer exceeds the national rate as it had for the prior 30 years. Third, during the Great
Recession and through the early stages of recovery, the number of individuals in Oregon’s labor force held relatively
steady, however in the past year that number is actually declining. All three of these labor force signals are
potentially worrisome when it comes to Oregon’s dynamic labor supply. However, how much is attributable to the
severe nature of the business cycle, from which one could reasonably expect a rebound, and how much is a
fundamental shift in Oregon’s economy is unknown at this time.
In addition to its dynamic labor supply, Oregon also enjoys the long-term advantages of low electricity costs; a
central location between the large markets of California, Vancouver and Asia; clean water; low business rents and
living costs; and an increasingly diverse industrial base.
One primary long-run concern for policymakers, think tanks and Oregon’s economy is that very little progress on
raising per capita income is projected out to 2020. In and of itself, a higher per capita income level would better
fund public services for citizens. The Oregon Employment Department has published a detailed look at Oregon’s
per capita personal income entitled Why Oregon Trails the Nation.15
Oregon Exports
While the relative growth rates across the major global
economies are somewhat of a mixed bag, according to
the latest IHS Economics outlook, all are expected to
improve in 2014 relative to recent rates of growth. 2015
and beyond should be even better as the global
economic expansion continues and gathers a little bit of
steam.
Given this outlook, the inflation-adjusted, trade-weighted
value of the dollar is expected to fall slightly over the
coming years against the U.S.’ major trading partners, as
these economies are expected to grow approximately 2
percent annually. This group of countries includes
Canada, the Eurozone, Japan, and the United Kingdom,
among others. However, the value of the dollar will fall more than 2 percent per year against the U.S.’ other important
trading partners as these economies are forecasted to grow 4.5 percent per year. Many of Oregon’s top trading
15http://olmis.emp.state.or.us/olmisj/PubReader?itemid=00007366
2013 2014 2015-18
United States 1.9 2.7 3.2
Canada 1.7 2.4 2.6
Japan 1.7 1.8 1.4
Eurozone -0.4 0.8 1.5
Mexico 1.3 3.3 3.9
South America 3.0 3.4 4.0
Asia ex Japan 5.8 6.3 6.4
China 7.7 8.1 7.4
World 2.5 3.3 3.8
Source: IHS Economics, January 2014
Projected Growth Rates of Real GDP

21
patterns are among this group, including China,
Taiwan, Korea, Singapore, Malaysia, and the
Philippines in addition to Mexico, Brazil, Russia
and others.
One key item to watch moving forward is the
current turmoil in many emerging markets. At first,
following the Federal Reserve’s tapering
announcement in mid-December, there was not
much movement in global markets. However in
recent weeks this has changed. Capital flows have
reversed in many emerging markets, driving down
currencies and equities and increasing borrowing
costs, thus setting the stage for a classic emerging
market currency crisis. As a result, some Central
Banks have raised interest rates to try and stem the
tide of outflowing money, which can exacerbate this process. These events are not likely due to just Federal Reserve
policy, as global growth and uncertainty and also domestic events and policies in certain countries are likely
contributors as well. How and when these issues are resolved are important in many respects. Will this drive the
value of the dollar higher, choking off the manufacturing cycle or the global recovery? Such an extreme outcome is
unlikely at this point, but even as the Asian Financial Crisis did not derail the U.S. in the late 1990s, it did knock
Oregon’s growth rate down to near zero given our reliance on trade with those particular countries.
Locally, Oregon exports largely follow the global economy, particularly our trading partners along the Pacific Rim.
As such, exports are holding steady with no real gains over the past year, but at a level near historic highs, in dollar
value. This applies to both Computer and Electronic Products – the state’s largest export industry, accounting for
36 percent in 2013 – and all other industries.
In terms of country-specific exports, gains to Canada and China – our two largest trading partners – continue,
however exports to most other countries languish. In fact, in 2013 exports to Canada and China increased 15
percent while exports to all other countries fell 5 percent. The gains to China have been broad based across a
number of industries with not only Computer and
Electronic Products increasing but also
Agriculture, Chemicals, Machinery, Forestry and
Wood Products.
Gains to Canada, on the other hand, are heavily
concentrated in Machinery – agriculture and
construction machines – Metals and Computer
and Electronic Products.
Southern Oregon Economic Outlook16
Nationally, it is called the Great Recession,
however in Southern Oregon the employment
losses were nearly double in size. While regional
job losses stopped by late 2009, growth did not
return until 2012, marking nearly 3 years of no net
job growth. The good news is growth has returned to the region – in particular Medford and Jackson County – and
job gains are brisk, helping to make up ground lost during the recession.
16For presentation slides from the Southern Oregon Business Summit on the outlook see: http://oregoneconomicanalysis.com/2014/01/30/southern-oregon-presentation/
$0.0
$1.0
$2.0
$3.0
$4.0
$5.0
Q1 1997 Q1 2001 Q1 2005 Q1 2009 Q1 2013
Bill
ion
s
Oregon Exports by Country4 Quarter Sum
China Canada Japan Korea, Republic Of Malaysia
$0.0
$0.5
$1.0
$1.5
$2.0
$2.5
$3.0
Q1 1997 Q1 2001 Q1 2005 Q1 2009 Q1 2013
Bill
ion
s
Oregon Exports
Computer and Electronics Agriculture All Other
22
The primary drivers of recent employment trends have been housing and government. These industries play a
disproportionately large role in medium sized cities and more rural areas. This is not because these regional
economies have so many of these types of jobs, but rather they have less diversity than large metros. Besides
these core industries, large metros also have other sectors like ballet and advertising firms that help diversify the
local economy.
Unfortunately for many of the state’s regional economies, housing and government have been under historic
economic pressure in recent years, holding back recovery in much of the state. Southern Oregon – Medford in
particular – experienced one of the nation’s largest housing booms and busts, and recovery was not felt locally until
2012 when the housing market began to rebound. Public sector budgets were devastated by the Great Recession
(as tax revenues rely on taxpayer’s income and property values) and have just now improved to the point where
further government cuts are less likely as the costs of services has outpaced revenue in recent years.
As these two industries continue to improve, so too do the other private sector industries. The return of migration –
mostly from Califronia – will help fuel stronger population growth, which increases demand for local goods and
services. While the overall housing rebound has brought good news to the region – in the form of strong job and
income gains – the nationwide housing stall to end 2013 brought an unfortunate end to local job gains in recent
months. The nation’s housing market hiccuped but the regional economy felt an earthquake. Luckily this slowdown
in housing is expected to be temporary and the overall housing outlook is bright, with 2-3 years of strong growth
ahead. As housing recovers, and as the local public sector continues to stabilize, job growth will return.
The overall economic outlook for Southern Oregon is bright. The region has a number of comparative advantages
that bode well for growth moving forward. In particular the region has a number of large employers that help provide
an economic base, in addition to the ancillary business support operations that coincide with firm headquarters.
Traded sector employment is strong. Manufacturing firms have nearly regained all their recessionary losses and
the region has seen strong growth in transportation and warehousing jobs. The region itself is in a strategic location,
right on Interstate 5, with easy access to the large California market and its millions of consumers and firms.
Furthermore the region is a migratant magnet, with nearly 60 percent of residents17 being born outside of Oregon,
compared with just 33 percent nationwide. Households are attracted to the area for the great quality of life, which
includes both the physical geography but also the cultural aspects to the community, with its ties to Southern Oregon
University. All of these are great advantages that boost economic growth both today and in the future. As such, the
region is like an economic oasis in the large swaths of land between Eugene and Sacramento. Up and down
Interstate 5 is is tough to find a regional economy that has outperformed Southern Oregon over the past decade,
even with the Great Recession.
Even so, there remain challenges moving forward. In particular the two main risks to the outlook are the regional
ties to natural resource industries and demographic trends. While the majority of timber and forest related jobs are
a bit further north, in Douglas and Lane counties, Southern Oregon does have an above average share of local
employment in these sectors. Given current timber harvest levels and the continuing closure of regional mills, the
industry is expected to continue to face downward pressure moving forward, barring some major change(s). The
second, and arguably more important, risk to the outlook are local demographic trends. Overall the population is
aging, which will result in slower ecoomic growth, however these trends are more pronounced in Southern Oregon
than the statewide figures indcate. The Baby Boomer cohort, plus older retirees, is even larger, in a relative sense,
in Southern Oregon. Replacing these soon-to-be retired individuals in the workforce will be paramount. The good
news is that the andedote to slower growth is young, migrant households, and the region has a proven track record
in being able to attract migrants. The region will need to continue to do so in the coming decade to stave off slower
economic growth.
17 U.S. born residents. This figure excludes foreign born and naturalized citizens.

23
South Coast
Coos, Curry
Much like the rest of the state, the South Coast has
experienced two severe recessions – the early
1980s and the Great Recession – and two mild ones
– 1990 and 2001 – over the past 40 years. The key
difference is the extent, severity and duration of the
early 1980s recession in Coos County. That
recession, tied to the restructuring of the timber
industry at the same time the Federal Reserve raised
interest rates into double digits to choke off inflation,
was the single worst regional recession on record in
Oregon’s history. On net the South Coast did not fully
regain the total number of lost jobs from the early
1980s recession until 1996, some 17 years after
employment peaked in 1979.
Even with the major shakeup in the region in the early
1980s, the local economy continues to restructure to
this day. Reliance on natural resource industries
(both timber and fishing) continues to decline, as the
importance of retirement income and tourism grows,
adding jobs in retail, health care and leisure and
hospitality in particular.
Like the rest of the state, the vast majority of the
region’s migrants come from California. In terms of
relative size, Californians overwhelmingly choose to
live in Southern Oregon and on the South Coast.
Approximately half of these California migrants to
Coos and Curry Counties come from the greater Los
Angeles area or San Diego. The other half come from
Northern California (excluding the Bay Area) or the
Central Valley. Hardly any come from the Bay Area
itself. In terms of migration off the South Coast, the
region losses population to the rest of Oregon –
mainly to the Willamette Valley, but not to the Salem
metro in recent years – and a little bit to Washington
state – almost all to Clark County, with small gains
from elsewhere in the state.
0%
2%
4%
6%
8%
10%
12%
14%
16%
Jan-90 Jan-94 Jan-98 Jan-02 Jan-06 Jan-10
Unemployment Rate (SA)U.S. Oregon South Coast
-20%
-15%
-10%
-5%
0%
Peak 1 2 3 4 5 6 7 8 9 10
% J
ob
Lo
ss f
rom
Pe
ak E
mp
loym
en
t
No. Years from Employment Peak
South Coast Recession Comparison
Early 80s 1990 2001 Current
Top 10 Industries by Location Quotient, 2012
1) Fishing, Hunting, Trapping, NAICS 114
2) Forestry & Logging, NAICS 113
3) Mining, NAICS 212
4) Wood Product Mfg, NAICS 321
5) Accommodation, NAICS 721
6) State & Local Government
7) Animal Production, NAICS 112
8) Gasoline Stations, NAICS 447
9) Food & Beverage Stores, NAICS 445
10) Transit & Ground Transp., NAICS 485
7.6%
16.4%
9.6%
24.8%
0%
5%
10%
15%
20%
25%
Housing Government
Housing and Government EmploymentShare of Total Employment, 2012
Metro Oregon Nonmetro South Coast
44%
39%
27%
2%
8%
12%
5%
22%
17%
25%
0% 20% 40% 60% 80% 100%
Oregon
South Coast
California Migrants
Los Angeles Bay Area San Diego Sacramento Other

24
State Comparisons
A lot of recent economic research and thought so far during this recovery has focused on the general lack of
improvement in measures like the labor force participation rate and also the employment-to-population ratio. Even
as the economy is growing and improving, not everything is well. Some, but certainly not all, of this lack of
improvement is due to the aging demographics and so attention is now being paid to the so-called prime working
age population -- generally defined as those aged 25-54 -- to strip out the aging impact.
The map on the left
shows the employment-
population ratio change
for working age adults.
Over this period at the
national level the ratio
declined 3.1 percentage
points, according to the
American Community
Survey figures and the
color coordination of the
map is relative to the
U.S. trends. Yellow
indicates the local
decline was about the
same as the national
average, while orange
and red counties saw
larger declines and
green counties saw smaller declines or outright gains. Data is unavailable for counties with populations less than
20,000, however the counties for which data is available account for about 96% of the population
There is a clear geographic pattern here, with the hardest hit housing regions faring the worst, the Northeast and
Midwest generally performing OK (relative to national trends) while some of the energy producing regions have
fared better. These results are similar to the housing rebound at the county level, which is not too much of a surprise.
The scatter plot below shows a county-level look at these changes in the employment-to-population ratio and the
labor force participation rate for the working age population. By and large, the strong relationship is to be expected
and the causation more likely runs from job losses to lower participation rates.
Labor force growth and the ability to attract young, educated migrants has long been a benefit to Oregon's economy,
along with the Sun Belt and other Western states. To the extent that an aging population is the disease of slower
growth, young working age households are the cure. Beyond simply having more working age adults, a more highly
educated population is also correlated with a higher labor force participation rate and labor force growth overall.
Having a strong local economy is clearly attractive
to migrants. Academic studies have found that over
an extended period, a more diverse economy is
related to stronger employment growth.
It will be important to monitor and examine where
the employment-population ratio is improving the
most in recovery. Which regions are able to attract
the young migrants and/or see stronger job gains?
How these patterns play out will largely explain the
strength of the regional economies moving forward.

25
REVENUE FORECAST
Revenue Forecast Summary
Despite the improved economic outlook, expectations for General Fund revenue growth have remained largely
unchanged since the December 2013 quarterly forecast. The additional job growth reflected in the March 2014
forecast will bring with it substantial state tax collections. However, these additional revenues are expected to be
largely offset by the impact of recent tax collections, which have been coming in well below expectations.
During the second half of 2013 and early 2014, tax collections across a wide range of revenue instruments have
performed poorly. Notably, estimated personal income tax payments made during December and January (the
largest payment of the tax year) fell in most states despite strong underlying income gains on the year. Further,
corporate tax collections are falling sharply, with Oregon having paid out more in refunds that it took in by way of
corporate tax payments during two of the past three months.
Among other revenue instruments, estate taxes and video lottery sales have been weaker recently than they were
during the worst of the recession. Also, cigarette taxes and state court fees have fallen sharply.
Although economic conditions have improved, near-term revenue growth is expected to remain somewhat modest.
Underlying job gains, while accelerating, will not match the pace seen during previous periods of economic
expansion. Also, personal income taxes based on investment income are expected to post only modest gains during
the upcoming April tax filing season.
Despite rising stock market and housing prices, the outlook for taxable investment income remains subdued in the
near term. Many Oregonians cashed out capital gains in 2012 in anticipation of federal tax rate increases, leaving
fewer gains to be realized for tax purposes going forward. However, if equity markets are able to hold on to much
of their recent appreciation, personal income tax payments will grow rapidly once again in April 2015.
Although the revenue outlook remains on track, the 2013-15 biennium is still young, and therefore significant
uncertainty remains. Two income tax filing seasons remain between now and the end of the biennium. As such,
many risks to the outlook remain. On the upside, if asset markets continue to boom or if Oregon’s traditionally strong
migration trends and labor force growth reappear, a short-term spike in revenues remains possible during the 2013-
15 budget period. At this point, it would take only about $100 million in unanticipated revenue to trigger the kicker
law.
The primary downside risk facing the near-term revenue forecast is the uncertain future of the nationwide economic
expansion. Should federal policy woes or economic weakness among our trading partners derail the U.S. economy,
the expected growth in Oregon’s tax collections will not come to pass. Future asset prices are also at risk as the
Federal Reserve unwinds its accommodative monetary policies.
Revenue growth in Oregon and other states will face considerable downward pressure over the 10-year extended
forecast horizon. As the baby boom population cohort works less and spends less, traditional state tax instruments
such as personal income taxes and general sales taxes will become less effective, and revenue growth will fail to
match the pace seen in the past.
2013-15 General Fund Revenues
Despite unexpectedly weak estimated tax payments this winter, personal income tax collections have closely
matched expectations thus far during the 2013-15 biennium. Excluding the impact of tax law changes, the outlook
for personal income tax collections is less than one percent higher than the Close of Session estimate. These
additional expected personal income tax revenues have been fully offset by a weaker outlook for other revenue
instruments. Aside from tax law changes, the outlook for net General Fund and Lottery resources is currently less
than $20 million above the Close of Session forecast.
Although underlying economic growth will be stronger in 2013-15, General Fund revenue growth is not expected to
match the pace seen during the last biennium. Personal income taxes flowing from labor income have accelerated.

26
However, this improvement is expected to be offset by slower growth in taxable investment income such as capital
gains.
The forecast for gross General Fund revenues for 2013-15 is now $15,782 million. This represents an increase of
$19 million (+0.1%) from the December 2013 forecast. The March 2014 forecast for the 2013-15 biennium is $139
million (0.9%) above the Close of Session forecast.
Personal Income Tax
Personal income tax collections were $1,565 million for the second quarter of fiscal year 2014, $10.4 million (0.7%)
above the latest forecast. Compared to the year-ago level, total personal income tax collections grew by 4.0%
relative to a forecast that called for 3.3% growth. Table B.8 in Appendix B presents a comparison of actual and
projected personal income tax revenues for the October-December quarter.
Estimated personal income tax collections were extremely weak nationwide during January. This could well be a
signal that payments filed with April tax returns will show little growth as well.
Going forward into the 2013-15 biennium, personal income tax collections are expected to grow at somewhat below
average rates. Although growth in taxable wages is accelerating, growth in overall collections will be held back by
slower growth in taxable investment income during the 2013 tax year.
Excluding corporate excise taxes, the General Fund forecast is now $190 million above the Close of Session
forecast due to the impact of law changes. As such, we are now about $100 million away from the personal income
tax kicker threshold.
Corporate Excise Tax
Corporate excise tax collections equaled $87 million for the second quarter of fiscal year 2014, $10.1 million below
the December forecast. Compared to one year ago, net corporate receipts were down 23.5% with the forecast
calling for a 14.6% decline.
(Millions)
2013 COS
Forecast
December 2013
Forecast
March 2014
Forecast
Change from
Prior Forecast
Change from
COS Forecast
Structural Revenues
Personal Income Tax $13,558.2 $13,716.1 $13,771.6 $55.5 $213.4
Corporate Income Tax $1,056.6 $1,030.5 $1,005.9 -$24.6 -$50.7
All Other Revenues $1,027.9 $1,016.3 $1,004.4 -$11.9 -$23.5
Gross GF Revenues $15,642.6 $15,762.8 $15,781.9 $19.0 $139.3
Offsets and Transfers -$120.8 -$67.5 -$67.3 $0.2 $53.5
Administrative Actions1 -$18.2 -$13.6 -$12.7 $0.9 $5.6
Legislative Actions -$136.9 -$136.9 -$136.9 $0.0 $0.0
Net Available Resources $15,910.1 $16,006.9 $16,027.0 $20.1 $116.9
Confidence Intervals
67% Confidence +/- 6.6% $1,034.9
95% Confidence +/- 13.1% $2,069.9
1 Reflects cost of cashflow management actions, ex clusiv e of internal borrow ing.
2013-15 General Fund Forecast Summary
$14.75B to $16.82B
$13.71B to $17.85B
Table R.1

27
Despite being around the same size as two years ago, corporate tax collections remain large from an historical
perspective. Near-record corporate profits have yet to go away. Given that corporate tax collections and underlying
profits are subject to boom-bust cycles, there is a considerable amount of downside risk to the outlook.
Nevertheless, positive growth is expected during the 2013-15 biennium, due to tax reform and continued economic
growth. Oregon’s economy is expected to continue to grow, and corporate tax collections are typically very sensitive
to the business cycle. However, these growth rates, while large, will remain only a fraction of what has been seen
during recent profit booms.
Corporate income tax collections for 2013-15 are $24.6 million lower than what was called for in the December
forecast.
Other Sources of Revenue
All other General Fund revenues are expected to total $1,004 million for the 2013-15 biennium, a decrease of $11.9
million relative to the December forecast. The decline was driven by a weaker outlook for state court fees, estate
taxes and cigarette taxes.
Extended General Fund Revenue Outlook
Table R.2 exhibits the long-run forecast for General Fund revenues through the 2021-23 biennium. Users should
note that the potential for error in the forecast increases substantially the further ahead we look.
General Fund revenues are expected to total $17,497 million in 2015-17 biennium, an increase of 10.9% percent
from the prior period, and $37 million (+0.2%) above the December forecast. In 2017-19 biennium, revenue growth
is expected to slow to 8.6%, followed by rates of just under 10% in subsequent biennia. The slowdown in long-run
revenue growth is largely due to the impact of demographic changes and changes in savings behavior. Table B.2
in Appendix presents a more detailed look at the long-term General Fund revenue forecast.
Tax Law Assumptions
The revenue forecast is based on existing law, including measures and actions signed into law during the 2013
Oregon Legislative Session and October Special Legislative Session. OEA makes routine adjustments to the
forecast to account for legislative and other actions not factored into the personal and corporate income tax
models. These adjustments can include expected kicker refunds, when applicable, as well as any tax law
Table R.2
General Fund Revenue Forecast Summary (Millions of Dollars, Current Law)
Forecast Forecast Forecast Forecast Forecast Forecast
2011-13 % 2013-15 % 2015-17 % 2017-19 % 2019-21 % 2021-23 %
Revenue Source Biennium Chg Biennium Chg Biennium Chg Biennium Chg Biennium Chg Biennium Chg
Personal Income Taxes 12,118.2 15.8% 13,771.6 13.6% 15,464.4 12.3% 16,931.4 9.5% 18,681.3 10.3% 20,561.1 10.1%
Corporate Income Taxes 883.9 6.8% 1,005.9 13.8% 1,049.3 4.3% 1,026.9 -2.1% 1,066.8 3.9% 1,154.8 8.2%
All Others 1,164.9 -5.0% 1,004.4 -13.8% 983.1 -2.1% 1,045.7 6.4% 1,123.4 7.4% 1,189.2 5.9%
Gross General Fund 14,167.0 13.1% 15,781.9 11.4% 17,496.8 10.9% 19,004.0 8.6% 20,871.5 9.8% 22,905.1 9.7%
Offsets and Transfers (12.0) (67.3) (85.1) (79.1) (41.1) (43.1)
Net Revenue 14,155.0 13.0% 15,714.6 11.0% 17,411.7 10.8% 18,924.9 8.7% 20,830.4 10.1% 22,862.0 9.8%
Other tax es include General Fund portions of the Eastern Oregon Sev erance Tax , Western Oregon Sev erance Tax and Amusement Dev ice Tax .
Commercial Fish Licenses & Fees and Pari-mutual Receipts are included in Other Rev enues

28
changes not yet present in the historical data. A summary of actions taken during the 2013 Legislative Session
can be found in Appendix B Table B.3. For a detailed treatment of the components of the 2013 Legislatively
Enacted Budget, see: LFO 2013-15 Budget Summary. For summary of the revenue impacts for the October 2013
special session see: LRO HB3601 Revenue Impact Statement.
The treatment of the corporate taxes represents an important current area of policy uncertainty. Policymakers and
the court system are currently determining if firms can be asked to pay excise taxes based on a single sales
apportionment factor. Depending on the future treatment of corporate tax liability, the outlook for collections could
be lowered on the order of $100 million per biennium.
Other recent tax law changes involve the treatment of court fees and criminal fines. These changes have
significantly increased the amount of judicial related funds flowing into the General Fund, but the exact magnitude
of the impact remains unclear.
Although based on current law, many of the tax policies that impact the revenue forecast are not set in stone. In
particular, sunset dates for many large tax credits have been scheduled. As credits are allowed to disappear,
considerable support is lent to the revenue outlook in the outer years of the forecast. To the extent that tax credits
are extended and not allowed to expire when their sunset dates arrive, the outlook for revenue growth will be
reduced. The current forecast relies on estimates taken from the Oregon Department of Revenue’s 2013-15 Tax
Expenditure Report.
Alternative Scenarios
The latest revenue forecast for the current biennium represents the most probable outcome given available
information. OEA feels that it is important that anyone using this forecast for decision-making purposes recognize
the potential for actual revenues to depart significantly from this projection.
Currently, the overwhelming downside risk facing the revenue outlook is the threat that the U.S. economic
recovery will lose steam in the near term. Such a scenario, however it played out, would result in drastic revenue
losses.
Two recessionary scenarios are displayed in table R.2b. In a severe recession, biennial revenues could come in
as much as $2 billion lower than predicted.18
18 The methodology for computing alternative scenarios has recently been changed to reflect recent work done by the Legislative Revenue Office. Assumptions: Recessions begin in 2015 and return to baseline income by 2022. The moderate recession scenario assumes personal income growth will be reduced by one-half relative to the baseline in 2015 and 2016. The severe recession scenario assumes personal income will decline in 2015 by as much as it did in 2009. The percentage deviation in personal income taxes is 1.4 times the deviation in personal income. The percentage deviation in corporate income taxes is 2.0 times the deviation in personal income.

29
Lottery Earnings Forecast
Table R.3 presents a summary of lottery earnings and distribution for the 2013-15 BN. Revenues and available
resources from Lottery games and programs are projected to total $1,054.6 million, a decrease of $5.3 million from
the December outlook and $6.4 million below the Close of Session forecast. The decrease is the result of lower
video lottery sales in late 2013 and a slightly lower growth projections as well. Traditional lottery remains effectively
unchanged relative to the previous forecast.
Overall, video lottery dominates total lottery earnings, accounting for approximately 85 percent of all lottery transfers
in the past three years. Although growth has generally been slow in recent years, it has stabilized after declining
substantially in the wake of the Great Recession and enactment of the smoking ban. In total, declines in video
lottery sales approached 23 percent from pre-recession highs to the depths of the recession; the same magnitude
of losses seen in slot machine revenues in Clark County, Nevada, home of Las Vegas. So far, Oregon video lottery
sales have rebounded at approximately twice the rates seen at Clark County slot machines.
TABLE R2b
Baseline Case
2014-15
Fiscal Year
2015-16
Fiscal Year
2016-17
Fiscal Year
2017-18
Fiscal Year
2018-19
Fiscal Year
2019-20
Fiscal Year
2020-21
Fiscal Year
2021-22
Fiscal Year
2022-23
Fiscal Year
Personal Income
Level 169.06 178.21 188.59 199.09 209.09 219.27 229.61 240.16 251.00
% change 5.1% 5.4% 5.8% 5.6% 5.0% 4.9% 4.7% 4.6% 4.5%
Taxes
Personal Income 7,122 7,561 7,903 8,260 8,671 9,107 9,574 10,060 10,501
Corporate Excise & Income 543 532 517 519 508 520 547 579 576
Other General Fund 499 487 496 515 531 553 570 588 601
Total General Fund 8,164 8,580 8,916 9,294 9,710 10,180 10,692 11,227 11,679
% change 7.2% 5.1% 3.9% 4.2% 4.5% 4.8% 5.0% 5.0% 4.0%
Moderate Recession
2014-15
Fiscal Year
2015-16
Fiscal Year
2016-17
Fiscal Year
2017-18
Fiscal Year
2018-19
Fiscal Year
2019-20
Fiscal Year
2020-21
Fiscal Year
2021-22
Fiscal Year
2022-23
Fiscal Year
Personal Income
Level 169.1 173.9 179.5 191.6 203.5 215.2 227.0 238.1 249.2
% change 5.1% 2.8% 3.3% 6.7% 6.2% 5.7% 5.5% 4.9% 4.7%
Taxes
Personal Income 7,122 7,303 7,372 7,824 8,348 8,870 9,423 9,927 10,379
Deviation from baseline -258 -531 -436 -323 -237 -151 -133 -122
Corporate Excise & Income 543 506 467 480 481 500 535 569 568
Deviation from baseline -26 -50 -39 -27 -19 -12 -10 -8
Other General Fund 499 487 496 515 531 553 570 588 601
Total General Fund 8,164 8,296 8,335 8,818 9,360 9,923 10,528 11,084 11,548
% change 7.2% 1.6% 0.5% 5.8% 6.1% 6.0% 6.1% 5.3% 4.2%
Deviation from baseline -284 -581 -475 -350 -257 -164 -143 -131
Severe Recession
2014-15
Fiscal Year
2015-16
Fiscal Year
2016-17
Fiscal Year
2017-18
Fiscal Year
2018-19
Fiscal Year
2019-20
Fiscal Year
2020-21
Fiscal Year
2021-2022
Fiscal Year
2020-21
Fiscal Year
Personal Income
Level 169.1 162.4 170.2 184.2 198.1 211.8 225.8 236.8 247.9
% change 5.1% -3.9% 4.8% 8.2% 7.5% 6.9% 6.6% 4.9% 4.7%
Taxes
Personal Income 7,122 6,622 6,826 7,397 8,034 8,675 9,353 9,853 10,303
Deviation from baseline -939 -1,077 -863 -637 -432 -221 -206 -199
Corporate Excise & Income 543 438 416 441 455 485 529 563 562
Deviation from baseline -94 -101 -77 -53 -35 -18 -16 -14
Other General Fund 499 487 496 515 531 553 570 588 601
Total General Fund 8,164 7,547 7,739 8,353 9,020 9,713 10,452 11,004 11,465
% change 7.2% -7.6% 2.5% 7.9% 8.0% 7.7% 7.6% 5.3% 4.2%
Deviation from baseline -1,033 -1,178 -941 -690 -467 -239 -222 -213
March 2014
Alternative Cyclical Revenue Forecast ($ millions)

30
Moving into 2014 and beyond as the economic expansion continues and strengthens, so too do video lottery sales.
Over the forecast horizon video lottery sales are projected to increase at a rate of growth that is just under the gains
seen in overall personal income. Even with the video lottery sales increases in recent years, these gains have not
been quite as strong as the underlying
economic conditions. Consumers
remain cautious with their disposable
income and while their overall
entertainment spending is increasing,
the share of their budgets spent on
these activities has not increased. This
has not been the case in past years with
gains in video lottery having outstripped
spending on other items throughout the
Lottery’s history. Eventually as video
games lose some of their novelty, sales
growth will slow to more sustainable
levels. For a more thorough look at
Lottery revenues and consumer
spending on gaming over the business
cycle, please see our office’s research
report available on our website19.
Another major item affecting Lottery
transfers for state revenue purposes is
the capital replacement plan that
Lottery will implement over the FY
2014-2017 time frame. During this
biennium and the next, Lottery will
replace the 12,000 existing video lottery
terminals throughout the state, some of
which will be nine years old when they
are replaced. Due to advancements in
technology, like a lot of industries, the
current machines are becoming
obsolete in the marketplace. This
replacement plan is expected to cost
approximately $215 million over four
years, of which Lottery will self-fund $85
million. The remaining $130 million will
be deducted from Lottery earnings prior
to being transferred for general revenue
purposes. The biennial impact of the
replacement plan is $71.2 million in
2013-15, or less than 7 percent of
available revenue to be transferred, and
$59.2 million in 2015-17, or about 5
percent.
The full extended outlook for lottery earnings can be found in Table B.9 in Appendix B.
19 http://oregoneconomicanalysis.wordpress.com/2013/03/20/gaming-and-the-great-recession/
Table R.3
Close of 2013
Session
Dec 2013
Forecast
Mar 2014
Forecast
Dec 2013
Forecast COS 2013
Transfers of Lottery Earnings
Traditional Games $122.7 $124.5 $124.6 $0.1 $1.9
Video Lottery $1,002.9 $1,000.3 $994.8 -$5.5 -$8.1
Administrative Actions $0.0 -$0.3 -$0.1 $0.2 -$0.1
Video Lottery Terminal Replacement -$71.0 -$71.0 -$71.2 -$0.2 -$0.2
Total Transfers $1,054.6 $1,053.5 $1,048.2 -$5.3 -$6.4
Economic Development Fund
Beginning Balance $3.5 $3.5 $3.5 $0.0 $0.0
Transfers from Lottery $1,054.6 $1,053.5 $1,048.2 -$5.3 -$6.4
Other earnings1 $1.4 $1.4 $1.4 $0.0 $0.0
Total Available Resources $1,059.5 $1,058.4 $1,053.1 -$5.3 -$6.4
Dedicated Distributions2 $404.1 $405.0 $402.0 -$3.0 -$2.1
Other Legislatively Adopted Allocations $640.4 $640.4 $640.4 $0.0 $0.0
Total Distributions $1,044.5 $1,045.4 $1,042.4 -$3.0 -$2.1
Ending Balance $15.0 $13.0 $10.7 -$2.3 -$4.3
2013-15 Lottery Fund Forecast SummaryChanges from:
Footnotes:
1. Includes interest earnings and rev ersions.
2. Includes Education Stability Fund(18%), Parks & Nat. Resources(15%), Sports Lottery (1%), Gambling Addiction(1%), County
0.0%
0.1%
0.2%
0.3%
0.4%
0.5%
0.6%
0.7%
0.8%
2000Q1 2003Q1 2006Q1 2009Q1 2012Q1
Gaming as Share of Income
U.S. Casino Gambling Oregon Video Lottery

31
Overview of Budgetary Reserves
The state currently administers two general reserve accounts, the Oregon Rainy Day Fund (ORDF) and the
Education Stability Fund (ESF). This section updates balances and recalculates the outlook for these funds based
on the December revenue forecast.
Established by the 2007 Legislature, the ORDF is funded from ending balances each biennium, up to one percent
of appropriations. The Legislature can deposit additional funds, as it did in first populating the ORDF with surplus
corporate income tax revenues from the 2005-07 biennium. The ORDF also retains interest earnings. Withdrawals
from the ORDF require one of three triggers, including a decline in employment, a projected budgetary shortfall, or
declaration of a state of emergency, plus a three-fifths vote. Withdrawals are capped at two-thirds of the balance
as of the beginning of the biennium in question. Fund balances are capped at 7.5 percent of General Fund revenues
in the prior biennium.
The ESF gained its current reserve structure and mechanics via constitutional amendment in 2002. The ESF
receives 18 percent of lottery earnings20, deposited on a quarterly basis. The ESF does not retain interest earnings.
The ESF has similar triggers as the ORDF (in fact, the ORDF was modeled on the ESF), but does not have the
two-thirds cap on withdrawals. The ESF balance is capped at five percent of General Fund revenues collected in
the prior biennium.
Budgetary Reserve Outlook
Table R.4 presents projected balances for the ORDF and ESF. The ORDF ended the 2011-13 biennium with a
balance of $61.8 million, while the ESF ended the biennium with a balance of $7.6 million. Combined, these reserve
funds total approximately one-half of one percent of the 2011-13 General Fund revenues.
As the accounting books for the 2011-13
biennium close out, per statute given the
positive ending balance to the General Fund,
one percent of appropriation will be deposited
into the ORDF in the coming months. This
deposit will be $136.9 million. Additionally, at
the end of the 2013-15 biennium, the corporate
tax revenue due to the increases in the tax rate
from Measure 67, however also adjusted during
the most recent special session, will be
deposited into the ORDF. The current estimate
for the biennium is $9.8 million.
In 2013-15, the ESF is expected to see deposits
of $169.5 million based on Lottery sales. There
are no scheduled withdrawals out of the ESF
and the ending balance is projected to be
$176.9 million at the end of the biennium.
B.10 in Appendix B provides more details for
Oregon’s budgetary reserves.
20 Five percent of these transfers are deposited to the Oregon Growth sub-account. Due to the illiquid nature of this sub-account, only funds in the main account are included in the figures presented here.
Table R.4
(Millions)
2011-13
Biennium
2013-15
Biennium
2015-17
Biennium
Rainy Day Fund
Beginning Balance $10.4 $61.9 $210.2
Net Deposits3 $50.8 $146.7 $167.4
Interest $0.6 $1.7 $18.7
Ending Balance1$61.8 $210.2 $396.3
Education Stability Fund
Beginning Balance $5.1 $7.4 $176.9
Net Deposits $184.8 $169.5 $184.3
Interest2 $0.6 $1.0 $15.1
Withdrawals -$182.9 -$1.0 -$15.1
Ending Balance $7.6 $176.9 $361.3
Total Reserves $69.4 $387.2 $757.6
Percent of General Fund Revenues 0.5% 2.5% 4.4%
Oregon's Budgetary Reserves
Footnotes:
1. Under current law , only 2/3rds of the beginning balance is av ailable for w ithdraw al. Withdraw al subject to economic
and financial triggers.
2. Education Stability Fund interest is distributed to the Oregon Education Fund (75%) and the State Scholarship
Commission (25%).
3. Includes transfer of ending General Fund balances, up to 1% of budgeted appropriations, as w ell as priv ate donations.

32
POPULATION FORECAST
Oregon’s population count on April 1, 2010 was 3,831,074. Oregon gained 409,550 persons between the years
2000 and 2010. The population growth during the decade of 2000 to 2010 was 12.0 percent, down from 20.4 percent
growth from the previous decade. Oregon’s rankings in terms of decennial growth rate dropped from 11th between
1990-2000 to 18th between 2000 and 2010. Slow population growth during the most recent decade due to double
recessions probably cost Oregon one additional seat in the U.S. House of Representatives. Actually, Oregon’s
decennial population growth rate during the most recent decade was the second lowest since 1900. The slowest,
actually negative, growth was during the 1980s when Oregon was hit hard by another recession. As a result of
recent economic downturn and sluggish recovery, Oregon’s population is expected to continue a slow pace of
growth in the near future. Based on the current forecast, Oregon’s population will reach 4.25 million in the year 2020
with an annual rate of growth of 1.17 percent between 2013 and 2020.
Oregon’s economic condition heavily influences the state’s population growth. Its economy determines the ability
to retain existing work force as well as attract job seekers from national and international labor market. As Oregon’s
total fertility rate remains below the replacement level and number of deaths continue to rise due to ageing
population, long-term growth comes mainly from net in-migration. Working-age adults come to Oregon as long as
we have favorable economic and employment environments. During the 1980s, which included a major recession
and a net loss of population during the early years, net migration contributed to 22 percent of the population change.
On the other extreme, net migration accounted for 73 percent of the population change during the booming economy
of 1990s. This share of migration to population change declined to 56 percent in 2002 and it was further down to
32 percent in 2010. As a sign of slow to modest economic gain, the ratio of net migration-to-population change will
increase gradually and will reach 74 percent by the end of the forecast horizon. Although economy and employment
situation in Oregon looked stagnant in the recent past, migration situation was not similar to the early 1980s pattern
of negative net migration. Potential Oregon out-migrants had no better place to go since other states were also in
the same boat in terms of economy and employment.
Age structure and its change affect employment, state revenue, and expenditure. Demographics are the major
budget drivers, which are modified by policy choices on service coverage and delivery. Growth in many age groups
will show the effects of the baby-boom and their echo generations during the period of 2012-2020. It will also reflect
demographics impacted by the depression era birth cohort combined with diminished migration of the working age
population and elderly retirees. After a period of slow growth during the 1990s and early 2000s, the elderly
population (65+) has picked up a faster pace of growth and will surge as the baby-boom generation continue to
enter this age group. The average annual growth of the elderly population will be 4.1 percent during the forecast
period as the boomers continue to enter retirement age. However, the youngest elderly (aged 65-74) will grow at
an extremely fast pace during the forecast period, averaging 4.7 percent annual rate of growth due to the direct
impact of the baby-boom generation entering the retirement age and smaller pre-baby boom cohort exiting the 65-
74 age group. Reversing several years of shrinking population, the elderly aged 75-84 started to show a positive
growth as the effect of depression era birth-cohort will dissipate. A faster pace of growth of population in this age
group will begin once the baby-boom generation starts to mature into 65-74 age group. The oldest elderly (aged
85+) will continue to grow at a moderately but steady rate due to the combination of cohort change, continued
positive net migration, and improving longevity. The average annual rate of growth for this oldest elderly over the
forecast horizon will be 1.6 percent.
As the baby-boom generation matures out of oldest working-age cohort combined with slowing net migration, the
once fast-paced growth of population aged 45-64 has gradually tapered off to below zero percent rate of growth by
2012 and will remain at slow or below zero growth phase for several years. The size of this older working-age
population will remain virtually unchanged at the beginning to the end of the forecast period. The 25-44 age group
population is recovering from several years of declining and slow growing trend. The decline was mainly due to the
exiting baby-boom cohort. This age group has seen positive growth starting in the year 2004 and will increase by
1.4 percent annual average rate during the forecast horizon. The young adult population (aged 18-24) will remain
nearly unchanged over the forecast period. Although the slow or stagnant growth of college-age population (age
18-24), in general, tend to ease the pressure on public spending on higher education, college enrollment typically

33
goes up during the time of high unemployment and scarcity of well-paying jobs when even the older people flock
back to colleges to better position themselves in a tough job market. The growth in K-12 population (aged 5-17)
will remain low which will translate into slow growth in school enrollments. This school-age population has actually
declined in size in recent years and will grow in the future at well below the overall state average. The growth rate
for children under the age of five will remain below or near zero percent in the near future and will see positive
growth only after 2014. Although the number of children under the age of five will decline slightly in the near future,
the demand for child care services and pre-Kindergarten program will be additionally determined by the labor force
participation and poverty rates of the parents. Overall, elderly population over age 65 will increase rapidly whereas
population groups under age 65 will experience slow growth in the coming years. Hence, based solely on
demographics of Oregon, demand for public services geared towards children and young adults will likely to
increase at a slower pace, whereas demand for elderly care and services will increase rapidly.
Procedure and Assumptions
Population forecasts by age and sex are developed using the cohort-component projection procedure. The
population by single year of age and sex is projected based on the specific assumptions of vital events and
migrations. Oregon’s estimated population of July 1, 2010 based on the most recent decennial census is the base
for the forecast. To explain the cohort-component projection procedure very briefly, the forecasting model "survives"
the initial population distribution by age and sex to the next age-sex category in the following year, and then applies
age-sex-specific birth and migration rates to the mid-period population. Further iterations subject the in-and-out
migrants to the same mortality and fertility rates.
Populations by age-sex detail for the years 2000 through 2009, called intercensal estimates, in the following tables
are developed by OEA based on 2000 and 2010 censuses and 2011-2013 postcensal totals from the Population
Research Center, Portland State University. The numbers of births and deaths through 2009-12 are from Oregon's
Center for Health Statistics. The total populations for the period 2014 to 2020 are generated as part of the economic
and revenue forecast of OEA.
Annual numbers of births are determined from the age-specific fertility rates projected based on Oregon's past
trends and past and projected national trends. Oregon's total fertility rate is assumed to remain below the
replacement level of 2.1 children per woman during the forecast period, tracking at slightly lower than the nation.
Life Table survival rates are developed for the year 2008. Male and female life expectancies for the 2010-2020
period are projected based on the past three decades of trends and national projected life expectancies. Gradual
improvements in life expectancies are expected over the forecast period. At the same time, the difference between
the male and female life expectancies will continue to shrink. The male life expectancy at births of 77.1 and the
female life expectancy of 81.7 in 2010 are projected to improve to 78.2 years for males and 82.7 years for females
by the year 2020.
Estimates and forecasts of the number of net migrations are based on the residuals from the difference between
population change and natural increase (births minus deaths) in a given forecast period. The migration forecasting
model uses Oregon’s employment, unemployment rates, income/wage data from Oregon and other states, and
past trends. Distribution of migrants by age and sex is based on detailed data from the American Community Survey.
The annual net migration between 2013 and 2020 is expected to remain in the range of 28,700 to 38,500, averaging
34,260 persons annually. Slowdown in Oregon’s economy in the recent years resulted in smaller net migration and
slow population growth. Estimated population growth and net migration rates in 2010 and 2011 were the lowest in
over two decades. This slow population growth is expected a gradual recovery in the future. Migration is intrinsically
related to economy and employment situation of the state. Still, high unemployment and job loss in the recent past
have impacted net migration and population growth, but not to the extent in the early 1980s. Main reason for this is
the fact that other states of potential destination for Oregon out-migrants were not faring any better either. Hence
the potential out-migrants have very limited destination choices. As Oregon’s economy gets better, net migration
and population growth will increase. However, the growth will not look like high growth period of 1990s.
APPENDIX A: ECONOMIC FORECAST DETAIL

34
Table A.1 Employment Forecast Tracking ………………………………………...................................... 35
Table A.2 Short-term Oregon Economic Summary ……………………..................................................... 36
Table A.3 Oregon Economic Forecast Change …………………………………………………………… 37
Table A.4 Annual Economic Forecast ……………………………………………………………………. 38

35
Table A.1 – Employment Forecast Tracking
Total Nonfarm Employment, 4th quarter 2013
(Employment in thousands, Annualized Percent Change)
Y/Y
Change
level % ch level % ch level % % ch
Total Nonfarm 1,685.6 1.7 1,681.3 1.7 4.3 0.3 2.1
Total Private 1,397.2 1.9 1,393.9 1.9 3.3 0.2 2.7
Mining and Logging 7.7 5.3 7.9 10.7 (0.2) (3.0) 4.3
Construction 75.3 5.3 74.9 5.2 0.4 0.6 7.6
Manufacturing 176.2 2.9 175.1 0.8 1.1 0.6 2.0
Durable Goods 124.0 2.5 122.9 0.6 1.1 0.9 1.3
Wood Product 21.4 6.5 20.2 (10.9) 1.3 6.2 5.5
Metals and Machinery 35.7 2.6 36.0 2.3 (0.3) (0.8) 2.2
Computer and Electronic Product 36.9 0.5 37.3 5.1 (0.4) (1.1) 0.3
Transportation Equipment 10.5 3.9 10.4 (0.8) 0.1 0.9 (6.2)
Other Durable Goods 19.4 1.2 18.9 2.7 0.5 2.6 1.4
Nondurable Goods 52.3 4.0 52.2 1.4 0.0 0.0 3.6
Food 26.2 8.0 25.9 (2.0) 0.4 1.5 5.9
Other Nondurable Goods 26.0 0.1 26.4 4.7 (0.4) (1.4) 1.4
Trade, Transportation & Utilities 327.5 2.4 326.7 1.9 0.8 0.3 2.8
Retail Trade 194.0 1.9 192.9 2.0 1.1 0.6 2.9
Wholesale Trade 78.4 3.1 77.9 1.5 0.5 0.6 3.3
Transportation, Warehousing & Utilities 55.2 3.2 56.0 2.2 (0.8) (1.4) 1.9
Information 32.4 7.3 32.0 2.2 0.4 1.2 (0.6)
Financial Activities 91.2 (5.5) 92.0 (0.4) (0.8) (0.9) (1.0)
Professional & Business Services 205.5 0.7 204.6 1.9 0.9 0.4 4.0
Educational & Health Services 244.6 2.1 242.1 (0.4) 2.5 1.0 1.9
Educational Services 34.5 2.8 34.0 (2.9) 0.5 1.4 1.2
Health Services 210.1 2.0 208.0 0.1 2.1 1.0 2.0
Leisure and Hospitality 178.2 2.8 180.0 6.1 (1.8) (1.0) 3.7
Other Services 58.6 1.6 58.6 1.3 (0.0) (0.0) 1.8
Government 288.4 0.7 287.4 0.6 1.1 0.4 (0.5)
Federal 27.7 5.9 27.3 2.8 0.3 1.2 (2.2)
State 81.2 0.0 80.6 0.8 0.6 0.7 1.5
State Education 32.2 5.9 31.7 (0.3) 0.6 1.8 1.0
Local 179.6 0.2 179.4 0.2 0.2 0.1 (1.2)
Local Education 93.8 2.2 92.9 (4.1) 0.8 0.9 (2.1)
Estimate
Preliminary Forecast ErrorForecast

36
Table A.2 – Short-term Oregon Economic Summary
Oregon Forecast Summary
2013:3 2013:4 2014:1 2014:2 2014:3 2011 2012 2013 2014 2015 2016
Nominal Personal Income 158.9 159.6 161.5 163.5 165.7 146.0 152.7 157.5 164.6 173.5 183.3
% change 4.4 1.7 4.8 5.1 5.5 6.1 4.6 3.1 4.5 5.3 5.7
148.0 148.4 149.8 151.1 152.6 140.3 144.1 147.0 151.9 157.8 164.1
% change 2.4 1.1 3.9 3.4 4.1 3.6 2.7 2.0 3.4 3.9 4.0
Nominal Wages and Salaries 80.9 81.1 81.5 82.4 83.4 74.3 77.4 80.2 83.0 87.4 92.0
% change 3.4 1.1 2.0 4.5 5.0 4.8 4.2 3.6 3.5 5.3 5.3
Per Capita Income ($1,000) 40.4 40.5 40.9 41.3 41.7 37.8 39.3 40.1 41.5 43.2 45.2
% change 3.1 0.7 3.9 4.0 4.1 5.5 3.9 2.2 3.4 4.2 4.5
Average Wage rate ($1,000) 47.9 47.7 47.6 47.8 48.1 45.3 46.7 47.5 48.0 49.3 50.7
% change 2.5 (1.6) (0.4) 1.9 2.3 3.6 3.1 1.6 1.1 2.7 2.9
Population (Millions) 3.9 3.9 4.0 4.0 4.0 3.86 3.89 3.93 3.97 4.01 4.06
% change 1.3 1.0 0.9 1.1 1.3 0.6 0.7 0.9 1.1 1.1 1.2
Housing Starts (Thousands) 14.2 14.3 14.6 15.6 16.2 8.0 10.9 14.4 15.9 19.6 23.1
% change (11.2) 1.5 10.9 28.2 18.0 5.3 35.6 32.6 10.1 23.6 17.7
Unemployment Rate 8.0 7.3 6.9 6.8 6.8 9.6 8.7 7.9 6.8 6.6 6.6
Point Change 0.1 (0.7) (0.4) (0.1) (0.0) (1.1) (0.9) (0.9) (1.1) (0.2) 0.1
Total Nonfarm 1,678.5 1,685.6 1,695.0 1,705.1 1,715.7 1,620.2 1,640.1 1,674.2 1,710.5 1,752.0 1,791.2
% change 1.7 1.7 2.3 2.4 2.5 1.1 1.2 2.1 2.2 2.4 2.2
Private Nonfarm 1,390.5 1,397.2 1,406.3 1,415.8 1,425.7 1,325.2 1,349.3 1,386.1 1,420.8 1,459.4 1,494.7
% change 1.9 1.9 2.6 2.8 2.8 1.8 1.8 2.7 2.5 2.7 2.4
Construction 74.3 75.3 76.2 76.9 77.6 68.6 69.8 73.9 77.3 80.2 83.2
% change 1.1 5.3 4.9 3.5 4.0 1.4 1.7 5.9 4.6 3.7 3.8
Manufacturing 175.0 176.2 177.2 178.9 180.4 168.1 171.8 175.0 179.5 184.0 187.0
% change 0.6 2.9 2.2 3.8 3.5 2.6 2.2 1.9 2.6 2.5 1.6
Durable Manufacturing 123.2 124.0 125.2 126.5 127.8 118.6 121.6 123.1 127.1 131.0 133.7
% change 1.5 2.5 3.9 4.4 4.3 3.2 2.5 1.3 3.2 3.1 2.0
Wood Product Manufacturing 21.1 21.4 21.7 21.9 22.1 19.2 19.8 21.0 22.0 22.7 23.1
% change 4.4 6.5 4.9 4.4 4.5 (3.7) 2.7 6.3 4.8 3.2 1.7
High Tech Manufacturing 36.9 36.9 37.5 38.2 38.6 36.4 37.0 36.7 38.3 39.3 39.7
% change 4.6 0.5 6.5 7.3 5.2 4.1 1.6 (0.9) 4.5 2.7 1.0
Transportation Equipment 10.4 10.5 10.5 10.5 10.7 10.7 11.1 10.7 10.6 11.1 11.3
% change (10.5) 3.9 (1.8) 1.9 5.5 5.2 3.1 (3.6) (0.5) 4.1 2.0
Nondurable Manufacturing 51.8 52.3 52.1 52.4 52.6 49.5 50.3 51.9 52.4 53.0 53.3
% change (1.7) 4.0 (1.6) 2.4 1.8 1.2 1.5 3.2 1.1 1.1 0.5
Private nonmanufacturing 1,215.5 1,220.9 1,229.0 1,237.0 1,245.3 1,157.1 1,177.5 1,211.1 1,241.3 1,275.3 1,307.7
% change 2.1 1.8 2.7 2.6 2.7 1.6 1.8 2.8 2.5 2.7 2.5
Retail Trade 193.0 194.0 195.2 196.2 197.1 184.8 187.2 192.0 196.6 200.1 204.0
% change 3.5 1.9 2.6 1.9 2.0 0.9 1.3 2.5 2.4 1.8 1.9
Wholesale Trade 77.8 78.4 78.8 79.2 79.5 74.2 75.3 77.6 79.3 80.7 82.2
% change 3.3 3.1 2.2 2.0 1.8 1.3 1.5 3.0 2.3 1.7 1.9
Information 31.8 32.4 32.6 32.9 33.1 32.1 32.5 32.1 33.0 33.8 34.7
% change 1.2 7.3 3.1 3.1 2.9 (0.0) 1.2 (1.2) 2.8 2.5 2.6
Professional and Business Services 205.1 205.5 206.5 208.2 210.5 188.7 195.4 203.3 209.6 220.2 229.3
% change 5.1 0.7 2.0 3.4 4.5 3.5 3.6 4.1 3.1 5.0 4.2
Health Services 209.0 210.1 211.4 212.7 213.9 201.2 204.2 208.7 213.3 217.8 222.4
% change 1.7 2.0 2.4 2.6 2.3 2.1 1.5 2.2 2.2 2.1 2.1
Leisure and Hospitality 177.0 178.2 180.3 182.0 183.3 165.6 169.8 176.3 182.5 187.2 190.7
% change 1.9 2.8 4.9 3.8 2.9 2.0 2.5 3.9 3.5 2.5 1.9
Government 288.0 288.4 288.8 289.3 290.0 295.0 290.8 288.1 289.7 292.7 296.5
% change 0.7 0.7 0.5 0.8 0.9 (1.6) (1.4) (0.9) 0.5 1.0 1.3
Personal Income ($ billions)
Other Indicators
Employment (Thousands)
Annual
Real Personal Income (base year=2005)
Quarterly

37
Table A.3 – Oregon Economic Forecast Change
Oregon Forecast Change (Current vs. Last)
2013:3 2013:4 2014:1 2014:2 2014:3 2011 2012 2013 2014 2015 2016
Nominal Personal Income 158.9 159.6 161.5 163.5 165.7 146.0 152.7 157.5 164.6 173.5 183.3
% change 0.8 0.5 0.2 0.3 0.3 0.0 0.0 0.5 0.3 0.3 0.4
148.0 148.4 149.8 151.1 152.6 140.3 144.1 147.0 151.9 157.8 164.1
% change 0.8 0.7 0.6 0.7 0.7 0.0 0.0 0.6 0.7 0.9 1.2
Nominal Wages and Salaries 80.9 81.1 81.5 82.4 83.4 74.3 77.4 80.2 83.0 87.4 92.0
% change 1.3 1.2 0.7 0.6 0.6 0.0 0.0 1.0 0.6 0.7 0.9
Per Capita Income ($1,000) 40.4 40.5 40.9 41.3 41.7 37.8 39.3 40.1 41.5 43.2 45.2
% change 0.7 0.5 0.1 0.2 0.2 (0.0) (0.0) 0.5 0.2 0.3 0.4
Average Wage rate ($1,000) 47.9 47.7 47.6 47.8 48.1 45.3 46.7 47.5 48.0 49.3 50.7
% change 1.5 1.0 0.5 0.5 0.5 0.0 0.0 1.0 0.5 0.4 0.4
Population (Millions) 3.93 3.94 3.95 4.0 4.0 3.86 3.89 3.93 3.97 4.01 4.06
% change 0.0 0.1 0.1 0.1 0.1 0.0 0.0 0.0 0.1 0.1 0.0
Housing Starts (Thousands) 14.2 14.3 14.6 15.6 16.2 8.0 10.9 14.4 15.9 19.6 23.1
% change (5.2) (5.5) (8.2) (5.7) (4.7) (0.0) 0.0 (2.7) (5.7) (3.3) (2.7)
Unemployment Rate 8.0 7.3 6.9 6.8 6.8 9.6 8.7 7.9 6.8 6.6 6.6
Point Change (0.1) (0.7) (0.9) (0.9) (0.8) 0.0 0.0 (0.2) (0.8) (0.4) 0.0
Total Nonfarm 1,678.5 1,685.6 1,695.0 1,705.1 1,715.7 1,620.2 1,640.1 1,674.2 1,710.5 1,752.0 1,791.2
% change 0.3 0.3 0.2 0.1 0.2 0.0 0.0 0.1 0.2 0.4 0.5
Private Nonfarm 1,390.5 1,397.2 1,406.3 1,415.8 1,425.7 1,325.2 1,349.3 1,386.1 1,420.8 1,459.4 1,494.7
% change 0.2 0.2 0.2 0.1 0.2 0.0 0.0 0.1 0.2 0.4 0.6
Construction 74.3 75.3 76.2 76.9 77.6 68.6 69.8 73.9 77.3 80.2 83.2
% change 0.5 0.6 0.9 1.1 1.1 0.0 (0.0) 0.0 1.2 1.2 0.9
Manufacturing 175.0 176.2 177.2 178.9 180.4 168.1 171.8 175.0 179.5 184.0 187.0
% change 0.1 0.6 0.3 0.3 0.5 0.0 0.0 0.2 0.4 0.1 (0.2)
Durable Manufacturing 123.2 124.0 125.2 126.5 127.8 118.6 121.6 123.1 127.1 131.0 133.7
% change 0.4 0.9 0.7 0.6 0.8 (0.0) 0.0 0.3 0.7 0.2 (0.3)
Wood Product Manufacturing 21.1 21.4 21.7 21.9 22.1 19.2 19.8 21.0 22.0 22.7 23.1
% change 1.6 6.2 5.7 4.5 3.8 0.0 0.0 1.9 4.2 (0.4) (3.2)
High Tech Manufacturing 36.9 36.9 37.5 38.2 38.6 36.4 37.0 36.7 38.3 39.3 39.7
% change (0.0) (1.1) (1.1) (0.5) 0.0 (0.0) (0.0) (0.3) (0.3) (0.0) (0.4)
Transportation Equipment 10.4 10.5 10.5 10.5 10.7 10.7 11.1 10.7 10.6 11.1 11.3
% change (0.2) 0.9 0.1 (0.0) 0.5 (0.0) 0.0 0.1 0.5 1.1 (0.3)
Nondurable Manufacturing 51.8 52.3 52.1 52.4 52.6 49.5 50.3 51.9 52.4 53.0 53.3
% change (0.6) 0.0 (0.8) (0.5) (0.3) 0.0 0.0 (0.2) (0.4) (0.2) (0.2)
Private nonmanufacturing 1,215.5 1,220.9 1,229.0 1,237.0 1,245.3 1,157.1 1,177.5 1,211.1 1,241.3 1,275.3 1,307.7
% change 0.3 0.2 0.2 0.1 0.1 0.0 0.0 0.1 0.1 0.5 0.7
Retail Trade 193.0 194.0 195.2 196.2 197.1 184.8 187.2 192.0 196.6 200.1 204.0
% change 0.6 0.6 0.5 0.4 0.3 0.0 0.0 0.3 0.4 0.2 0.4
Wholesale Trade 77.8 78.4 78.8 79.2 79.5 74.2 75.3 77.6 79.3 80.7 82.2
% change 0.2 0.6 0.7 0.7 0.8 0.0 0.0 0.3 0.7 1.0 1.1
Information 31.8 32.4 32.6 32.9 33.1 32.1 32.5 32.1 33.0 33.8 34.7
% change (0.0) 1.2 1.1 0.9 0.4 (0.0) (0.0) 0.3 0.7 1.0 1.0
Professional and Business Services 205.1 205.5 206.5 208.2 210.5 188.7 195.4 203.3 209.6 220.2 229.3
% change 0.7 0.4 0.1 (0.1) 0.0 0.0 0.0 0.3 0.0 0.9 1.6
Health Services 209.0 210.1 211.4 212.7 213.9 201.2 204.2 208.7 213.3 217.8 222.4
% change 0.5 1.0 0.5 0.1 0.1 0.0 0.0 0.5 0.2 0.4 0.4
Leisure and Hospitality 177.0 178.2 180.3 182.0 183.3 165.6 169.8 176.3 182.5 187.2 190.7
% change (0.3) (1.0) (0.1) 0.2 0.2 0.0 0.0 (0.3) 0.1 0.6 1.1
Government 288.0 288.4 288.8 289.3 290.0 295.0 290.8 288.1 289.7 292.7 296.5
% change 0.4 0.4 0.2 0.2 0.1 (0.0) (0.0) 0.2 0.2 0.1 0.2
Employment (Thousands)
Personal Income ($ billions)
Quarterly Annual
Real Personal Income (base year=2005)
Other Indicators

38
Table A.4 Annual Economic Forecast
TABLE A.4
Mar 2014 - Personal Income
(Billions of Current Dollars)
2011 2012 2013 2014 2015 2016 2017 2018 2019 2020 2021 2022
Total Personal Income*
Oregon 146.0 152.7 157.5 164.6 173.5 183.3 194.0 204.0 214.1 224.4 234.9 245.5
% Ch 6.1 4.6 3.1 4.5 5.3 5.7 5.8 5.2 5.0 4.8 4.7 4.5
U.S. 13,191.3 13,743.8 14,138.2 14,785.6 15,527.3 16,356.0 17,252.8 18,125.8 18,978.6 19,827.2 20,673.8 21,556.9
% Ch 6.1 4.2 2.9 4.6 5.0 5.3 5.5 5.1 4.7 4.5 4.3 4.3
Wage and Salary
Oregon 74.3 77.4 80.2 83.0 87.4 92.0 96.7 101.4 105.7 110.3 114.8 119.3
% Ch 4.8 4.2 3.6 3.5 5.3 5.3 5.2 4.8 4.3 4.3 4.1 3.9
U.S. 6,638.7 6,926.8 7,138.4 7,457.8 7,853.9 8,269.8 8,684.6 9,081.4 9,471.9 9,865.4 10,245.2 10,642.1
% Ch 4.1 4.3 3.1 4.5 5.3 5.3 5.0 4.6 4.3 4.2 3.8 3.9
Other Labor Income
Oregon 18.4 20.1 21.0 21.7 22.6 23.8 25.1 26.3 27.5 28.6 29.6 30.7
% Ch 3.6 9.1 4.6 3.0 4.5 5.2 5.4 5.0 4.3 3.9 3.7 3.5
U.S. 1,145.4 1,170.6 1,190.4 1,224.1 1,275.7 1,343.1 1,418.5 1,490.8 1,555.2 1,615.3 1,673.3 1,730.9
% Ch 2.2 2.2 1.7 2.8 4.2 5.3 5.6 5.1 4.3 3.9 3.6 3.4
Nonfarm Proprietor's Income
Oregon 10.2 10.9 11.7 12.4 13.2 14.0 14.5 15.1 15.7 16.3 17.0 17.6
% Ch 4.2 6.8 6.9 6.4 6.4 5.5 3.9 3.8 4.2 4.1 3.8 3.7
U.S. 1,082.6 1,149.6 1,220.9 1,293.7 1,374.0 1,453.8 1,516.2 1,580.6 1,652.0 1,724.1 1,795.6 1,874.6
% Ch 9.7 6.2 6.2 6.0 6.2 5.8 4.3 4.2 4.5 4.4 4.1 4.4
Dividend, Interest and Rent
Oregon 27.7 29.3 30.5 32.4 34.3 36.5 39.7 42.5 45.0 47.5 50.0 52.6
% Ch 9.7 5.9 3.9 6.4 5.6 6.6 8.9 6.9 6.0 5.4 5.4 5.1
U.S. 2,369.0 2,499.7 2,589.5 2,765.5 2,916.3 3,095.8 3,361.4 3,604.7 3,809.2 3,999.1 4,197.8 4,396.8
% Ch 10.6 5.5 3.6 6.8 5.5 6.2 8.6 7.2 5.7 5.0 5.0 4.7
Transfer Payments
Oregon 29.3 29.8 31.2 32.8 34.5 36.5 38.3 39.9 42.2 44.7 47.3 50.0
% Ch 2.1 1.7 4.6 5.4 5.0 6.0 4.8 4.1 5.8 5.9 5.9 5.7
U.S. 2,274.3 2,329.2 2,406.1 2,538.3 2,645.9 2,772.3 2,888.5 3,018.7 3,176.8 3,349.8 3,522.5 3,708.2
% Ch 1.7 2.4 3.3 5.5 4.2 4.8 4.2 4.5 5.2 5.4 5.2 5.3
Contributions for Social Security
Oregon 11.7 12.2 14.1 14.7 15.6 16.5 17.4 18.1 18.9 19.7 20.5 21.2
% Ch (6.2) 3.6 16.2 4.2 6.0 5.8 5.0 4.4 4.4 4.3 4.0 3.4
U.S. 423.8 436.4 575.2 610.2 654.7 701.1 741.0 780.2 818.5 857.4 895.5 935.6
% Ch (17.7) 3.0 31.8 6.1 7.3 7.1 5.7 5.3 4.9 4.8 4.4 4.5
Residence Adjustment
Oregon (2.6) (3.0) (3.2) (3.2) (3.3) (3.4) (3.5) (3.6) (3.7) (3.8) (3.9) (4.0)
% Ch 11.0 18.6 4.0 2.4 2.9 3.1 3.2 3.0 2.6 2.7 2.5 2.0
Farm Proprietor's Income
Oregon 0.4 0.3 0.3 0.3 0.4 0.5 0.5 0.7 0.7 0.7 0.6 0.6
% Ch 1,581.8 (5.5) (22.8) (2.0) 69.7 12.4 5.4 28.1 1.0 (1.5) (3.5) (6.3)
Per Capita Income (Thousands of $)
Oregon 37.8 39.3 40.1 41.5 43.2 45.2 47.2 49.1 50.9 52.7 54.5 56.2
% Ch 5.5 3.9 2.2 3.4 4.2 4.5 4.6 3.9 3.7 3.5 3.4 3.3
U.S. 42.2 43.7 44.6 46.3 48.2 50.4 52.8 55.0 57.2 59.3 61.3 63.5
% Ch 5.3 3.4 2.1 3.8 4.2 4.5 4.7 4.3 3.9 3.7 3.5 3.5
* Personal Income includes all classes of income minus Contributions for Social Security

39
TABLE A.4Mar 2014 - Employment By Industry
(Oregon - Thousands, U.S. - Millions)
2011 2012 2013 2014 2015 2016 2017 2018 2019 2020 2021 2022
Total Nonfarm
Oregon 1,620.2 1,640.1 1,674.2 1,710.5 1,752.0 1,791.2 1,826.4 1,853.3 1,873.8 1,892.4 1,906.0 1,919.6
% Ch 1.1 1.2 2.1 2.2 2.4 2.2 2.0 1.5 1.1 1.0 0.7 0.7
U.S. 131.5 133.7 135.9 138.3 141.0 143.9 146.4 148.1 149.3 150.3 150.8 151.5
% Ch 1.2 1.7 1.6 1.7 2.0 2.0 1.7 1.2 0.8 0.7 0.3 0.4
Private Nonfarm
Oregon 1,325.2 1,349.3 1,386.1 1,420.8 1,459.4 1,494.7 1,526.0 1,549.0 1,565.9 1,579.1 1,590.8 1,601.0
% Ch 1.8 1.8 2.7 2.5 2.7 2.4 2.1 1.5 1.1 0.8 0.7 0.6
U.S. 109.4 111.8 114.1 116.4 119.0 121.7 124.0 125.5 126.4 127.0 127.4 127.9
% Ch 1.9 2.2 2.0 2.0 2.3 2.3 1.9 1.2 0.7 0.5 0.3 0.3
Mining and Logging
Oregon 7.0 7.2 7.6 7.8 8.1 8.2 8.3 8.3 8.3 8.2 8.2 8.2
% Ch 4.6 3.1 5.7 2.7 2.8 2.0 0.6 0.4 (0.4) (0.6) (0.4) 0.0
U.S. 0.8 0.9 0.9 0.9 0.9 0.9 0.9 1.0 0.9 0.9 1.0 1.0
% Ch 11.8 8.0 2.7 1.3 1.5 3.4 1.4 1.0 (0.4) 0.2 1.2 0.9
Construction
Oregon 68.6 69.8 73.9 77.3 80.2 83.2 85.5 86.7 87.8 88.6 89.2 89.5
% Ch 1.4 1.7 5.9 4.6 3.7 3.8 2.7 1.4 1.2 1.0 0.6 0.4
U.S. 5.5 5.6 5.8 6.1 6.6 7.2 7.7 7.9 8.0 8.0 8.1 8.1
% Ch 0.3 2.0 2.9 4.2 9.2 9.7 6.0 2.4 1.2 1.1 0.7 0.5
Manufacturing
Oregon 168.1 171.8 175.0 179.5 184.0 187.0 189.0 189.6 189.8 189.9 189.7 189.6
% Ch 2.6 2.2 1.9 2.6 2.5 1.6 1.1 0.3 0.1 0.0 (0.1) (0.0)
U.S. 11.7 11.9 12.0 12.3 12.6 12.7 12.8 12.8 12.8 12.8 12.7 12.6
% Ch 1.7 1.7 0.5 2.6 2.2 1.3 0.5 0.3 0.1 (0.3) (0.5) (0.7)
Durable Manufacturing
Oregon 118.6 121.6 123.1 127.1 131.0 133.7 135.4 135.5 135.3 135.0 134.6 134.4
% Ch 3.2 2.5 1.3 3.2 3.1 2.0 1.3 0.1 (0.1) (0.2) (0.3) (0.1)
U.S. 7.3 7.5 7.5 7.8 8.1 8.3 8.3 8.4 8.4 8.3 8.3 8.2
% Ch 3.0 2.6 0.8 3.8 3.7 2.3 0.7 0.1 0.1 (0.4) (0.6) (0.7)
Wood Products
Oregon 19.2 19.8 21.0 22.0 22.7 23.1 23.1 22.7 22.3 21.9 21.5 21.2
% Ch (3.7) 2.7 6.3 4.8 3.2 1.7 (0.1) (1.7) (1.6) (1.8) (1.8) (1.5)
U.S. 0.3 0.3 0.3 0.4 0.5 0.6 0.6 0.6 0.6 0.6 0.6 0.5
% Ch (1.5) 0.4 3.0 17.5 26.8 12.6 (0.9) (2.4) 0.7 (0.3) (2.7) (3.1)
Metal and Machinery
Oregon 33.3 34.6 35.5 36.4 37.5 38.5 39.2 39.3 39.3 39.4 39.4 39.5
% Ch 6.9 3.9 2.5 2.5 3.0 2.7 1.8 0.4 (0.0) 0.2 0.1 0.1
U.S. 2.8 2.9 2.9 3.0 3.1 3.2 3.3 3.3 3.3 3.4 3.4 3.4
% Ch 5.7 4.3 0.9 3.4 3.7 3.2 1.8 0.5 0.5 0.3 0.2 (0.0)
Computer and Electronic Products
Oregon 36.4 37.0 36.7 38.3 39.3 39.7 40.0 40.0 40.1 40.3 40.4 40.5
% Ch 4.1 1.6 (0.9) 4.5 2.7 1.0 0.7 0.1 0.3 0.4 0.2 0.2
U.S. 1.1 1.1 1.1 1.1 1.1 1.1 1.1 1.1 1.1 1.1 1.1 1.1
% Ch 0.8 (0.9) (1.0) 1.5 (1.5) (2.3) 0.8 2.5 1.9 1.3 0.9 0.9
T ransportation Equipment
Oregon 10.7 11.1 10.7 10.6 11.1 11.3 11.5 11.5 11.3 11.0 10.8 10.7
% Ch 5.2 3.1 (3.6) (0.5) 4.1 2.0 2.3 (0.3) (1.8) (2.3) (1.9) (1.3)
U.S. 1.4 1.5 1.5 1.5 1.6 1.6 1.6 1.6 1.5 1.5 1.5 1.4
% Ch 3.6 5.4 2.3 3.6 2.6 1.6 (0.5) (1.4) (1.8) (2.9) (2.4) (2.4)
Other Durables
Oregon 18.9 19.1 19.3 19.8 20.4 21.1 21.6 21.9 22.2 22.3 22.5 22.6
% Ch 1.6 1.2 1.1 2.6 3.2 3.4 2.2 1.5 1.3 0.7 0.5 0.5
U.S. 2.0 2.0 2.0 2.2 2.3 2.4 2.3 2.3 2.3 2.3 2.3 2.3
% Ch 0.0 0.3 2.1 5.5 6.3 3.0 (0.5) (0.4) 0.3 (0.0) (0.5) (0.6)
Nondurable Manufacturing
Oregon 49.5 50.3 51.9 52.4 53.0 53.3 53.7 54.2 54.6 54.9 55.1 55.2
% Ch 1.2 1.5 3.2 1.1 1.1 0.5 0.7 1.0 0.7 0.6 0.4 0.2
U.S. 4.5 4.5 4.5 4.5 4.5 4.4 4.4 4.5 4.5 4.5 4.4 4.4
% Ch (0.2) 0.1 0.0 0.5 (0.3) (0.5) (0.0) 0.6 0.0 (0.3) (0.5) (0.8)
Food Manufacturing
Oregon 24.2 24.7 25.9 26.0 26.0 26.0 26.2 26.3 26.3 26.4 26.5 26.6
% Ch 1.7 2.1 4.7 0.2 0.1 0.3 0.5 0.3 0.3 0.4 0.4 0.3
U.S. 1.5 1.5 1.5 1.5 1.5 1.5 1.5 1.6 1.6 1.6 1.6 1.6
% Ch 0.5 0.7 0.2 1.4 0.9 0.7 0.9 1.6 0.9 0.8 0.6 0.2
Other Nondurable
Oregon 25.3 25.5 26.0 26.5 27.0 27.2 27.5 27.9 28.2 28.4 28.6 28.6
% Ch 0.7 0.9 1.8 1.9 2.1 0.8 0.9 1.6 1.1 0.7 0.4 0.1
U.S. 3.0 3.0 3.0 3.0 3.0 2.9 2.9 2.9 2.9 2.9 2.8 2.8
% Ch (0.6) (0.2) 0.5 (0.7) (1.0) (0.8) (0.6) (0.4) (0.6) (0.8) (0.9) (1.1)
Trade, Transportation, and Utilities
Oregon 312.4 316.6 324.4 331.9 338.4 345.7 353.1 358.6 360.9 360.9 360.6 360.6
% Ch 1.2 1.3 2.5 2.3 1.9 2.2 2.1 1.5 0.6 0.0 (0.1) (0.0)
U.S. 25.1 25.5 26.0 26.4 26.7 27.1 27.5 27.7 27.8 27.7 27.6 27.5
% Ch 1.7 1.8 1.8 1.5 1.2 1.6 1.5 0.8 0.2 (0.1) (0.3) (0.4)

40
TABLE A.4Mar 2014 - Employment By Industry
(Oregon - Thousands, U.S. - Millions)
2011 2012 2013 2014 2015 2016 2017 2018 2019 2020 2021 2022
Retail Trade
Oregon 184.8 187.2 192.0 196.6 200.1 204.0 207.8 210.5 211.3 210.6 209.8 209.5
% Ch 0.9 1.3 2.5 2.4 1.8 1.9 1.9 1.3 0.4 (0.3) (0.4) (0.1)
U.S. 14.7 14.9 15.2 15.4 15.5 15.5 15.6 15.6 15.6 15.5 15.4 15.3
% Ch 1.6 1.4 2.1 1.6 0.2 0.5 0.6 (0.0) (0.3) (0.5) (0.8) (0.7)
Wholesale Trade
Oregon 74.2 75.3 77.6 79.3 80.7 82.2 83.8 85.0 85.8 86.4 86.7 86.9
% Ch 1.3 1.5 3.0 2.3 1.7 1.9 1.9 1.5 1.0 0.6 0.4 0.2
U.S. 5.5 5.7 5.8 5.8 5.9 6.1 6.2 6.3 6.4 6.4 6.5 6.5
% Ch 1.7 2.4 1.6 0.9 2.1 2.5 2.3 1.6 0.9 0.5 0.4 0.3
Transportation and Warehousing, and Utilities
Oregon 53.4 54.0 54.8 56.0 57.6 59.6 61.6 63.1 63.8 64.0 64.1 64.2
% Ch 2.3 1.2 1.5 2.1 2.9 3.4 3.4 2.4 1.1 0.4 0.2 0.1
U.S. 4.9 5.0 5.0 5.1 5.3 5.5 5.6 5.8 5.8 5.8 5.8 5.8
% Ch 2.3 2.4 1.4 1.7 3.1 3.5 3.2 2.2 0.6 0.1 (0.1) (0.2)
Information
Oregon 32.1 32.5 32.1 33.0 33.8 34.7 35.8 36.5 37.2 37.8 38.4 39.1
% Ch (0.0) 1.2 (1.2) 2.8 2.5 2.6 3.2 2.0 1.7 1.7 1.7 1.8
U.S. 2.7 2.7 2.7 2.7 2.7 2.8 2.8 2.9 2.9 3.0 3.0 3.1
% Ch (1.2) 0.1 0.4 (0.4) (0.1) 3.0 2.8 1.8 2.0 1.9 1.9 2.0
Financial Activities
Oregon 91.7 90.9 92.1 92.0 94.2 96.2 97.6 98.5 99.1 99.5 99.9 100.0
% Ch (1.6) (0.9) 1.4 (0.1) 2.4 2.2 1.4 0.9 0.7 0.4 0.3 0.1
U.S. 7.7 7.8 7.9 7.9 7.9 7.9 7.9 7.8 7.8 7.8 7.8 7.8
% Ch 0.0 1.2 1.3 0.1 0.5 (0.2) (0.8) (0.7) (0.3) 0.0 (0.2) (0.1)
Professional and Business Services
Oregon 188.7 195.4 203.3 209.6 220.2 229.3 236.6 241.6 246.4 251.5 256.1 261.6
% Ch 3.5 3.6 4.1 3.1 5.0 4.2 3.2 2.1 2.0 2.1 1.9 2.1
U.S. 17.3 17.9 18.5 19.3 20.2 21.0 21.6 22.0 22.4 22.9 23.3 23.8
% Ch 3.6 3.5 3.4 3.9 5.1 3.6 3.0 2.0 1.8 2.0 1.8 2.0
Education and Health Services
Oregon 234.3 238.2 243.0 247.8 252.6 257.4 262.8 268.5 273.7 278.1 282.4 285.6
% Ch 2.3 1.7 2.0 2.0 1.9 1.9 2.1 2.2 1.9 1.6 1.6 1.1
U.S. 19.9 20.3 20.7 21.0 21.3 21.8 22.3 22.7 23.0 23.2 23.3 23.4
% Ch 1.8 2.2 1.8 1.6 1.5 2.3 2.2 2.0 1.3 0.6 0.4 0.3
Educational Services
Oregon 33.0 34.0 34.4 34.6 34.8 35.0 35.4 35.9 36.3 36.8 37.2 37.8
% Ch 3.8 2.8 1.2 0.6 0.5 0.8 1.0 1.3 1.3 1.3 1.1 1.4
U.S. 3.3 3.3 3.4 3.4 3.3 3.3 3.3 3.3 3.3 3.3 3.2 3.1
% Ch 3.1 3.0 0.7 0.2 (1.8) (0.8) 0.4 0.6 (0.6) (1.4) (1.8) (1.9)
Health Care and Social Assistance
Oregon 201.2 204.2 208.7 213.3 217.8 222.4 227.4 232.7 237.3 241.2 245.2 247.8
% Ch 2.1 1.5 2.2 2.2 2.1 2.1 2.3 2.3 2.0 1.7 1.6 1.1
U.S. 16.6 17.0 17.3 17.6 18.0 18.5 19.0 19.4 19.7 19.9 20.1 20.2
% Ch 1.6 2.0 2.0 1.9 2.1 2.9 2.6 2.2 1.6 0.9 0.8 0.7
Leisure and Hospitality
Oregon 165.6 169.8 176.3 182.5 187.2 190.7 193.7 196.2 197.6 198.7 199.6 200.0
% Ch 2.0 2.5 3.9 3.5 2.5 1.9 1.6 1.2 0.7 0.6 0.5 0.2
U.S. 13.4 13.7 14.2 14.4 14.6 14.8 15.0 15.2 15.2 15.2 15.2 15.2
% Ch 2.4 3.0 2.9 2.0 1.4 1.2 1.4 1.0 0.4 0.1 (0.1) (0.1)
O ther Services
Oregon 56.8 57.3 58.3 59.3 60.8 62.2 63.5 64.4 65.2 65.9 66.6 66.8
% Ch 0.4 0.8 1.7 1.8 2.5 2.2 2.1 1.5 1.3 1.1 1.0 0.3
U.S. 5.4 5.4 5.5 5.5 5.5 5.4 5.5 5.5 5.5 5.4 5.4 5.4
% Ch 0.6 1.4 0.9 0.1 (0.5) (0.2) 0.3 0.3 (0.5) (0.4) (0.3) (0.2)
Government
Oregon 295.0 290.8 288.1 289.7 292.7 296.5 300.4 304.3 307.9 313.3 315.2 318.5
% Ch (1.6) (1.4) (0.9) 0.5 1.0 1.3 1.3 1.3 1.2 1.7 0.6 1.0
U.S. 22.1 21.9 21.9 21.9 22.0 22.2 22.4 22.6 22.9 23.2 23.3 23.6
% Ch (1.8) (0.8) (0.3) 0.2 0.4 0.7 0.9 1.1 1.1 1.7 0.4 1.0
Federal Government
Oregon 28.8 28.1 27.5 27.7 27.5 27.3 27.3 27.2 27.1 28.7 27.2 27.1
% Ch (5.7) (2.3) (2.0) 0.4 (0.4) (0.7) (0.2) (0.3) (0.2) 5.7 (5.3) (0.3)
U.S. 2.9 2.8 2.7 2.7 2.7 2.6 2.6 2.6 2.6 2.7 2.5 2.5
% Ch (3.9) (1.5) (2.5) (1.8) (0.6) (1.6) (1.1) (1.2) (0.9) 5.2 (5.5) (0.5)
State Government, O regon
State Total 80.6 80.0 80.7 81.5 81.8 82.4 83.3 84.2 85.2 86.2 87.1 88.1
% Ch 1.0 (0.7) 0.9 0.9 0.4 0.8 1.0 1.1 1.2 1.1 1.1 1.1
State Education 31.1 31.8 32.0 32.2 32.3 32.4 32.6 32.9 33.1 33.4 33.7 34.0
% Ch 4.5 2.1 0.6 0.5 0.3 0.3 0.7 0.8 0.9 0.9 0.9 0.8
Local Government, O regon
Local Total 185.6 182.7 179.8 180.6 183.3 186.7 189.8 192.8 195.6 198.4 201.0 203.4
% Ch (2.1) (1.6) (1.6) 0.4 1.5 1.9 1.7 1.6 1.4 1.5 1.3 1.2
Local Education 97.0 95.4 93.5 94.4 95.9 98.3 100.6 102.5 104.1 105.6 107.1 108.6
% Ch (3.3) (1.6) (2.0) 0.9 1.6 2.5 2.3 1.9 1.5 1.4 1.4 1.4
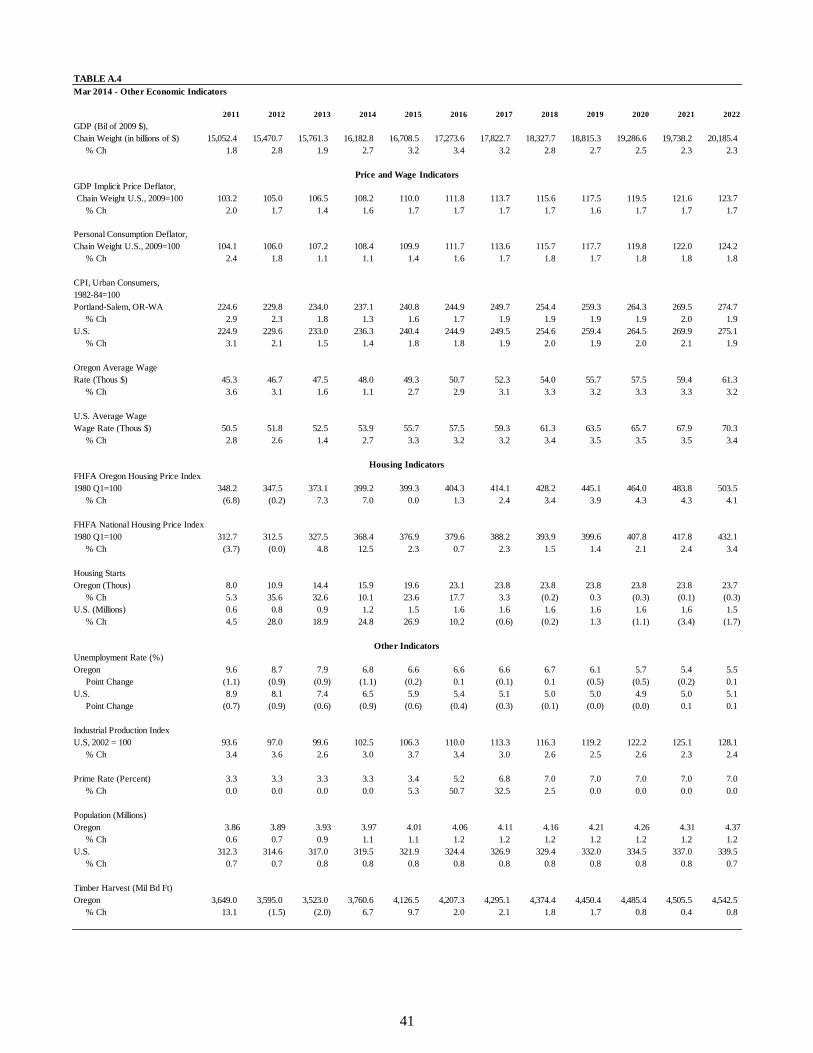
41
TABLE A.4
Mar 2014 - Other Economic Indicators
2011 2012 2013 2014 2015 2016 2017 2018 2019 2020 2021 2022
GDP (Bil of 2009 $),
Chain Weight (in billions of $) 15,052.4 15,470.7 15,761.3 16,182.8 16,708.5 17,273.6 17,822.7 18,327.7 18,815.3 19,286.6 19,738.2 20,185.4
% Ch 1.8 2.8 1.9 2.7 3.2 3.4 3.2 2.8 2.7 2.5 2.3 2.3
Price and Wage Indicators
GDP Implicit Price Deflator,
Chain Weight U.S., 2009=100 103.2 105.0 106.5 108.2 110.0 111.8 113.7 115.6 117.5 119.5 121.6 123.7
% Ch 2.0 1.7 1.4 1.6 1.7 1.7 1.7 1.7 1.6 1.7 1.7 1.7
Personal Consumption Deflator,
Chain Weight U.S., 2009=100 104.1 106.0 107.2 108.4 109.9 111.7 113.6 115.7 117.7 119.8 122.0 124.2
% Ch 2.4 1.8 1.1 1.1 1.4 1.6 1.7 1.8 1.7 1.8 1.8 1.8
CPI, Urban Consumers,
1982-84=100
Portland-Salem, OR-WA 224.6 229.8 234.0 237.1 240.8 244.9 249.7 254.4 259.3 264.3 269.5 274.7
% Ch 2.9 2.3 1.8 1.3 1.6 1.7 1.9 1.9 1.9 1.9 2.0 1.9
U.S. 224.9 229.6 233.0 236.3 240.4 244.9 249.5 254.6 259.4 264.5 269.9 275.1
% Ch 3.1 2.1 1.5 1.4 1.8 1.8 1.9 2.0 1.9 2.0 2.1 1.9
Oregon Average Wage
Rate (Thous $) 45.3 46.7 47.5 48.0 49.3 50.7 52.3 54.0 55.7 57.5 59.4 61.3
% Ch 3.6 3.1 1.6 1.1 2.7 2.9 3.1 3.3 3.2 3.3 3.3 3.2
U.S. Average Wage
Wage Rate (Thous $) 50.5 51.8 52.5 53.9 55.7 57.5 59.3 61.3 63.5 65.7 67.9 70.3
% Ch 2.8 2.6 1.4 2.7 3.3 3.2 3.2 3.4 3.5 3.5 3.5 3.4
Housing Indicators
FHFA Oregon Housing Price Index
1980 Q1=100 348.2 347.5 373.1 399.2 399.3 404.3 414.1 428.2 445.1 464.0 483.8 503.5
% Ch (6.8) (0.2) 7.3 7.0 0.0 1.3 2.4 3.4 3.9 4.3 4.3 4.1
FHFA National Housing Price Index
1980 Q1=100 312.7 312.5 327.5 368.4 376.9 379.6 388.2 393.9 399.6 407.8 417.8 432.1
% Ch (3.7) (0.0) 4.8 12.5 2.3 0.7 2.3 1.5 1.4 2.1 2.4 3.4
Housing Starts
Oregon (Thous) 8.0 10.9 14.4 15.9 19.6 23.1 23.8 23.8 23.8 23.8 23.8 23.7
% Ch 5.3 35.6 32.6 10.1 23.6 17.7 3.3 (0.2) 0.3 (0.3) (0.1) (0.3)
U.S. (Millions) 0.6 0.8 0.9 1.2 1.5 1.6 1.6 1.6 1.6 1.6 1.6 1.5
% Ch 4.5 28.0 18.9 24.8 26.9 10.2 (0.6) (0.2) 1.3 (1.1) (3.4) (1.7)
Other Indicators
Unemployment Rate (%)
Oregon 9.6 8.7 7.9 6.8 6.6 6.6 6.6 6.7 6.1 5.7 5.4 5.5
Point Change (1.1) (0.9) (0.9) (1.1) (0.2) 0.1 (0.1) 0.1 (0.5) (0.5) (0.2) 0.1
U.S. 8.9 8.1 7.4 6.5 5.9 5.4 5.1 5.0 5.0 4.9 5.0 5.1
Point Change (0.7) (0.9) (0.6) (0.9) (0.6) (0.4) (0.3) (0.1) (0.0) (0.0) 0.1 0.1
Industrial Production Index
U.S, 2002 = 100 93.6 97.0 99.6 102.5 106.3 110.0 113.3 116.3 119.2 122.2 125.1 128.1
% Ch 3.4 3.6 2.6 3.0 3.7 3.4 3.0 2.6 2.5 2.6 2.3 2.4
Prime Rate (Percent) 3.3 3.3 3.3 3.3 3.4 5.2 6.8 7.0 7.0 7.0 7.0 7.0
% Ch 0.0 0.0 0.0 0.0 5.3 50.7 32.5 2.5 0.0 0.0 0.0 0.0
Population (Millions)
Oregon 3.86 3.89 3.93 3.97 4.01 4.06 4.11 4.16 4.21 4.26 4.31 4.37
% Ch 0.6 0.7 0.9 1.1 1.1 1.2 1.2 1.2 1.2 1.2 1.2 1.2
U.S. 312.3 314.6 317.0 319.5 321.9 324.4 326.9 329.4 332.0 334.5 337.0 339.5
% Ch 0.7 0.7 0.8 0.8 0.8 0.8 0.8 0.8 0.8 0.8 0.8 0.7
Timber Harvest (Mil Bd Ft)
Oregon 3,649.0 3,595.0 3,523.0 3,760.6 4,126.5 4,207.3 4,295.1 4,374.4 4,450.4 4,485.4 4,505.5 4,542.5
% Ch 13.1 (1.5) (2.0) 6.7 9.7 2.0 2.1 1.8 1.7 0.8 0.4 0.8

42
APPENDIX B: REVENUE FORECAST DETAIL
Table B.1 General Fund Revenue Statement – 2013-15 ……………………………….………..…… 43
Table B.2 General Fund Revenue Forecast by Fiscal Year .………………….………..….……….… 44
Table B.3 Summary of 2013 Legislative Session Adjustments ………………………………………. 45
Table B.4 Oregon Personal Income Tax Revenue Forecast …………………………..….………….. 46
Table B.5 Oregon Corporate Income Tax Revenue Forecast ……………………….….……………. 48
Table B.6 Cigarette and Tobacco Tax Distribution ……………………………………….…………… 50
Table B.7 Liquor Apportionment and Revenue Distribution to Local Governments ………….…… 51
Table B.8 Track Record for the May 2013 Forecast ………………………………………………….. 52
Table B.9 Summary of Lottery Resources …………….……………………………………………..... 53
Table B.10 Budgetary Reserve Summary ……………..………………………………………………... 54

43
Table B.1 General Fund Revenue Statement - 2013-15
Table B.1
General Fund Revenue Statement -- 2013-15
Total Total
2013-14 2014-15 2013-15 2013-14 2014-15 2013-15
Taxes
Personal Income Taxes (Before Kicker) 13,558,172,000 6,612,980,000 7,103,117,000 13,716,097,000 6,649,464,000 7,122,157,000 13,771,621,000 55,524,000 213,449,000
Offsets and Transfers (57,542,000) (24,142,000) (33,400,000) (57,542,000) (24,142,000) (33,400,000) (57,542,000) 0 0
Corporate Income Taxes (Before Kicker) 1,056,570,000 481,968,000 548,520,000 1,030,488,000 462,708,000 543,153,000 1,005,861,000 (24,627,000) (50,709,000)
Offsets and Transfers (63,298,000) (5,000,000) (5,000,000) (10,000,000) (4,662,000) (5,102,000) (9,764,000) 236,000 53,534,000
Insurance Taxes 107,754,000 49,803,000 56,299,000 106,102,000 47,768,000 57,301,000 105,069,000 (1,033,000) (2,685,000)
Estate Taxes 207,982,000 96,091,000 107,871,000 203,962,000 93,691,000 104,571,000 198,262,000 (5,700,000) (9,720,000)
Cigarette Taxes 69,049,000 37,365,000 38,027,000 75,392,000 36,207,000 35,394,000 71,601,000 (3,791,000) 2,552,000
Other Tobacco Products Taxes 59,366,000 29,273,000 30,093,000 59,366,000 29,816,000 30,093,000 59,909,000 543,000 543,000
Other Taxes 1,262,000 636,000 626,000 1,262,000 643,000 623,000 1,266,000 4,000 4,000
Fines and Fees
State Court Fees 143,819,000 65,481,000 66,226,000 131,707,000 61,179,000 66,955,000 128,134,000 (3,573,000) (15,685,000)
Secretary of State Fees 55,031,000 27,550,000 27,481,000 55,031,000 27,550,000 27,481,000 55,031,000 0 0
Criminal Fines & Assessments 46,578,000 24,738,000 20,932,000 45,670,000 24,594,000 20,811,000 45,405,000 (265,000) (1,173,000)
Securities Fees 20,244,000 10,230,000 10,099,000 20,329,000 11,619,000 10,647,000 22,266,000 1,937,000 2,022,000
Central Service Charges 8,152,000 4,076,000 4,076,000 8,152,000 4,076,000 4,076,000 8,152,000 0 0
Liquor Apportionment 250,959,000 124,551,000 127,067,000 251,618,000 124,551,000 127,067,000 251,618,000 0 659,000
Interest Earnings 9,961,000 4,316,000 5,645,000 9,961,000 4,316,000 5,645,000 9,961,000 0 0
Miscellaneous Revenues 15,500,000 7,500,000 8,000,000 15,500,000 7,500,000 8,000,000 15,500,000 0 0
One-time Transfers 32,200,000 32,200,000 0 32,200,000 32,200,000 0 32,200,000 0 0
Gross General Fund Revenues 15,642,599,000 7,608,758,000 8,154,079,000 15,762,837,000 7,617,882,000 8,163,974,000 15,781,856,000 19,019,000 139,257,000
Offsets and Transfers Total (120,840,000) (29,142,000) (38,400,000) (67,542,000) (28,804,000) (38,502,000) (67,306,000) 236,000 53,534,000
Net General Fund Revenues 15,521,759,000 7,579,616,000 8,115,679,000 15,695,295,000 7,589,078,000 8,125,472,000 15,714,550,000 19,255,000 192,791,000
Plus Beginning Balance 543,497,392 462,009,392 462,009,392 0 (81,488,000)
Less Anticipated Administrative Actions* (18,222,166) (13,551,000) (12,656,000) 895,000 5,566,166
Plus Legislatively Adopted Actions** (136,886,136) (136,886,136) (136,886,136) 0 0
Available Resources 15,910,148,090 16,006,867,256 16,027,017,256 20,150,000 116,869,166
Legislatively Adopted Budget 15,608,670,298 15,789,670,298 15,789,670,298 0 181,000,000
0
Plus Administrative Actions 0 NA 0
Projected Expenditures 15,608,670,298 15,789,670,298 15,789,670,298 NA 181,000,000
Estimated Ending Balance 301,477,792 217,196,958 237,346,958 20,150,000 (64,130,834)
Notes: Corporate income tax figure includes Corporate Multistate taxes.
Other taxes include General Fund portions of the Eastern Oregon Severance Tax, Western Oregon Severance Tax and Amusement Device Tax.
Cigarette and Other Tobacco Taxes are gross tax receipts. Distributions, net of administrative costs, are reported in the Table B.6.
Detailed entries may not add to totals due to rounding.
* Administrative Actions equal expenses associated with cashflow management, exclusive of internal borrowing.
Estimate at
COS 2013
Forecasts Dated: 12/1/2013 Forecasts Dated: 3/1/2014 Difference
03/1/2014 Less
12/1/2013
03/1/2014 Less
COS

44
Table B.2 General Fund Revenue Forecast by Fiscal Year 1
Fiscal Years
2013-14
Fiscal Year
2014-15
Fiscal Year
2015-16
Fiscal Year
2016-17
Fiscal Year
2017-18
Fiscal Year
2018-19
Fiscal Year
2019-20
Fiscal Year
2020-21
Fiscal Year
2021-22
Fiscal Year
2022-23
Fiscal Year
Taxes
Personal Income 6,649.5 7,122.2 7,561.2 7,903.1 8,260.4 8,671.0 9,107.0 9,574.2 10,059.6 10,501.5
Offsets and Transfers (24.1) (33.4) (36.9) (38.7) (40.5) 0.0 0.0 0.0 0.0 0.0
Corporate Excise & Income 462.7 543.2 532.3 517.0 518.7 508.3 519.7 547.1 578.8 576.0
Offsets and Transfers (4.7) (5.1) (4.8) (4.7) (19.2) (19.4) (20.2) (20.9) (21.6) (21.5)
Insurance 47.8 57.3 57.9 60.9 63.5 66.2 68.2 70.0 71.4 73.4
Estate 93.7 104.6 107.1 113.1 117.1 125.3 130.8 137.6 144.9 152.6
Cigarette 36.2 35.4 32.7 29.7 27.9 25.4 23.6 21.3 19.5 16.8
Other Tobacco Products 29.8 30.1 30.9 31.8 32.7 33.6 34.5 35.5 36.5 37.5
Other Taxes 0.6 0.6 0.6 0.6 0.6 0.6 0.6 0.6 0.6 0.6
O ther Revenues
Licenses and Fees 124.9 125.9 123.9 121.8 127.2 124.9 129.6 127.4 131.0 128.8
Charges for Services 4.1 4.1 4.1 4.1 4.1 4.1 4.1 4.1 4.1 4.1
Liquor Apportionment 124.6 127.1 114.5 117.9 121.5 125.1 128.9 132.7 136.7 140.8
Interest Earnings 4.3 5.6 7.0 8.0 11.8 17.5 24.4 32.7 35.0 38.0
Others 39.7 8.0 8.2 8.4 8.4 8.4 8.4 8.4 8.4 8.4
Gross General Fund 7,617.9 8,164.0 8,580.4 8,916.4 9,293.7 9,710.4 10,179.8 10,691.7 11,226.5 11,678.6
Net General Fund 7,589.1 8,125.5 8,538.7 8,873.0 9,234.0 9,690.9 10,159.6 10,670.8 11,204.9 11,657.0
Biennial Totals
2013-15
Biennium
Percent
Change
2015-17
Biennium
Percent
Change
2017-19
Biennium
Percent
Change
2019-21
Biennium
Percent
Change
2021-23
Biennium
Percent
Change
Taxes
Personal Income 13,771.6 13.6% 15,464.4 12.3% 16,931.4 9.5% 18,681.3 10.3% 20,561.1 10.1%
Corporate Excise & Income 1,005.9 13.8% 1,049.3 4.3% 1,026.9 -2.1% 1,066.8 3.9% 1,154.8 8.2%
Insurance 105.1 8.7% 118.8 13.1% 129.6 9.1% 138.2 6.6% 144.8 4.8%
Estate Taxes 198.3 -2.6% 220.1 11.0% 242.4 10.1% 268.4 10.7% 297.4 10.8%
Cigarette 71.6 -4.5% 62.4 -12.8% 53.3 -14.7% 44.9 -15.7% 36.3 -19.1%
Other Tobacco Products 59.9 2.2% 62.7 4.7% 66.3 5.7% 70.1 5.7% 74.0 5.7%
Other Taxes 1.3 -41.5% 1.2 -2.8% 1.2 -0.4% 1.2 0.0% 1.2 0.0%
O ther Revenues
Licenses and Fees 250.8 -9.5% 245.6 -2.1% 252.0 2.6% 257.0 2.0% 259.9 1.1%
Charges for Services 8.2 -29.7% 8.2 0.0% 8.2 0.0% 8.2 0.0% 8.2 0.0%
Liquor Apportionment 251.6 11.6% 232.4 -7.6% 246.6 6.1% 261.6 6.1% 277.5 6.1%
Interest Earnings 10.0 -38.3% 14.9 50.0% 29.3 95.9% 57.1 95.1% 73.0 27.8%
Others 47.7 -76.0% 16.6 -65.2% 16.8 1.2% 16.8 0.0% 16.8 0.0%
Gross General Fund 15,781.9 11.4% 17,496.8 10.9% 19,004.0 8.6% 20,871.5 9.8% 22,905.1 9.7%
Net General Fund 15,714.6 11.0% 17,411.7 10.8% 18,924.9 8.7% 20,830.4 10.1% 22,862.0 9.8%
March 2014
($Millions)
General Fund Revenue Forecast
Note: Totals may not sum due to rounding. Other taxes include Eastern and Western Oregon Severance Taxes and Amusement Device Tax. Other revenues include Commercial Fish
Licenses & Fees and Pari-mutual Receipts.

45
Table B.3 Summary of 2013 Legislative Session Adjustments
Biennia Staff Measure Summary
Revenue Impact
Statement 13-15 15-17 17-19 19-21 21-23
Personal Income Tax Impacts (Millions) 1099 Penalties – HB 2464 $0.8 $1.1 $1.2 $1.3 $1.4 HB 2464 HB 2464
Federal Reconnect – HB 2494 -$0.7 $0.4 $0.00 $0.00 $0.00 HB 2492 HB 2492 DOR Enforcement – SB 5538 $33.1 $0.0 $0.0 $0.0 $0.0 SB 5538
Tax Credits - HB 3367 HB 3367 HB 3367 Earned Income -$42.2 -$75.2 -$75.8 -$37.5 $0.0 Medical Deduction $3.0 $5.0 $6.0 $8.0 $10.0 Married-Filing Separate $4.0 $5.0 $5.0 $6.0 $6.0 Political Contributions -$6.3 -$15.5 -$13.7 -$5.6 $0.0 Cultural Trust -$3.3 -$6.6 -$6.8 -$3.4 $0.0 Pension Income -$0.9 -$1.7 -$1.7 -$0.9 $0.0 Rural Medical Provider -$1.0 -$3.6 -$2.9 -$2.3 -$1.9 Rural EMT -$0.2 -$0.3 -$0.3 -$0.2 $0.0 Employer Provider Scholar. $0.0 -$0.1 -$0.1 $0.0 $0.0 Farmworkers Housing $0.0 -$0.1 -$0.2 -$0.3 -$0.2 Mobile Home Closure $0.0 -$0.1 -$0.1 $0.0 $0.0 Mobile Home Gains $0.0 -$0.1 -$0.1 $0.0 $0.0 Film & Video Credit -$7.6 $-7.6 -$3.8 $0.0 $0.0
Personal Income Tax Total -$21.3 -$100.2 -$93.3 -$34.9 $15.3
Corporate Income Tax Impacts (Millions) Out of State Banks – HB 3477 $1.0 $1.0 $1.0 $1.0 $1.0 HB 3477 HB 3477 1099 Penalties – HB 2464 $0.2 $0.1 $0.1 $0.1 $0.1 HB 2464 HB 2464
Tax Havens – HB 2460 $18.0 $42.0 $49.0 $51.0 $55.0 HB 2460 HB 2460 Fire Insurance – HB 2084 -$1.4 -$2.0 -$2.2 -$2.3 -$2.4 HB 2084 HB 2084
Tax Credits - HB 3367 HB 3367 HB 3367 Farmworkers Housing. -$0.2 -$0.5 -$0.7 -$0.9 -$0.8 Sunset Workers Comp $1.5 $3.0 $3.0 $3.0 $3.0
Corporate Income Tax Total $19.1 $43.6 $50.2 $51.9 $55.9
Other Tax/Revenue Impacts (Millions) Program Change Bill – HB 2322 $47.5 $0.0 $0.0 $0.0 $0.0 HB 2322 HB 2322 Criminal Fines – HB 2562 -$9.2 -$9.4 -$9.6 -$9.8 -$10.0 HB 2562 HB 2562
Other Tax Total $38.3 -$9.4 -$9.6 -$9.8 -$10.0

46
Table B.4 Oregon Personal Income Tax Revenue Forecast
TABLE B.4
2005:3 2005:4 2006:1 2006:2 FY 2006 2006:3 2006:4 2007:1 2007:2 FY 2007
WITHHOLDING 1,064,107 1,087,942 1,177,488 1,075,476 4,405,013 1,118,878 1,172,656 1,182,336 1,088,108 4,561,977
%CHYA 8.4% 6.4% 10.5% 6.0% 7.8% 5.1% 7.8% 0.4% 1.2% 3.6%
EST. PAYMENTS 194,848 186,648 224,403 270,754 876,653 231,720 177,026 267,345 363,055 1,039,146
%CHYA 22.4% 36.4% 11.4% 0.3% 14.2% 18.9% -5.2% 19.1% 34.1% 18.5%
FINAL PAYMENTS 51,797 68,000 88,998 787,622 996,416 55,408 89,432 100,476 779,577 1,024,893
%CHYA 16.8% 27.6% 13.8% 49.4% 41.7% 7.0% 31.5% 12.9% -1.0% 2.9%
REFUNDS 62,638 94,755 345,524 358,699 861,617 89,254 126,707 444,768 369,456 1,030,186
%CHYA -9.4% 17.8% 0.7% -1.4% 0.6% 42.5% 33.7% 28.7% 3.0% 19.6%
OTHER (149,733) - - 176,911 27,178 (176,911) - - 177,781 870
TOTAL 1,098,381 1,247,835 1,145,365 1,952,063 5,443,644 1,139,841 1,312,406 1,105,388 2,039,066 5,596,701
%CHYA 10.9% 10.2% 14.3% 22.2% 15.3% 3.8% 5.2% -3.5% 4.5% 2.8%
2007:3 2007:4 2008:1 2008:2 FY 2008 2008:3 2008:4 2009:1 2009:2 FY 2009
WITHHOLDING 1,115,359 1,200,822 1,196,532 1,111,034 4,623,747 1,162,107 1,182,763 1,128,994 1,089,305 4,563,169
%CHYA -0.3% 2.4% 1.2% 2.1% 1.4% 4.2% -1.5% -5.6% -2.0% -1.3%
EST. PAYMENTS 250,749 217,163 281,441 399,475 1,148,828 264,440 174,826 217,305 263,135 919,707
%CHYA 8.2% 22.7% 5.3% 10.0% 10.6% 5.5% -19.5% -22.8% -34.1% -19.9%
FINAL PAYMENTS 57,503 129,817 104,841 971,325 1,263,486 70,306 99,430 104,105 529,995 803,836
%CHYA 3.8% 45.2% 4.3% 24.6% 23.3% 22.3% -23.4% -0.7% -45.4% -36.4%
REFUNDS 71,372 155,912 389,876 365,908 983,068 92,063 180,329 447,706 404,229 1,124,327
%CHYA -20.0% 23.0% -12.3% -1.0% -4.6% 29.0% 15.7% 14.8% 10.5% 14.4%
OTHER (177,781) (1,084,201) - 182,322 (1,079,660) (182,322) - - 138,521 (43,801)
TOTAL 1,174,457 307,689 1,192,938 2,298,247 4,973,332 1,222,469 1,276,690 1,002,698 1,616,726 5,118,583
%CHYA 3.0% -76.6% 7.9% 12.7% -11.1% 4.1% 314.9% -15.9% -29.7% 2.9%
2009:3 2009:4 2010:1 2010:2 FY 2010 2010:3 2010:4 2011:1 2011:2 FY 2011
WITHHOLDING 1,092,795 1,151,673 1,157,857 1,116,552 4,518,878 1,146,189 1,196,214 1,262,781 1,218,439 4,823,622
%CHYA -6.0% -2.6% 2.6% 2.5% -1.0% 4.9% 3.9% 9.1% 9.1% 6.7%
EST. PAYMENTS 176,110 161,759 186,894 265,703 790,467 179,692 148,589 207,036 284,662 819,978
%CHYA -33.4% -7.5% -14.0% 1.0% -14.1% 2.0% -8.1% 10.8% 7.1% 3.7%
FINAL PAYMENTS 63,363 77,013 105,745 515,262 761,383 62,259 81,728 114,877 607,592 866,456
%CHYA -9.9% -22.5% 1.6% -2.8% -5.3% -1.7% 6.1% 8.6% 17.9% 13.8%
REFUNDS 96,477 188,704 459,550 380,459 1,125,190 92,291 151,515 432,478 340,652 1,016,937
%CHYA 4.8% 4.6% 2.6% -5.9% 0.1% -4.3% -19.7% -5.9% -10.5% -9.6%
OTHER (138,521) - - 136,193 (2,328) (136,193) - - 165,933 29,740
TOTAL 1,097,271 1,201,740 990,947 1,653,251 4,943,210 1,159,655 1,275,015 1,152,216 1,935,973 5,522,860
%CHYA -10.2% -5.9% -1.2% 2.3% -3.4% 5.7% 6.1% 16.3% 17.1% 11.7%
2011:3 2011:4 2012:1 2012:2 FY 2012 2012:3 2012:4 2013:1 2013:2 FY 2013
WITHHOLDING 1,235,508 1,287,030 1,348,171 1,269,562 5,140,271 1,262,589 1,364,547 1,354,116 1,321,413 5,302,666
%CHYA 7.8% 7.6% 6.8% 4.2% 6.6% 2.2% 6.0% 0.4% 4.1% 3.2%
EST. PAYMENTS 194,674 185,239 199,238 299,646 878,797 205,533 159,104 278,341 321,896 964,874
%CHYA 8.3% 24.7% -3.8% 5.3% 7.2% 5.6% -14.1% 39.7% 7.4% 9.8%
FINAL PAYMENTS1
85,889 87,233 117,628 627,762 918,512 72,224 91,338 123,456 785,542 1,072,560
%CHYA 38.0% 6.7% 2.4% 3.3% 6.0% -15.9% 4.7% 5.0% 25.1% 16.8%
REFUNDS 64,687 156,272 530,800 360,618 1,112,377 52,211 109,503 536,506 383,176 1,081,397
%CHYA -29.9% 3.1% 22.7% 5.9% 9.4% -19.3% -29.9% 1.1% 6.3% -2.8%
OTHER (165,933) - - 193,614 27,681 (193,614) - - 201,367 7,753
TOTAL 1,285,451 1,403,230 1,134,237 2,029,966 5,852,884 1,294,521 1,505,486 1,219,407 2,247,042 6,266,457
%CHYA 10.8% 10.1% -1.6% 4.9% 6.0% 0.7% 7.3% 7.5% 10.7% 7.1%
February 2014
OREGON PERSONAL INCOME TAX REVENUE FORECAST - QUARTERLY COLLECTIONS
Thousands of Dollars - Not Seasonally Adjusted
Note: "Other" includes kicker and federal pension refunds, as well as July withholding accrued to June.
Tax law impacts are reflected in the collections numbers to produce more meaningful projections.

47
TABLE B.4
2013:3 2013:4 2014:1 2014:2 FY 2014 2014:3 2014:4 2015:1 2015:2 FY 2015
WITHHOLDING 1,333,946 1,435,630 1,445,985 1,392,729 5,608,289 1,404,740 1,511,911 1,522,666 1,466,424 5,905,742
%CHYA 5.7% 5.2% 6.8% 5.4% 5.8% 5.3% 5.3% 5.3% 5.3% 5.3%
EST. PAYMENTS 221,695 214,342 232,996 399,246 1,068,278 274,966 265,846 286,593 437,152 1,264,558
%CHYA 7.9% 34.7% -16.3% 24.0% 10.7% 24.0% 24.0% 23.0% 9.5% 18.4%
FINAL PAYMENTS1
83,096 112,495 130,058 851,472 1,177,121 75,453 105,363 119,572 948,930 1,249,317
%CHYA 15.1% 23.2% 5.3% 8.4% 9.7% -9.2% -6.3% -8.1% 11.4% 6.1%
REFUNDS 67,098 197,448 538,294 412,181 1,215,021 97,511 191,403 573,920 445,853 1,308,687
%CHYA 28.5% 80.3% 0.3% 7.6% 12.4% 45.3% -3.1% 6.6% 8.2% 7.7%
OTHER (201,367) - - 212,164 10,797 (212,164) - - 223,391 11,227
TOTAL 1,370,272 1,565,018 1,270,744 2,443,430 6,649,464 1,445,485 1,691,717 1,354,911 2,630,043 7,122,157
%CHYA 5.9% 4.0% 4.2% 8.7% 6.1% 5.5% 8.1% 6.6% 7.6% 7.1%
2015:3 2015:4 2016:1 2016:2 FY 2016 2016:3 2016:4 2017:1 2017:2 FY 2017
WITHHOLDING 1,479,077 1,591,920 1,609,781 1,551,577 6,232,355 1,564,912 1,684,306 1,683,069 1,618,359 6,550,647
%CHYA 5.3% 5.3% 5.7% 5.8% 5.5% 5.8% 5.8% 4.6% 4.3% 5.1%
EST. PAYMENTS 301,073 291,087 312,992 458,957 1,364,109 316,091 305,606 328,316 474,854 1,424,867
%CHYA 9.5% 9.5% 9.2% 5.0% 7.9% 5.0% 5.0% 4.9% 3.5% 4.5%
FINAL PAYMENTS1
82,064 114,154 125,800 987,333 1,309,351 85,945 118,511 129,591 1,011,750 1,345,796
%CHYA 8.8% 8.3% 5.2% 4.0% 4.8% 4.7% 3.8% 3.0% 2.5% 2.8%
REFUNDS 100,978 197,517 584,248 474,810 1,357,553 111,665 219,724 596,549 500,439 1,428,378
%CHYA 3.6% 3.2% 1.8% 6.5% 3.7% 10.6% 11.2% 2.1% 5.4% 5.2%
OTHER -223,391 0 0 236,357 12,966 -236,357 0 0 246,549 10,193
TOTAL 1,537,845 1,799,643 1,464,324 2,759,414 7,561,227 1,618,926 1,888,699 1,544,427 2,851,074 7,903,126
%CHYA 6.4% 6.4% 8.1% 4.9% 6.2% 5.3% 4.9% 5.5% 3.3% 4.5%
2017:3 2017:4 2018:1 2018:2 FY 2018 2018:3 2018:4 2019:1 2019:2 FY 2019
WITHHOLDING 1,632,429 1,756,968 1,766,838 1,701,075 6,857,310 1,715,773 1,846,674 1,868,663 1,801,344 7,232,453
%CHYA 4.3% 4.3% 5.0% 5.1% 4.7% 5.1% 5.1% 5.8% 5.9% 5.5%
EST. PAYMENTS 327,039 316,192 339,721 492,098 1,475,050 338,915 327,674 352,021 509,079 1,527,689
%CHYA 3.5% 3.5% 3.5% 3.6% 3.5% 3.6% 3.6% 3.6% 3.5% 3.6%
FINAL PAYMENTS1
88,605 121,980 134,069 1,059,479 1,404,133 91,692 126,266 136,269 1,107,276 1,461,503
%CHYA 3.1% 2.9% 3.5% 4.7% 4.3% 3.5% 3.5% 1.6% 4.5% 4.1%
REFUNDS 114,841 224,704 608,294 540,829 1,488,669 117,572 229,692 645,059 573,572 1,565,895
%CHYA 2.8% 2.3% 2.0% 8.1% 4.2% 2.4% 2.2% 6.0% 6.1% 5.2%
OTHER (246,549) - - 259,140 12,590 (259,140) - - 274,403 15,263
TOTAL 1,686,683 1,970,436 1,632,333 2,970,962 8,260,415 1,769,669 2,070,921 1,711,894 3,118,529 8,671,013
%CHYA 4.2% 4.3% 5.7% 4.2% 4.5% 4.9% 5.1% 4.9% 5.0% 5.0%
2019:3 2019:4 2020:1 2020:2 FY 2020 2020:3 2020:4 2021:1 2021:2 FY 2021
WITHHOLDING 1,816,815 1,955,428 1,980,816 1,909,856 7,662,915 1,926,243 2,073,205 2,091,058 2,014,416 8,104,922
%CHYA 5.9% 5.9% 6.0% 6.0% 6.0% 6.0% 6.0% 5.6% 5.5% 5.8%
EST. PAYMENTS 353,610 341,981 367,483 537,307 1,600,381 370,985 358,780 385,538 563,591 1,678,894
%CHYA 4.3% 4.4% 4.4% 5.5% 4.8% 4.9% 4.9% 4.9% 4.9% 4.9%
FINAL PAYMENTS1
97,007 131,808 147,866 1,114,834 1,491,515 98,167 133,281 153,625 1,140,982 1,526,055
%CHYA 5.8% 4.4% 8.5% 0.7% 2.1% 1.2% 1.1% 3.9% 2.3% 2.3%
REFUNDS 124,176 243,166 686,458 610,494 1,664,294 131,807 258,455 720,532 640,797 1,751,590
%CHYA 5.6% 5.9% 6.4% 6.4% 6.3% 6.1% 6.3% 5.0% 5.0% 5.2%
OTHER -274,403 0 0 290,931 16,528 -290,931 0 0 306,867 15,937
TOTAL 1,868,853 2,186,050 1,809,707 3,242,434 9,107,044 1,972,658 2,306,811 1,909,690 3,385,060 9,574,218
%CHYA 5.6% 5.6% 5.7% 4.0% 5.0% 5.6% 5.5% 5.5% 4.4% 5.1%
2021:3 2021:4 2022:1 2022:2 FY 2022 2022:3 2022:4 2023:1 2023:2 FY 2023
WITHHOLDING 2,031,772 2,186,783 2,195,887 2,113,537 8,527,980 2,131,826 2,294,467 2,301,859 2,215,121 8,943,272
%CHYA 5.5% 5.5% 5.0% 4.9% 5.2% 4.9% 4.9% 4.8% 4.8% 4.9%
EST. PAYMENTS 386,087 373,282 401,314 587,138 1,747,821 404,370 390,958 420,278 613,969 1,829,575
%CHYA 4.1% 4.0% 4.1% 4.2% 4.1% 4.7% 4.7% 4.7% 4.6% 4.7%
FINAL PAYMENTS1
102,441 139,779 153,932 1,188,779 1,584,930 102,661 141,794 157,120 1,244,433 1,646,008
%CHYA 4.4% 4.9% 0.2% 4.2% 3.9% 0.2% 1.4% 2.1% 4.7% 3.9%
REFUNDS 138,518 271,418 746,006 660,257 1,816,199 148,813 292,114 791,381 700,543 1,932,851
%CHYA 5.1% 5.0% 3.5% 3.0% 3.7% 7.4% 7.6% 6.1% 6.1% 6.4%
OTHER -306,867 0 0 321,977 15,109 -321,977 0 0 337,454 15,477
TOTAL 2,074,915 2,428,426 2,005,127 3,551,174 10,059,641 2,168,068 2,535,105 2,087,875 3,710,433 10,501,481
%CHYA 5.2% 5.3% 5.0% 4.9% 5.1% 4.5% 4.4% 4.1% 4.5% 4.4%
Note: "Other" includes kicker and federal pension refunds, as well as July withholding accrued to June.
Tax law impacts are reflected in the collections numbers to produce more meaningful projections.
February 2014
OREGON PERSONAL INCOME TAX REVENUE FORECAST - QUARTERLY COLLECTIONS
Thousands of Dollars - Not Seasonally Adjusted

48
Table B.5 Oregon Corporate Income Tax Revenue Forecast
TABLE B.5
FY FY
2005:3 2005:4 2006:1 2006:2 2006 2006:3 2006:4 2007:1 2007:2 2007
ADVANCE PAYMENTS 119,391 183,280 59,091 163,812 525,573 129,737 236,441 59,754 162,465 588,396
%CHYA 29.6% 27.8% 46.0% 12.1% 24.5% 8.7% 29.0% 1.1% -0.8% 12.0%
FINAL PAYMENTS 14,985 17,619 24,327 39,526 96,457 19,718 17,154 25,440 65,628 127,941
%CHYA -9.6% 7.0% 20.9% -14.0% -2.7% 31.6% -2.6% 4.6% 66.0% 32.6%
REFUNDS 16,350 108,723 19,140 39,592 183,805 22,481 199,419 38,715 49,865 310,480
%CHYA -12.2% -16.6% 25.9% 17.4% -7.1% 37.5% 83.4% 102.3% 25.9% 68.9%
TOTAL 118,026 92,177 64,278 163,745 438,225 126,975 54,176 46,478 178,228 405,857
%CHYA 31.1% 212.4% 41.6% 3.4% 35.6% 7.6% -41.2% -27.7% 8.8% -7.4%
FY FY
2007:3 2007:4 2008:1 2008:2 2008 2008:3 2008:4 2009:1 2009:2 2009
ADVANCE PAYMENTS 133,408 205,375 64,256 155,284 558,323 100,589 145,285 63,802 97,368 407,044
%CHYA 2.8% -13.1% 7.5% -4.4% -5.1% -24.6% -29.3% -0.7% -37.3% -27.1%
FINAL PAYMENTS 23,631 45,064 35,076 52,143 155,912 23,501 26,721 22,314 21,822 94,357
%CHYA 19.8% 162.7% 37.9% -20.5% 21.9% -0.6% -40.7% -36.4% -58.1% -39.5%
REFUNDS 39,623 158,106 36,380 39,394 273,503 28,134 124,826 67,471 37,218 257,649
%CHYA 76.3% -20.7% -6.0% -21.0% -11.9% -29.0% -21.0% 85.5% -5.5% -5.8%
TOTAL 117,416 92,333 62,951 168,032 440,732 95,956 47,181 18,645 81,971 243,753
%CHYA -7.5% 70.4% 35.4% -5.7% 8.6% -18.3% -48.9% -70.4% -51.2% -44.7%
FY FY
2009:3 2009:4 2010:1 2010:2 2010 2010:3 2010:4 2011:1 2011:2 2011
ADVANCE PAYMENTS 79,579 163,877 66,451 147,313 457,220 115,286 175,561 76,405 165,354 532,606
%CHYA -20.9% 12.8% 4.2% 51.3% 12.3% 44.9% 7.1% 15.0% 12.2% 16.5%
FINAL PAYMENTS 20,404 24,009 38,412 45,714 128,539 21,781 21,206 35,770 40,805 119,562
%CHYA -13.2% -10.2% 72.1% 109.5% 36.2% 6.8% -11.7% -6.9% -10.7% -7.0%
REFUNDS 29,072 137,244 40,080 25,774 232,170 23,130 89,877 39,065 31,489 183,562
%CHYA 3.3% 9.9% -40.6% -30.7% -9.9% -20.4% -34.5% -2.5% 22.2% -20.9%
TOTAL 70,910 50,642 64,784 167,254 353,589 113,936 106,890 73,111 174,670 468,606
%CHYA -26.1% 7.3% 247.5% 104.0% 45.1% 60.7% 111.1% 12.9% 4.4% 32.5%
FY FY
2011:3 2011:4 2012:1 2012:2 2012 2012:3 2012:4 2013:1 2013:2 2013
ADVANCE PAYMENTS1
120,766 154,290 86,873 156,652 518,581 130,348 110,207 80,942 282,526 604,023
%CHYA 4.8% -12.1% 13.7% -5.3% -2.6% 7.9% -28.6% -6.8% 80.4% 16.5%
FINAL PAYMENTS1
19,117 26,841 32,512 33,322 111,792 16,387 21,377 36,660 34,009 108,433
%CHYA -12.2% 26.6% -9.1% -18.3% -6.5% -14.3% -20.4% 12.8% 2.1% -3.0%
REFUNDS 34,927 91,252 55,051 18,153 199,384 33,212 17,832 25,595 182,929 259,568
%CHYA 51.0% 1.5% 40.9% -42.4% 8.6% -4.9% -80.5% -53.5% 907.7% 30.2%
TOTAL1
104,955 89,878 64,335 171,820 430,989 113,524 113,751 92,007 133,606 452,888
%CHYA -7.9% -15.9% -12.0% -1.6% -8.0% 8.2% 26.6% 43.0% -22.2% 5.1%
OREGON CORPORATE INCOME TAX REVENUE FORECAST - QUARTERLY COLLECTIONS
Thousands of Dollars - Not Seasonally Adjusted February 2014 UPDATEDUpdated MMM 2/11/2013

49
TABLE B.5
FY FY
2013:3 2013:4 2014:1 2014:2 2014 2014:3 2014:4 2015:1 2015:2 2015
ADVANCE PAYMENTS1
123,591 187,195 100,172 218,435 629,394 164,122 239,511 96,481 201,082 701,196
%CHYA -5.2% 69.9% 23.8% -22.7% 4.2% 32.8% 27.9% -3.7% -7.9% 11.4%
FINAL PAYMENTS1
27,794 18,162 43,722 43,710 133,388 29,380 18,050 42,004 47,533 136,968
%CHYA 69.6% -15.0% 19.3% 28.5% 23.0% 5.7% -0.6% -3.9% 8.7% 2.7%
REFUNDS 20,123 118,303 62,271 99,378 300,074 40,625 143,922 53,939 56,525 295,011
%CHYA -39.4% 563.4% 143.3% -45.7% 15.6% 101.9% 21.7% -13.4% -43.1% -1.7%
TOTAL1
131,262 87,054 81,624 162,768 462,708 152,877 113,639 84,546 192,091 543,153
%CHYA 15.6% -23.5% -11.3% 21.8% 2.2% 16.5% 30.5% 3.6% 18.0% 17.4%
FY FY
2015:3 2015:4 2016:1 2016:2 2016 2016:3 2016:4 2017:1 2017:2 2017
ADVANCE PAYMENTS1
169,164 242,239 97,187 201,235 709,824 165,336 242,656 100,461 204,750 713,204
%CHYA 3.1% 1.1% 0.7% 0.1% 1.2% -2.3% 0.2% 3.4% 1.7% 0.5%
FINAL PAYMENTS1
29,541 19,857 45,507 48,671 143,576 28,918 17,515 43,484 46,907 136,825
%CHYA 0.5% 10.0% 8.3% 2.4% 4.8% -2.1% -11.8% -4.4% -3.6% -4.7%
REFUNDS 43,468 151,316 62,174 64,125 321,082 49,952 154,970 62,398 65,697 333,017
%CHYA 7.0% 5.1% 15.3% 13.4% 8.8% 14.9% 2.4% 0.4% 2.5% 3.7%
TOTAL1
155,236 110,780 80,519 185,781 532,317 144,302 105,201 81,547 185,961 517,011
%CHYA 1.5% -2.5% -4.8% -3.3% -2.0% -7.0% -5.0% 1.3% 0.1% -2.9%
FY FY
2017:3 2017:4 2018:1 2018:2 2018 2018:3 2018:4 2019:1 2019:2 2019
ADVANCE PAYMENTS1
168,129 244,055 102,282 209,456 723,922 167,802 244,832 102,221 209,497 724,353
%CHYA 1.7% 0.6% 1.8% 2.3% 1.5% -0.2% 0.3% -0.1% 0.0% 0.1%
FINAL PAYMENTS1
29,688 17,954 43,694 48,000 139,336 30,327 18,341 43,404 46,754 138,826
%CHYA 2.7% 2.5% 0.5% 2.3% 1.8% 2.2% 2.2% -0.7% -2.6% -0.4%
REFUNDS 54,664 157,769 63,649 68,515 344,598 57,956 161,507 66,514 68,940 354,917
%CHYA 9.4% 1.8% 2.0% 4.3% 3.5% 6.0% 2.4% 4.5% 0.6% 3.0%
TOTAL1
143,153 104,240 82,326 188,941 518,660 140,173 101,666 79,111 187,311 508,261
%CHYA -0.8% -0.9% 1.0% 1.6% 0.3% -2.1% -2.5% -3.9% -0.9% -2.0%
FY FY
2019:3 2019:4 2020:1 2020:2 2020 2020:3 2020:4 2021:1 2021:2 2021
ADVANCE PAYMENTS1
171,897 249,931 104,394 213,262 739,484 175,494 255,883 109,727 217,727 758,831
%CHYA 2.4% 2.1% 2.1% 1.8% 2.1% 2.1% 2.4% 5.1% 2.1% 2.6%
FINAL PAYMENTS1
29,658 18,333 43,951 48,652 140,594 30,900 19,779 45,603 49,929 146,212
%CHYA -2.2% 0.0% 1.3% 4.1% 1.3% 4.2% 7.9% 3.8% 2.6% 4.0%
REFUNDS 58,770 161,998 68,063 71,530 360,362 59,413 161,987 66,686 69,848 357,933
%CHYA 1.4% 0.3% 2.3% 3.8% 1.5% 1.1% 0.0% -2.0% -2.4% -0.7%
TOTAL1
142,784 106,266 80,282 190,384 519,717 146,981 113,676 88,644 197,809 547,110
%CHYA 1.9% 4.5% 1.5% 1.6% 2.3% 2.9% 7.0% 10.4% 3.9% 5.3%
FY FY
2021:3 2021:4 2022:1 2022:2 2022 2022:3 2022:4 2023:1 2023:2 2023
ADVANCE PAYMENTS1
180,832 262,703 113,133 223,975 780,643 181,939 262,346 113,206 221,796 779,286
%CHYA 3.0% 2.7% 3.1% 2.9% 2.9% 0.6% -0.1% 0.1% -1.0% -0.2%
FINAL PAYMENTS1
33,586 22,285 47,602 53,624 157,098 35,862 24,183 48,904 52,922 161,871
%CHYA 8.7% 12.7% 4.4% 7.4% 7.4% 6.8% 8.5% 2.7% -1.3% 3.0%
REFUNDS 60,137 160,650 66,115 72,058 358,960 61,559 163,654 67,927 72,020 365,160
%CHYA 1.2% -0.8% -0.9% 3.2% 0.3% 2.4% 1.9% 2.7% -0.1% 1.7%
TOTAL1
154,281 124,338 94,620 205,541 578,781 156,242 122,874 94,183 202,698 575,997
%CHYA 5.0% 9.4% 6.7% 3.9% 5.8% 1.3% -1.2% -0.5% -1.4% -0.5%
1 Includes adjustments for changes in tax law.
February 2014
OREGON CORPORATE INCOME TAX REVENUE FORECAST - QUARTERLY COLLECTIONS
Thousands of Dollars - Not Seasonally Adjusted

50
Table B.6 Cigarette and Tobacco Tax Distribution
TABLE B.6
Cigarette & Tobacco Tax Distribution (Millions of $)
Tobacco Use Mental Cities, Counties Tobacco Use
General Fund Health Plan Reduction Health State Total & Public Transit Total General Fund Health Plan Reduction State Total
Distribution Forecast*-
2013-14 36.207 138.564 5.611 7.498 187.879 10.963 198.843 29.816 23.004 2.559 55.379
2014-15 35.394 132.781 5.466 15.210 188.851 10.409 199.259 30.093 23.218 2.582 55.893
2013-15 Biennium 71.601 271.345 11.076 22.708 376.730 21.372 398.102 59.909 46.223 5.141 111.272 -
2015-16 32.731 124.924 5.069 17.093 179.817 9.872 189.689 30.936 23.868 2.655 57.458
2016-17 29.711 115.794 4.619 18.907 169.031 9.238 178.269 31.802 24.537 2.729 59.067
2015-17 Biennium 62.442 240.718 9.688 36.000 348.848 19.109 367.958 62.737 48.405 5.383 116.526 -
2017-18 27.882 108.662 4.334 18.317 159.195 8.669 167.863 32.692 25.224 2.805 60.721
2018-19 23.572 99.028 3.950 17.325 143.875 7.900 151.776 33.608 25.930 2.884 62.421
2017-19 Biennium 51.454 207.690 8.284 35.642 303.070 16.569 319.639 66.300 51.153 5.689 123.142 -
2019-20 23.572 91.867 3.664 16.072 135.176 7.329 142.505 34.549 26.656 2.965 64.169
2020-21 21.345 83.188 3.318 14.553 122.404 6.636 129.041 35.516 27.402 3.048 65.966
2019-21 Biennium 44.917 175.055 6.983 30.625 257.580 13.965 271.546 70.065 54.058 6.012 130.135 -
2021-22 19.482 75.927 3.029 13.283 111.721 6.057 117.778 36.510 28.169 3.133 67.813
2022-23 16.838 65.623 2.618 11.481 96.559 5.235 101.795 37.533 28.958 3.221 69.712
2021-23 Biennium 36.320 141.550 5.646 24.764 208.280 11.292 219.573 74.043 57.128 6.354 137.524
March 2014
Cigarette Tax Distribution* Other Tobacco Tax Distribution
* Prior to January 1, 2014 the cigarette tax per pack totaled $1.18 w ith the follow ing distribution. $0.8574 to the Health Plan, $0.22 to the state general fund, $0.0342 to Tobacco Use Reducation and $0.0684 to Cities, Counties and Public Transit. Follow ing the passage of
HB 3601 during the 2013 Special Session, the follow ing changes w ere made to cigarette tax es. Beginning January 1, 2014 tax es per pack w ere raised $0.13 to a total of $1.31 per pack. Beginning January 1, 2016 tax es w ill increase an additional $0.01 for a total of $1.32
per pack w ith a further $0.01 increase on January 1, 2018 for a total of $1.33 per pack. The distribution of the $0.13 increase beginning in 2014 is split $0.10 to Mental Health, $0.013 to the state general fund, $0.002 to Tobacco Use Reduction and $0.016 to the Health
Plan. Beginning January 1, 2016 the full tax increase of $0.14 per pack relativ e to pre-2014 tax rates, is dedicated to Mental Health. Similarly the full $0.15 post January 1, 2018 is likew ise dedicated to Mental Health.

51
Table B.7 Revenue Distribution to Local Governments
TABLE B.7
Liquor Apportionment and Revenue Distribution to Local Governments (Millions of $)
Total Liquor
Revenue General Mental Oregon Revenue Cigarette Tax
Available Fund (56%) Health 1
Wine Board Sharing Regular Total Counties Distribution 2
2011-12 194.104 110.200 8.300 0.283 23.966 34.237 58.203 17.118 11.795
2012-13 202.612 115.364 8.051 0.282 25.109 35.870 60.980 17.935 11.509
2011-13 Biennium 396.716 225.564 16.351 0.565 49.075 70.107 119.183 35.054 23.304
2013-14 218.937 124.551 8.822 0.316 27.124 38.749 65.873 19.374 10.963
2014-15 223.359 127.067 9.001 0.322 27.672 39.532 67.204 19.766 10.409
2013-15 Biennium 442.296 251.619 17.823 0.638 54.796 78.280 133.076 39.140 21.372
2015-16 213.681 114.500 9.271 0.332 28.502 40.717 69.220 20.359 9.872
2016-17 220.092 117.935 9.549 0.342 29.357 41.939 71.296 20.970 9.238
2015-17 Biennium 433.773 232.435 18.819 0.674 57.860 82.656 140.516 41.328 19.109
2017-18 226.694 121.473 9.835 0.352 30.238 43.197 73.435 21.599 8.669
2018-19 233.495 125.118 10.130 0.363 31.145 44.493 75.638 22.247 7.900
2017-19 Biennium 460.190 246.591 19.966 0.715 61.383 87.690 149.073 43.845 16.569
2019-20 240.500 128.871 10.434 0.374 32.080 45.828 77.907 22.914 7.329
2020-21 247.715 132.737 10.747 0.385 33.042 47.203 80.245 23.601 6.636
2019-21 Biennium 488.215 261.608 21.181 0.759 65.121 93.030 158.152 46.515 13.965
2021-22 255.147 136.719 11.070 0.396 34.033 48.619 82.652 24.309 6.057
2022-23 262.801 140.821 11.402 0.408 35.054 50.077 85.131 25.039 5.235
2021-23 Biennium 517.948 277.540 22.471 0.805 69.087 98.696 167.783 49.348 11.292
1 Mental Health Alcoholism and Drug Services Account, per ORS 471.810
2 For details on cigarette revenues see TABLE B.6 on previous page
March 2014
Liquor Apportionment Distribution
City Revenue

52
Table B.8 Track Record for the September 2013 Forecast
(Millions of dollars)
Actual
Revenues
Latest
Forecast
Percent
Difference
Prior
Year
Percent
Change
Withholding $1,435.6 $1,417.6 1.3% $1,364.5 5.2%
Dollar difference $18.0 $71.1
Estimated Payments $217.4 $172.9 25.7% $159.1 36.6%
Dollar difference $74.5 $58.3
Final Payments $109.4 $116.1 -5.8% $91.3 19.8%
Dollar difference -$6.7 $18.1
Refunds -$197.4 -$152.0 29.9% -$109.5 80.3%
Dollar difference -$45.4 -$87.9
Total Personal Income Tax $1,565.0 $1,554.6 0.7% $1,505.4 4.0%
Dollar difference $10.4 $59.6
(Millions of dollars)
Actual
Revenues
Latest
Forecast
Percent
Difference
Prior
Year
Percent
Change
Advanced Payments $187.2 $113.8 64.5% $110.2 69.9%
Dollar difference $73.4 $77.0
Final Payments $18.2 $26.4 -31.1% $21.4 -15.0%
Dollar difference -$8.2 -$3.2
Refunds -$118.3 -$43.0 175.1% -$17.8 564.6%
Dollar difference -$75.3 -$100.5
Total Corporate Income Tax $87.1 $97.2 -10.4% $113.8 -23.5%
Dollar difference -$10.1 -$26.7
(Millions of dollars)
Actual
Revenues
Latest
Forecast
Percent
Difference
Prior
Year
Percent
Change
Corporate and Personal Tax $1,652.1 $1,651.8 0.0% $1,619.2 2.0%
Dollar difference $0.3 $32.9
Corporate Income Tax Forecast Comparison
Table B.8 Track Record for the December 2013 Forecast(Quarter ending December 31, 2013)
Total Income Tax Forecast Comparison Year/Year Change
Forecast Comparison Year/Year Change
Year/Year Change
Personal Income Tax

53
Table B.9 Summary of Lottery Resources
TABLE B.9 Mar 2014 Forecast
Summary of Lottery Resources
2013-15 2015-17 2017-19 2019-21 2021-23
(in millions of dollars)
Current
Forecast
Change from
Dec-13
Change from
COS 2013
Current
Forecast
Change from
Dec-13
Current
Forecast
Change from
Dec-13
Current
Forecast
Change from
Dec-13
Current
Forecast
Change from
Dec-13
LOTTERY EARNINGS
Traditional Lottery1 124.588 0.108 1.927 118.384 0.234 116.986 0.180 116.520 0.179 117.653 0.178
Video Lottery 994.838 (5.451) (8.084) 1,079.125 (9.147) 1,182.246 (11.351) 1,300.504 (12.546) 1,432.850 (13.583)
Administrative Actions (0.065) 0.000 (0.065) 0.000 0.000 0.000 0.000 0.000 0.000 0.000 0.000
Video Lottery Terminal Replacement (71.200) 0.000 (0.200) (59.200) 0.000 0.000 0.000 0.000 0.000 0.000 0.000
Total Available to Transfer 1,048.162 (5.342) (6.421) 1,138.309 (8.913) 1,299.231 (11.172) 1,417.024 (12.367) 1,550.503 (13.405)
ECONOMIC DEVELOPMENT FUND
Beginning Balance 3.491 0.000 0.000 0.000 0.000 0.000 0.000 0.000 0.000 0.000 0.000
Transfers from Lottery 1,048.162 (5.342) (6.421) 1,138.309 (8.913) 1,299.231 (11.172) 1,417.024 (12.367) 1,550.503 (15.603)
Other Resources2 1.400 0.000 0.000 2.000 0.000 2.000 0.000 2.000 0.000 2.000 0.000
Total Available Resources 1,053.053 (5.342) (6.421) 1,140.309 (8.913) 1,301.231 (11.172) 1,419.024 (12.367) 1,552.503 (15.603)
ALLOCATION OF RESOURCES
County Economic Development 33.849 0.000 0.000 41.396 (0.351) 45.353 (0.436) 50.659 (0.481) 58.964 (0.521)
Education Stability Fund 3 188.669 (0.962) (1.156) 204.896 (1.604) 233.862 (2.011) 255.064 (2.227) 279.090 (2.413)
Parks and Natural Resources Fund4 157.224 (0.802) (0.963) 170.746 (1.337) 194.885 (1.676) 212.554 (1.855) 232.575 (2.011)
OUS Sports Lottery Account 5 8.000 0.000 0.000 11.383 (0.089) 12.992 (0.112) 14.170 (0.124) 15.505 (0.134)
Gambling Addiction 5 10.546 0.000 0.000 11.383 (0.089) 12.992 (0.112) 14.170 (0.124) 15.505 (0.134)
County Fairs 3.669 0.000 0.000 3.648 0.000 3.648 0.000 3.648 0.000 3.648 0.000
Other Legislatively Adopted Allocations6 640.397 0.000 0.000 269.600 0.000 258.600 0.000 258.600 0.000 258.600 0.000
Total Distributions 1,042.355 (1.764) (2.119) 713.052 (3.470) 762.332 (4.347) 808.865 (4.811) 863.887 (5.21)
Ending Balance/Discretionary Resources 10.698 (3.579) (4.302) 427.257 (5.443) 538.900 (6.824) 610.159 (7.556) 688.615 (10.391)
Note: Some totals may not foot due to rounding.
1. Includes planned raffles throughout the forecast period.
2. Includes interest earnings on Economic Dev elopment Fund and rev ersions.
3. Eighteen percent of proceeds accrue to the Ed. Stability Fund, until the balance equals 5% of GF Rev enues. Thereafter, 15% of proceeds accrue to the Oregon Capital Matching Account.
4. The Parks and Natural Resources Fund Constitutional amendment requires 15% of net proceeds be transferred to this fund.
5. One percent of net lottery proceeds are dedicated to Collegiate Athletics and Gambling Addiction programs, respectiv ely . Certain limits are imposed by HB 5035 for 2011-13.
6. Includes Debt Serv ice Allocations, Allocations to State School Fund and Other Agency Allocations

54
Table B.10 Budgetary Reserve Summary and Outlook
Rainy Day Fund(Millions) 2011-13 2013-15 2015-17 2017-19 2019-21 2021-23
Beginning Balance $10.4 $61.9 $210.2 $396.3 $653.2 $950.3
Interest Earnings $0.6 $1.7 $18.7 $45.5 $68.7 $95.6
Deposits1
$50.8 $146.7 $167.4 $211.4 $228.5 $249.3
Ending Balance2
$61.9 $210.2 $396.3 $653.2 $950.3 $1,295.3
Education Stability Fund3
(Millions) 2011-13 2013-15 2015-17 2017-19 2019-21 2021-23
Beginning Balance $5.1 $7.4 $176.9 $361.3 $559.3 $772.1
Interest Earnings4
$0.6 $1.0 $15.1 $38.6 $56.1 $73.5
Deposits5
$184.8 $169.5 $184.3 $198.0 $212.8 $136.8
Distributions -$182.9 -$1.0 -$15.1 -$38.6 -$56.1 -$73.5
Oregon Education Fund -$0.5 -$0.8 -$11.3 -$29.0 -$42.0 -$55.1
Oregon Student Access Comm. -$0.2 -$0.3 -$3.8 -$9.7 -$14.0 -$18.4
Withdrawals -$182.2 $0.0 $0.0 $0.0 $0.0 $0.0
Ending Balance $7.6 $176.9 $361.3 $559.3 $772.1 $908.9
Total Reserves(Millions) 2011-13 2013-15 2015-17 2017-19 2019-21 2019-21
Ending Balances $69.4 $387.2 $757.6 $1,212.5 $1,722.4 $2,204.1
Percent of GF Revenues 0.5% 2.5% 4.4% 6.4% 8.3% 9.6%
Table B.10: Budgetary Reserve Summary
Footnotes:
1. Includes transfer of ending General Fund balances, up to 1% of budgeted appropriations, as w ell as priv ate donations. Assumes future appropriations
equal to 98.75 percent of av ailable resources. Starting w ith 2013-15, projected corporate income tax es abov e the rate of 6.6% for the biennium are deposited
on or before June 30 of each odd-numbered y ear.
2. Av ailable funds in a giv en biennium equal 2/3rds of the beginning balance under current law .
3. Ex cludes funds in the Oregon Grow th and the Oregon Resource and Technology Dev elopment subaccounts.
4. Interest earnings are distributed to the Oregon Education Funds (75%) and the State Scholarship Fund (25%).
5. Contributions to the ESF are capped at 5% of the prior biennium's General Fund rev enue total. Quarterly contributions are made until the balance
ex ceeds the cap.
March 2014

55
APPENDIX C: POPULATION FORECASTS BY AGE AND SEX
Table C.1 Population Forecasts Component of Change 1980-2020 …………………………………... 56
Table C.2 Population Forecasts by Age and Sex: 2000-2020 ………………………………………….. 57
Table C.3 Population of Oregon: 1980-2020 ……………………………………………………………... 58
Table C.4 Children: Ages 0-4 ………………………………………………………………………………. 58
Table C.5 School Age Population: Ages 5-17 ……………………………………………………………. 58
Table C.6 Young Adult Population: Ages 18-24 ………………………………………………………….. 58
Table C.7 Criminally At Risk Population: Males Ages 15-39 ……………………………………………. 59
Table C.8 Prime Wage Earners: Ages 25-44 …………………………………………………………….. 59
Table C.9 Older Wage Earners: Ages 45-64 …………………………………………………………….. 59
Table C.10 Elderly Population by Age Group ……………………………………………………………… 59

56
Table C.1 Population Forecasts Component of Change 1980-2020
STATE OF OREGON
POPULATION FORECASTS
COMPONENTS OF CHANGE 1980 -2020
Year Population Change Births Deaths Natural Net Migration
(July 1) Population Number Percent Number Rate/1000 Number Rate/1000 Increase Number Rate/1000------ ----------- ----------- -------- ----------- -------- ----------- -------- ----------- ----------- --------
1980 2,641,200 --- --- --- --- --- --- --- --- ---
1981 2,668,000 26,800 1.01 43,196 16.27 21,870 8.24 21,326 5,474 2.06
1982 2,664,900 -3,100 -0.12 42,261 15.85 21,548 8.08 20,713 -23,813 -8.93
1983 2,653,100 -11,800 -0.44 40,378 15.19 22,039 8.29 18,339 -30,139 -11.33
1984 2,666,600 13,500 0.51 39,611 14.89 22,702 8.54 16,909 -3,409 -1.28
1985 2,672,600 6,000 0.23 39,296 14.72 23,531 8.81 15,765 -9,765 -3.66
1980-1985 31,400 204,742 111,690 93,052 -61,652
1986 2,683,500 10,900 0.41 39,332 14.69 23,403 8.74 15,929 -5,029 -1.88
1987 2,701,000 17,500 0.65 38,702 14.38 23,695 8.80 15,007 2,493 0.93
1988 2,741,300 40,300 1.49 39,120 14.38 24,752 9.10 14,368 25,932 9.53
1989 2,790,600 49,300 1.80 40,648 14.70 24,705 8.93 15,943 33,357 12.06
1990 2,860,400 69,800 2.50 42,008 14.87 24,763 8.76 17,245 52,555 18.60
1985-1990 187,800 199,810 121,318 78,492 109,308
1991 2,928,500 68,100 2.38 42,682 14.75 24,944 8.62 17,738 50,362 17.40
1992 2,991,800 63,300 2.16 42,427 14.33 25,166 8.50 17,261 46,039 15.55
1993 3,060,400 68,600 2.29 41,442 13.69 26,543 8.77 14,899 53,701 17.75
1994 3,121,300 60,900 1.99 41,487 13.42 27,564 8.92 13,923 46,977 15.20
1995 3,184,400 63,100 2.02 42,426 13.46 27,552 8.74 14,874 48,226 15.30
1990-1995 324,000 210,464 131,769 78,695 245,305
1996 3,247,100 62,700 1.97 43,196 13.43 28,768 8.95 14,428 48,272 15.01
1997 3,304,300 57,200 1.76 43,625 13.32 29,201 8.91 14,424 42,776 13.06
1998 3,352,400 48,100 1.46 44,696 13.43 28,705 8.62 15,991 32,109 9.65
1999 3,393,900 41,500 1.24 45,188 13.40 29,848 8.85 15,340 26,160 7.76
2000 3,431,100 37,200 1.10 45,534 13.34 28,909 8.47 16,625 20,575 6.03
1995-2000 246,700 222,239 145,431 76,808 169,892
2001 3,470,400 39,300 1.15 45,536 13.20 29,934 8.67 15,602 23,698 6.87
2002 3,502,600 32,200 0.93 44,995 12.91 30,828 8.84 14,167 18,033 5.17
2003 3,538,600 36,000 1.03 45,686 12.98 30,604 8.69 15,082 20,918 5.94
2004 3,578,900 40,300 1.14 45,599 12.81 30,721 8.63 14,878 25,422 7.14
2005 3,626,900 48,000 1.34 45,892 12.74 30,717 8.53 15,175 32,825 9.11
2000-2005 195,800 227,708 152,804 74,904 120,896
2006 3,685,200 58,300 1.61 46,946 12.84 30,771 8.42 16,175 42,125 11.52
2007 3,739,400 54,200 1.47 49,404 13.31 31,396 8.46 18,008 36,192 9.75
2008 3,784,200 44,800 1.20 49,659 13.20 32,008 8.51 17,651 27,149 7.22
2009 3,815,800 31,600 0.84 47,960 12.62 31,382 8.26 16,578 15,022 3.95
2010 3,837,300 21,500 0.56 46,256 12.09 31,689 8.28 14,567 6,933 1.81
2005-2010 210,400 240,225 157,246 82,979 127,421
2011 3,857,625 20,325 0.53 45,381 11.80 32,437 8.43 12,944 7,381 1.92
2012 3,883,735 26,110 0.68 44,897 11.60 32,205 8.32 12,692 13,418 3.47
2013 3,919,020 35,285 0.91 45,271 11.60 32,469 8.32 12,803 22,482 5.76
2014 3,960,800 41,780 1.07 45,796 11.62 32,759 8.31 13,037 28,743 7.30
2015 4,004,600 43,801 1.11 46,383 11.65 33,107 8.31 13,277 30,524 7.66
2010-2015 167,300 227,729 162,976 64,753 102,548
2016 4,050,700 46,100 1.15 46,979 11.66 33,544 8.33 13,435 32,665 8.11
2017 4,099,000 48,300 1.19 47,618 11.69 34,040 8.35 13,577 34,722 8.52
2018 4,149,500 50,500 1.23 48,245 11.70 34,563 8.38 13,681 36,818 8.93
2019 4,201,100 51,600 1.24 48,898 11.71 35,116 8.41 13,782 37,818 9.06
2020 4,253,400 52,300 1.24 49,539 11.72 35,759 8.46 13,780 38,520 9.11
2015-2020 248,799 241,278 173,022 68,256 180,543
1980-1990 219,200 404,552 233,008 171,544 47,656
1990-2000 570,700 432,703 277,200 155,503 415,197 41,520
2000-2010 406,200 467,933 310,050 157,883 248,317 24,832
2010-2020 416,099 469,007 335,999 133,009 283,091 28,309
Sources: 1980-1999 population - U.S. Census Bureau; 2000-2010 population - intercensal estimates by Office of Economic Analysis;
population estimates 2011-2013 by Population Research Center, PSU; births and deaths 1980-12: Oregon Center for Health Statistics.
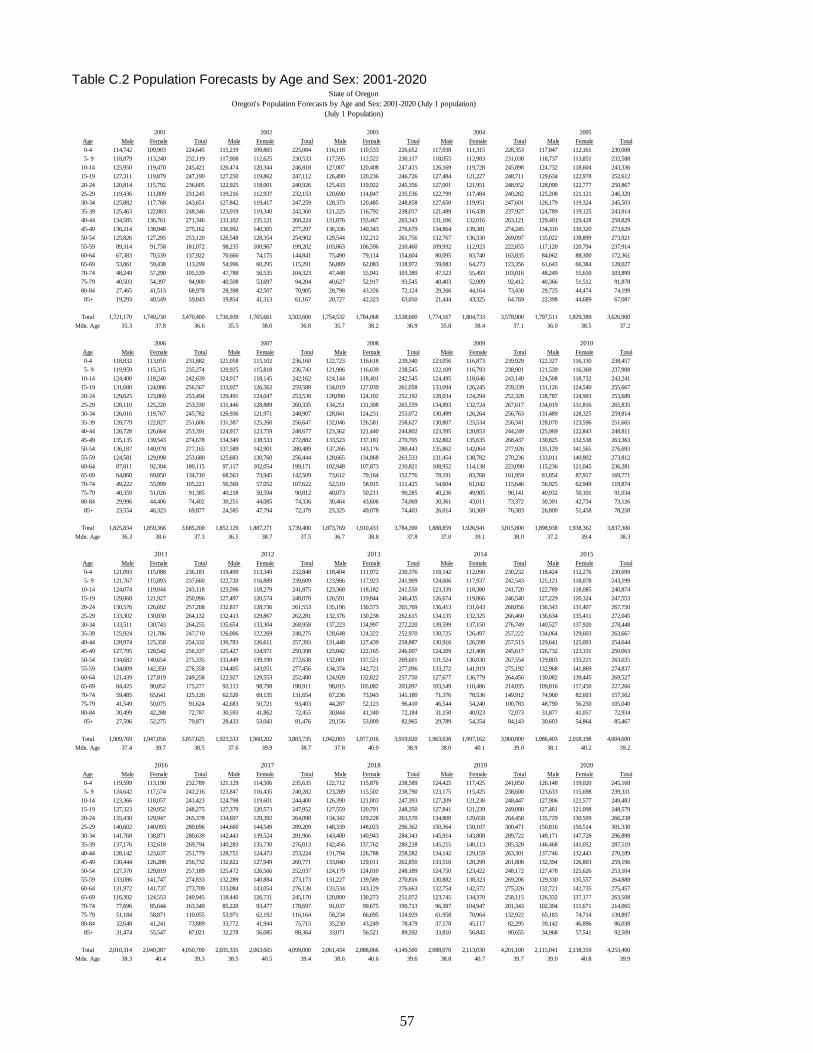
57
Table C.2 Population Forecasts by Age and Sex: 2001-2020
2001 2002 2003 2004 2005
Age Male Female Total Male Female Total Male Female Total Male Female Total Male Female Total
0-4 114,742 109,903 224,645 115,219 109,865 225,084 116,118 110,533 226,652 117,038 111,315 228,353 117,847 112,161 230,008
5- 9 118,879 113,240 232,119 117,908 112,625 230,533 117,595 112,522 230,117 118,055 112,983 231,038 118,737 113,851 232,588
10-14 125,950 119,470 245,421 126,474 120,344 246,818 127,007 120,408 247,415 126,169 119,728 245,898 124,732 118,604 243,336
15-19 127,311 119,879 247,190 127,250 119,862 247,112 126,490 120,236 246,726 127,484 121,227 248,711 129,634 122,978 252,612
20-24 120,814 115,792 236,605 122,925 118,001 240,926 125,433 119,922 245,356 127,001 121,951 248,952 128,090 122,777 250,867
25-29 119,436 111,809 231,245 119,216 112,937 232,153 120,690 114,847 235,536 122,799 117,484 240,282 125,208 121,121 246,329
30-34 125,882 117,768 243,651 127,842 119,417 247,259 128,373 120,485 248,858 127,650 119,951 247,601 126,179 119,324 245,503
35-39 125,463 122,883 248,346 123,019 119,340 242,360 121,225 116,792 238,017 121,489 116,438 237,927 124,789 119,125 243,914
40-44 134,585 136,761 271,346 133,102 135,121 268,224 131,876 133,467 265,343 131,106 132,016 263,121 129,401 129,428 258,829
45-49 136,214 138,948 275,162 136,992 140,305 277,297 136,336 140,343 276,679 134,864 139,381 274,245 134,310 139,320 273,629
50-54 125,826 127,295 253,120 126,548 128,354 254,902 129,544 132,212 261,756 132,767 136,330 269,097 135,022 138,899 273,921
55-59 89,314 91,758 181,072 98,235 100,967 199,202 103,863 106,596 210,460 109,932 112,923 222,855 117,120 120,794 237,914
60-64 67,383 70,539 137,922 70,666 74,175 144,841 75,490 79,114 154,604 80,095 83,740 163,835 84,062 88,300 172,361
65-69 53,861 59,438 113,299 54,996 60,295 115,291 56,889 62,083 118,972 59,083 64,273 123,356 61,643 66,384 128,027
70-74 48,249 57,290 105,539 47,788 56,535 104,323 47,448 55,941 103,389 47,523 55,493 103,016 48,249 55,650 103,899
75-79 40,503 54,397 94,900 40,508 53,697 94,204 40,627 52,917 93,545 40,403 52,009 92,412 40,366 51,512 91,878
80-84 27,465 41,513 68,978 28,398 42,507 70,905 28,798 43,326 72,124 29,266 44,164 73,430 29,725 44,474 74,199
85+ 19,293 40,549 59,843 19,854 41,313 61,167 20,727 42,323 63,050 21,444 43,325 64,769 22,398 44,689 67,087
Total 1,721,170 1,749,230 3,470,400 1,736,939 1,765,661 3,502,600 1,754,532 1,784,068 3,538,600 1,774,167 1,804,733 3,578,900 1,797,511 1,829,389 3,626,900
Mdn. Age 35.3 37.8 36.6 35.5 38.0 36.8 35.7 38.2 36.9 35.8 38.4 37.1 36.0 38.5 37.2
2006 2007 2008 2009 2010
Age Male Female Total Male Female Total Male Female Total Male Female Total Male Female Total
0-4 118,832 113,050 231,882 121,058 115,102 236,160 122,723 116,618 239,340 123,056 116,873 239,929 122,327 116,130 238,457
5- 9 119,959 115,315 235,274 120,925 115,818 236,743 121,906 116,639 238,545 122,109 116,793 238,901 121,539 116,369 237,908
10-14 124,400 118,240 242,639 124,017 118,145 242,162 124,144 118,401 242,545 124,495 118,646 243,140 124,508 118,732 243,241
15-19 131,680 124,886 256,567 133,027 126,562 259,588 134,019 127,039 261,058 133,094 126,245 259,339 131,126 124,540 255,667
20-24 129,625 123,869 253,494 129,491 124,047 253,538 128,090 124,102 252,192 128,034 124,294 252,328 128,787 124,903 253,689
25-29 128,110 125,220 253,330 131,446 128,889 260,335 134,251 131,308 265,559 134,893 132,724 267,617 134,019 131,816 265,835
30-34 126,016 119,767 245,782 126,936 121,971 248,907 128,841 124,231 253,072 130,499 126,264 256,763 131,489 128,325 259,814
35-39 128,779 122,827 251,606 131,387 125,260 256,647 132,046 126,581 258,627 130,807 125,534 256,341 128,070 123,596 251,665
40-44 126,728 126,664 253,391 124,917 123,759 248,677 123,362 121,440 244,802 123,395 120,853 244,249 125,969 122,843 248,811
45-49 135,135 139,543 274,678 134,349 138,533 272,882 133,523 137,181 270,705 132,802 135,635 268,437 130,825 132,538 263,363
50-54 136,187 140,978 277,165 137,589 142,901 280,489 137,266 143,176 280,443 135,862 142,064 277,926 135,129 141,565 276,693
55-59 124,581 129,098 253,680 125,683 130,760 256,444 128,665 134,868 263,533 131,454 138,782 270,236 133,011 140,802 273,812
60-64 87,811 92,304 180,115 97,117 102,054 199,171 102,948 107,873 210,821 108,952 114,138 223,090 115,236 121,045 236,281
65-69 64,860 69,850 134,710 68,563 73,945 142,509 73,612 79,164 152,776 78,191 83,768 161,959 81,854 87,917 169,771
70-74 49,222 55,999 105,221 50,569 57,052 107,622 52,510 58,915 111,425 54,604 61,042 115,646 56,925 62,949 119,874
75-79 40,359 51,026 91,385 40,218 50,594 90,812 40,073 50,211 90,285 40,236 49,905 90,141 40,932 50,101 91,034
80-84 29,996 44,406 74,402 30,251 44,085 74,336 30,464 43,606 74,069 30,361 43,011 73,372 30,391 42,734 73,126
85+ 23,554 46,323 69,877 24,585 47,794 72,379 25,325 49,078 74,403 26,014 50,369 76,383 26,800 51,458 78,258
Total 1,825,834 1,859,366 3,685,200 1,852,129 1,887,271 3,739,400 1,873,769 1,910,431 3,784,200 1,888,859 1,926,941 3,815,800 1,898,938 1,938,362 3,837,300
Mdn. Age 36.3 38.6 37.3 36.5 38.7 37.5 36.7 38.8 37.8 37.0 39.1 38.0 37.2 39.4 38.3
2011 2012 2013 2014 2015
Age Male Female Total Male Female Total Male Female Total Male Female Total Male Female Total
0-4 121,093 115,088 236,181 119,499 113,349 232,848 118,404 111,972 230,376 118,142 112,090 230,232 118,424 112,276 230,699
5- 9 121,767 115,893 237,660 122,720 116,889 239,609 123,986 117,923 241,909 124,606 117,937 242,543 125,121 118,078 243,199
10-14 124,074 119,044 243,118 123,596 118,279 241,875 123,368 118,182 241,550 123,339 118,380 241,720 122,789 118,085 240,874
15-19 129,068 121,927 250,996 127,497 120,574 248,070 126,591 119,844 246,435 126,674 119,866 246,540 127,229 120,324 247,553
20-24 130,576 126,692 257,268 132,817 128,736 261,553 135,196 130,573 265,769 136,413 131,643 268,056 136,343 131,407 267,750
25-29 133,302 130,830 264,132 132,413 129,867 262,281 132,376 130,238 262,615 134,135 132,325 266,460 136,634 135,411 272,045
30-34 133,511 130,743 264,255 135,654 133,304 268,958 137,223 134,997 272,220 139,599 137,150 276,749 140,527 137,920 278,448
35-39 125,924 121,786 247,710 126,006 122,269 248,275 128,648 124,322 252,970 130,725 126,497 257,222 134,064 129,603 263,667
40-44 128,974 125,358 254,332 130,783 126,611 257,393 131,448 127,439 258,887 130,916 126,598 257,513 129,641 125,003 254,644
45-49 127,795 128,542 256,337 125,427 124,971 250,398 123,842 122,165 246,007 124,209 121,408 245,617 126,732 123,331 250,063
50-54 134,682 140,654 275,335 133,449 139,190 272,638 132,081 137,521 269,601 131,524 136,030 267,554 129,803 133,221 263,025
55-59 134,009 142,350 276,358 134,405 143,051 277,456 134,374 142,721 277,096 133,272 141,919 275,192 132,968 141,869 274,837
60-64 121,439 127,819 249,258 122,927 129,553 252,480 124,928 132,822 257,750 127,677 136,779 264,456 130,082 139,445 269,527
65-69 84,425 90,852 175,277 92,113 98,798 190,911 98,015 105,082 203,097 103,549 110,486 214,035 109,816 117,450 227,266
70-74 59,485 65,641 125,126 62,520 69,135 131,654 67,236 73,943 141,180 71,376 78,536 149,912 74,960 82,603 157,562
75-79 41,549 50,075 91,624 42,683 50,721 93,403 44,287 52,123 96,410 46,544 54,240 100,783 48,790 56,250 105,040
80-84 30,499 42,288 72,787 30,593 41,862 72,455 30,844 41,340 72,184 31,150 40,923 72,073 31,877 41,057 72,934
85+ 27,596 52,275 79,871 28,433 53,043 81,476 29,156 53,809 82,965 29,789 54,354 84,143 30,603 54,864 85,467
Total 1,909,769 1,947,856 3,857,625 1,923,533 1,960,202 3,883,735 1,942,003 1,977,016 3,919,020 1,963,638 1,997,162 3,960,800 1,986,403 2,018,198 4,004,600
Mdn. Age 37.4 39.7 38.5 37.6 39.9 38.7 37.8 40.0 38.9 38.0 40.1 39.0 38.1 40.2 39.2
2016 2017 2018 2019 2020
Age Male Female Total Male Female Total Male Female Total Male Female Total Male Female Total
0-4 119,599 113,190 232,789 121,129 114,506 235,635 122,712 115,876 238,589 124,425 117,425 241,850 126,148 119,020 245,168
5- 9 124,642 117,574 242,216 123,847 116,435 240,282 123,289 115,502 238,790 123,175 115,425 238,600 123,633 115,698 239,331
10-14 123,366 118,057 241,423 124,798 119,601 244,400 126,390 121,003 247,393 127,209 121,238 248,447 127,906 121,577 249,483
15-19 127,323 120,952 248,275 127,379 120,573 247,952 127,559 120,791 248,350 127,841 121,239 249,080 127,481 121,098 248,579
20-24 135,430 129,947 265,378 134,697 129,392 264,090 134,342 129,228 263,570 134,800 129,658 264,458 135,729 130,509 266,238
25-29 140,602 140,093 280,696 144,660 144,549 289,209 148,339 148,023 296,362 150,364 150,107 300,471 150,816 150,514 301,330
30-34 141,768 138,871 280,639 142,443 139,524 281,966 143,400 140,943 284,343 145,914 143,808 289,722 149,171 147,728 296,898
35-39 137,176 132,618 269,794 140,283 135,730 276,013 142,456 137,762 280,218 145,215 140,113 285,328 146,468 141,052 287,519
40-44 128,142 123,637 251,779 128,751 124,473 253,224 131,794 126,788 258,582 134,142 129,159 263,301 137,746 132,443 270,189
45-49 130,444 126,288 256,732 132,822 127,949 260,771 133,840 129,011 262,850 133,510 128,299 261,808 132,394 126,803 259,196
50-54 127,370 129,819 257,189 125,472 126,566 252,037 124,179 124,010 248,189 124,750 123,422 248,172 127,478 125,626 253,104
55-59 133,086 141,747 274,833 132,289 140,884 273,173 131,227 139,589 270,816 130,882 138,323 269,206 129,330 135,557 264,888
60-64 131,972 141,737 273,709 133,084 143,054 276,138 133,534 143,129 276,663 132,754 142,572 275,326 132,721 142,735 275,457
65-69 116,392 124,553 240,945 118,440 126,731 245,170 120,800 130,273 251,072 123,745 134,370 258,115 126,332 137,177 263,508
70-74 77,696 85,644 163,340 85,220 93,477 178,697 91,037 99,675 190,713 96,397 104,947 201,343 102,394 111,671 214,065
75-79 51,184 58,871 110,055 53,971 62,192 116,164 58,234 66,695 124,929 61,958 70,964 132,922 65,183 74,714 139,897
80-84 32,648 41,241 73,889 33,772 41,944 75,715 35,230 43,249 78,479 37,178 45,117 82,295 39,142 46,896 86,038
85+ 31,474 55,547 87,021 32,278 56,085 88,364 33,071 56,521 89,592 33,810 56,845 90,655 34,968 57,541 92,509
Total 2,010,314 2,040,387 4,050,700 2,035,335 2,063,665 4,099,000 2,061,434 2,088,066 4,149,500 2,088,070 2,113,030 4,201,100 2,115,041 2,138,359 4,253,400
Mdn. Age 38.3 40.4 39.3 38.5 40.5 39.4 38.6 40.6 39.6 38.8 40.7 39.7 39.0 40.8 39.9
Oregon's Population Forecasts by Age and Sex: 2001-2020 (July 1 population)
(July 1 Population)
State of Oregon

58
Table C.3 Population of Oregon: 1990-2020
Table C.4 Children: Ages 0-4 Table C.5 School Age Population:
Ages 5-17
Table C.6 Young Adult
Population: Ages 18-24
Year Total
(July 1) Population Number Percent
--------- ---------------- ---------------- ----------------
1990 2,860,400 - -
1991 2,928,500 68,100 2.38%
1992 2,991,800 63,300 2.16%
1993 3,060,400 68,600 2.29%
1994 3,121,300 60,900 1.99%
1995 3,184,400 63,100 2.02%
1996 3,247,100 62,700 1.97%
1997 3,304,300 57,200 1.76%
1998 3,352,400 48,100 1.46%
1999 3,393,900 41,500 1.24%
2000 3,431,100 37,200 1.10%
2001 3,470,400 39,300 1.15%
2002 3,502,600 32,200 0.93%
2003 3,538,600 36,000 1.03%
2004 3,578,900 40,300 1.14%
2005 3,626,900 48,000 1.34%
2006 3,685,200 58,300 1.61%
2007 3,739,400 54,200 1.47%
2008 3,784,200 44,800 1.20%
2009 3,815,800 31,600 0.84%
2010 3,837,300 21,500 0.56%
2011 3,857,625 20,325 0.53%
2012 3,883,735 26,110 0.68%
2013 3,919,020 35,285 0.91%
2014 3,960,800 41,780 1.07%
2015 4,004,600 43,801 1.11%
2016 4,050,700 46,100 1.15%
2017 4,099,000 48,300 1.19%
2018 4,149,500 50,500 1.23%
2019 4,201,100 51,600 1.24%
2020 4,253,400 52,300 1.24%
Change from previous year
-2.0
-1.0
0.0
1.0
2.0
3.0
4.0
1,000,000
1,500,000
2,000,000
2,500,000
3,000,000
3,500,000
4,000,000
4,500,000
1950 1955 1960 1965 1970 1975 1980 1985 1990 1995 2000 2005 2010 2015 2020
Per
cent
Chan
ge
Po
pu
lati
on
Year
Oregon's Population and Annual Percent Change, 1950-2020
Forecast
Annual Percent Change
Total Population
Year
(July 1) Population Number Percent Population Number Percent Population Number Percent
--------- ---------------- ---------------- ---------------- ---------------- ---------------- ---------------- ---------------- ---------------- ----------------
1980 199,525 --- --- 524,446 --- --- 329,407 --- ---
1990 209,638 10,113 5.07% 532,727 8,281 1.58% 268,134 -61,273 -18.60%
2000 223,207 13,569 6.47% 624,316 91,589 17.19% 330,328 62,194 23.20%
2001 224,645 1,438 0.64% 624,675 358 0.06% 336,660 6,333 1.92%
2002 225,084 439 0.20% 624,611 -64 -0.01% 340,778 4,118 1.22%
2003 226,652 1,568 0.70% 624,349 -262 -0.04% 345,266 4,487 1.32%
2004 228,353 1,701 0.75% 625,461 1,112 0.18% 349,138 3,873 1.12%
2005 230,008 1,655 0.72% 628,326 2,865 0.46% 351,076 1,938 0.55%
2006 231,882 1,874 0.81% 633,646 5,320 0.85% 354,328 3,252 0.93%
2007 236,160 4,278 1.85% 635,720 2,074 0.33% 356,311 1,983 0.56%
2008 239,340 3,180 1.35% 635,372 -348 -0.05% 358,967 2,656 0.75%
2009 239,929 589 0.25% 633,575 -1,797 -0.28% 360,134 1,166 0.32%
2010 238,457 -1,472 -0.61% 630,741 -2,835 -0.45% 359,764 -370 -0.10%
2011 236,181 -2,277 -0.95% 628,366 -2,375 -0.38% 360,676 912 0.25%
2012 232,848 -3,332 -1.41% 628,632 267 0.04% 362,474 1,798 0.50%
2013 230,376 -2,472 -1.06% 630,011 1,378 0.22% 365,652 3,178 0.88%
2014 230,232 -144 -0.06% 631,248 1,237 0.20% 367,610 1,958 0.54%
2015 230,699 467 0.20% 631,871 623 0.10% 367,505 -105 -0.03%
2016 232,789 2,089 0.91% 632,154 283 0.04% 365,138 -2,367 -0.64%
2017 235,635 2,846 1.22% 632,781 628 0.10% 363,942 -1,196 -0.33%
2018 238,589 2,954 1.25% 633,080 299 0.05% 365,023 1,081 0.30%
2019 241,850 3,262 1.37% 634,206 1,125 0.18% 366,378 1,355 0.37%
2020 245,168 3,318 1.37% 636,883 2,678 0.42% 366,749 370 0.10%
% Change from previous decade/yr.% Change from previous decade/yr.% Change from previous decade/yr.

59
Table C.7 Criminally At Risk Population
(males): Ages 15-39
Table C.8 Prime Wage Earners:
Ages 25-44
Table C.9 Older Wage Earners:
Ages 45-64
Table C.10 Elderly Population by Age Group
Year
(July 1) Population Number Percent Population Number Percent Population Number Percent
--------- ---------------- ---------------- ---------------- ---------------- ---------------- ---------------- ---------------- ---------------- ----------------
1980 561,931 --- --- 790,750 --- --- 491,249 --- ---
1990 544,738 -17,193 -3.06% 926,326 135,576 17.15% 531,181 39,932 8.13%
2000 616,988 72,250 13.26% 996,500 70,174 7.58% 817,510 286,329 53.90%
2001 618,906 1,918 0.31% 994,587 -1,913 -0.19% 847,276 29,766 3.64%
2002 620,252 1,347 0.22% 989,996 -4,591 -0.46% 876,242 28,966 3.42%
2003 622,211 1,959 0.32% 987,755 -2,241 -0.23% 903,499 27,257 3.11%
2004 626,423 4,212 0.68% 988,932 1,177 0.12% 930,032 26,533 2.94%
2005 633,901 7,478 1.19% 994,575 5,644 0.57% 957,826 27,793 2.99%
2006 644,210 10,309 1.63% 1,004,110 9,535 0.96% 985,638 27,813 2.90%
2007 652,287 8,077 1.25% 1,014,565 10,455 1.04% 1,008,986 23,348 2.37%
2008 657,248 4,961 0.76% 1,022,060 7,495 0.74% 1,025,501 16,515 1.64%
2009 657,327 79 0.01% 1,024,971 2,911 0.28% 1,039,689 14,188 1.38%
2010 653,491 -3,836 -0.58% 1,026,126 1,155 0.11% 1,050,150 10,461 1.01%
2011 652,382 -1,109 -0.17% 1,030,429 4,304 0.42% 1,057,288 7,138 0.68%
2012 654,387 2,005 0.31% 1,036,907 6,478 0.63% 1,052,973 -4,315 -0.41%
2013 660,035 5,648 0.86% 1,046,692 9,784 0.94% 1,050,454 -2,519 -0.24%
2014 667,545 7,510 1.14% 1,057,945 11,253 1.08% 1,052,819 2,365 0.23%
2015 674,798 7,253 1.09% 1,068,804 10,859 1.03% 1,057,451 4,633 0.44%
2016 682,299 7,501 1.11% 1,082,908 14,104 1.32% 1,062,463 5,012 0.47%
2017 689,462 7,163 1.05% 1,100,412 17,505 1.62% 1,062,120 -343 -0.03%
2018 696,097 6,635 0.96% 1,119,504 19,092 1.73% 1,058,518 -3,601 -0.34%
2019 704,135 8,038 1.15% 1,138,823 19,319 1.73% 1,054,512 -4,007 -0.38%
2020 709,665 5,530 0.79% 1,155,938 17,115 1.50% 1,052,645 -1,867 -0.18%
% Change from previous decade/yr. % Change from previous decade/yr. % Change from previous decade/yr.
Year
(July 1) Ages 65+
%Change from
previous
decade/yr. Ages 65-74
%Change from
previous
decade/yr. Ages 75-84
%Change from
previous
decade/yr. Ages 85+
%Change from
previous
decade/yr.
--------- ---------------- ---------------- ---------------- ---------------- ---------------- ---------------- ---------------- ----------------
1980 305,841 --- 185,863 --- 91,137 --- 28,841 ---
1990 392,369 28.29% 224,772 20.93% 128,813 41.34% 38,784 34.48%
2000 439,239 11.95% 218,997 -2.57% 162,187 25.91% 58,055 49.69%
2001 442,558 0.76% 218,838 -0.07% 163,878 1.04% 59,843 3.08%
2002 445,890 0.75% 219,614 0.35% 165,109 0.75% 61,167 2.21%
2003 451,080 1.16% 222,361 1.25% 165,669 0.34% 63,050 3.08%
2004 456,984 1.31% 226,373 1.80% 165,842 0.10% 64,769 2.73%
2005 465,089 1.77% 231,926 2.45% 166,077 0.14% 67,087 3.58%
2006 475,596 2.26% 239,931 3.45% 165,787 -0.17% 69,877 4.16%
2007 487,657 2.54% 250,131 4.25% 165,148 -0.39% 72,379 3.58%
2008 502,959 3.14% 264,201 5.63% 164,354 -0.48% 74,403 2.80%
2009 517,502 2.89% 277,606 5.07% 163,513 -0.51% 76,383 2.66%
2010 532,062 2.81% 289,645 4.34% 164,159 0.40% 78,258 2.45%
2011 544,685 2.37% 300,403 3.71% 164,411 0.15% 79,871 2.06%
2012 569,900 4.63% 322,566 7.38% 165,859 0.88% 81,476 2.01%
2013 595,836 4.55% 344,277 6.73% 168,594 1.65% 82,965 1.83%
2014 620,946 4.21% 363,947 5.71% 172,856 2.53% 84,143 1.42%
2015 648,270 4.40% 384,828 5.74% 177,974 2.96% 85,467 1.57%
2016 675,250 4.16% 404,285 5.06% 183,944 3.35% 87,021 1.82%
2017 704,110 4.27% 423,867 4.84% 191,879 4.31% 88,364 1.54%
2018 734,785 4.36% 441,785 4.23% 203,408 6.01% 89,592 1.39%
2019 765,330 4.16% 459,458 4.00% 215,217 5.81% 90,655 1.19%
2020 796,018 4.01% 477,573 3.94% 225,935 4.98% 92,509 2.05%