Orbital-scale benthic foraminiferal oxygen isotope ... · physical properties and a significant...
67
1 Orbital-scale benthic foraminiferal oxygen isotope stratigraphy at the northern Bering Sea Slope Site U1343 (IODP Expedition 323) and its Pleistocene paleoceanographic significance H. Asahi 1* , S. Kender 2,3 , M. Ikehara 4 , T. Sakamoto 5, 6 , K. Takahashi 7 , A.C. Ravelo 8 , C.A. Alvarez Zarikian 9 , B.K. Khim 10* , and M.J. Leng 2, 11 1 Marine Research Institute and School of Coastal Earth Environment, Pusan National University, Busan 609-735, Korea 2 British Geological Survey, Keyworth, Nottingham NG12 5GG, UK 3 Department of Geology, University of Leicester, Leicester LE1 7RH, UK 4 Center for Advanced Marine Core Research, Kochi University, Nankoku 783-0093, Japan ([email protected]) 5 Mie University, Tsu City 514-8507, Japan ([email protected]) 6 Japan Agency for Marine-Earth Science and Techology (JAMSTEC), Yokosuka 237-0061, Japan 7 Hokusei Gakuen University, Sapporo 004-8631, Japan ([email protected]) 8 University of California Santa Cruz, Santa Cruz CA 95064, USA ([email protected]) 9 IODP, Texas A&M University, College Station TX 77845, USA ([email protected]) 10 Department of Oceanography, Pusan National University, Busan 609-735, Korea 11 NERC Isotope Geosciences Laboratory, British Geological Survey, Nottingham NG12 5GG, UK Corresponding authors ([email protected] , [email protected] )
Transcript of Orbital-scale benthic foraminiferal oxygen isotope ... · physical properties and a significant...

1
Orbital-scale benthic foraminiferal oxygen isotope stratigraphy at the northern
Bering Sea Slope Site U1343 (IODP Expedition 323) and its Pleistocene
paleoceanographic significance
H. Asahi1*, S. Kender2,3, M. Ikehara4, T. Sakamoto5, 6, K. Takahashi7, A.C. Ravelo8, C.A.
Alvarez Zarikian9, B.K. Khim10*, and M.J. Leng2, 11
1 Marine Research Institute and School of Coastal Earth Environment, Pusan National
University, Busan 609-735, Korea
2 British Geological Survey, Keyworth, Nottingham NG12 5GG, UK
3 Department of Geology, University of Leicester, Leicester LE1 7RH, UK
4 Center for Advanced Marine Core Research, Kochi University, Nankoku 783-0093,
Japan ([email protected])
5 Mie University, Tsu City 514-8507, Japan ([email protected])
6 Japan Agency for Marine-Earth Science and Techology (JAMSTEC), Yokosuka
237-0061, Japan
7 Hokusei Gakuen University, Sapporo 004-8631, Japan ([email protected])
8 University of California Santa Cruz, Santa Cruz CA 95064, USA ([email protected])
9 IODP, Texas A&M University, College Station TX 77845, USA
10 Department of Oceanography, Pusan National University, Busan 609-735, Korea
11 NERC Isotope Geosciences Laboratory, British Geological Survey, Nottingham NG12
5GG, UK
Corresponding authors ([email protected], [email protected])

2
Abstract
A continuous composite oxygen isotope (�18O) stratigraphy from benthic foraminifera in
the Bering Sea was reconstructed in order to provide insight into understanding sea-ice
evolution in response to Northern Hemisphere Glaciation. Oxygen isotope records from
multiple species of benthic foraminifera at Integrated Ocean Drilling Program (IODP)
Expedition 323 Site U1343 (54�33.4’N, 176�49.0’ E, water depth 1950 m) yield a highly
refined orbital-scale age model spanning the last 1.2 Ma, and a refined age model
between 1.2 and 2.4 Ma. An inter-species calibration was used to define species offsets
and to successfully obtain a continuous composite benthic �18O record, correlated with
the global composite benthic �18O stack curve LR04 to construct an orbital-scale age
model. The consistency of the benthic �18O stratigraphy with biostratigraphy and
magnetostratigraphy confirms the reliability of both methods for constraining age. The
time difference between cyclic changes in sedimentary physical properties and
glacial-interglacial cycles since 0.8 Ma is notable, and suggests that physical properties
alone cannot be used to construct an orbital-scale age model. Amplitude changes in
physical properties and a significant drop in the linear sedimentation rate during glacials
after 0.9 Ma indicate that the glacial sea-ice edge extended beyond the Bering Sea Slope
(Site U1343) at this time.
Keywords: oxygen isotope stratigraphy, benthic foraminifera, Pleistocene, sea-ice,
Bering Sea, IODP

3
1. Introduction
The construction of orbital-scale age models, particularly in the Quaternary
epoch, is essential for understanding climate changes in terms of glacial and interglacial
(G-IG) cycles. Comparison of benthic foraminiferal oxygen isotope (�18O) data to the
composite global stack curve LR04 (Lisiecki and Raymo 2005) enables establishment of
a precise orbital-scale age model back to 5.3 Ma. However, it is commonly difficult to
construct a continuous �18O record using a single taxon of benthic foraminifera due to
changing assemblage compositions and bottom water conditions, and also due to calcite
dissolution especially in regions with low calcite preservation such as the North Pacific
and the Southern Ocean.
One solution is to establish composite �18O records using multiple species and
inter-species calibrations. Previous comparisons between the �18O of benthic
foraminiferal calcite and the �18O of bottom water in different basins demonstrated that
the species-specific offsets are related to both their microhabitat and vital effects (e.g.
McCorkle et al., 1990, 1997). Investigations in different basins have provided accurate
species-specific offsets in the past (e.g. the Aleutian Margin and the Southern Australian
Margin; Basak et al., 2009). These studies suggest the possibility that, in each specific
basin, constant species offsets in �18O exist, allowing the use of �18O from different
species to be compiled in order to establish continuous �18O records.
A quicker but less robust approach may be to utilize the physical properties
(PP) of the sediments (e.g. Haug et al., 1995; Mix et al., 1995b; Shackleton et al., 1995).
This may be tempting as it is based on an assumption of coeval changes in the sediment
characteristics between G-IG cycles. For example, there is general agreement that
biological production in the Bering Sea increased during interglacial periods (e.g.

4
Okazaki et al., 2005; Kim et al., 2011), whilst high contributions of terrigenous and
glaciomarine components have been proposed during glacial periods. Changing
proportions of these different sedimentary components leave signatures in the natural
gamma-ray radiation (NGR), the magnetic susceptibility (MS), and the gamma ray
attenuation (GRA), as these sediment properties indicate relative changes in clay
minerals, glaciomarine components (e.g. ice-rafted debris: IRD), and sediment bulk
composition, respectively. Furthermore, the observed cyclic alternation of the biogenic
and siliciclastic sedimentary components at all seven sites drilled during IODP
Expedition 323 appears to provide the potential to identify G-IG cycles (Takahashi et al.,
2011; Aiello and Ravelo, 2012). However, their correlation with benthic �18O cycles is so
far confirmed only back to the last interglacial (e.g. Okazaki et al., 2005; Kim et al., 2011).
Therefore, further tests are required to examine whether this approach is appropriate for
the ~2.4 Myr-long sedimentary record at the Bering Sea Slope Site U1343.
Previous paleoceanographic studies in the Bering Sea demonstrate that sea-ice
evolution likely played an important role in regulating climate changes in the Bering Sea
and subarctic North Pacific (e.g. Cook et al., 2005; Okazaki et al., 2005; Tanaka and
Takahashi, 2005; Takahashi et al., 2005). The previous studies broadly indicate that an
extensive sea-ice cover existed in the Bering Sea during the last glacial maximum (LGM).
A recent study, combining global climate model simulations and compiled North Pacific
sedimentary records, suggested that intermediate meridional overturning circulation
originated in the North Pacific during Heinrich Stadial 1 (Okazaki et al., 2010), also
emphasizing the importance of sea-ice evolution in the Northern Hemisphere.
Here we present the first continuous 2.4 Myr composite �18O record of benthic
foraminifera from the Bering Sea (Site U1343, on a bathymertic high near the Bering

5
Slope). The regional species-specific �18O offsets are evaluated using multiple
measurements of different species from the same sediment horizons. An orbital-scale age
model at Site U1343 is then constructed by correlating our composite �18O record with
the global benthic LR04 stack (Lisiecki and Raymo, 2005). With our orbital-scale age
model based on �18O stratigraphy we then discuss (1) the validity of using PP data to
define G-IG cycles in the high-latitude North Pacific during the last 2.4 Myrs, and (2)
regional sea-ice evolution at the Bering Sea Slope (Site U1343).
2. Materials and Methods
2.1. Oceanographic setting at Site U1343
IODP Expedition 323 Site U1343 (54�33.4’N, 176�49.0’ E, water depth 1950
m; Fig. 1) is situated on a bathymetric high near the Bering Sea Slope. Its proximal
location to the modern seasonal sea-ice edge (Cavalieri et al., 1996) suggests that this site
is an ideal location to monitor past sea-ice evolution. The clear separation between the
Site U1343 topographic high and the Bering Sea Shelf minimizes the influence of
reworked sediments from nearby shelf areas (Takahashi et al., 2011).
Surface water circulation in the Bering Sea is dominated by an anti-clockwise
gyre (the Bering Sea Gyre) along the Bering Sea Slope, contributing to the main flow of
the Bering Slope Current (BSC, Stabeno et al., 1999). Water exchange between the
Bering Sea and the North Pacific takes place along the several paths between the Aleutian
Islands (generally between 1 and 4 km water depth; Fig. 1). North Pacific surface water
flows into the Bering Sea, originating from the Alaskan Stream, which runs along the
southern side of the Aleutian Islands. Most of the North Pacific water, which extends to
form the BSC, flows into the Bering Sea through the Amtchitka Pass, the Buldir Pass and

6
the Near Strait, whilst North Pacific water flows out through the Kamchatka Strait
(Kinney and Maslowski, 2012).
Atmospheric forcing is one of the factors that controls the annual variation of
sea-ice distribution in the modern Bering Sea (Niebauer, 1998; Zhang et al., 2010).
According to long-term observations of sea-ice and the climate regime index, sea-ice
cover was reduced by 5% in the eastern Bering Sea during the late 1970s, which is
attributed to changes in the position of the Aleutian Low as a result of a regime shift
(Niebauer, 1998). An ice-ocean coupled model confirms that sea-ice distribution in the
Bering Sea is mainly governed by changes in wind-driven ice mass advection, resulting
from climate variability modes such as the Pacific Decadal Oscillation (Zhang et al.,
2010).
2.2. Lithostratigraphy at Site U1343
Sediments recovered at Site U1343 are classified mainly into two groups: (a)
diatom-enriched mud and (b) pelagic mud (Aiello and Ravelo, 2012). Site U1343
lithology alternates between these two primary types of sediments, with only minor
amounts of volcanic shards and authigenic carbonate. Smaller mean grain size and higher
NGR at Site U1343, compared to the Bowers Ridge Sites U1340, U1341, and U1342 (Fig.
1), suggest a greater contribution of terrigenous clay within sediments at the Bering Sea
Slope (Aiello and Ravelo, 2012). Grain size analysis on the sediments recovered during
IODP Exp. 323 suggested that the clay-sized particles at the Bering Sea Slope were
delivered mainly from melting sea-ice (Aiello and Ravelo, 2012). Aiello and Ravelo
(2012) further argued that silt- and sand-sized siliciclastic grains, which are also the main
sediment component at Site U1343, could have been delivered from resedimentation

7
processes via iceberg rafting. Sedimentation rates at the Bering Sea Slope (Sites U1343,
U1344, and U1345) are high compared to those at the Bowers Ridge (Sites U1340,
U1341, and U1342), which was attributed to greater contribution of these silisiclastic
components to the Bering Sea Slope (Takahashi et al., 2011). A total of nine laminated
intervals were identified at several transitions of pelagic to diatom-enriched muds above
373.2 m core composite below sea floor, method A (CCSF-A) at Site U1343 (Takahashi
et al., 2011). The composite depth scale (or splice) at Site U1343 was constructed from
the correlation of physical properties from three holes drilled at the site (Holes U1343A,
U1343C and U1343E, Takahashi et al., 2010). The splice consists of one complete and
continuous interval from the mudline (0 m) to 235 m below seafloor (mbsf) (= 269.92 m
CCSF-A). Below the spliced section, cores from Hole U1343E (with unknown gaps) are
appended from ~270 to 779 m CCSF-A. With a total of 745 m recovery, the drilled
sediment at Site U1343 was targeted to recover a record at least back to 2.1 Ma (Teraishi
et al., in press).
2.3. Oxygen isotope measurement of benthic foraminifera
In order to obtain a continuous oxygen isotope record at Site U1343, we
measured oxygen isotopes using seven species of deep sea benthic foraminifera
(Cibicidoides spp., Elphidium batialis, Globobulimina pacifica, Nonionella labradorica,
Planulina wuellerstorfi, Uvigerina bifurcata, and Uvigerina senticosa). Among these
species, the genus Elphidium is most commonly known from shallower water habitats,
but E. batialis is a shallow infaunal, deep water species known from the deep North
Pacific (Ishiwada, 1964; Keller, 1980; Matoba, 1976; Saidova, 1961). Moreover, it has
been found living at depths greater than 1000 m on the Kamchatka slope of the Okhotsk

8
Sea (Bubenshchikova et al., 2008), another major marginal sea in the North Pacific, and it
is also abundant in the mudline (coretop) samples collected at Sites U1343 and U1344
(Takahashi et al., 2011). The common occurrence of this species, and the absence of other
typical shelf benthic foraminifera, indicate that E. batialis was not transported from the
Bering shelf and upper slope. The average sampling resolution is at intervals of 0.30 m
from 0 to 170 m CCSF-A, 1.4 m from 170 to 423 m CCSF-A, and 5.1 m from 423 to 770
m CCSF-A. A total of 333 samples were used to perform isotope analyses on multiple
species for the evaluation of species-specific offsets.
Two to five specimens of each benthic foraminiferal species from the >250 μm
size-fraction were picked under the dissecting microscope. Brown-colored foraminiferal
shells were not used for oxygen isotope analyses, because these colored tests are often
contaminated by authigenic carbonate formation (Cook et al., 2011; Ohkushi et al., 2005;
Hoshiba et al., 2006). Cleaning and preparation treatment of benthic foraminifera
followed a conventional procedure: crushing and cleaning by ultrasonification with pure
H2O and methanol (e.g. Sagawa and Ikehara, 2008). This cleaning procedure was
repeated three times with pure H2O and two times with methanol. Cleaned samples were
then dried in an oven at 40�C for at least 6 hours prior to measurement.
Among the total of 1289 oxygen isotopic measurements, 1138 analyses were
performed using the GV instruments IsoPrime® with the Multicarb preparation system at
the Center for Advanced Marine Core Research at Kochi University (KCC). The
remaining were analyzed at the NERC Isotope Geosciences Laboratory stable isotope
facility (NIGL), also using a GV instruments IsoPrime® with the Multicarb preparation
system. All of the measurement results were calibrated to the VPDB standard using
international standard NBS19. The analytical precision of the oxygen isotopes derived

9
from replicate NBS-19 measurements is ±0.06‰ at KCC and ±0.05‰ at NIGL.
2.4. Age model construction
The age model for Site U1343 was established by correlating our continuous
composite �18O record to the LR04 stack (Lisiecki and Raymo 2005). The comparison
was made using a dynamic program “MATCH 2.3” (Lisiecki and Lisiecki, 2002). This
dynamic algorithm allows a realistic matching of paleoclimate data sets with less effort
and uncertainty than the hand-tuning procedure. All data that showed any sign of
contamination with anomalously low �13C (as seen in Cook et al. 2011; Ohkushi et al.
2005; Hoshiba et al. 2006) were excluded from further comparison and from the
inter-species calibration. Prior to matching, all data were normalized in order to obtain a
maximum matching efficiency. No age-depth tie points from datum events were provided
prior to the matching process, in order to minimize potential bias.
The oxygen isotope stratigraphy in this study assumes that the timing of the
G-IG cycles is globally uniform. Recent work on the comparison of benthic �18O records
suggests a possible time lag of the Pacific benthic �18O records behind of those in the
Atlantic back to at least 800 ka, ranging up to ~4 kyr (Lisecki and Raymo, 2009; Skinner
and Shackleton, 2005). This lag occurred during deglacials, but may have varied at
different deglacial terminations (Lisecki and Raymo, 2009). These time lags are still
under debate and require further work particularly for early Pleistocene to late Pliocene
records (see Venti et al., 2013), but due to the comparatively short duration of the
potential lag we simply applied automatic matching of our �18O records to the LR04,
without any manual alignment to reflect possible lags between Pacific and Atlantic.
10
2.5. Spectrum analysis on benthic foraminiferal �18O and physical properties
In order to quantify periodicity and time differences between �18O and PP data
at Site U1343, we have employed cross spectrum analysis by using cross wavelet analysis
(Torrence and Compo, 1998) and the Blackman-Tukey (B-T) cross spectrum analysis
(Analyseries 2.4: Paillard et al., 1996). The cross wavelet analysis visualizes the
continuous changes in the power and coherency within a time-frequency space, while the
B-T cross spectrum analysis represents these changes in a designated time window. Prior
to each spectrum analysis, all analyzed data were resampled at every 2 kyr by linear�
interpolation, approximate to the original sample interval, between 0 and 1.2 Ma. The
B-T cross spectrum analysis was performed using 150 lags for a total of four different
time windows (0-0.8 Ma, 0.8-1.2 Ma, 1.2-2.4 Ma, and the entire time range). Cross
wavelet analysis was performed using a program code provided by C. Torrence and G.
Compo (http://paos.colorad.edu/research/wavelets/software.html), using Morlet as a
mother wavelet signal.
3. Results and Discussion
3.1. Inter-species calibration of benthic foraminiferal �18O
Results of �18O measurements using multiple species of benthic foraminifera
were compared in order to establish an orbital-scale continuous composite record (Fig. 2
and Table 1). Species-specific offsets were calculated relative to the isotopic value of E.
batialis, which is the most abundant species present at Site U1343. The species-specific
offsets between other species and E. batialis range from -0.15 to +0.86 ‰ (Table 1).
Despite relatively large standard deviations (Table 1), there appears to be no systematic
species-specific offset trend (Fig. 3a). Since most offset-corrected �18O values fall onto

11
the composite �18O line (Fig. 3b), this approach does not affect the overall quality of the
oxygen isotope curve.
To make our results comparable with other published calibration data sets, we
have calculated the ��18Owater-calcite, defined as the differences between the theoretical
�18O of calcite precipitated in equilibrium and the measured �18O. Since no oxygen
isotope measurements of seawater are available at Site U1343, we have estimated
��18Owater-calcite of each benthic foraminifera based upon the modern ��18Owater-calcite of G.
pacifica observed in the Aleutian Basin (0.21‰, Basak et al., 2009), and our
species-specific offsets (Table 1).
Species-specific offsets at Site U1343 (Table 1) are comparable to previously
published data (McCorkle et al., 1990; 1997), with several notable disagreements. A
value of –0.64‰ is widely recognized for the offset correction between U. peregrina and
P. wuellerstorfi (Shackleton, 1974; and confirmed by multiple studies such as Mix et al.,
1995a, 1995b). Since U. bifurcata is a superficially similar morphotype to U. peregina
(e.g. Schönfeld, 2006), and possibly combined in some studies with U. peregina �18O
(criticized in Fontanier et al., 2008 – see below), the offset value of U. bifurcata to P.
wuellerstorfi may be expected to show a similar value to that of U. peregrina relative to P.
wuellerstorfi. However, at Site U1343, the offset between U. bifurcata and Cibicidoides
spp. is –0.34±0.32‰ (n=36), and for P. wuellerstorfi it is –0.98±0.03‰ (n=2). Such a
disagreement in �18O offsets between Uvigerina and P. wuellerstorfi at Site U1343 to
other published offsets could be explained by (a) the uncertainties in the estimate of the
species-specific offset, and/or (b) size-dependent vital effects.
There are general agreements that species-specific offsets are attributed to

12
differences in vital effects and that these offsets from theoretical equilibrium are fairly
constant at different locations but there can be uncertainties (e.g. Fontanier et al., 2006).
Large standard deviations in the ��18Owater-calcite of Cibicidoides (±0.38‰, n=11) and of U.
peregrina (±0.14‰, n=16) indicate that their uncertainties are not negligible (McCorkle
et al., 1997). Furthermore, Hoogakker et al. (2010) compiled �18O values from multiple
species from piston cores in the Atlantic Ocean and Indian Ocean, and showed that there
is large uncertainty in the �18O offset between C. wuellerstorfi and U. peregrina (average
offset 0.72‰ with standard deviation 0.35‰). Fontanier et al. (2008) attempted to
explain the wide variety of previously published values of U. peregrina ��18Owater-calcite
from 0.02 to 0.4‰, as potentially due to the combination of several distinct species within
the U. peregrina group. By accounting for these uncertainties, the slight overlap between
the previously published Uvigerina offsets and the calculated Uvigerina offset at Site
U1343 in this study could be attributed to the choice of U. bifurcata over U. peregrina.
The second possible cause for the different �18O offset between P. wuellerstorfi
and U. bifurcata, compared to the well recognized offset of P. wellerstorfi and U.
peregrina, relies on the size-dependent vital effect of benthic foraminifera (Schmiedl et
al., 2004). Planktic foraminifera exhibit �18O values that increase with shell size due to
the changing conditions that affect growth rate (Berger et al., 1978; Friedrich, et al., 2012;
Spero and Lea, 1996; Vergnaud Grazzini, 1976). For benthic foraminifera, Schmiedl et al.
(2004) also found a logarithmic increase in the �18O of U. mediterranea with increased
size (1.63‰ at 175-225 μm size-fraction and 2.12‰ at 950-1050 μm size-fraction,
respectively). We did not perform size-variation �18O analysis due to the relatively low
abundances of small specimens in our samples. Although we cannot therefore test

13
whether the shell size may have an effect on �18O, our analyses were all made on large
(>250 μm) specimens effectively minimizing the error associated with shell size.
The general agreement between species-specific offsets for the majority of
benthic foraminifera at Site U1343 and the previously published data suggests that vital
effects can be considered globally uniform. Therefore, the offset values can be used to
adjust the �18O values of multiple species of benthic foraminifera to be consistent with a
single species �18O value, in order to establish a composite oxygen isotope record (as is
commonly applied to Uvigerina and Cibicidoides, e.g. Mix et al., 1995a, b). Our results
emphasize that multiple-species calibrations and precise species-specific corrections are
needed to reconstruct a high quality benthic foraminiferal �18O composite record.
3.2. Orbital-scale oxygen isotope stratigraphy at Site U1343
The correlation of our Site U1343 composite benthic �18O record with the
LR04 global stack curve (Lisiecki and Raymo, 2005) provides a precise orbital-scale age
model (Fig. 4 and Appendix 1 and 2) that complements and confirms other stratigraphic
data (i.e. diatoms, silicoflagellates and ebridians: Terashi et al., in press; calcareous
nannofossils, radiolarians and paleomagnetism: Takahashi et al., 2011). Nineteen out of a
total of twenty two datum events are confirmed by the orbital-scale benthic �18O age
model at Site U1343, within their estimation errors. The remaining three datum events,
LCO Actinocyclus oculatus (0.9 Ma at 314.3-322.23 m CCSF-A; Teraishi et al., in press.),
LO Filisphaera filifera (1.4-1.7 Ma at 307.7 m CCSF-A; Takahashi et al., 2011), and FO
Eucyrtidium matuyamai (1.7-1.9 Ma at 648.1 m CCSF-A; Takahashi et al., 2011), do not
match with our benthic �18O age model (Fig. 4). These exceptional datum events, in

14
contrast to the majority of other datum events, appear to be less reliable in the Bering Sea
than elsewhere. However, the majority of datum events are consistent with our benthic
�18O age model, confirming the overall quality of both data sets. Since we did not include
any datum event in the initial age-depth tie points prior to the matching, the consistent
agreement between the benthic �18O stratigraphy and the other datum events suggests that
our age model is reliable even in the interval of relatively low sampling (~1.2–2.4 Ma)
although the resolution of our record during this interval prohibits precise orbital-scale
age control.
Our newly established orbital-scale age model is based on an oxygen isotope
record at Site U1343 resolved to 1.7 kyrs between 0 and 1.2 Ma (0-341 m CCSF-A), and
10.3 kyrs between 1.2 and 2.4 Ma (341-769 m CCSF-A) (Fig. 5). Each marine isotope
stage (MIS) is identified in the �18O record at Site U1343 from 0-1.2 Ma, whilst prior to
1.2 Ma the record misses detection of some MISs. Despite these missing stages, no hiatus
intervals were identified based on an absence of any notable jumps in calculated linear
sedimentation rate (LSR) before 1.2 Ma. The missing stages at Site U1343 are therefore
more likely attributed to our low-resolution records below 341 m CCSF-A.
The validity of our oxygen isotope stratigraphy is further tested by various
cross-spectral analyses with LR04, and comparison of orbital-scale band pass filtered
variability. Two major orbital-scale periodicities (41- and 100-kyr) for the �18O records at
U1343 were recognized within different time windows (Figs. 6 and 7). The statistical
significance test in continuous wavelet transform (CWT) suggests that the 100-kyr
periodicity in our record was dominant since 0.7 Ma, while 41-kyr variability
characterizes it since at least 1.5 Ma to the 90% confidence level (Fig. 7b). The lack of a
significant presence of the 41-kyr band prior to 1.5 Ma is likely due to low sampling

15
resolution. Due to similar spectral variability, the coherency of our record and LR04 at the
41- and 100-kyr frequencies is high (~0.8), and nearly in-phase after 1.5 Ma (Fig. 7c),
strengthening the validity of our orbital-scale oxygen isotope stratigraphy. The nearly
in-phase relationship between the �18O records at U1343 and LR04 can be also seen in
their band-pass filtered variability (Fig. 8), demonstrating the overall quality of our
oxygen isotope stratigraphy.
Average time differences of the Site U1343 �18O record over LR04 at two
major orbital-scale periodicities throughout the study periods ranged from 2.3±2.4 kyr
lags at the 100-kyr band, to 2.1±1.0 kyr leads at the 41-kyr band. These numbers are fairly
close to or smaller than the sampling resolution (1.9 kyr after 1.5 Ma and 10.6 kyr before
1.5 Ma), and possible time lags between the Pacific and the Atlantic records (Lisecki and
Raymo, 2009), suggesting that these lead-lag differences could be within the uncertainty
of our oxygen isotope stratigraphy.
3.3. Validity of PP data as the orbital scale tunings
The PP data at Site U1343 have previously been regarded as likely reflecting a
change in sediment properties between G-IG cycles (e.g. Takahashi et al., 2011). At Site
U1343, the natural gamma radiation (NGR) largely reflects the grain size variability
within a size fraction between 0.04 μm and 2.0 mm (Aiello and Ravelo, 2012). A general
coincidence in the timing between the positive peaks in % biogenic opal (Kim et al., in
press) and negative peaks of gamma ray attenuation (GRA) indicate that GRA partially
reflects sediment characteristics from biogenics (negative peaks) to silisiclastics (positive
peaks). But a disagreement in the long-term variability of % biogenic opal and GRA
indicates potential biases by other factors. The magnetic susceptibility (MS) has been

16
interpreted as generally reflecting glaciomarine input to the North Pacific (Haug et al.,
1995), but a later study at the same site reinterpreted MS as aeolian dust input and
volcaniclastic components (Bailey et al., 2011). This later reinterpreation suggested
aeolian dust was a major contributer to MS vairability throughout the North Pacific
region. Frequent presences of pebble-sized IRD at the Bering Sea Slope (Takahashi et al.,
2011) suggests that MS at Site U1343 may more likely represent glaciomarine inputs
rather than other factors.
The assumed potential coupling between the PP data and G-IG cycles can be
tested with various cross spectrum analyses between PP data and �18O at Site U1343, by
examining their power spectra, coherency, and lead-lag relationships. Since G-IG cycles
shifted from 41 kyrs to ~100 kyrs periodicity during 0.8–1.2 Ma (so called
Mid-Pleistocene Transition: MPT), we have conducted the B-T cross spectrum analysis
in four different time intervals: (a) 0.8 Ma to Holocene (‘100-kyr world’), (b) 1.2-0.8 Ma
(transition period), (c) 2.4-1.2 Ma (’41-kyr world’) and (d) the entire studied time range.
Results of two different spectrum analyses indicate the presence of orbital-scale
periodicities (41-kyr and 100-kyr band) in all PP data sets, but their significance varies in
different time windows (Figs. 6 and 9). B-T spectral analyses reveals the presence of both
the 41-kyr and 100-kyr band periodicities in the PP data within a confidence level of 80%
(Fig. 6); however, CWT analyses, using a red noise as the background signal, does not
agree with the B-T spectral analyses results (Fig. 9).
These differerent results are attributed to different approach on its significant test
on each spectrum analysis, which further can be related to the choise of the background
signal. In this study, there are two background noise concerned: (a) white-noise signal
containing random noise at any frequency domain; and (b) red-noise signal containing

17
general decreasing trend along the freqeuncy increase. The significant test on the B-T
spectrum uses estimation uncertanities of spectrum power to visualize how each
spectrum peak signifies from its power nearby subject frequency. Therefore, our
approach in the B-T spectrum is similar to the test with the white-noise signal. At Site
U1343, B-T spectrum powers of GRA and NGR during 0-0.8 Ma and 0.8-1.2 Ma
intervals showed a less decreasing trend than those of MS and �18O (Fig. 6). This trend is
rather similar to the tendency of the white-noise signal than that of the red-noise signal. In
such a case, any periodical change at low frequency is not likely detected by the red-noise
signal test, due to their low spectral powers. On the other hand, a signal with the red-noise
tends to show large amplitude at low frequency (a long-lasting trend) domain, that can be
integrated or modulated from periodical changes at higher frequency. Any change in
period detected by this test would tend to be signigicant with respect to the original time
series (as seen in the 100-kyr periodical change in �18O after 1.2 Ma). Such different
signatures of these background signals need to be concerned, when evaluating the
significance of each periodical change.
According to the red-noise significance test, all PP data exhibited significant
periodicity at either 41-kyr and/or 100-kyr band. However, recognition in frequency-time
space varies at different time intervals. GRA and NGR show significant power at the
41-kyr band only during 1.2-2.4 Ma (Fig. 9). These significant periodicities need to be
evaluated with caution due to the large uncertainty in the age model. However, the fact
that there are no significant long-term increases or decreases in the LSR during that
interval (Fig. 5) suggests that any uncertainty in the age model is limited to one G-IG
cycle (~41 kyr). This maximum estimation suggests that such an age-model uncertanity
should not affect the presence of significant power at the ~41-kyr band. Furthermore,

18
distinct peaks in the NGR and GRA visible during the 1.2-2.4 Ma interval (Fig. 5)
confirms the likely presence of such periodic changes. Potential age model uncertanity
effects during the interval 1.2-2.4 Ma include their sigfinicant powers in a wide range of
frequencies (Fig. 9), and their diversed phase angles (Figs. 10b and 10c). We would
expect that high spectral power will converge on a particular frequency once a more
refined age-model is established during this interval. Consequently, an enhanced oxygen
isotope stratigraphy for the older section of U1343 is needed to provide clearer
interpretations of the periodic variations during that interval.
Unlike the NGR and GRA records, variability between MS and the �18O is similar,
with significant 41-kyr periodicity during 0.8-1.3 Ma and after 0.6 Ma, and significant
100-kyr periodicity after 0.6 Ma (Fig. 9). The high coherency between the MS and the
�18O after 1.0 Ma shows a coupling of the MS with G-IG cycles (Fig. 10c). Their phase
angles exhibit a gradual change from 90� lag to nearly in phase after 1.0 Ma (Fig. 10c),
which is approximately 0-20 kyr lags to the �18O record. Since the age model during such
periods is well constrained, this variability in phase angle implies that their lead-lag
relationships can vary at different time windows. These findings suggest a potential
usability of the MS to establish the orbital-scale age model. However, its application is
only favorable within a limited time interval, and their variable lags to the G-IG cycle
should be carefully taken into account.
The inconsistencies between PP and �18O periodicities at Site U1343 are likely
attributed to differences in amplitude variability at each frequency domain. Compared to
�18O and MS records, band-pass filtered NGR and GRA at both 100-kyr and 41-kyr bands
represent less variability in their amplitudes during last 2.5 Myrs (Fig. 8). Since a
red-noise signal test assumes that the spectrum power in a relevant time series grows with

19
increasing period (Rudnick and Davis, 2003), this reduction of the NGR and GRA
spectrum power at the 41-kyr and 100-kyr band effects the total shape of their spectrum,
thus resulting in their lack of significance when a red-noise signal test is applied.
Recognition of orbital-scale periodicities (41-kyr and 100-kyr) in NGR and GRA by a
white noise test indicates that there may be some potential for their use for orbital tuning.
Some levels of coherency in NGR and GRA to �18O are present (Fig. 10) and more
significant than the white-noise test.
At Site U1343, PP records have similar periodicities to those of the G-IG �18O
records, with high coherencies exceeding 95% confidence level, by B-T cross spectrum
analysis. However, PP variability is not always in phase with �18O variability (Figs 5, 10
and 11). In the 100-kyr band during the ‘100-ky world’ (1.2 Ma to Holocene), the lag
between �18O variations relative to those in NGR and GRA differs in one time interval
compared to another. Specifically, in the younger portion of the record from 0.8 Ma to the
Holocene, NGR and GRA variations lead those in the �18O record by 16.4±4.6 kyr and
9.6±4.3 kyr, respectively, whilst during the time interval from 1.2 to 0.8 Ma, the NGR and
GRA variations lag those in the �18O record by 7.0±3.7 kyr and 8.9±5.8 kyr, respectively
(Fig. 11). In contrast, MS variability lags the �18O record by 10.5±3.7 kyr during 0.8 Ma
to the Holocene and by 18.2±4.1 kyr during 1.2-0.8 Ma (Fig. 11). There are several time
intervals when the PP and the �18O records do not co-vary. Firstly, there are peaks in the
NGR and GRA records during the transition period from glacial to interglacial, most
notably at 12.4 ka but also at around 132 ka (Fig. 5). Secondly, the NGR and GRA records
show gradually increasing trends in several glacial intervals (Fig. 5: MIS 2, 6, 16 for both
NGR and GRA, and MIS 12 for NGR). These two trends are likely responsible for the

20
inconsistent lag between the PP data and the �18O record in the 100 kyr-world.
In contrast to the 100-ky band, PP and �18O variations in the 41-kyr band are
nearly in phase (NGR: 1.6±1.5 kyr lags; GRA: 0.0±1.6 kyr lags) during the 41-kyr world
(2.4-0.8 Ma) (Fig. 11). During the interval 1.2 to 0.8 Ma, the NGR and GRA cyclicity lags
behind �18O cyclicity by only 3.1±2.8 kyr and 0.6±2.6 kyr, respectively. The various
phase lags between the NGR variability and the GRA variability, compared with the �18O
cycles within different time domains, indicate that there is an inconsistent phasing
between changes in sedimentological characteristics and �18O cycles at the Bering Sea
Slope.
There appears to be two possible explanations for the asynchrony of PP
variability relative to �18O cycles within the 100-kyr world. The first relates to the
biological response during the deglaciation, and the second relates to the evolution of
sea-ice at the Bering Sea Slope and related sedimentation. Notably, high biological
production during the last deglacial period has been reported along the northern margin of
the North Pacific including the Bering Sea (Cook et al., 2005, Gebhardt et al., 2008,
Gorbarenko et al., 2002, 2004, and 2005, Kim et al 2011, Okazaki et al., 2006; Ono et al.,
2005; Schulung et al., 2012). This significant increase in biological production during the
deglaciation is also confirmed by the coexistence of the laminated sediments at the same
horizons (Cook et al., 2005; Kim et al., 2011). At Site U1343, a total of nine laminated
intervals were recognized (at 10.2, 13.4, 14.1, 132, 144, 179, 424, 495 and 1266 ka,
Takahashi et al., 2011). At those laminated intervals, the NGR and GRA show either (a)
notable negative peaks (12.4 ka and 132 ka), or (b) gradual decreasing trends during
glacial periods that contain laminated intervals (Fig. 5). The notable negative anomaly is

21
likely related to an abrupt increase in biological production. The presence of these notable
peaks during the deglacial period produces the apparent lead of NGR and GRA variations
relative to �18O variations. However, presence of the laminated intervals does not account
for the gradual decreasing trend during the glacial periods, for which an alternate second
mechanism is needed.
The second mechanism involves a change in sediment characteristics in
association with sea-ice evolution. There appears to be a general decrease in the
amplitudes of the NGR and GRA after 1.2-0.8 Ma, whilst there is a general increase in the
MS amplitude (Figs. 5, 8 and 9). These amplitude changes suggest a shift in the sediment
lithology, from an alternation of diatom-enriched and terrigenous-enriched sediments
before ~0.9 Ma to an alternation of glaciomarine and non-glaicomarine sediments after
~0.8 Ma. This shift in the sediment characteristics is also consistent with a drop in the
LSR during glacials after 0.9 Ma, suggesting that the sea-ice coverage over the Bering
Sea Slope since that time has influenced the biogenic and terrigenous sedimentation at
Site U1343. The gradual weakening of the NGR and GRA variations is also confirmed by
the decrease in biogenic opal content at Site U1343 (Kanematsu et al., 2013; Kim et al., in
press). Despite the decrease in the G-IG amplitude of the biogenic opal content, Kim et al.
(in press) show that variations in biogenic opal contents are reasonably coeval with G-IG
cycles throughout the last 2.4 Ma. They also find that the 100-kyr cyclicity during the
100-kyr world is not as significant as expected, consistent with the weaker 100-kyr
amplitude in the NGR and GRA during ~0.8 Ma (Figs 8 and 9). Several lines of evidence,
from the PP data, biogenic opal content and LSR, imply that the sea-ice cover over the
Bering Sea Slope inhibited terrigenous and biogenic sedimentation, thereby weakening
the NGR and GRA signals with respect to G-IG cycles. Asynchrony of the NGR and the

22
GRA changes relative to those in �18O at Site U1343 strongly demonstrates that direct
matching of NGR and GRA to the global stack curve LR04, without any age constraints,
cannot be used to establish an orbital-scale age model at the Bering Sea Slope. The
presence of laminated sediment intervals and the inhibition of biogenic and terrigenous
sedimentation (due to sea-ice cover) during the 100-kyr world, are two plausible
influences on the NGR and GRA signals that make them asynchronous with �18O cycles.
The PP and �18O asynchrony is also reported elsewhere in the North Pacific
(Bailey et al., 2011; Venti and Billup, 2012; Zahn and Mix, 1991), suggesting PP data’s
broadly limited utility when establishing orbital-scale age models. This is partially due to
either (a) a complex relationship between PP and sediment characteristics and (b) a
regional sedimentation process that may bias the PP data. For example, Haug et al. (1995)
originally suggested that MS reflected glaciomarine inputs at Detroit Seamount (Site
882), but a later study revealed that MS at this site likely reflected changes in aeolian dust
and volcanic ash contents (Bailey et al., 2011). At Site U1343, however, the application of
this interpretation for MS is not appropriate due to the relatively minor contribution from
volcaniclastics (Takahashi et al., 2011). Moreover, MS variability with G-IG cycles at
U1343 is likely antiphased with observed eolian dust fluxes to the North Pacific (Hovan
et al., 1991; Bailey et al., 2011) and Chinese loess sequences (Kukla and An, 1989; Sun
and An, 2005). This antiphase relationship between ocean-scale aeolian dust fluxes and
MS variability at U1343 likely indicates that eolian dust is a minor contributor to MS
variability. Instead, this asynchrony between PP (NGR and GRA) and �18O is due to
regional sedimentation processes, associated with sea-ice expansion after 0.9 Ma at the
Bering Sea Slope. Large glaciomarine contributions at Site U1343 may have overridden
any potential original G-IG cycle synchronicity of NGR and GRA after 0.9 Ma. Similar

23
findings of a decoupling between PP and G-IG cycles in the North Pacific (see above)
demonstrate a limitation of PP data for orbital-scale age model construction, and
highlight the limitation of using PP data in isolation for the evaluation of any other causal
mechanisms.
3.4. Sea-ice evolution at the Bering Sea Slope during last 2.4 Myrs
Sedimentary PP records at Site U1343, with newly established orbital-scale
oxygen isotope stratigraphy, provide essential information to understand sea-ice
evolution at the Bering Sea Slope during the last 2.4 Myrs. The most notable changes in
our data occurred within the interval 1.4-0.9 Ma, as evidenced by a drop in LSR (mainly
during glacial periods), a decrease in amplitude of NGR and GRA variability, and
increases in MS values and amplitude of variation (Figs. 5, 8, 9 and 12). A gradual
increase in MS indicates a marked increase of the contribution of glaciomarine sediments,
whilst changes in the amplitudes of the NGR, GRA and MS suggest that variations in
glaciomarine input controlled the main sediment characteristics after 0.8 Ma. Since
glaciomarine input is mainly regulated by the distance from the sea-ice edge, where most
of the seasonal sea-ice melting occurs (Sakamoto et al., 2005), this notable shift in the
sediment characteristics is likely due to changes in the sea-ice conditions at the Bering
Sea Slope during that period. This proposed sea-ice extension is also consistent with the
stepwise increase in the abundance of sea-ice diatoms during 1.2-0.9 Ma at Site U1343
(Teraishi et al., in press). During the same period of this increase, the inflow from the
North Pacific via the Alaskan Stream was notably reduced, as indicated by a decrease in
pelagic diatoms (Teraishi et al., in press). The relatively large NGR and GRA amplitudes
prior to 1.2 Ma (Figs. 5, 8, 9 and 12) imply that the seasonal sea-ice maxima did not reach
24
the Bering Sea Slope, as it does today, possibly due to strong inflow of relatively warm
water from the North Pacific, prior to 1.2 Ma.
In contrast, the amplitude of NGR, GRA, and MS variability changed after 0.8
Ma, indicating that sea-ice expanded over the Aleutian Basin, as North Pacific water
inflow decreased, during glacials. In the MS record, there are notable spikes during
interglacial periods at Site U1343 (Figs 5 and 12), most likely reflecting coarse-grained
particles supplied by glaciomarine input due to in situ sea-ice melting over the Bering Sea
Slope. Marked high coherency between the MS and �18O after 0.8 Ma suggests that the
sea-ice evolution over the Bering Sea Slope may have been governed primarily by G-IG
cycles (Fig. 10c). During such intervals, their lags suggest the sea-ice edge reached the
Bering Sea Slope during the transition interval from interglacials to the glacials. Gradual
change in their lags after 0.6 Ma implies further extension of the sea-ice over the Bering
Sea Slope at the G-IG cycle scale, as the arrival timing of the sea-ice edge became closer
to the interglacial maximum. This evidence of in situ sea-ice melting can be further
interpreted as the presence of semi-perennial sea-ice cover over the Bering Sea Slope,
which likely blocked North Pacific water inflow through the Aleutian Islands during
glacial periods. We propose that extensive sea-ice expansion in the Bering Sea after
~1.2-0.9 Ma prevented terrigenous and biological sedimentation, as indicated by an
abrupt drop in the LSR during glacial periods, a decrease in the amplitude of the NGR and
GRA, and decreased biogenic opal content (Kanematsu et al., 2013; Kim et al., in press).
Semi-perennial sea-ice cover over the Bering Sea Slope during glacial periods is
consistent with previously published sea-ice reconstructions during the LGM at the
Bering Sea Slope (Katsuki and Takahashi, 2005; Kim et al., 2011; Rella et al., 2012) and
the Umnak Plateau (Cassie et al., 2010), and suggests that the extensive sea-ice cover

25
over the Bering Sea documented previously only for the last glacial cycle first appeared
during glacials at ~0.9 Ma.
The marked sea-ice expansion over the Bering Sea between 1.2 and 0.9 Ma can
be linked to two climatic forces: (a) atmospheric forcing and (b) global continental ice
sheet evolution. Modern sea-ice distribution in the Bering Sea is mainly regulated by the
strength of the northerly wind in the Bering Sea during winter (Pease, 1980). This winter
northerly wind, linked to location and intensity of the Siberian High and the Aleutian
Low (Overland et al., 1999; Rodionov et al., 2007), enhances the southward sea-ice
advection in the Bering Shelf (Zhang et al., 2010). This ocean-atmosphere linkage is also
important on geological timescales as indicated by data from the Holocene (Clegg et al.,
2011; Katsuki et al., 2009; Muhs et al., 2003) and the last 60 kyrs (Rella et al., 2012). The
expansion of sea-ice evident in our records suggests that a similar sea-ice atmosphere
linkage may have been active at least since 0.9 Ma. Since such sea-ice atmosphere
linkages also impact ocean heat capacity (Zhang et al., 2010), they could be studied
further in the future using SST reconstructions at Site U1343.
This extensive sea-ice expansion over the Bering Sea also coincided relatively
closely with expansion of the North America Ice Sheet (Bintanja and van de Wal, 2008),
suggesting a coupling between North America Ice Sheet growth and sea-ice expansion.
Clark et al. (2006) hypothesized that the erosion of regolith beneath continental ice sheets
in the Northern Hemisphere during the MPT (1.2-0.8 Ma) allowed ice sheets to grow
thicker, overriding 41-kyr insolation cycles. However, their instability was proposed to
have increased due to the basal pressure-melting in the latter stages of glacials, as a
plausible driving force shifting G-IG cyclicity from 41-kyr to 100-kyr periodicity during
the MPT. Elderfield et al. (2012) alternatively emphasized that an abrupt increase in

26
Antarctic ice volume at ~0.9 Ma initiated the shift in cyclicity during the MPT. We find
evidence for an alternative hypothesis that, if sea-ice expansion over the Bering Sea Slope
signifies a general expansion of sea-ice in the North Pacific region during the MPT,
activation of the ‘sea-ice switch’ may have driven the change from 41-kyr to 100-kyr
G-IG cyclicity over the MPT as proposed by Tziperman and Gildor (2003). To test this
hypothesis and to determine the lead/lag and precise timing of sea-ice expansion relative
to G-IG cycles during the MPT, further high-resolution studies of sea-ice over the Bering
Sea Slope are needed.
4. Conclusions
An oxygen isotope stratigraphy at IODP Expedition 323 Site U1343 was
established on the basis of benthic foraminiferal �18O records from seven species of
benthic foraminifera (E. batialis, U. bifurcata, G. pacifica, U. senticosa, P. wuellerstorfi,
N. labradorica, and Cibicidoides spp.). Comparison of �18O values from these benthic
foraminifera from the same sediment horizons shows offsets that are in general
agreement with other previously published data. This indicates that our multiple-species
�18O data can be simply corrected with species-specific offsets in order to build an
accurate composite benthic �18O record.
The benthic �18O stratigraphy at Site U1343 was constructed by correlating our
composite benthic �18O record with the global benthic �18O stack LR04, which broadly
converges with age models provided by biostratigraphy and paleomagnetism, suggesting
that these methods are generally reliable for constraining the long-term ages. According
to our composite benthic �18O age model (independent from other age markers), the

27
sedimentary record at Site U1343 contains a continuous paleoceanographic information
of the last 2.4 Myrs.
Detailed examination of physical property (PP) records with the benthic �18O
stratigraphy demonstrates notable uncertainty when using PP data to construct glacial and
interglacial (G-IG) cycles. In contrast to the basic assumption of coeval changes between
G-IG cycles, PP data tends to lead G-IG cycles by ~10 kyr, particularly during the last 0.8
Ma. Furthermore, this leading trend varies in different time-windows. Our study strongly
indicates that direct correlation of PP data to LR04 without any age constraints (e.g. from
�18O) is not suitable for constructing orbital-scale chronostratigraphy. A shift toward a
decreasing trend in the amplitude of the GRA and NGR with respect to G-IG cycles, a
gradual increasing trend in the MS, and an abrupt drop in the linear sedimentation rate
during glacials indicate that the glacial sea-ice edge likely exceeded the Bering Sea Slope
by ~0.9 Ma. This extensive sea-ice expansion over the Bering Sea Slope during 0.9-1.2
Ma is likely to have been at least partially driven by atmospheric forcing over the Bering
Sea. Evidence for coeval growth of North America Ice Sheet with this secular glacial
sea-ice expansion in the Bering Sea suggests interaction between the sea-ice evolution in
the Bering Sea and the global glacial expansions during the Mid-Pleistocene Transition.
Acknowledgement
We would like to show our great appreciation to all of the scientists, technicians, and
crew of D/V JOIDES resolution during IODP Expedition 323 in the Bering Sea. We
would also like to thank the curatorial staff at the Kochi Core Center for their great
support in sediment sampling. Great thanks also to technical supporting members at the
Center for Advanced Marine Core Research (Kochi University), especially to M.

28
Kobayashi, K. Suenobu, Y. Fujimura, M. Sasaoka, and M. Hamada for their assistance in
sample processing and isotope measurements. The constructive reviews of Dr. N.L. Venti
and an anonymous reviewer helped to improve this manuscript substantially. HA, MI, TS,
and KT would like to thank to the financial aid from the supporting program for the IODP
shipboard scientists by J-DESC. This research was supported by the Center for
Atmospheric Sciences and Earthquake Research (Grant No. CATER 2012-040 to BKK),
by Pusan National University in the programme Post-Doc. 2012 (to HA), by the NERC
Isotope Geosciences Laboratory (Grant No. IP-1141-1109 to SK), by the financial aid of
Kochi University (the research support program to MI), and by Japanese Ministry of
Education, Culture, Sports, and Technology (the Grant-in-Aid for Scientific Research (A)
#23241015 to TS). SK publishes with permission of the Executive Director of the British
Geological Survey (NERC).
References
Aiello, I., Ravelo, A.C. (2012). Evolution of marine sedimentation in the Bering Sea
since the Pliocene, Geosphere, 8, 6, 1-23.
Bailey, I., Liu, Q., Swann, G.E.A., Jiang, Z., Sun, Y., Zhao, X., and Roberts, A.P. (2011).
Iron fertilization and biogeochemical cycles in the sub-Arctic northwest Pacific
during the last Pliocene intensification of northern hemisphere glacialtion, Earth
and Planetary Science Letters, 307:253-265.
Basak, C., Rathburn, A.E., Pérez, M.E, Martin, J.B., Kluesner, J.W., Levin, L.A., De
Deckker, P., Gieskens, J.M., Abriani, M. (2009). Carbon and oxygen isotope
geochemistry of live (stained) benthic foraminifera from the Aleutian Margin and
the Southern Austrarlian Margin. Marine Mircropaleontology, 70, 89-101.

29
Berger, W.H., Killingley, J.S., Vincent, E. (1978). Stable isotopes in deep-sea carbonates:
Box core ERDC-92, west equatorial Pacific. Oceanologica Acta 1, 203-216.
Bintanja, R., van de Wal, R.S.W. (2008). North America ice-sheet dynamics and the onset
of 100,000-year glacial cycles, Nature, 454, 869-872.
Bubenshchikova, N., Nürnberg, D., Lembke-Jene, L., Pavlova, G. (2008). Living benthic
foraminifera of the Okhotsk Sea: Faunal composition, standing stocks and
microhabitats, Marine Micropaleontology, 69, 314-333
Caissie, B.E., Brigham-Grette, J., Lawrence, K.T., Herbert, T.D., Cook, M.S. (2010). Last
Glacial Maximum to Holocene sea surface conditions at Umnak Plateau, Bering
Sea, as inferred from diatom, alkenone, and stable isotope records.
Paleoceanography, 25, PA1206, doi:10.1029/2008PA001671.
Cavalieri, D., Parkinson, C., Gloersen, P., Zwally, H.J. (1996, updated yearly). Sea Ice
Concentrations from Nimbus-7 SMMR and DMSP SSM/I-SSMIS Passive
Microwave Data, [list dates of temporal coverage used]. Boulder, Colorado USA:
National Snow and Ice Data Center. Digital media.
Clark, P.U., Archern D., Polalrd, D., Blum, J.D., Rial, J.A., Brovkin, V., Mix, A.C., Pisias,
N.G., Roy, M. (2006). The middle Pleistocene transition: characteristics,
mechanisms, and implications for long-term changes in atmospheric pCO2.
Quaternary Science Reviews, 25, 3150-3184.
Clegg, B.F., Kelly, R., Clarke,G.H., Walker, I.R., Hu, F. S. (2011). Nonliniear response of
summer temperature to Holocene insolation forcing in Alaska. Proceedings of the
National Academy of Science, vol. 108, 48, 19299-19304.
Cook, M.S., Keigwin, L.D., Birgel, D., Hirichs, K. (2011). Repeated pulses of vertical
methane flux recorded in glacial sediments from the southeast Bering Sea.

30
Paleoceanography, 26, PA2210, doi;10.1029/2010PA001993.
Cook, M.S., Keigwin, L.D., Sancetta, C.A. (2005). The deglacial history of surface and
intermediate water of the Bering Sea. Deep-Sea Research II, 52, 2163-2173.
Elderfield, H., Ferretti, P., Greaves, M., Crowhurst, S., McCave, I.N., Hodell, D., abd
Piotrowski, A.M. (2012). Evolution of ocean temperature and Ice volume through
the Mid-Pleistocene Climate Transition, Science, 10, vol. 337 no. 6095, pp.
704-709.
Fontanier, C., Jorissen, F.J., Michel, E., Cortijo, E., Vidal, L., Anshultz, P. (2008). Stable
oxygen and carbon isotopes of live (stained) benthic foraminifera from
Cap-Ferret Canyon (Bay of Biscay), Journal of Foraminiferal Research, 38,
39-51.
Fontanier, C., Mackensen, A., Jorissen F.J., Anschutz, P., Licari, L., Griveaud C. (2006).
Stable oxygen and carbon isotopes of live benthic foraminifera from the Bay of
Biscay: Microhabitat impact and seasonal cariability. Marine Micropaleontology,
58, 159-183.
Friedrich, O., Schiebel, R., Wilson, P.A., Weldeab, S., Beer, C.J., Cooper, M.J., Fiebig, J.
(2012). Influence of test size, water depth, and ecology on Mg/Ca, Sr/Ca, �18O,
and �13C in nine modern species of planktic foraminifers, Earth and Planetary
Science Letters, 319-320, 133-145.
Gebhardt, H., Sarnthein, M., Grootes, P.M., Kiefer, T., Kuehn, H., Schmieder, F., Röhl, U.
(2008). Paleonutrient and productivity records from the subarctic North Pacific
for Pleistocene glacial terminations I to V. Paleoceanography, 23, PA4212,
doi:10.1029/2007PA001513.
Gorbarenko, S.A., Basov, I.A., Chekhovskaya, M.P., Southon, J., Khusid, T.A., Artemova,

31
A.V. (2005). Orbital and millennium scale environmental changes in the southern
Bering Sea during the last glacial-Holocene: Geochemical and paleontological
evidence. Deep-Sea Research II, 52, 2174-2185.
Gorbarenko, S.A., Khusid, T.A., Basov, I.A., Oba, T., Southon, J.R., Koizumi, I. (2002).
Glacial Holocene environment of the southeastern Okhotsk Sea: evidence from
geochemical and palaeontological data. Palaeogeography, Palaeoclimatology,
Palaeoecology, 177, 237-263.
Gorbarenko, S.A., Southon, J.R., Keigwin, L.D., Cherepanova, M.V., Gvozdeva, I.G.
(2004). Late Pleistocene-Holocene oceanographic variability in the Okhotsk Sea:
geochemical, lithological and paleontological evidence. Palaeogeography,
Palaeoclimatology, Palaeoecology, 209, 281-301.
Haug., G.H., Maslin, M.A., Sarnthein, M., Stax, R., Tiedermann, R. (1995). Evolution of
northwest Pacific sedimentation patterns since 6 Ma (Site 882), Proceedings of
Ocean Drilling Program: Scientific Results, 138, 371-412.
Hoogakker, B., Elderfield, H., Oliver, K., Crowhurst, S. (2010). Benthic foraminiferal
oxygen isotope offsets over the last glacial-interglacial cycle, Paleoceanography,
25, PA4229, doi:10.1029/2009PA001870.
Hoshiba, M., Ahagon, N., Ohkushi, K., Uchida, M., Motoyama, I., Nishimura, A. (2006).
Foraminiferal oxygen and carbon isotopes during the last 34 kyr off northern
Japan, northwestern Pacific. Marine Micropaleontology, 61, 196-208.
Hovan, S.A., Rea, D.K., and Pisias, N.G. (1991). Late Pleistocene continental climate and
oceanic variability recorded in northwest Pacific sediments, Paleoceanography, 6,
349-370.
Ishiwada, Y. (1964). Benthonic Foraminifera off the Pacific coast of Japan referred to

32
biostratigraphy of the Kazusa Group. Geological Survey of Japan Publishing,
report No. 205, pp. 1-43.
Kanematsu, Y., Takahashi, K., Kim, S., Khim, B.K., Asahi, H. (2013). Changes in
biogenic opal productivity with Milankovitch cycle during the last 1.3 Myrs at
IODP Expedition 323 Sites U1341, U1343, and U1345 in the Bering Sea.
Quaternary International, 310, 213-220.
Katsuki, K., Takahashi, K. (2005). Diatoms as paleoenvironmental proxies for seasonal
productivity, sea-ice and surface circulation in the Bering Sea during the late
Quaternary. Deep-Sea Research II, 52, 2110-2130.
Katsuki, K., Khim, B.K., Itaki, T., Harada, N., Sakai, H., Ikeda, T., Takaahshi, T., Okazaki,
Y., Asahi, H. (2009). Land-sea linkage of Holocene paleoclimate on the Southern
Bering Continental Shelf, The Holocene, 19, 747-756.
Keller, G. (1980). Benthic foraminifera and paleobathymetry of the Japan Trench area,
Leg 57, deep sea drilling project. In: von Huene, R., Nasu, N. (Eds.) et al., Initial
Reports of Ocean Drilling Program, 56-57 (1980), pp 835-865.
Kim, S., Khim, B.K., Uchida, M., Itaki, T., Tada, R. (2011). Millenial-scale
paleoceanographic events and implication for the intermediate-water ventilation
in the northern slope area of the Bering Sea during the last 71 kyrs. Global and
Planetary Change, 79, 89-98.
Kim, S., Takahashi, K., Kanematsu, Y., Asahi, H., Ravelo, A.C., Khim, B.K. (in press)
Mid-Pleistocene Transition in the Bering Sea: a continuous wavelet transform
analysis of biogenic opal at IODP Expedition 323 Site U1343. Quaternary
Research, available online 15 November, 2013,
http://dx.doi.org/10.1016/j.yqres.2013.10.001

33
Kinney, J.C., Maslowski, W. (2012). On the oceanic communication between the Western
Subarctic Gyre and the deep Bering Sea. Deep-Sea Research I, 66, 11-25.
Kukla, G., An, Z.S. (1989). Loess stratigraphy in central China, Palaeogeography,
Palaeoclimatology, Palaeocology, 72, 203-225.
Lisiecki, L.E., Lisiecky, P.A. (2002). Application of dynamic programming to the
correlation of paleoclimate records. Paleoceanography, 17, 1049,
doi:10.1029/2001PA000733
Lisiecki, L.E., Raymo, M.E. (2005). A Pliocene–Pleistocene stack of 57 globally
distributed benthic �18O records. Paleoceanography, 20, PA1003.
doi:10.1029/2004PA001071
Lisiecki, L. E., Raymo, M.E. (2009). Diachronous benthic �18O responses during late
Pleistocene terminations, Paleoceanography, 24, PA3210,
doi:10.1029/2009PA001732.
Matoba, Y. (1967). Younger Cenozoic foraminiferal assemblages from the Choshi
District, Chiba Prefecture. Science Reports of the Tohoku University, Sendai,
Japan, Second Series (Geology), 38, No.2, 107-140.
McCorkle, D.C. Keigwin, K.D. (1990). The influence of microhabitats on the carbon
isotopic composition of deep-sea benthic foraminifera, Paleoceanography, 5,
161-185.
McCorkle, D.C., Corliss, B.H., Farnham, C.A. (1997). Vertical distributions and stable
isotopic composition of live (stained) benthic foraminifera from the North
Carolina and California continental margins. Deep-Sea Research I, 44, 983-1024.
Mix, A.C., Le, J., Shackleton, N.J. (1995a). Benthic foraminiferal stable isotope
stratigraphy of site 846: 0-1.8 Ma. Proceedings of the Ocean Drilling Program,
34
Scientific Results, 138, 839-854.
Mix, A.C., Pisias, N.G., Rugh, W., Wilson, J., Morey, A., Hagelberg, T.K. (1995b).
Benthic foraminifer stable isotope record from Site 849 (0-5 Ma): local and global
climate changes. Proceedings of the Ocean Drilling Program, Scientific Results,
138, 371-412.
Muhs, D.R., Ager, T.A., Bettis III, E.A., McGeehin, J., Been, J.M., Begét, J.E., Pacicch,
M.J., Stafford, T.W. Jr., Stevens, D.S.P. (2003). Stratigraphy and paleoclimatic
significance of late Quaternay loess-paleosol sequences of the last
interglacial-glacial cycle in central Alaska, Quarternary Science Reviews, 22,
1947-1986.
Niebauer, H.J. (1998). Variability in Bering Sea ice cover as affected by a regime shift in
the North Pacific in the period 1947-1996. Journal of Geophysical Research, 103,
C12, 27717-27737.
Ohkushi, K., Ahagon, N., Uchida, M., Shibata, Y., (2005). Foraminiferal isotope
anomalies from northwestern Pacific marginal sediments. Geochemistry,
Geophysics, Geosystems, 6, 4, Q04005, doi:10.1029/2004GC000787.
Okazaki, Y., Takahashi, K., Asahi, H., Katsuki, K., Hori, J., Yasuda, H., Sagawa, Y.,
Tokuyama, H. (2005). Productivity changes in the Bering Sea during the late
Quaternary. Deep-Sea Research II, 52, 2150-2162.
Okazaki, Y., Timmermann, A., Menviel, L., Harada, N., Abe-Ouchi, A., Chikamoto,
M.O., Mouchet, A., Asahi, H. (2010). Deepwater formation in the North Pacific
during the last glacial termination. Science, 329, 200-204.
Ono, A., Takahashi, K., Katsuki, K., Okazaki, Y., Sakamoto, T. (2005) The
Dansgaard-Oeschger cycles discovered in the upstream source region of the

35
North Pacific Intermediate Water formation. Geophysical Research Letters, 32,
L11607, doi:10.1029/2004GL022260.
Overland, J.E., Adams, J.M., Bond, N.A. (1999). Decadal variability of the Aleutian low
and its relation to high-latitude circulation. Journal of Climate, 12, 1542-1548.
Paillard, D., Labeyrie L., Yiou, P. (1996). Macintosh program performs time-series
analysis, Eos, Transactions American Geophysical Union, 77: 379.
Pease, C.H. (1980). Eastern Bering Sea ice processes. Monthly Weather Review, 108,
2015-2023.
Rella, S.F., Tada, R., Nagashima, K., Ikehara, M., Itaki, T., Ohkushi, K., Sakamoto, T.,
Harada, N., Uchida, M. (2012). Abrupt changes of intermediate water properties
on the northeastern slope of the Bering Sea during the last glacial and deglacial
period. Paleoceanography, 27, PA3203, doi:10.1029/2011PA002205.
Rodionov, S.N., Bond, N.A., Overland, J.E. (2007). The Aleutian Low, storm tracks, and
winter climate variability in the Bering Sea. Deep-Sea Research II, 54,
2560-2577.
Rudnick, D.L., Davis, R.E. (2003). Red noise and regime shifts. Deep-Sea Research I, vol
50, 6, 691-699.
Sagawa, T., Ikehara, K. (2008). Intermediate water ventilation change in the subarctic
northwest Pacific during the last deglaciation, Geophyisical Research Letters, 35,
L24702, doi:10.1029/2008GL035133.
Saidova, Kh, M. (1961). Foraminiferal ecology and paleogeography, Far Eastern seas of
the USSR and northwest part of the Pacific Ocean. Nauka, Moscow, pp. 1-232.
Sakamoto, T., Ikehara, M., Aoki, K., Iijima, K., Kimura, N., Nakatsuka, T., Wakatsuchi,
M. (2005). Ice-rafted debris (IRD)-based sea-ice expansion events during the past

36
100 kyrs in the Okhotsk Sea. Deep-Sea Research II, 52, 2275-2301.
Schlung, S.A., Ravelo, A.C., Aiello, I.W., Andreasen, D.H., Cook, M.S., Drake, M., Dyez,
K.A., Gullderson, T.P., LaRiviere, J., Stroynowski, Z., Takahashi. K. (2013).
Millennial-scale climate change and intermediate water circulation in the Bering
Sea from 90 ka ; A high-resolution record from IODP Site U1340.
Paleoceanography, doi:10.1029/2012PA002365.
Schmiedl, G., Pfeilsticker, M., Hemleben, C., and Mackensen, A. (2004). Environmental
and biological effects on the stable isotope composition of Recent deep-sea
benthic foraminifera from the Mediterranean Sea, Marine Micropaleontology, 51,
1-2, 129-152.
Schönfeld, J. (2006). Taxonomy and distribution of the Uvigerina peregrina plexus in the
tropical to Northeastern Atlantic. Journal of Foraminiferal Research, 36, 355-367.
Shackleton, N.J. (1974). Attainment of isotopic equilibrium between ocean water and the
benthonic foraminifera genus Uvigerina: isotopic changes in the ocean during the
last glacial. Les Méthodes Quantitatives Détude, Des Variations du Climat au
Cours du Pléistocéne, Colloques Internationaux du C.N.R.S., 219:203-209
Shackleton, N.J., Hall, M.A., Pate, D. (1995). Pliocene stable isotope stratigraphy of Site
846. Proceedings of the Ocean Drilling Program, Scientific Results, 138,
337-355.
Skinner, L.C., Shackleton, N.J. (2005). An Atlantic lead over Pacific deep-water change
across Termination I : Implications for the application of the marine isotope stage
stratigraphy, Quaternary Science Reviews, 24, 571-580.
Spero, H.J., Lea, D.W. (1996). Experimental determination of stable isotope variability in
Globigerina bulloides: implications for paleoceanographic reconstructions.

37
Marine Micropaleontology, 28, 231-246.
Stabeno, P.J., Schumacher, J.D., Ohtani, K. (1999). The physical oceanography of the
Bering Sea, in Loughlin, T.R., and Ohtani, K., eds., Dynamics of the Bering Sea:
A summary of Physical. Chemical, and Biological Characteristics, and a Synopsis
of the Bering Sea, North Pacific marine Science Organization (PICES),
University of Alaska Sea Grant, AK-SG-99-03, p. 1-28.
Sun, Y. and An, Z. (2005). Late Pliocene-Pleistocene changes in mass accumulation rates
of eolian deposits on the central Chinese Loess Plateau. Journal of Geophysical
Research, 110, D23101. doi:10.1029/2005JD006064.
Takahashi, K. (2005). The Bering Sea and paleoceanography. Deep-Sea Research II, 52,
16-18.
Takahashi, K., Ravelo, A. C., Alvarez-Zarikian. C. A., the Expedition 323 Scientists
(2011). Bering Sea Paleoceanography. Proc. IODP Exp. Rept., 323 Tokyo
(Integrated Ocean Drilling Program Management International, Inc.).
doi:10.2204/iodp.proc.323.2011.
Tanaka, S., Takahashi, K. (2005). Late Quaternary paleoceanographic changes in the
Bering Sea and the western subarctic Pacific based on radiolarian assemblages.
Deep-Sea Research II, 52, 2131-2149.
Teraishi, A., Suto, I., Onodera, J., Takahashi, K. (in press). Diatom, silicoflagellate and
ebridian biostratigraphy and paleoceanography in IODP 323 Hole U1343E at the
Bering Slope site. Deep-Sea Research II , available online 13 March, 2013,
http://dx.doi.org/10.1016/j.dsr2.2013.03.026i
Torrence, C., Compo, G.P. (1998). A Practical Guide to Wavelet Analysis. Bulletin of the

38
American Meteorological Society, 79, 1, 61-78.
Tziperman, E., Gildor, H. (2003). On the mid-Pleistocene transition to 100-kyr glacial
cycles and the asymmetry between glaciation and deglaciation times.
Paleoceanography, 18, 1001. doi: 10.1029/2001PA000627
Venti, N.L., Billups, K. (2012). Stable-isotope stratigraphy of the northwest Pacific
during the Pliocene-Pleistocene climate transition, Palaeogeography,
Palaeoclimatology, and Palaeoecology, 326-328:54-65.
Venti, N.L., Billups, K., and Herbert, T.D. (2013). Inceased sensitivity of the
Plio-Pleistocene northwest Pacific to obliquity forcing. Earth and Planetary
Science Letters, 384, 121-131.
Vergnaud Grazzini, C. (1976). Non-equilibrium isotopic compositions of shells of
planktonic foraminifera in the Mediterranean Sea. Palaeogeography,
Palaeoclimatology, Palaeoecology, 20, 263-276.
Zahn, R., Mix, A.C. (1991). Benthic foraminiferal �18O in the ocean's
temperature-salinity-density field: constraints on ice age thermohaline circulation.
Paleoceanography, 6, 1-20
Zhang, J.Z., Woodgate, R., Moritz, R. (2010). Sea ice response to atmospheric and
oceanic forcing in the Bering Sea. Journal of Physical Oceanography, 40,
1729-1747.

39
Figure captions
Figure 1. Map showing (a) the location of IODP Expedition 323 Site U1343 and other
drilled sites, the modern sea-ice edge in February (Cavalieri et al., 1996), and
surface water circulation, and (b) cross section of the passages along the Aleutian
Islands. Numbers in parenthesis are the model-calculated volume flux of
northward (positive) and southward (negative) flow at each passage (Kinney and
Maslowski, 2012). BSC: the Bering Slope Current, AS: the Alaskan Stream, SC:
the subarctic current. Note that corresponding numbers (1) to (7) in both map and
cross section indicate the location of major passages between the Bering Sea and
the North Pacific.
Figure 2. Correlation of the species-specific �18O offset between the six species of
benthic foraminfera and Elphidium batialis at Site U1343.
Figure 3. Plots of seven benthic foraminiferal �18O records at Site U1343 against
sediment depth. Note that panel (a) shows actual measured �18O values, whilst
panel (b) shows �18O records after a species-specific correction was applied
(derived from Fig. 2).
Figure 4. Depth-age plot showing the orbital-scale oxygen isotope stratigraphy (black
line) with biostratigraphic and paleomagnetic datums (diatom: Teraishi et al., in
press; other datums: Takahashi et al., 2011).
40
Figure 5. Comparison of the 2.4 Myrs records of (a) global stack curve “LR04” (Lisiecki
and Raymo, 2005) and composite oxygen isotope records of benthic foraminifera,
and 1.5-kyr running means of (b) magnetic susceptibility (MS) (c) natural
gamma-ray radiation (NGR), (d) gamma ray attenuation (GRA), (e) linear
sedimentation rate (LSR) at Site U1343. Note that all physical property data were
taken from Takahashi et al. (2011).
Figure 6. Blackman-Tukey spectra of (a) �18O, (b) GRA, (c) NGR, and (d) MS in
different time windows (all time intervals, 0-0.8 Ma, 0.8-1.2 Ma, and 1.2-2.4 Ma)
at Site U1343. Note that error bars are estimated with 80% confidence level.
Figure 7. Continuous wavelet transform of (a) LR04, (b) �18O, and (c) their coherency
(contours) and phase angle (arrows) at Site U1343. Note that thick black line
contours represent 90% confidence level by assuming the red noise as background
spectrum.
Figure 8. Band-pass filtered variability of LR04 and �18O, GRA, NGR, and MS at Site
U1343, in different time domains (a) 100-kyr and (b) 41 kyr.
Figure 9. Continuous wavelet transform of (a) GRA, (b) NGR, and (c) MS at Site U1343.
Note that black line contours represent 90% confidence level by assuming the red
noise (thick black line) and the white noise (dashed black line) as their
background spectrum.

41
Figure 10. Cross wavelet coherencies (contours) and phase angles (arrows) of (a) GRA,
(b) NGR, and (c) MS to �18O at Site U1343. Note that upward direction of arrows
indicate subjected data are in phase, whereas downward direction indicates out of
phase.
Figure 11. Coherencies (dotted line) and time differences (bar) between �18O and the
physical properties (GRA, NGR and MS) at eccentricity (100-kyr) and obliquity
(41-kyr) domain in the arbitrary time at Site U1343. Dash lines in coherency
columns represent 80, 90, 95, 99% confident level, respectively. Note that time
differences are only calculated when coherencies exceeded 80% confidence level.
Figure 12. Detailed comparison of the oxygen isotope stratigraphy (a and d) with the
physical properties (MS: b and f; NGR: c and g; and GRA: d and h) during 0-1.2
Ma (a-d) and 1.2-2.4 Ma (e-h).
Table 1. Species-specific offsets of �18O values to E. batialis at Site U1343, their
��18Owater-calcite, and their previously published ��18Owater-calcite (Basak et al., 2009;
Fontanier et al, 2008; McCorkle et al., 1997). Note that ��18Owater-calcite at Site
U1343 was estimated on the basis of the modern ��18Owater-calcite of G. pacifica in
the Aleutian Basin (Basak et al., 2009).
Appendix 1. Depth-age time of tie points at the Marine Isotope Stage (MIS) boundary at
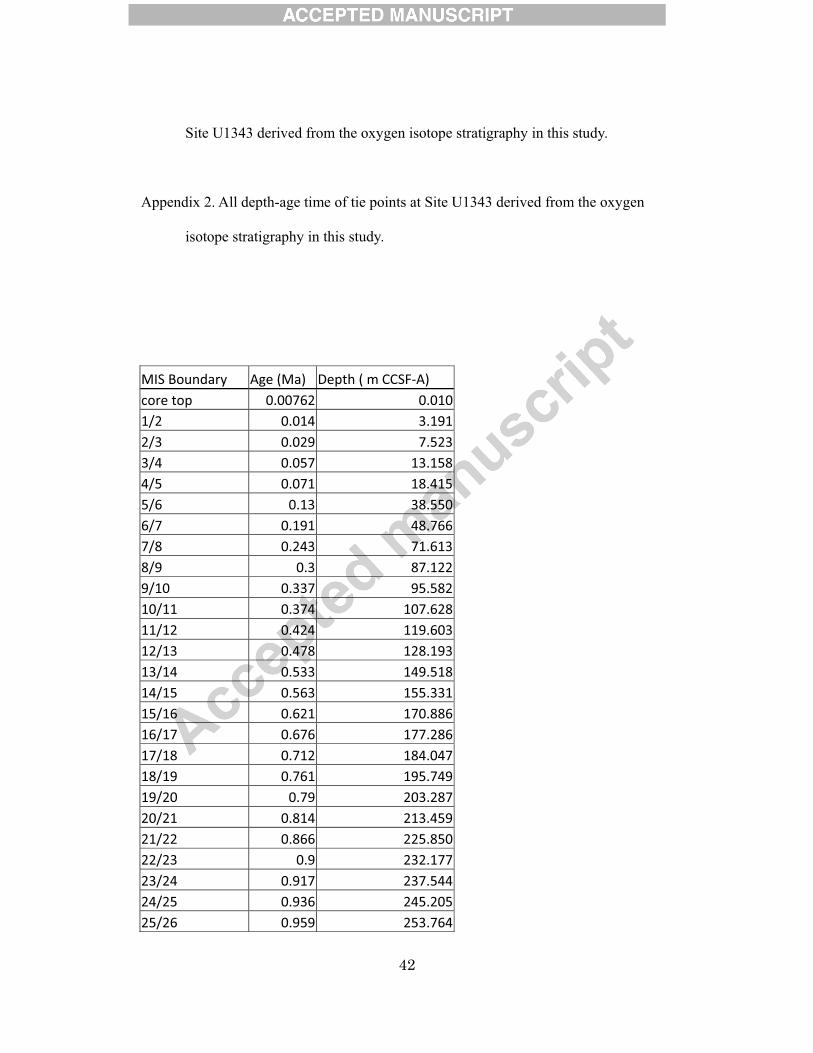
42
Site U1343 derived from the oxygen isotope stratigraphy in this study.
Appendix 2. All depth-age time of tie points at Site U1343 derived from the oxygen
isotope stratigraphy in this study.
MIS�Boundary��� Age�(Ma)� Depth�(�m�CCSF�A)�core�top� 0.00762� 0.0101/2� 0.014� 3.1912/3� 0.029� 7.5233/4� 0.057� 13.1584/5� 0.071� 18.4155/6� 0.13� 38.5506/7� 0.191� 48.7667/8� 0.243� 71.6138/9� 0.3� 87.1229/10� 0.337� 95.58210/11� 0.374� 107.62811/12� 0.424� 119.60312/13� 0.478� 128.19313/14� 0.533� 149.51814/15� 0.563� 155.33115/16� 0.621� 170.88616/17� 0.676� 177.28617/18� 0.712� 184.04718/19� 0.761� 195.74919/20� 0.79� 203.28720/21� 0.814� 213.45921/22� 0.866� 225.85022/23� 0.9� 232.17723/24� 0.917� 237.54424/25� 0.936� 245.20525/26� 0.959� 253.764

43
26/27� 0.97� 260.24327/28� 0.982� 265.36228/29� 1.014� 276.37129/30� 1.031� 284.26730/31� 1.062� 294.77031/32� 1.081� 304.12932/33� 1.104� 311.23433/34� 1.114� 317.40534/35� 1.141� 326.01635/36� 1.19� 338.11536/37� 1.215� 349.18637/38� 1.244� 360.71438/39� 1.264� 372.20239/40� 1.286� 382.43840/41� 1.304� 390.78641/42� 1.32� 398.14042/43� 1.344� 405.80743/44� 1.362� 411.48644/45� 1.383� 416.45745/46� 1.405� 421.55046/47� 1.424� 426.88647/48� 1.452� 432.70048/49� 1.469� 440.07349/50� 1.492� 445.91550/51� 1.51� 450.70551/52� 1.53� 455.40652/53� 1.5475� 462.09053/54� 1.57� 468.26054/55� 1.585� 472.95255/56� 1.608� 477.89356/57� 1.6285� 482.62257/58� 1.6425� 487.48558/59� 1.67� 495.94159/60� 1.6975� 505.49660/61� 1.715� 515.23961/62� 1.743� 526.05162/63� 1.758� 534.10663/64� 1.782� 539.49064/65� 1.8025� 543.962

44
65/66� 1.816� 547.23066/67� 1.826� 549.50367/68� 1.8325� 551.74868/69� 1.849� 554.59069/70� 1.8595� 557.60370/71� 1.875� 561.30471/72� 1.898� 566.70872/73� 1.915� 574.51973/74� 1.941� 583.87274/75� 1.965� 593.87575/76� 1.99� 604.08176/77� 2.017� 614.69177/78� 2.043� 627.14878/79� 2.088� 637.47579/80� 2.103� 645.17980/81� 2.125� 654.16781/82� 2.146� 664.93682/83� 2.168� 674.74283/84� 2.192� 683.41584/85� 2.2075� 692.96985/86� 2.236� 703.86686/87� 2.25� 713.94387/88� 2.273� 726.82888/89� 2.291� 739.12589/90� 2.309� 748.98390/91� 2.333� 759.46691/92� 2.35� 769.69792/93� 2.373� 779.42393/94� 2.387�N/A�

45
Age�(Ma)� Depth�(m�CCSF�A)�0.00762� 0.0100.01778� 3.8600.02032� 4.6300.03302� 7.7100.04572� 10.7890.04826� 11.5590.05080� 12.3290.05334� 13.0990.05588� 13.8690.05842� 14.6390.06096� 15.4090.06350� 16.1790.06604� 16.9490.06858� 17.7190.07874� 21.5690.08890� 25.4190.09906� 29.2690.10922� 33.1180.11176� 33.8880.11938� 35.4280.13208� 36.9680.14478� 38.5080.14986� 39.2780.15748� 40.8180.16764� 43.128

46
0.17018� 43.8980.18034� 47.7480.19050� 51.5970.20066� 55.4470.20320� 56.2170.21590� 59.2970.21844� 60.0670.22860� 63.9170.23876� 67.7670.24892� 71.6160.25146� 72.3860.25400� 73.1560.25654� 73.9260.25908� 74.6960.27178� 77.7760.27432� 78.5460.27686� 79.3160.27940� 80.0860.28194� 80.8560.28448� 81.6260.29718� 84.7060.30988� 87.7850.31242� 88.5550.31496� 89.3250.31750� 90.0950.32004� 90.8650.32258� 91.6350.32512� 92.4050.32766� 93.1750.33020� 93.9450.33274� 94.7150.34544� 97.7950.35814� 100.8750.36068� 101.6450.36322� 102.4150.36576� 103.1850.37592� 107.0340.38608� 110.8840.39624� 114.734
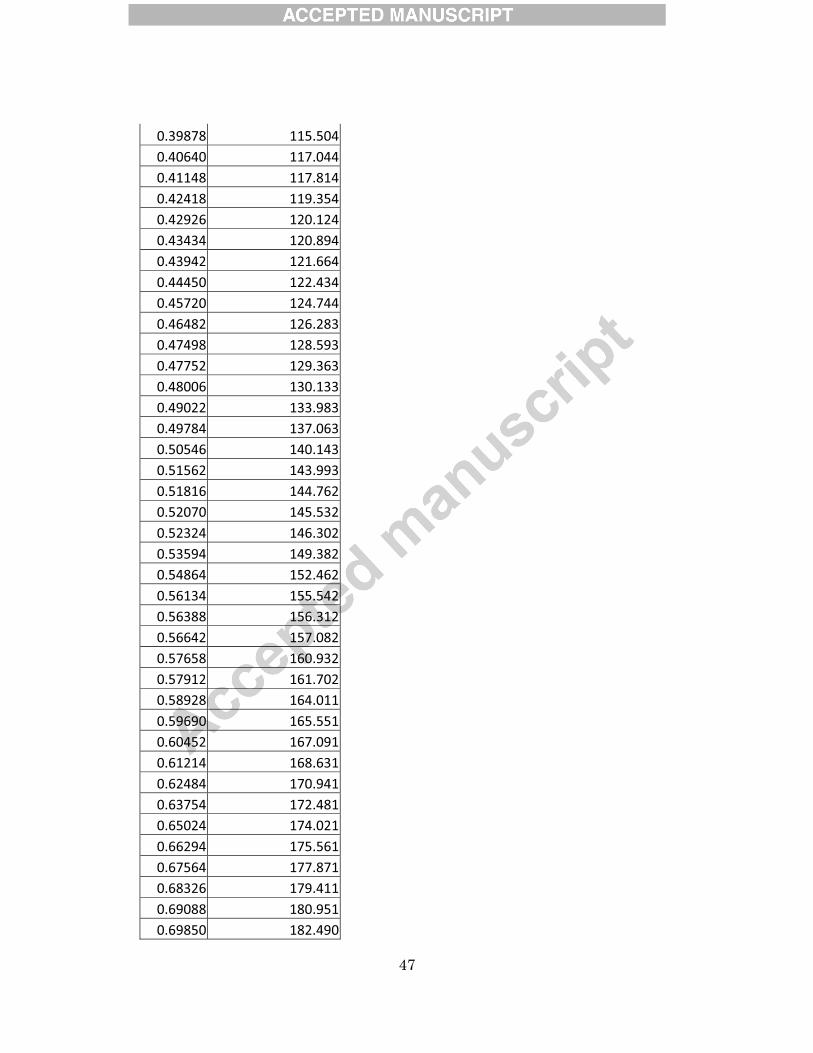
47
0.39878� 115.5040.40640� 117.0440.41148� 117.8140.42418� 119.3540.42926� 120.1240.43434� 120.8940.43942� 121.6640.44450� 122.4340.45720� 124.7440.46482� 126.2830.47498� 128.5930.47752� 129.3630.48006� 130.1330.49022� 133.9830.49784� 137.0630.50546� 140.1430.51562� 143.9930.51816� 144.7620.52070� 145.5320.52324� 146.3020.53594� 149.3820.54864� 152.4620.56134� 155.5420.56388� 156.3120.56642� 157.0820.57658� 160.9320.57912� 161.7020.58928� 164.0110.59690� 165.5510.60452� 167.0910.61214� 168.6310.62484� 170.9410.63754� 172.4810.65024� 174.0210.66294� 175.5610.67564� 177.8710.68326� 179.4110.69088� 180.9510.69850� 182.490
48
0.70612� 184.0300.71374� 185.5700.72644� 187.8800.73914� 190.1900.74676� 191.7300.75692� 194.0400.76962� 197.1200.77216� 197.8900.77470� 198.6600.77724� 199.4300.77978� 200.2000.78232� 200.9700.79248� 204.8190.79502� 205.5890.80772� 208.6690.81026� 209.4390.81280� 210.2090.82296� 214.0590.83312� 217.9090.84328� 221.7580.84582� 222.5280.85852� 225.6080.86614� 227.1480.87122� 227.9180.87630� 228.6880.88138� 229.4580.89408� 231.7680.90170� 233.3080.91186� 235.6180.91440� 236.3880.91694� 237.1580.92710� 241.0070.93472� 244.0870.93980� 246.3970.94488� 248.7070.94996� 251.0170.95504� 253.3270.96012� 255.6370.96520� 257.947

49
0.97028� 260.2560.97536� 262.5660.98044� 264.8760.98806� 267.9560.99822� 271.8061.00076� 272.5761.00330� 273.3461.00584� 274.1161.00838� 274.8861.01092� 275.6561.01346� 276.4261.01600� 277.1961.02616� 281.0451.03632� 284.8951.04394� 287.9751.04902� 290.2851.05410� 292.5951.05918� 294.9051.06426� 297.2151.07188� 300.2941.08204� 304.1441.09220� 307.9941.10236� 311.8441.11252� 315.6941.11506� 316.4641.11760� 317.2331.12014� 318.0031.12268� 318.7731.12522� 319.5431.12776� 320.3131.13030� 321.0831.13284� 321.8531.13538� 322.6231.13792� 323.3931.14046� 324.1631.14300� 324.9331.14554� 325.7031.14808� 326.4731.15062� 327.243

50
1.15316� 328.0131.15570� 328.7831.15824� 329.5531.16078� 330.3231.17094� 334.1731.17348� 334.9431.17602� 335.7131.17856� 336.4821.18110� 337.2521.18364� 338.0221.18618� 338.7921.18872� 339.5621.19126� 340.3321.19380� 341.1021.19634� 341.8721.19888� 342.6421.20904� 346.4921.21920� 350.3421.22682� 353.4221.23190� 355.7321.23952� 359.5811.24714� 363.4311.25476� 367.2811.26238� 371.1311.27000� 374.9801.27762� 378.8301.28524� 382.6801.29032� 384.9901.29540� 387.3001.30048� 389.6101.30810� 392.6901.31572� 395.7691.32588� 399.6191.33604� 403.4691.34620� 407.3191.34874� 408.0891.36144� 411.1691.37414� 414.2481.38684� 417.328

51
1.39954� 420.4081.41224� 423.4881.42494� 426.5681.43764� 429.6481.45034� 432.7271.45288� 433.4971.46304� 437.3471.47320� 441.1971.47574� 441.9671.47828� 442.7371.48082� 443.5071.49352� 446.5871.50622� 449.6671.51892� 452.7461.53162� 455.8261.53416� 456.5961.54432� 460.4461.55448� 464.2961.55702� 465.0661.55956� 465.8361.56210� 466.6061.56464� 467.3761.56718� 468.1461.57988� 471.2251.59258� 474.3051.60528� 477.3851.61798� 480.4651.63068� 483.5451.64338� 486.6251.64592� 487.3951.64846� 488.1651.65100� 488.9351.65354� 489.7051.66370� 493.5541.67386� 497.4041.68402� 501.2541.69418� 505.1041.70180� 508.1841.70942� 511.263

52
1.71450� 513.5731.72212� 517.4231.72974� 521.2731.73736� 525.1231.74244� 527.4331.75006� 530.5121.76022� 534.3621.76276� 535.1321.77546� 538.2121.78562� 540.5221.79578� 542.8321.80594� 545.1421.81610� 547.4521.82626� 549.7611.83642� 552.0711.84658� 554.3811.85674� 556.6911.86690� 559.0011.87706� 561.3111.88976� 564.3911.89230� 565.1611.89484� 565.9311.90500� 569.7801.91516� 573.6301.92278� 576.7101.93040� 579.7901.93802� 582.8701.94564� 585.9501.95326� 589.0291.96088� 592.1091.96850� 595.1891.97612� 598.2691.98374� 601.3491.99136� 604.4291.99898� 607.5082.00660� 610.5882.01422� 613.6682.02184� 616.7482.02946� 619.828
53
2.03708� 622.9082.04470� 625.9872.05232� 629.0672.06248� 632.9172.06502� 633.6872.07772� 636.7672.09042� 639.8472.09296� 640.6172.10312� 644.4662.11074� 647.5462.11582� 649.8562.12090� 652.1662.12852� 656.0162.13614� 659.8662.14376� 663.7152.15138� 667.5652.15646� 669.8752.16408� 672.9552.17170� 676.0352.17932� 679.1152.18694� 682.1952.19456� 685.2742.19964� 687.5842.20472� 689.8942.21234� 693.7442.21996� 697.5942.22758� 701.4432.23520� 705.2932.24282� 709.1432.25044� 712.9932.25806� 716.8432.26060� 718.3832.26568� 722.2322.27076� 726.0822.27584� 729.9322.28092� 733.7822.28346� 735.3222.29108� 739.1722.29870� 743.021

54
2.30632� 746.8712.31394� 750.7212.32156� 754.5712.32918� 758.4212.33680� 762.2702.34442� 766.1202.35204� 769.970

0
1000
2000
300040005000
������ ���� �����
���� ��� �� �������������
����� ����� ����������������
����� !���" ##�������������
$��%������ �" ##�����������&�
��'� ��" ##��������������
(��%���� �" ##���&(�������(�
���� � ' �" ##����$���������
)�* ��" ##��������������
%��� *�" ##��������������
&��)*�� ��" ##��������������
+6000
+6000
+����
������ ���� �����
(����
�����
U1339
U1344
U1342
U1345
U1341 U1340
U1343
� �
�� �
� �
"�*
*�#�
��,��� % #�
% #� *�-.��
�#���*��, ������
-.������%�
����*'��� -.��
�C
��
/�
o!��*�#� ������!'��
����*'��� ���� 7
% ���� *� #�*
)�* �" �� �
Fig. 1 Asahi et al
�ow��#�R�!'�
�
,�
8�:
���
��
(1)(1)
(2)
(3)(4)
&�
(6)(5)

U. senticosa
N. labradoricaG. pacifica
Cibicidoides spp.
U. bifurcata
P. wuellerstorfi
Fig. 2. Asahi et al
2
3
4
5
6
2 3 4 5 6 �18O (‰) of Elphidium batialis
�18
O (
‰)
of b
enth
ic fo
ram
inife
ra

2.0
3.0
4.0
5.0
010
020
030
040
050
060
070
080
0
2.0
3.0
4.0
5.0
010
020
030
040
050
060
070
080
0
Dep
th (
m C
CS
F-A
)
Dep
th (
m C
CS
F-A
)
�18O (‰ VPDB)�18O (‰ VPDB)
E. b
atia
lis
G. p
acifi
ca
U. s
entic
osa
Cib
icid
oide
s sp
p.
P. w
uelle
rsto
rfi
U. b
ifurc
ata
N. l
abra
doric
a
com
posi
te �
18O
Fig
. 3. A
sahi
et a
l.
(a)
befo
re o
ffset
cor
rect
ion
(b)
afte
r of
fset
cor
rect
ion

0
100
200
300
400
500
600
700
8000.0 0.5 1.0 1.5 2.0 2.5 3.0
Dep
th (
m C
CS
F-A
)
Age (Ma)
Diatom
Silicoflagellata
EbridiansDinoflagellata
Calcareous nanoplanktonPaleo magnetism
Radiolarian
Fig. 4. Asahi et al.
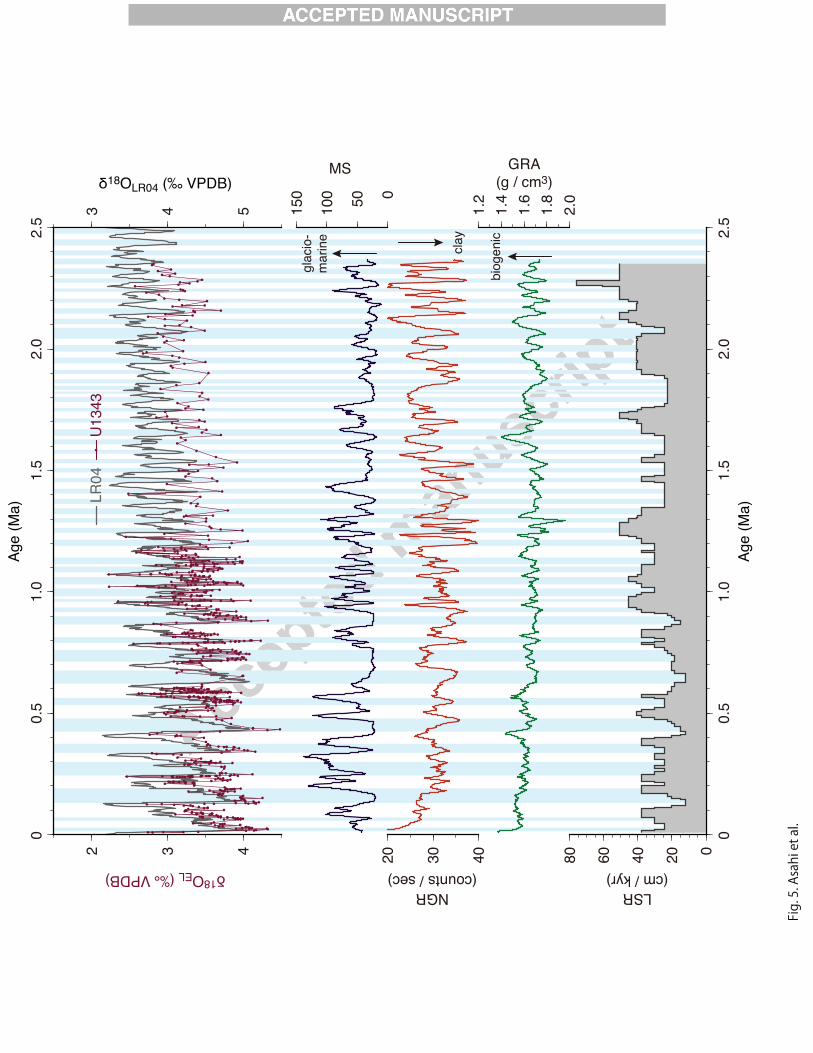
NGR(counts / sec)
GRA(g / cm3)
MSLSR
(cm / kyr)�18OEL (‰ VPDB)�18OLR04 (‰ VPDB)
clay
biog
enic
glac
io-
mar
ine
LR04
U13
43
Age
(M
a)
Age
(M
a)
Fig. 5. Asahi et al.
00.
51.
01.
52.
02.
5020406080
1.2
1.4
1.6
1.8
2.0
20 30 40
050100
150
3 4 5
00.
51.
01.
52.
02.
5
2 3 4
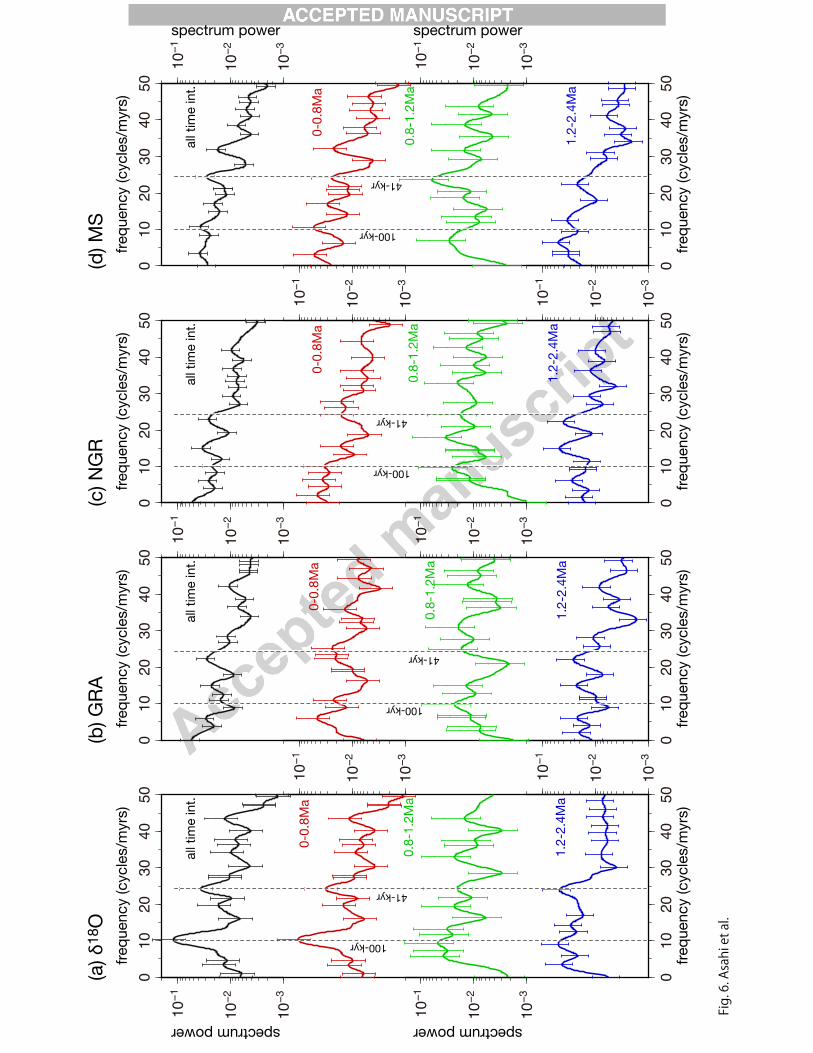
010
2030
4050
010
2030
4050
10��
10��
10��
10��
10��
10��
10��
10��
10��
10��
10��
10��
010
2030
4050
010
2030
4050
10��
10��
10��
10��
10��
10��
010
2030
4050
010
2030
4050
10��
10��
10��
10��
10��
10��
010
2030
4050
010
2030
4050
10��
10��
10��
10��
10��
10��
freq
uenc
y (c
ycle
s/m
yrs)
freq
uenc
y (c
ycle
s/m
yrs)
all t
ime
int.
0-0.
8Ma
0.8-
1.2M
a
1.2-
2.4M
a
spectrum powerspectrum power
(a) δ
18O
100-kyr
41-kyr
100-kyr
41-kyr
freq
uenc
y (c
ycle
s/m
yrs)
freq
uenc
y (c
ycle
s/m
yrs)
all t
ime
int.
0-0.
8Ma
0.8-
1.2M
a
1.2-
2.4M
a
(b) G
RA
freq
uenc
y (c
ycle
s/m
yrs)
freq
uenc
y (c
ycle
s/m
yrs)
all t
ime
int.
0-0.
8Ma
0.8-
1.2M
a
1.2-
2.4M
a
(c) N
GR
100-kyr
41-kyr
freq
uenc
y (c
ycle
s/m
yrs)
freq
uenc
y (c
ycle
s/m
yrs)
all t
ime
int.
0-0.
8Ma
0.8-
1.2M
a
1.2-
2.4M
a
spectrum powerspectrum power
(d) M
S
100-kyr
41-kyr
Fig. 6. Asahi et al.

0.0
0.5
1.0
0 0.5 1.0 1.5 2.0
0 0.5 1.0 1.5 2.0
0 0.5 1.0 1.5 2.0
0 0.5 1.0 1.5 2.0
100
10
40
200
100
10
40
200(a) LR04
(c) coherency and phase angle
Age (Ma)
Age (Ma)
cycl
e le
ngth
(ky
r)cy
cle
leng
th (
kyr)
cycl
e le
ngth
(ky
r)
coherency
Fig. 7. Asahi et al.
100
10
40
200
leadslagsin-phase
out-phase
0.001
0.01
0.1
1
10
100power
����18O

0 0.5 1.0 1.5 2.0 2.5
0 0.5 1.0 1.5 2.0 2.5
����
0.0
1.0
����
0.0
1.0
����
0.0
1.0
����
0.0
1.0
����
0.0
1.0
����
0.0
1.0
(a) 100-kyr band-pass filter
(b) 41-kyr band-pass filter
LR04 �18O
LR04 �18O
NGR
MS
MS
GRA
NGR GRA
Age (Ma)
Age (Ma)
100-
kyr
band
-pas
s100-kyr band-pass
41-kyr band-pass41-kyr band-pass
100-
kyr
band
-pas
s41
-kyr
ban
d-pa
ss
Fig. 8. Asahi et al

0 0.5 1.0 1.5 2.0
0 0.5 1.0 1.5 2.0
0 0.5 1.0 1.5 2.0
0 0.5 1.0 1.5 2.0
100
10
40
200
100
10
40
200
Age (Ma)
Age (Ma)
cycl
e le
ngth
(ky
r)cy
cle
leng
th (
kyr)
cycl
e le
ngth
(ky
r)
0.001
0.01
0.1
1
10
100power
Fig. 9. Asahi et al.
100
10
40
200
(a) GRA
(b) NGR
(c) MS
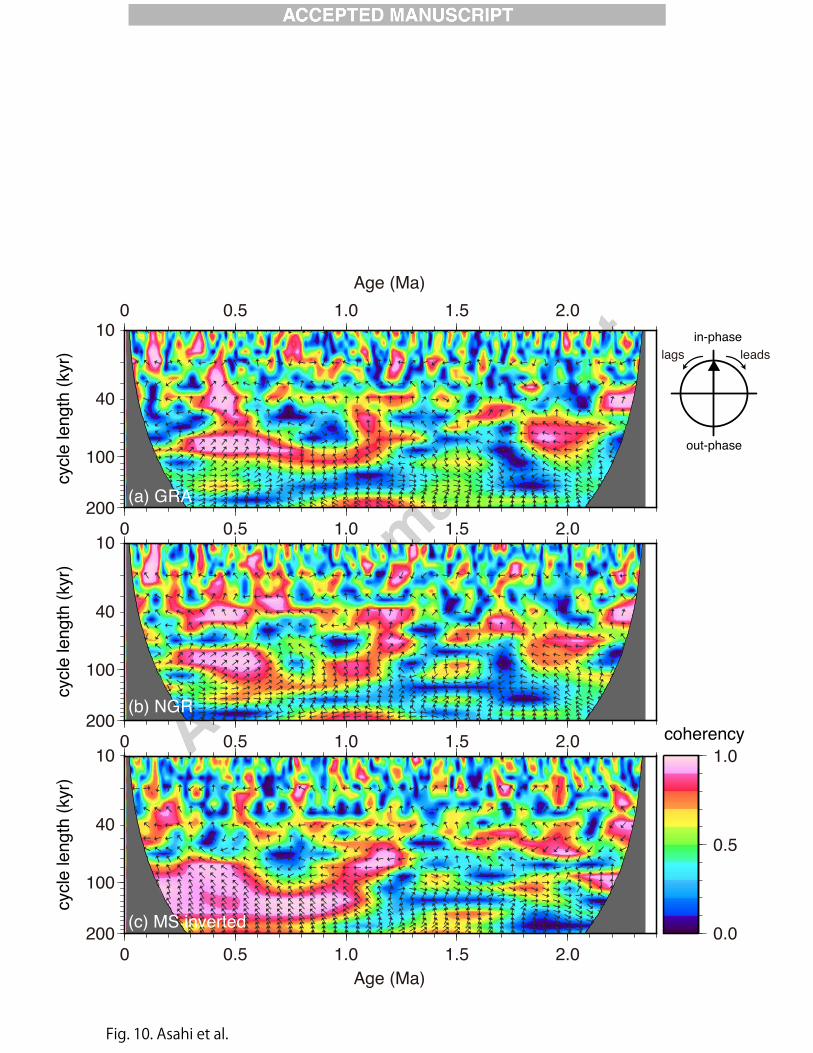
0 0.5 1.0 1.5 2.0
0 0.5 1.0 1.5 2.0
0 0.5 1.0 1.5 2.0
0 0.5 1.0 1.5 2.0
0.0
0.5
1.0
100
10
40
200
100
10
40
200
(b) NGR
(c) MS inverted
(a) GRA
Age (Ma)
Age (Ma)
cycl
e le
ngth
(ky
r)cy
cle
leng
th (
kyr)
cycl
e le
ngth
(ky
r)
coherency
Fig. 10. Asahi et al.
100
10
40
200
leadslagsin-phase
out-phase

���
���
���������������
��
��
���
���
���������������
��
��
��
��
��
���
���
�������������
���
���
���������������
��
��
all time range����������
�������� �������������
������ ���������������
��������� �������������
all time range����������
�������� �������������
������ ���������������
��������� �������������
99%
���
���
���
99%
���
���
���
����������
����
�����
NG
R
all time range����������
�������� �������������
������ ���������������
��������� �������������
all time range����������
�������� �������������
������ ���������������
��������� �������������
�������������������
����
�� �
��O
�������
���
O
� ������
99%
���
���
���
99%
���
���
���
����������
����
�����
�
���!�����
all time range����������
�������� �������������
������ ���������������
��������� �������������
all time range����������
�������� �������������
������ ���������������
��������� �������������
�������������������
����
�� ��
��O
�������
���
O
� ������
99%
���
���
���
99%
���
���
���
����������
����
�����
GR
A
"��#���
����$����
�����������!�����

1.5 2.0
1.0
1.5
2.0
10
20
30
40
50
0
100
200
2
3
4
1.5 2.0
3
4
5
0.0 0.5 1.0
1.0
1.5
2.0
10
20
30
40
50
0
100
200
2
3
4
0.0 0.5 1.0
3
4
5
NG
R(c
ount
s / s
ec)
GR
A(g / cm
3)M
S(S
I unit)
%18
OE
L(‰
)%
18OLR
04(‰
)%
18OLR
04(‰
)
(a)
(e)
(f)
(b)
(c)
(d)
LR04 U1343
NG
R(c
ount
s / s
ec)
GR
A(g / cm
3)M
S(S
I unit)
%18
OE
L(‰
)
LR04 U1343
Age (Ma)
Age (Ma)
Age (Ma)Fig. 12. Asahi et al.
(g)
(h)
100-kyr world transition
41-kyr world

ofse
ts*
(st
dev
)n
Δ δ18
Ow
ater
-cal
cite
**Δ
δ18O
wat
er-c
alci
te(
stde
v)
Reg
ion
Δ δ18
Ow
ater
-cal
cite
(st
dev
)R
egio
nC
ibic
idoi
des s
pp.
0.49
(0.
32)
36-0
.15
-0.9
1(
0.11
)Pa
cific
-0.6
7(
0.36
)A
tlant
ical
l Cib
icid
oide
sM
cCor
kle
et a
l. (1
997)
-0.0
1(
0.11
)Pa
cific
0.17
(0.
32)
Atla
ntic
G. a
ffini
s/pa
cific
aM
cCor
kle
et a
l. (1
997)
0.21
Ale
utia
n B
asin
G. p
acifi
caB
asak
et a
l. (2
009)
-0.0
4N
. Atla
ntic
Glo
bobu
limin
a sp
p.Fo
ntan
ier e
t al.
(200
6)E.
bat
ialis
0(
N/A
)N
/A-0
.65
N/A
N/A
N/A
N/A
N. l
abra
dori
ca0.
65(
0.27
)91
0.00
-0.0
1(
0.20
)A
tlant
icF.
labr
ador
ica
McC
orkl
e et
al.
(199
7)-0
.09
(0.
07)
Paci
fic-0
.12
(0.
09)
Atla
ntic
U. p
ereg
rina
McC
orkl
e et
al.
(199
7)-0
.37
N. A
tlant
icU
. per
egri
naFo
ntan
ier e
t al.
(200
6)U
. sen
ticos
a0.
82(
0.22
)61
0.17
N/A
N/A
N/A
N/A
P. w
uelle
rsto
rfi
-0.1
5(
0.03
)2
-0.8
0-0
.90
(0.
11)
Paci
ficC
. wue
lfsto
riM
cCor
kle
et a
l. (1
997)
*: c
alcu
late
d ba
sed
on th
e sp
ecie
-sep
cific
offs
et to
E. b
atia
ris
**: c
alcu
late
d ba
sed
on th
e m
oder
n Δ
δ18O
wat
er-c
alci
te o
f G. p
acifi
ca a
t the
Ale
utia
n B
asin
(Bas
ak e
t al.,
200
9)
Tabl
e 1
Asa
hi e
t al
G. p
acifi
ca0.
86(
0.21
)
U. b
ifurc
ata
0.83
(0.
25)
0.18
sp. n
ame
refe
renc
e
This
stud
yPu
blis
hed
data
offs
ets t
o bo
ttom
wat
er (‰
VPD
B)
53
offs
ets t
o E.
bat
ialis
(‰ V
PDB
)
147
0.21