Oracle Performance Tuning Boot Camp: 10 New Problem ... · PDF fileOracle Performance Tuning...
52
Copyright © 2012, Oracle and/or its affiliates. All rights reserved. Insert Information Protection Policy Classification from Slide 13 1 Oracle Performance Tuning Boot Camp: 10 New Problem- Solving Tips Using ASH & AWR Graham Wood Architect
Transcript of Oracle Performance Tuning Boot Camp: 10 New Problem ... · PDF fileOracle Performance Tuning...

Copyright © 2012, Oracle and/or its affiliates. All rights reserved. Insert Information Protection Policy Classification from Slide 13 1
Oracle Performance Tuning Boot Camp: 10 New Problem-Solving Tips Using ASH & AWR
Graham Wood
Architect

Copyright © 2012, Oracle and/or its affiliates. All rights reserved. Insert Information Protection Policy Classification from Slide 13 2
3 types of Performance Management
Reactive Performance Management
Proactive Performance Management
Preventive Performance Management

Copyright © 2012, Oracle and/or its affiliates. All rights reserved. Insert Information Protection Policy Classification from Slide 13 3

Copyright © 2012, Oracle and/or its affiliates. All rights reserved. Insert Information Protection Policy Classification from Slide 13 4
Reactive Performance Management
1.Comparing Performance Across Two Time Periods
2. Database Hang Analysis
3.SQL Performance Analysis

Copyright © 2012, Oracle and/or its affiliates. All rights reserved. Insert Information Protection Policy Classification from Slide 13 5
Comparing Performance Across Two Periods
Inconsistent Performance
– Over utilization of system resources
– High load ad hoc query consuming resources
– Change in execution plan of query
– Parallel execution downgrade
Performance was fine yesterday, today my
application is really slow ?

Copyright © 2012, Oracle and/or its affiliates. All rights reserved. Insert Information Protection Policy Classification from Slide 13 6
Compare Period ADDM
• Full ADDM analysis across two AWR snapshot periods
• Detects causes, measure effects, then correlates them
• Causes: workload changes, configuration changes
• Effects: regressed SQL, reach resource limits (CPU, I/O, memory, interconnect)
• Makes actionable recommendations along with quantified impact
AWR Snapshot
Period 1
AWR Snapshot
Period 2 Analysis Report Compare
Period ADDM
SQL Commonality
Regressed SQL
I/O Bound
Undersized SGA

Copyright © 2012, Oracle and/or its affiliates. All rights reserved. Insert Information Protection Policy Classification from Slide 13 7
• 30% smaller Buffer cache
• 10% new SQL
Compare Period ADDM: Method
Identify what changed • Configuration changes, workload
changes
Quantify performance differences
• Uses DB Time as basis for measuring performance
Identify root cause • Correlate performance
differences with changes
• Top SQL increased 45%
• Read I/O up 55%
• Buffer cache reduction
caused read I/O increase

Copyright © 2012, Oracle and/or its affiliates. All rights reserved. Insert Information Protection Policy Classification from Slide 13 8
Reactive Performance Management
1.Comparing Performance Across Two Time Periods
2.Database Hang Analysis
3.SQL Performance Analysis
Compare Period ADDM

Copyright © 2012, Oracle and/or its affiliates. All rights reserved. Insert Information Protection Policy Classification from Slide 13 9
Database Hang Analysis
Database Hung state
– Blocking Sessions
– Memory allocation issues
– Library cache issues
– Unresponsive Storage (ASM)
– Interconnect problems
My database has hung ? I do not want to
bounce it again

Copyright © 2012, Oracle and/or its affiliates. All rights reserved. Insert Information Protection Policy Classification from Slide 13 10
Real-Time ADDM – Architecture
Enterprise
Manager
EM Agent
JDBC Connection
Diagnostic Connection
Database
ADDM
Analysis
Hangs
Latches
Deadlocks
• Uses a pre-established diagnostic connection for unresponsive systems
• Initiates a standard JDBC connection for real-time analysis
• Diagnostic connection collects data without holding latches or running SQL
• First intelligent advisor to diagnose problems in real-time as they occur, no matter
how sick the system is
Real time analysis
Unresponsive DB

Copyright © 2012, Oracle and/or its affiliates. All rights reserved. Insert Information Protection Policy Classification from Slide 13 11
Real-Time ADDM
• Real-time analysis of hung or slow database systems
• Holistically identify global resource contentions and deadlocks
• Quantified performance impact
• Precise, actionable recommendations
• Provide cluster-wide analysis for RAC

Copyright © 2012, Oracle and/or its affiliates. All rights reserved. Insert Information Protection Policy Classification from Slide 13 12
Reactive Performance Management
1.Comparing Performance Across Two Time Periods
2.Database Hang Analysis
3.SQL Performance Analysis
Compare Period ADDM
Real-Time ADDM

Copyright © 2012, Oracle and/or its affiliates. All rights reserved. Insert Information Protection Policy Classification from Slide 13 13
SQL Performance Analysis
I enabled parallel query, yet this query is taking
so long. Can you take a look ?
Parallel Downgrades
– Uncontrolled parallel execution
– Parallel Server availability
– Object level settings
– Session level settings

Copyright © 2012, Oracle and/or its affiliates. All rights reserved. Insert Information Protection Policy Classification from Slide 13 14
Real-Time SQL Monitoring Insert executed with parallel hint.

Copyright © 2012, Oracle and/or its affiliates. All rights reserved. Insert Information Protection Policy Classification from Slide 13 15
Real-Time SQL Monitoring Parallel Tab
• Parallel Coordinator busy for the entire duration !!

Copyright © 2012, Oracle and/or its affiliates. All rights reserved. Insert Information Protection Policy Classification from Slide 13 16
Real-Time SQL Monitoring Enabled Parallel DML
• Parallel Slaves busy for the entire duration !!!

Copyright © 2012, Oracle and/or its affiliates. All rights reserved. Insert Information Protection Policy Classification from Slide 13 17
Reactive Performance Management
1.Comparing Performance Across Two Time Periods
2.Database Hang Analysis
3.SQL Performance Analysis
Compare Period ADDM
Real-Time ADDM
SQL Monitoring

Copyright © 2012, Oracle and/or its affiliates. All rights reserved. Insert Information Protection Policy Classification from Slide 13 18

Copyright © 2012, Oracle and/or its affiliates. All rights reserved. Insert Information Protection Policy Classification from Slide 13 19
Proactive Performance Management
4.Proactively Monitoring Long Running Programs
5.Analyzing Transient Performance Problems
Understanding Workload Profile
6. Correlating ASH & AWR
7. Using ASH Analytics

Copyright © 2012, Oracle and/or its affiliates. All rights reserved. Insert Information Protection Policy Classification from Slide 13 20
Reactive Tracing of long running programs ? Can you trace my program ?
What is wrong with tracing ?
– A very reactive way of looking at problems
– Overhead of writing data to trace files
– Programs we want to trace are usually the ones
with issues
– Impacts the performance of the production
system

Copyright © 2012, Oracle and/or its affiliates. All rights reserved. Insert Information Protection Policy Classification from Slide 13 21
Real Time Database Operation Monitoring
Database Operation (DBOPs)
– Simple DBOP (already supported in 11g)
A SQL statement (e.g. SQL for DSS, batch/report SQL, runaway SQL)
A PL/SQL procedure/function
– Composite (new in 12g)
Session(s) activity between two points of time defined by application code / DBA
For example, SQL*Plus script, batch job, ETL processing, …
At most one DBOP per DB session
NEW

Copyright © 2012, Oracle and/or its affiliates. All rights reserved. Insert Information Protection Policy Classification from Slide 13 22
– Naming or Tagging
– Bracketing
Naming a Database Operation
BEGIN_OPERATION
END_OPERATION
SQL
PL/SQL Blocks
…
SQL
SQL
EXPLICIT
SQL
PL/SQL Blocks
…
SQL
SQL
DBOP (Tag)
IMPLICIT

Copyright © 2012, Oracle and/or its affiliates. All rights reserved. Insert Information Protection Policy Classification from Slide 13 23
Database monitoring of application jobs
– Grouping of SQLs, sessions for the application job
– Key scenarios: ETL operations, Quarter End Close job
Real time monitoring driven by application specified tagging
– Automatically tag Data pump jobs
– Tagging ability in PLSQL, OCI, JDBC
Avoids the overhead of SQLTrace
Visibility of Top SQL statements, system and session performance metrics
Real Time Database Operations Monitoring

Copyright © 2012, Oracle and/or its affiliates. All rights reserved. Insert Information Protection Policy Classification from Slide 13 24
Proactive Performance Management
4.Reactive Tracing of Long Running Programs
5.Analyzing Transient Performance Problems
Understanding Workload Profile
• 6. Correlating ASH & AWR
• 7. Using ASH Analytics
Database Operations

Copyright © 2012, Oracle and/or its affiliates. All rights reserved. Insert Information Protection Policy Classification from Slide 13 25
Analyzing Transient Performance Problems
What happened last night the batch job took
twice the time to finish ?
No way to detect transient issues
– We look at AWR data
Averaged out over the snapshot window
– On-disk ASH Data
Sampled every 10 seconds
– Very difficult to detect such issues in the “past”

Copyright © 2012, Oracle and/or its affiliates. All rights reserved. Insert Information Protection Policy Classification from Slide 13 26
Automatic Performance Diagnostics A
DD
M
• Diagnose persistent performance issues
• Uses AWR snapshots
• Regular interval
• Automatic or Manual C
om
pare
Period A
DD
M
• Coarse grain performance comparison across two periods
• Relies on AWR data
• Manual
Real-
Tim
e A
DD
M
• Hung or extremely slow databases
• Uses a normal and diagnostic mode connection
• Manual
Enha
nced R
eal-
Tim
e A
DD
M
• Proactively detect and diagnose transient high-impact problems
• Built inside the database
• Automatic
• Runs every 3 seconds
NEW

Copyright © 2012, Oracle and/or its affiliates. All rights reserved. Insert Information Protection Policy Classification from Slide 13 27
Automatic real time problem detection and analysis
– Looks for triggering conditions every 3 seconds
Database self-monitors for serious performance issues
– Recognize bad performance trends and trigger analysis :
High CPU, I/O spikes, memory, interconnect, hangs, deadlocks
– Identify a problem before it threatens application performance
Short duration (5 min spikes) ADDM analysis
– Actionable advice for critical issues
– Richer data set available for analysis
Reports (analysis and data) stored in AWR for historical analysis
– ADDM, SQL Monitoring reports
Real-Time ADDM NEW

Copyright © 2012, Oracle and/or its affiliates. All rights reserved. Insert Information Protection Policy Classification from Slide 13 28
Triggering Conditions
# Rule Condition
1 High Load Average active sessions greater than 3 times the number of CPU cores
2 I/O bound Impact on active sessions based on single block read performance
3 CPU bound Active sessions greater than 10% of total load and CPU utilization great
than 50%
4 Over-allocated
memory
Allocation over 95% of physical memory
5 Interconnect bound Single block interconnect transfer time based
6 Session Limit Session limit close to 100%
7 Process Limit Process limit close to 100%
8 Hung Session Significant number of hung sessions. If this number is greater than 10%
of total sessions
9 Deadlock Detected Any deadlock detected by hang analyzer

Copyright © 2012, Oracle and/or its affiliates. All rights reserved. Insert Information Protection Policy Classification from Slide 13 29
Real-Time ADDM Report

Copyright © 2012, Oracle and/or its affiliates. All rights reserved. Insert Information Protection Policy Classification from Slide 13 30
Proactive Performance Management
4.Reactive Tracing of Long Running Programs
5.Analyzing Transient Performance Problems
Understanding Workload Profile
6. Correlating ASH & AWR
7. Using ASH Analytics
Database Operations
Real-Time ADDM

Copyright © 2012, Oracle and/or its affiliates. All rights reserved. Insert Information Protection Policy Classification from Slide 13 31
Understanding Workload Profile The SQL Response Metric crossed the warning
threshold. What is wrong?
Several factors can impact SQL Response time
– Increased or unusual load on system
– Hardware Issues
– Runaway queries consuming system resources
– Changes in execution plans
– Missing or stale object statistics
Need a mechanism to quickly analyze in-memory
performance data

Copyright © 2012, Oracle and/or its affiliates. All rights reserved. Insert Information Protection Policy Classification from Slide 13 32
DB Response time analysis - AWR
AWR top 5 section
shows the Wait Class
which contributes most
to DB wait time
Objects involved in TX row lock
contention can be identified in
Segment Statistics section of AWR
Foreground Wait Class section in
AWR to see distribution of DB waits
over Waits classes

Copyright © 2012, Oracle and/or its affiliates. All rights reserved. Insert Information Protection Policy Classification from Slide 13 33
From AWR to ASH
ASH report for the
period of increase
of Application waits
will show the same
waits as AWR
Can I get the Application
Module which suffered
from this type of
contention ?

Copyright © 2012, Oracle and/or its affiliates. All rights reserved. Insert Information Protection Policy Classification from Slide 13 34
Extracting more data from ASH
Identify SQL statements and sessions impacted by waits on
“Application” Wait Class

Copyright © 2012, Oracle and/or its affiliates. All rights reserved. Insert Information Protection Policy Classification from Slide 13 35
Extracting more data from ASH
Get a list of blocking sessions and DB objects !

Copyright © 2012, Oracle and/or its affiliates. All rights reserved. Insert Information Protection Policy Classification from Slide 13 36
Understanding Workload Profile: ASH Analytics
• Graphical ASH report for advanced analysis
• Provides visual filtering for recursive drill-downs
• Select any time period for analysis
• Analyze performance across many dimensions
• Different visualizations: Stacked chart or
Tree Map
• Collaborate with others using Active
Reports

Copyright © 2012, Oracle and/or its affiliates. All rights reserved. Insert Information Protection Policy Classification from Slide 13 37
Proactive Performance Management
4.Reactive Tracing of Long Running Programs
5.Analyzing Transient Performance Problems
Understanding Workload Profile
6. Correlating ASH & AWR
7. Using ASH Analytics
Database Operations
Real-Time ADDM
AWR & ASH Reports
ASH Analytics

Copyright © 2012, Oracle and/or its affiliates. All rights reserved. Insert Information Protection Policy Classification from Slide 13 38

Copyright © 2012, Oracle and/or its affiliates. All rights reserved. Insert Information Protection Policy Classification from Slide 13 39
Preventive Performance Management
8.Prevent Regression After Upgrade
9.Ensure Optimal Resource Allocation
10.Prevent Performance Issues Due To Application Changes

Copyright © 2012, Oracle and/or its affiliates. All rights reserved. Insert Information Protection Policy Classification from Slide 13 40
SQL Tuning Challenges Change Causing Problems
Situation
– New SQL statements added as part of application patch deployment
– Database upgrades
– Database patching
Response
– Users: “How will the application perform after the changes?”
– DBA: “How do I ensure that our SLA remains intact after the changes are
rolled out?”
Challenge
– How to reduce business risk while absorbing new technologies?
Copyright © 2012, Oracle and/or its affiliates. All rights reserved. Insert Information Protection Policy Classification from Slide 13 41
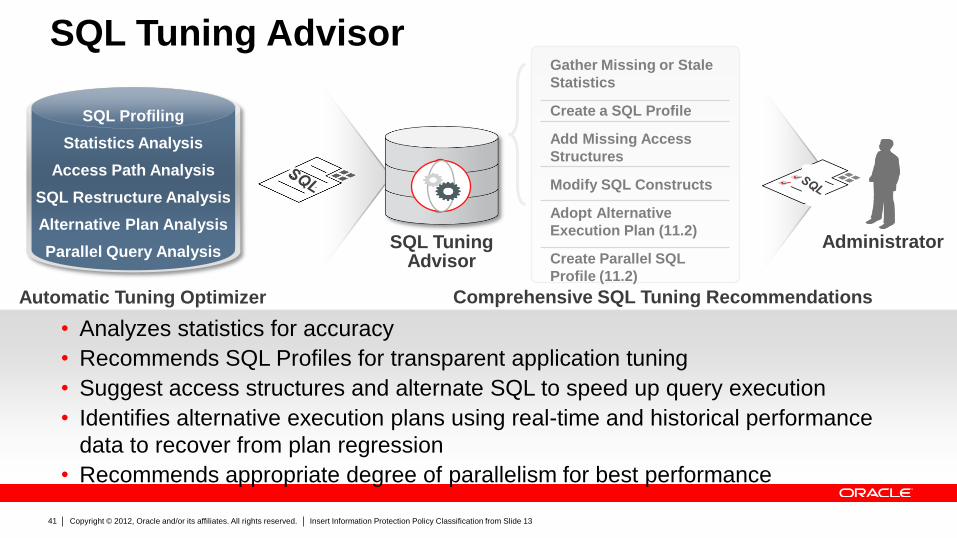
SQL Tuning Advisor
• Analyzes statistics for accuracy
• Recommends SQL Profiles for transparent application tuning
• Suggest access structures and alternate SQL to speed up query execution
• Identifies alternative execution plans using real-time and historical performance
data to recover from plan regression
• Recommends appropriate degree of parallelism for best performance
SQL Profiling
Statistics Analysis
Access Path Analysis
SQL Restructure Analysis
Alternative Plan Analysis
Parallel Query Analysis
Automatic Tuning Optimizer
Administrator
Comprehensive SQL Tuning Recommendations
Gather Missing or Stale
Statistics
Create a SQL Profile
Add Missing Access
Structures
Modify SQL Constructs
Adopt Alternative
Execution Plan (11.2)
Create Parallel SQL
Profile (11.2)
SQL Tuning Advisor

Copyright © 2012, Oracle and/or its affiliates. All rights reserved. Insert Information Protection Policy Classification from Slide 13 42
Preventive Performance Management
8.Prevent Regression After Upgrade
9.Ensure Optimal Resource Allocation
10.Prevent Performance Issues Due To Application Changes
SQL Tuning Advisor

Copyright © 2012, Oracle and/or its affiliates. All rights reserved. Insert Information Protection Policy Classification from Slide 13 43
Ensure Optimal Resource Allocation
In a consolidated environment how can I
ensure one database is not running away with
all my system resources ?
Database resource manager directives prevent
a single session to run away with all resources
In DB 12c CDB level resource plans ensure
optimal resource allocations across PDBs
Create a resource allocation strategy
Allocate appropriate CPU and I/O (Exadata)
across PDBs

Copyright © 2012, Oracle and/or its affiliates. All rights reserved. Insert Information Protection Policy Classification from Slide 13 44
Allocating Resources in DB 12c
• Gives maximum flexibility for each PDB
• Allows any PDB to consume all available resource
• Risky as one PDB can run away with all resources.
No Resource Allocation
• Ensures all PDBs get a specific share of the resources
• Allows any PDB to consume any unused resources
• Kicks in at 100% resource utilization.
• Assumes that not all PDBs will use its allocated resources
Specify a minimum allocation
• Ensures all PDBs get a specific share of the resources
• Prevents a PBD from taking more than the maximum value assigned.
• May result in unused capacity
Specify a minimum and maximum
NEW

Copyright © 2012, Oracle and/or its affiliates. All rights reserved. Insert Information Protection Policy Classification from Slide 13 45
Setting up Resource Manager in Oracle Enterprise Manager
• Extremely simple to manage the CDB resource plans using
Enterprise Manager UI

Copyright © 2012, Oracle and/or its affiliates. All rights reserved. Insert Information Protection Policy Classification from Slide 13 46
Preventive Performance Management
8.Prevent Regression After Upgrade
9.Ensure Optimal Resource Allocation
10.Prevent Performance Issues Due To Application Changes
SQL Tuning Advisor
DB Resource Manager

Copyright © 2012, Oracle and/or its affiliates. All rights reserved. Insert Information Protection Policy Classification from Slide 13 47
Prevent performance issues due to Application Changes
The new BI system has very aggressive SLAs
defined. How can we ensure consistent
performance across the system ?
Code migration, new indices, objects can often
impact performance of the application
How do we validate the performance of critical
queries before rolling out these changes ?

Copyright © 2012, Oracle and/or its affiliates. All rights reserved. Insert Information Protection Policy Classification from Slide 13 48
Validate Impact of custom code migration
Use SPA Guided Workflow (recommended) or PL/SQL APIs
Create a SQL tuning set of the top X (20 or 30) queries
Establish first trial remotely using current state – baseline
Make change – Create the indexes or migrate custom code
Establish second trial remotely using the same SQL Tuning Set
Review SPA report and rollout or rollback changes.
Trial 2
Trial 1
State 1
State 2
State 1
Custom
Code Changes
Copyright © 2012, Oracle and/or its affiliates. All rights reserved. Insert Information Protection Policy Classification from Slide 13 49
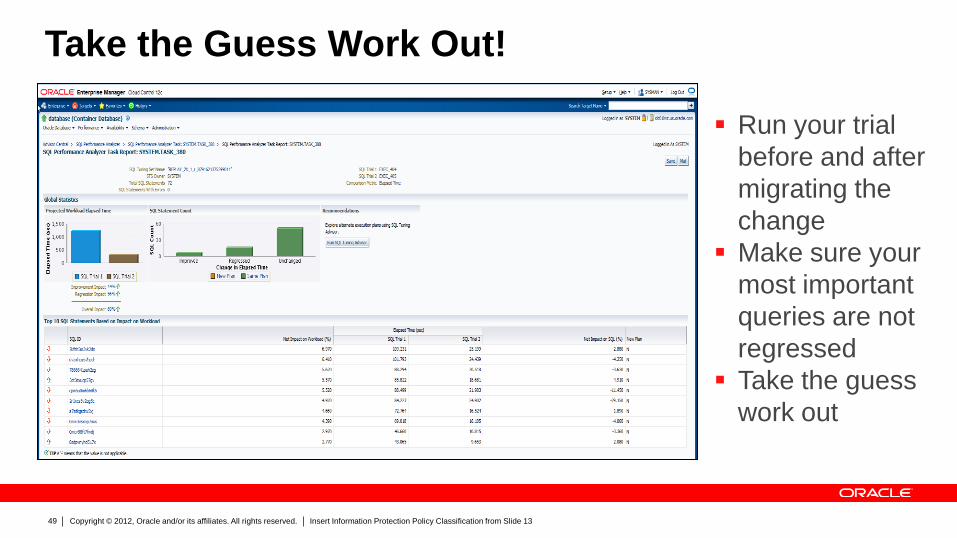
Take the Guess Work Out!
Run your trial
before and after
migrating the
change
Make sure your
most important
queries are not
regressed
Take the guess
work out

Copyright © 2012, Oracle and/or its affiliates. All rights reserved. Insert Information Protection Policy Classification from Slide 13 50
Preventive Performance Management
8.Prevent Regression After Upgrade
9.Ensure Optimal Resource Allocation
10.Prevent Performance Issues Due To Application Changes
SQL Tuning Advisor
DB Resource Manager
SQL Performance
Analyzer

Copyright © 2012, Oracle and/or its affiliates. All rights reserved. Insert Information Protection Policy Classification from Slide 13 51

Copyright © 2012, Oracle and/or its affiliates. All rights reserved. Insert Information Protection Policy Classification from Slide 13 52