Pennsylvanias Motivational Boot Camp · Pennsylvanias Motivational Boot Camp ... 4. Potential Boot...
89
Pennsylvanias Motivational Boot Camp 2003 Report to the Legislature THE PENNSYLVANIA COMMISSION ON SENTENCING Representative Frank Dermody District Attorney Merritt E. Ted McKnight Chair Vice-Chair Mark H. Bergstrom Executive Director
Transcript of Pennsylvanias Motivational Boot Camp · Pennsylvanias Motivational Boot Camp ... 4. Potential Boot...
Pennsylvania�’s Motivational Boot Camp
2003 Report to the Legislature
THE PENNSYLVANIA COMMISSION ON SENTENCING
Representative Frank Dermody District Attorney Merritt E. �‘Ted�’ McKnight Chair Vice-Chair
Mark H. Bergstrom Executive Director
Pennsylvania�’s Motivational Boot Camp 2003 Report to the Legislature
by
Cynthia A. Kempinen, Ph.D. Deputy Director
Pennsylvania Commission on Sentencing
Megan C. Kurlychek, M.S. Research Associate
Pennsylvania Commission on Sentencing
January 2004
Acknowledgments
We appreciate the tremendous cooperation and support of the Department of Corrections, the Pennsylvania Board of Probation and Parole, and the Pennsylvania State Police, and would like to gratefully acknowledge the contributions of their staff. Jim Connor, Educational Coordinator at the Boot Camp, oversees the monthly distribution of the Offender Surveys given at the Boot Camp admission and graduation phases with the assistance of Sonya Shadeck, Commander�’s Secretary. John Tuttle, Director of Probation and Parole Services, and Cindy Kable, Administrative Assistant, with the Pennsylvania Board of Probation and Parole, distribute and track the statewide distribution of the Offender Survey at the parole phase. Dana Gremaux, Dave Levine, Leigh Ann Werkeiser, undergraduate research assistants with the Pennsylvania Commission on Sentencing, entered the Boot Camp Offender Surveys into our database during the last year. James Schaefer, Information and Publications Manager with the Department of Corrections, provided us with the Boot Camp admission data, and Ellen McMahon, Human Resources clerk at the Boot Camp, responded to our myriad questions about admissions and graduations from the Boot Camp. Kathleen Feldgus, Information Technology Manager, and Donna Connors, Application Developer, with the Pennsylvania State Police provided us with the recidivism data. Robin Yurky, Parole Agent 2 at the Quehanna Boot Camp, and Paul O�’Connor, Acting Director, Bureau of Community Corrections at the Department of Corrections, supplied valuable insight and information concerning the aftercare of Boot Camp offenders. Randall Britton, Commander of the Quehanna Boot Camp, Kathleen Gnall, Director, Office of Planning, Research Statistics and Grants, Gary Zajac, Ph.D., Research and Evaluation Manager, and Kristofer Bret Bucklen, Research and Evaluation Analyst, from the Department of Corrections, reviewed the report and offered useful comments and suggestions.
Table of Contents Executive Summary...................................................................................................................1 Introduction and Overview......................................................................................................3
Legislative Background of Pennsylvania�’s Boot Camp ......................................................3 Statutory Eligibility Criteria for Boot Camp .......................................................................3 Procedure for Selection of Boot Camp Participants ............................................................4 Description of Pennsylvania�’s Boot Camp Program ...........................................................5 Aftercare for Boot Camp Graduates ....................................................................................6 Legislative Reports on the Motivational Boot Camp Program............................................7
Who Goes to Boot Camp?........................................................................................................9
Characteristics of Offenders Admitted to Boot Camp during 2001 ....................................9 Trends in Admissions from 1992-2001 ...............................................................................9
Boot Camp Offender Survey .................................................................................................12
Boot Camp Offender Characteristics: Self-Report Survey................................................12 Offender Expectations of Boot Camp................................................................................14 Attitudinal Changes among Boot Camp Graduates ...........................................................15 Self-Reported Behavioral Changes among Boot Camp Graduates ...................................23 Offenders�’ Comments on Boot Camp................................................................................26
Factors Related to Recidivism ..............................................................................................28 Current Study ....................................................................................................................28 Findings .............................................................................................................................30
Summary and Conclusion .....................................................................................................33
Pennsylvania�’s Motivational Boot Camp Program 2003 Legislative Report
Executive Summary
Act 215 of 1990, which created Pennsylvania�’s Motivational Boot Camp Program, mandated that the Pennsylvania Commission on Sentencing report annually to the House and Senate Judiciary Committees on the progress of the program. These reports have generally consisted of three parts: 1) Who Goes to Boot Camp?, 2) Results from a Boot Camp Offender Survey, and 3) Factors Related to the Recidivism of Boot Camp Graduates. The major findings from the 2003 Legislative Report are as follows: Boot Camp Offender Profile
There were 471 offenders admitted to Boot Camp during 2001, with 88% of the offenders successfully graduating from the program.
The typical offender entering Boot Camp is a young [average age of 25], minority [50% Black and 17% Hispanic], male [95%], convicted of a drug offense [69%] and from an urban area, predominantly Philadelphia [25%], Allegheny [12%], and Berks [10%] Counties.
Most offenders report being single [83%], having children [59%], and living with their children [57%].
A slight majority [52%] of offenders had at least a high school education.
About 64% of the offenders were employed prior to entering Boot Camp with an average reported income of $1200-$1499 a month. While 56% identified their jobs as their primary source of income, 37% indicated that they obtained their income primarily through illegal means.
Offenders indicated that, as children, they were more likely to live with two parents [47%] than with one parent [40%].
Most offenders reported having a family member [53%] and knowing a friend [86%] who had been incarcerated.
Over 90% of the offenders had committed prior offenses, consisting primarily of drug dealing [65%], drug use [49%], theft [48%], and DUI [35%].
A large percentage of the offenders [43%] had been arrested as a juvenile, and among those, 66% had been incarcerated as a juvenile.
Most offenders had used drugs [89%], with an average age of onset being 15 years and
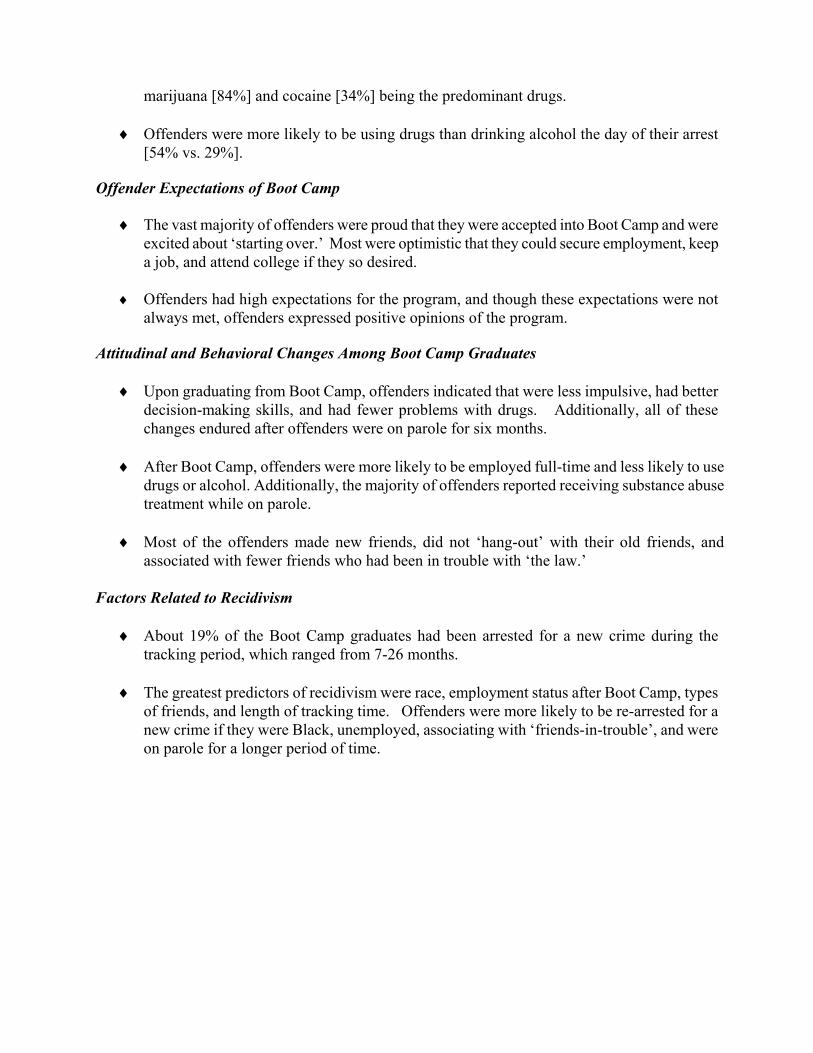
marijuana [84%] and cocaine [34%] being the predominant drugs. Offenders were more likely to be using drugs than drinking alcohol the day of their arrest [54% vs. 29%].
Offender Expectations of Boot Camp
The vast majority of offenders were proud that they were accepted into Boot Camp and were excited about �‘starting over.�’ Most were optimistic that they could secure employment, keep a job, and attend college if they so desired.
Offenders had high expectations for the program, and though these expectations were not always met, offenders expressed positive opinions of the program.
Attitudinal and Behavioral Changes Among Boot Camp Graduates
Upon graduating from Boot Camp, offenders indicated that were less impulsive, had better decision-making skills, and had fewer problems with drugs. Additionally, all of these changes endured after offenders were on parole for six months.
After Boot Camp, offenders were more likely to be employed full-time and less likely to use drugs or alcohol. Additionally, the majority of offenders reported receiving substance abuse treatment while on parole.
Most of the offenders made new friends, did not �‘hang-out�’ with their old friends, and associated with fewer friends who had been in trouble with �‘the law.�’
Factors Related to Recidivism
About 19% of the Boot Camp graduates had been arrested for a new crime during the tracking period, which ranged from 7-26 months.
The greatest predictors of recidivism were race, employment status after Boot Camp, types of friends, and length of tracking time. Offenders were more likely to be re-arrested for a new crime if they were Black, unemployed, associating with �‘friends-in-trouble�’, and were on parole for a longer period of time.
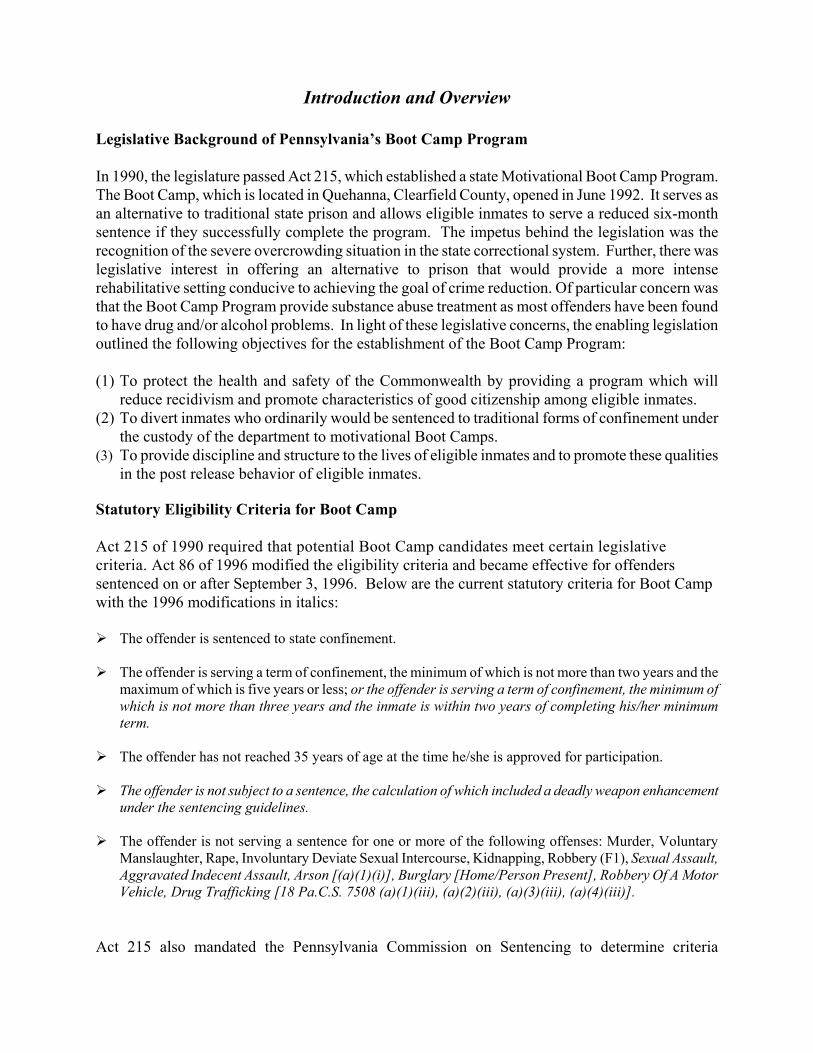
Introduction and Overview Legislative Background of Pennsylvania�’s Boot Camp Program In 1990, the legislature passed Act 215, which established a state Motivational Boot Camp Program. The Boot Camp, which is located in Quehanna, Clearfield County, opened in June 1992. It serves as an alternative to traditional state prison and allows eligible inmates to serve a reduced six-month sentence if they successfully complete the program. The impetus behind the legislation was the recognition of the severe overcrowding situation in the state correctional system. Further, there was legislative interest in offering an alternative to prison that would provide a more intense rehabilitative setting conducive to achieving the goal of crime reduction. Of particular concern was that the Boot Camp Program provide substance abuse treatment as most offenders have been found to have drug and/or alcohol problems. In light of these legislative concerns, the enabling legislation outlined the following objectives for the establishment of the Boot Camp Program: (1) To protect the health and safety of the Commonwealth by providing a program which will
reduce recidivism and promote characteristics of good citizenship among eligible inmates. (2) To divert inmates who ordinarily would be sentenced to traditional forms of confinement under
the custody of the department to motivational Boot Camps. (3) To provide discipline and structure to the lives of eligible inmates and to promote these qualities
in the post release behavior of eligible inmates. Statutory Eligibility Criteria for Boot Camp Act 215 of 1990 required that potential Boot Camp candidates meet certain legislative criteria. Act 86 of 1996 modified the eligibility criteria and became effective for offenders sentenced on or after September 3, 1996. Below are the current statutory criteria for Boot Camp with the 1996 modifications in italics:
The offender is sentenced to state confinement.
The offender is serving a term of confinement, the minimum of which is not more than two years and the maximum of which is five years or less; or the offender is serving a term of confinement, the minimum of which is not more than three years and the inmate is within two years of completing his/her minimum term.
The offender has not reached 35 years of age at the time he/she is approved for participation.
The offender is not subject to a sentence, the calculation of which included a deadly weapon enhancement under the sentencing guidelines.
The offender is not serving a sentence for one or more of the following offenses: Murder, Voluntary Manslaughter, Rape, Involuntary Deviate Sexual Intercourse, Kidnapping, Robbery (F1), Sexual Assault, Aggravated Indecent Assault, Arson [(a)(1)(i)], Burglary [Home/Person Present], Robbery Of A Motor Vehicle, Drug Trafficking [18 Pa.C.S. 7508 (a)(1)(iii), (a)(2)(iii), (a)(3)(iii), (a)(4)(iii)].
Act 215 also mandated the Pennsylvania Commission on Sentencing to determine criteria
concerning the identification of appropriate candidates for the Boot Camp. As the number of potential Boot Camp candidates recommended by judges has historically been low, the Commission continues to utilize the minimum sentence allowed by statute to identify potential candidates for judges to consider in their recommendations for Boot Camp. Procedure for Selection of Boot Camp Participants Statute requires that the sentencing judge recommend the offender for participation in the Boot Camp Program and that the Department of Corrections make the final determination concerning which offenders will be admitted into the program. The Department of Corrections will notify the sentencing judge if a new inmate appears to be a good candidate for the Boot Camp but has not been designated eligible by the judge. In such cases the judge will often provide a modification of sentence to enable the offender to participate in the program. The two primary reasons that offenders are rejected for the program by the Department of Corrections are outstanding detainers or medical problems. The Boot Camp Program is voluntary and once admitted, an offender can withdraw from the program at which point he/she forfeits the right to immediate parole upon graduation from the program. Rather, the offender returns to the state correctional institution to serve the remaining portion of the minimum sentence prior to being reviewed for release by the Parole Board. The specific steps involved in the selection of Boot Camp participants are as follows: 1. The Pennsylvania Commission on Sentencing identifies appropriate Boot Camp candidates
through the sentencing guidelines. 2. The sentencing judge, using the guidelines, indicates whether the defendant is to be considered
for the Boot Camp Program. The offender must meet the legislative criteria that are outlined in the previous section.
3. The judge indicates on the sentencing order and the Guideline Sentence Form the minimum and
maximum sentence and whether the offender should be considered for the Boot Camp. By identifying an inmate as eligible for this Boot Camp Program, the judge is agreeing to allow the inmate to be released prior to the expiration of the minimum sentence.
4. Potential Boot Camp candidates go through an expedited classification process at Camp Hill if
the offender is a male, and Muncy if the offender is a female. 5. The inmate must apply to the Department of Corrections for admission into the program. 6. The Department of Corrections makes the final determination as to whom will be admitted
into the program. 7. Upon successful completion of the six-month program, the inmate is to be released on intensive
parole supervision.
Description of Pennsylvania�’s Boot Camp Program Pennsylvania�’s Boot Camp Program was developed to address the legislative objective of reducing recidivism by providing a program that promotes discipline, structure, and characteristics of good citizenship. More specific programmatic features were provided in the legislative definition of Boot Camp: �“a program in which eligible inmates participate for a period of six months in a humane program for motivational Boot Camp programs which shall provide for rigorous physical activity, intensive regimentation and discipline, work on public projects, substance abuse treatment services licensed by the Department of Health, ventilation therapy, continuing education, vocational training and prerelease counseling�” [Act 215 of 1990]. The Boot Camp is modeled after military Boot Camps and instills discipline and structure through regimented sixteen-hour days consisting of work and program activities with very little free time. Intensive regimentation is provided through Drill Instructors working with the inmate platoons to teach traditional military drills and physical exercise. The Boot Camp reinforces the military training throughout the day by requiring the inmates to demonstrate respect [e.g., use proper titles when addressing staff and Mr. when addressing peers], follow instructions, use military bearing [e.g., stand at attention, show erect and proud posture], maintain neat and clean personal quarters, display a positive attitude, and use their time constructively. A typical day begins at 5:30 with reveille followed by an hour of physical training. The remainder of the day is tightly scheduled with educational and rehabilitative classes and work. Inmates are allowed visits every other weekend and have limited phone privileges on weekends when there are no visitations. Personal radios and televisions are not allowed. A hallmark of the program is its emphasis on the rehabilitative needs of the offenders, who are provided substance abuse education and treatment. These programs have been found to meet or exceed the substance abuse treatment standards established by the American Correctional Association and the Department of Corrections. The department has also developed a process for assessing each inmate for risk factors involving recidivism and relapse, which allows inmates to be placed in treatment groups and classes based on their assessed needs. In July 2000, the Boot Camp adopted the cognitive behavioral therapy program, Thinking for Change, which provides offenders with a fourteen-week program promoting pro-social skills and values. This program, which was developed by the National Institute of Corrections, has been widely used in correctional settings across the nation. Instructors who teach this program at the Boot Camp are certified by the National Institute of Corrections and have, thus far, reported positive results with offenders. Inmates also participate in both individual and group counseling sessions with individualized treatment plans developed upon the inmate�’s arrival to the Boot Camp. The group sessions meet about 2.5 hours per day for seven days a week. During these sessions the inmates learn how to deal with issues related to substance abuse such as: stress and anger management, the effect of drugs on the body, dysfunctional family systems, self-defeating behaviors, building self esteem, developing healthy relationships, relapse prevention, employability, financial budgeting, and getting ready to return to the community. Community meetings, as well as problem-solving and encounter groups are held, as needed, to provide offenders with the opportunity to discuss individual problems and to serve as ventilation therapy. Alcoholics Anonymous, Narcotics Anonymous, self-help, and peer led

groups are offered on a weekly basis. The Boot Camp Program has a mandatory education program for inmates who do not have a high school diploma, while those who have graduated from high school often serve as tutors. Students attend education classes for 30 hours a week and cover six main subject areas: math, grammar, literature, social studies, science and essay writing. Classes engage in pre-GED testing procedures and when students attain a satisfactory level, a GED test date is scheduled. Those who pass the GED are released from education class to work detail while those who do not pass remain in the education program. Approximately 15% of the inmates who have attended Boot Camp test for their GED, and between 1993 and 2001, 82% of those tested received their GED, which is higher than the 68% passing rate of inmates at other state correctional institutions. Aside from educational and counseling programs, inmates work on community projects involving other agencies such as the Department of Conservation and Natural Resources, the Pennsylvania Department of Transportation, the Fish and Boat Commission, the Pennsylvania Game Commission, and the Governor�’s Council on �“Greener Pennsylvania�”. The inmates�’ work consists of activities such as: repairing and installing broken gates, clearing brush, planting trees, painting buildings, and repairing fences. Further, the offenders�’ involvement in building numerous elk feeder plots and supporting and increasing Pennsylvania�’s elk herd has contributed to promoting Pennsylvania�’s tourism. In addition, the offenders have participated in several stream restoration projects with the Department of Environmental Protection and local chapters of Trout Unlimited, including the Cold Stream Dam Project in Philipsburg, Pennsylvania, which has allowed for the stocking and fishing of trout. Since the inception of the Community Work Project in 1995 through December 2002, inmates have worked a total of 138, 212 hours on these various projects. Inmates not only learn useful skills, but are also instilled with the work ethic through their involvement in these projects. In July 1999, the Boot Camp opened a newly renovated facility, which can currently accommodate 512 offenders. This facility provides space for a new food-service area, expanded health care, drug and alcohol treatment, education facilities and an indoor physical training area. Generally, there are around 230 offenders participating in the program at any one time, with, on average, about 50 offenders entering the program per month. Aftercare for Boot Camp Graduates Statute requires that graduates of the Boot Camp program receive intensive supervision upon graduating from the program. In 2000, the Department of Corrections developed several new initiatives for the aftercare of Boot Camp graduates. These programs, which involve three phases, are available in Philadelphia, Pittsburgh, Harrisburg, and Erie. These three phases allow for a more gradual reintegration back into the community while allowing for the reinforcement of skills learned at the Boot Camp. The Pennsylvania Board of Probation and Parole is responsible for determining which graduates participate in this program. Upon review of the offender�’s release plan, Parole Board staff decide whether the more structured supervision offered by these aftercare programs is necessary to assist the offender in his/her return to the community. In 2001, the Department of Corrections, in conjunction with the Parole Board, implemented the Comprehensive Transitional Employment Program [CTEP], which is a non-residential program funded by a grant from the Pennsylvania Commission on Crime and Delinquency. This three-year
pilot program, which is operating in Philadelphia, provides a comprehensive range of services including: life skills education, basic education [GED], job readiness training, job placement and retention services, and on-going placement services. While the program is also available for offenders released from the substance abuse treatment program at SCI Chester, priority for placement in these programs is given to Boot Camp graduates. Change in Mandatory Aftercare Provision. In February 2002, a mandatory 90-day aftercare provision was in effect for all offenders graduating from the Boot Camp Program. In December 2002, this aftercare provision was reduced to 30 days, as the Department of Corrections found that a Community Corrections Center was offering the same services for less cost. In addition, offenders were being released to centers that were distant from their home community, where they had employment opportunities that were often lost due to a delay in their return. According to the Department of Corrections the mandatory 90-day aftercare provision was intended to provide �“a structured re-entry program that includes a detailed prescriptive program for each inmate, a minimum of three months of residency in a structured, supervised residential facility, orientation to the community, involvement of families and the parole agent, cognitive behavior therapy, job readiness skills, job acquisition, and drug and alcohol follow-up service.�”
Specific aftercare programs were available in Harrisburg [Gaudenzia], Philadelphia [Volunteers of America, ASPIRE], Pittsburgh [Renewal], and Erie [Gaudenzia]. Offenders going through these programs were also required to participate in an outpatient treatment program equal to the amount of time they spent in the residential facility. [i.e., offenders in the three-month residential aftercare program will also participate in a three-month non-residential program]. Offenders not returning to one of these four areas of the state were released to the closest Community Corrections Center or to a private facility for the 30-day minimum residential period, though the outpatient aftercare is unavailable for these offenders. Research indicates that participation in structured re-entry programs increases an offender�’s chances for success. The Commission will be evaluating the effects of the Boot Camp�’s aftercare provision as part of its ongoing legislative mandate to evaluate the Boot Camp Program. 1 Legislative Reports on the Motivational Boot Camp Program Act 215 of 1990, which created the Motivational Boot Camp Program, included a mandate to The Pennsylvania Commission on Sentencing and the Department of Corrections to provide annual reports to the House and Senate Judiciary Committees on the progress of the program by February 1 of each year. Previous reports by the Sentencing Commission have addressed the following issues: 1) the tracking of offenders who are eligible, recommended, and admitted into Boot Camp, 2) results from a Boot Camp Offender Survey, and 3) the impact of Boot Camp on recidivism.
I. Who Goes to Boot Camp? This part of the report generally provides a profile of the type of offender who is statutorily eligible, judicially referred, and accepted into Boot Camp. This
1 For more information on the Boot Camp Program, see �“Quehanna Motivational Boot Camp: Performance Analysis and Evaluation�” by Bret Bucklen, which is available from the Department of Corrections at www.cor.state.pa.us or [717] 731-7149.
year�’s report discusses only the admission stage, as the information for eligibility and referral was unavailable.2 This year the report also provides trends in admissions over the last decade.
II. Boot Camp Offender Survey. In October 2000, the Commission began conducting a Boot
Camp Offender Survey, with the assistance of the Department of Corrections and the Board of Probation and Parole. Part I is a Self-Report Survey that asks offenders about prior criminal activity, substance abuse, employment history, and family stability. Part II is a Boot Camp Evaluation Survey that measures attitudinal changes along several dimensions that are addressed through the programmatic aspects of the Boot Camp, such as self-control, motivation for change, self-efficacy, and decision-making. The Self-Report Survey is given at admission and parole. The Boot Camp Evaluation Survey is given at admission, graduation, and parole. This year�’s report presents findings from all three phases.
III. Recidivism of Boot Camp Graduates. Previous recidivism studies by the Sentencing
Commission have found no significant difference in the recidivism of offenders going to Boot Camp compared to a comparable group of offenders released from prison. Rather, consistent with other studies, we have found employment status to be an important predictor of whether an offender will desist from criminal activity. This finding emphasizes the importance of structured aftercare that incorporates services to assist offenders in making a successful re-entry into the community. The Commission is currently undertaking a study to examine the impact of the structured aftercare for Boot Camp graduates, which was discussed in the previous section. Those findings will be presented in next year�’s report. In this year�’s report, we examine what factors contribute to the recidivism of Boot Camp graduates.
2 The Sentencing Commission is currently in the process of allowing counties to electronically submit their guideline information. This transition in data collection and management has resulted in a delay in the completion of the 2001 data set.
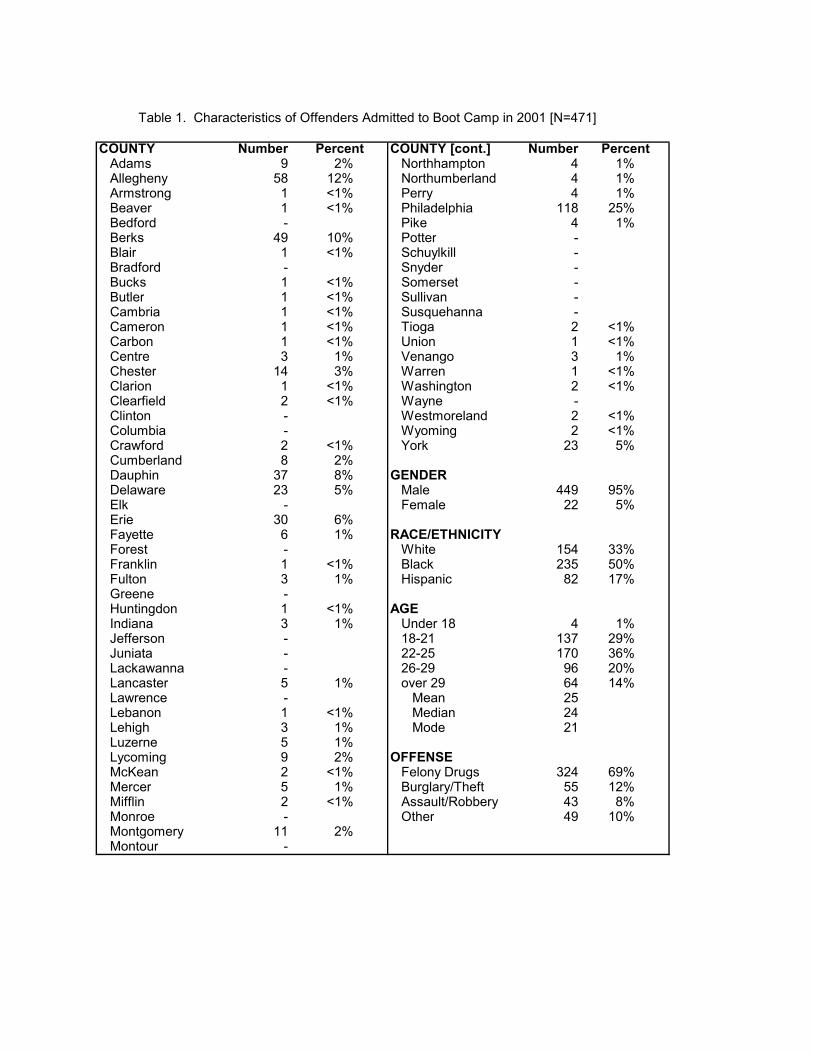
Who Goes to Boot Camp? As indicated in the previous section, the Boot Camp�’s enabling legislation set forth the procedure by which offenders are selected for the Boot Camp Program. While the statute establishes the baseline eligibility criteria, it also provides that judges recommend eligible offenders for the program and that the Department of Corrections make the final determination concerning admission into the program. Traditionally, the Commission�’s Legislative Report has tracked offenders as they move through these stages of the selection process, and updates this section with an additional year of data. However, information concerning which offenders were statutorily eligible and judicially referred was unavailable for offenders sentenced during 2001, and thus this section will discuss only the admission stage.3 Additionally, two other changes were made to this section of the report. First, we provide the characteristics of offenders entering Boot Camp for one sentencing year, 2001, rather than for all offenders admitted during 1992-2001.4 [See Appendix A for offender characteristics by year for 1992-2001.] Second, we provide trend information for these characteristics over the last ten years. The characteristics discussed are: county origin, current conviction offense, race/ethnicity, gender, and age. Characteristics of Offenders Admitted to Boot Camp during 2001 During 2001 there were 471 offenders admitted to the Boot Camp Program. Of these, 88% successfully graduated from Boot Camp, while 4% were involuntarily removed from the program and 8% were voluntary withdrawals. Table 1 shows that most of these offenders came from Philadelphia [25%], Allegheny [12%] and Berks [10%] counties. An additional 50% came from other urban counties in Pennsylvania, while only 12% came from rural counties.5 Drug offenders comprise the majority of those admitted into the Boot Camp [69%] followed by those convicted of burglary or theft [12%]. Most offenders are male [95%], minority [50% Black and 17% Hispanic] and young [mean age of 25]. Trends in Admissions from 1992-2001 Charts 1a-e show the characteristics of offenders admitted to Boot Camp since the program began in 1992 through 2001 by county, offense, race/ethnicity, gender, and age. Overall, there has been a gradual increase in the admissions over the last decade, with 125 offenders entering the program during 1993 [the first full year of operation] and 470 during 2001, with the peak year for admissions being 2000 with 516 offenders. The profile of the offender entering the program has remained similar throughout the years, though there have been some minor fluctuations, with the most notable being the slight increase in the proportion of younger offenders and those convicted of drug felony offenses during the last few years. However, over the last decade, the typical offender entering Boot Camp has always been a young, minority, male from an urban county who has been convicted of a drug felony offense.
3 See footnote 2 in the previous section. 4 In previous years, the �“Who Goes to Boot Camp?�’�’ section has presented information on offender characteristics for all offenders who have been admitted to the program since its inception, updating the information with an additional year of data. 5 Counties were classified as rural if designated as such by the Center for Rural Pennsylvania.
COUNTY Number COUNTY [cont.] NumberAdams 9 2% Northhampton 4 1%Allegheny 58 12% Northumberland 4 1%Armstrong 1 <1% Perry 4 1%Beaver 1 <1% Philadelphia 118 25%Bedford - Pike 4 1%Berks 49 10% Potter -Blair 1 <1% Schuylkill -Bradford - Snyder -Bucks 1 <1% Somerset -Butler 1 <1% Sullivan -Cambria 1 <1% Susquehanna -Cameron 1 <1% Tioga 2 <1%Carbon 1 <1% Union 1 <1%Centre 3 1% Venango 3 1%Chester 14 3% Warren 1 <1%Clarion 1 <1% Washington 2 <1%Clearfield 2 <1% Wayne -Clinton - Westmoreland 2 <1%Columbia - Wyoming 2 <1%Crawford 2 <1% York 23 5%Cumberland 8 2%Dauphin 37 8% GENDERDelaware 23 5% Male 449 95%Elk - Female 22 5%Erie 30 6%Fayette 6 1% RACE/ETHNICITYForest - White 154 33%Franklin 1 <1% Black 235 50%Fulton 3 1% Hispanic 82 17%Greene -Huntingdon 1 <1% AGEIndiana 3 1% Under 18 4 1%Jefferson - 18-21 137 29%Juniata - 22-25 170 36%Lackawanna - 26-29 96 20%Lancaster 5 1% over 29 64 14%Lawrence - Mean 25Lebanon 1 <1% Median 24Lehigh 3 1% Mode 21Luzerne 5 1%Lycoming 9 2% OFFENSEMcKean 2 <1% Felony Drugs 324 69%Mercer 5 1% Burglary/Theft 55 12%Mifflin 2 <1% Assault/Robbery 43 8%Monroe - Other 49 10%Montgomery 11 2%Montour -
Table 1. Characteristics of Offenders Admitted to Boot Camp in 2001 [N=471]
PercentPercent
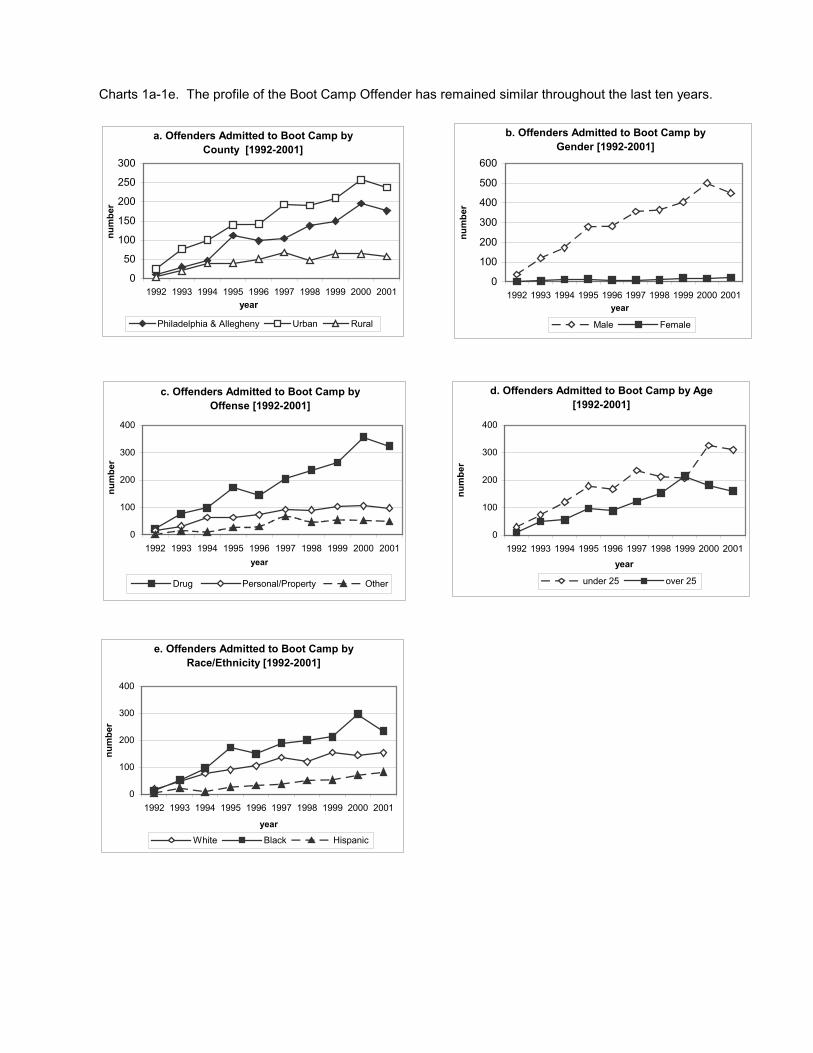
Charts 1a-1e. The profile of the Boot Camp Offender has remained similar throughout the last ten years.
c. Offenders Admitted to Boot Camp by Offense [1992-2001]
0
100
200
300
400
1992 1993 1994 1995 1996 1997 1998 1999 2000 2001year
num
ber
Drug Personal/Property Other
e. Offenders Admitted to Boot Camp by Race/Ethnicity [1992-2001]
0
100
200
300
400
1992 1993 1994 1995 1996 1997 1998 1999 2000 2001
year
num
ber
White Black Hispanic
a. Offenders Admitted to Boot Camp by County [1992-2001]
0
50
100
150
200
250
300
1992 1993 1994 1995 1996 1997 1998 1999 2000 2001year
num
ber
Philadelphia & Allegheny Urban Rural
b. Offenders Admitted to Boot Camp by Gender [1992-2001]
0
100
200
300
400
500
600
1992 1993 1994 1995 1996 1997 1998 1999 2000 2001year
num
ber
Male Female
d. Offenders Admitted to Boot Camp by Age[1992-2001]
0
100
200
300
400
1992 1993 1994 1995 1996 1997 1998 1999 2000 2001
year
num
ber
under 25 over 25
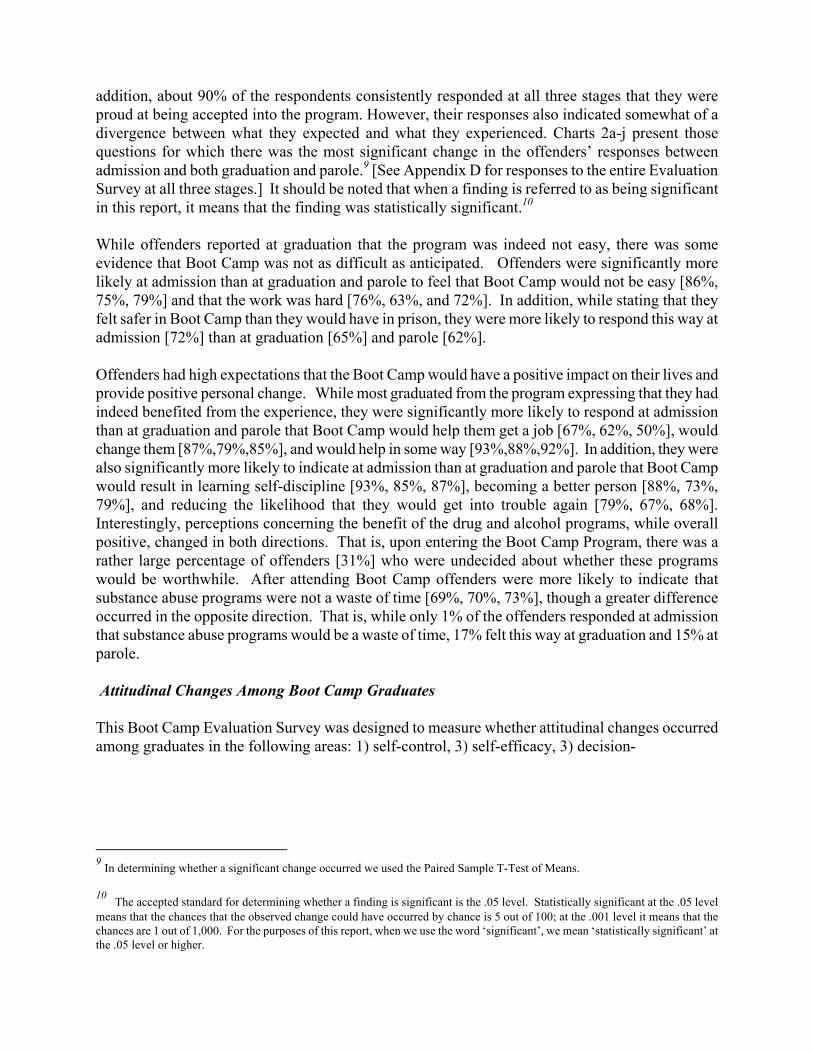
Boot Camp Offender Survey This section of the report presents findings from a Boot Camp Offender Survey that the Sentencing Commission has been conducting for the last three years, with assistance from the Department of Corrections and the Board of Probation and Parole. Part I of the survey is a Self-Report Survey, designed to focus on factors that previous research has found to be related to criminal behavior, such as substance abuse, prior criminal activity, employment history, and family stability. Part II is a Boot Camp Evaluation Survey, which measures attitudinal changes along several dimensions that are addressed through the programmatic aspects of the Boot Camp, such as self-control, motivation for change, and decision-making. In addition, this survey also asks the offenders about their expectations of the program and whether those expectations were met. The responses from these surveys not only provide a more in-depth profile of the Boot Camp offender, but also are utilized in our research assessing the impact of the Boot Camp on attitudinal and behavioral changes. Sample. The Boot Camp Evaluation Survey is being administered to offenders at three points in time: 1) admission to the Boot Camp, 2) graduation from the Boot Camp, and 3) six months after graduation, while on parole. The Self-Report Survey is given at the admission and parole stages. The sample for the current study is based upon the 353 offenders who graduated from the Boot Camp Program between April 2001 and May 2002 and responded to the survey at all three phases. This represents a 50% response rate, with most of the sample reduction being due to only 52% responding at the parole phase.6 While this response rate is consistent with other studies involving survey research, it always raises the concern that those included in the sample differ in some significant way from those who are not. The fact that we found few differences at the admission and graduation phases between those who responded to all three surveys and those who did not provides greater confidence that the sample is representative of offenders going through the program, but does not eliminate the concern. 7 Boot Camp Offender Characteristics: Self-Report Survey Table 2 provides demographic, criminal justice, and substance use information on the Boot Camp graduates, based upon their responses to the Self-Report Survey that is given to offenders at the admission stage. [See Appendix B for detailed information on the Self-Report Survey responses at the admission stage.] Consistent with the information provided in Part I of this Report, the Self-Report Survey provided a demographic profile of the typical Boot Camp offender as young [mean age of 25], black [42%], male [97%], and from an urban area [84%]. The survey also provided additional information on the offender with respect to marital status, children, living arrangements prior to arrest, educational attainment, and employment status. Though only 17% reported being married [legally or common law], 45% indicated that they had been living with a spouse or partner prior to their arrest. Most offenders [59%], including many
6 Of the 709 offenders who graduated during this time period, 679 responded to the survey at the graduation phase, and 368 responded at the parole phase, which represents a 96% and 52% response rate respectively. 7 We conducted statistical tests of significance on those factors included in the Offender Survey and found only three factors for which there was a difference: race, prior record, and having children. Offenders who were black, had a prior record, and had children were less likely to respond to the parole survey.
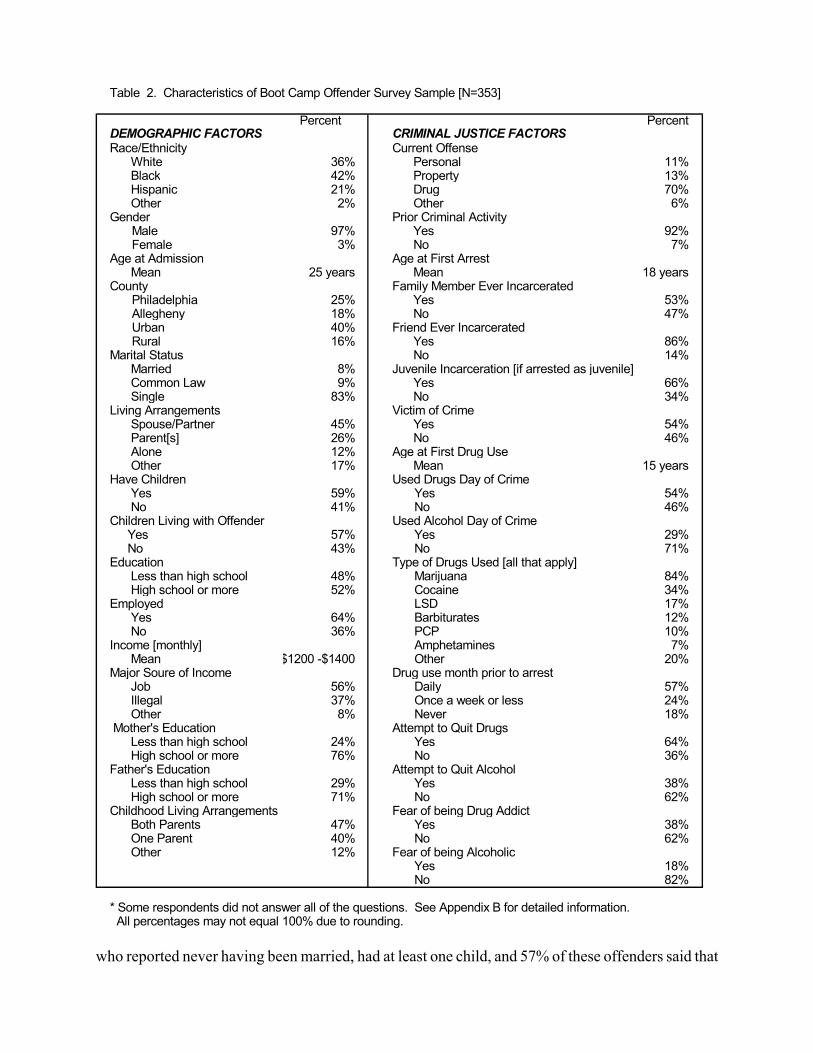
who reported never having been married, had at least one child, and 57% of these offenders said that
Table 2. Characteristics of Boot Camp Offender Survey Sample [N=353]
Percent PercentDEMOGRAPHIC FACTORS CRIMINAL JUSTICE FACTORSRace/Ethnicity Current Offense
White 36% Personal 11% Black 42% Property 13% Hispanic 21% Drug 70% Other 2% Other 6%
Gender Prior Criminal ActivityMale 97% Yes 92%Female 3% No 7%
Age at Admission Age at First Arrest Mean 25 years Mean 18 years
County Family Member Ever IncarceratedPhiladelphia 25% Yes 53%Allegheny 18% No 47%Urban 40% Friend Ever IncarceratedRural 16% Yes 86%
Marital Status No 14% Married 8% Juvenile Incarceration [if arrested as juvenile] Common Law 9% Yes 66% Single 83% No 34%
Living Arrangements Victim of Crime Spouse/Partner 45% Yes 54% Parent[s] 26% No 46% Alone 12% Age at First Drug Use Other 17% Mean 15 years
Have Children Used Drugs Day of Crime Yes 59% Yes 54% No 41% No 46%
Children Living with Offender Used Alcohol Day of Crime Yes 57% Yes 29% No 43% No 71%
Education Type of Drugs Used [all that apply] Less than high school 48% Marijuana 84% High school or more 52% Cocaine 34%
Employed LSD 17% Yes 64% Barbiturates 12% No 36% PCP 10%
Income [monthly] Amphetamines 7% Mean $1200 -$1400 Other 20%
Major Soure of Income Drug use month prior to arrest Job 56% Daily 57% Illegal 37% Once a week or less 24% Other 8% Never 18%
Mother's Education Attempt to Quit Drugs Less than high school 24% Yes 64% High school or more 76% No 36%
Father's Education Attempt to Quit Alcohol Less than high school 29% Yes 38% High school or more 71% No 62%
Childhood Living Arrangements Fear of being Drug Addict Both Parents 47% Yes 38% One Parent 40% No 62% Other 12% Fear of being Alcoholic
Yes 18%No 82%
* Some respondents did not answer all of the questions. See Appendix B for detailed information. All percentages may not equal 100% due to rounding.
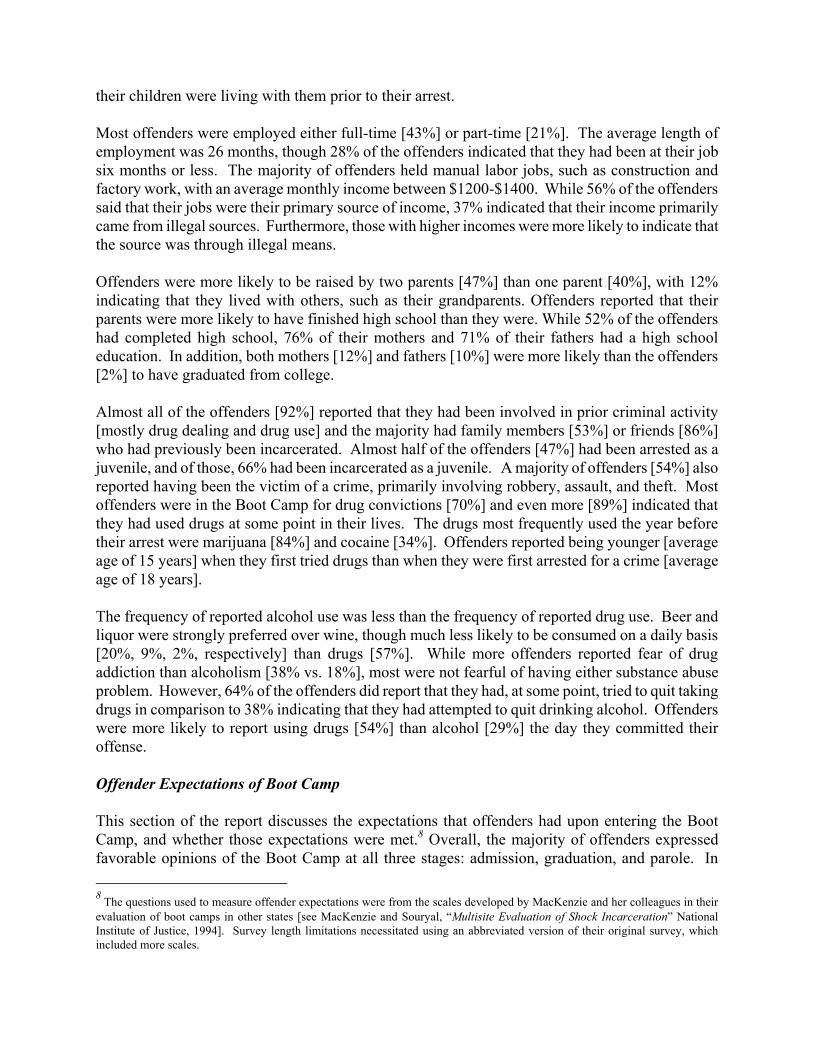
their children were living with them prior to their arrest. Most offenders were employed either full-time [43%] or part-time [21%]. The average length of employment was 26 months, though 28% of the offenders indicated that they had been at their job six months or less. The majority of offenders held manual labor jobs, such as construction and factory work, with an average monthly income between $1200-$1400. While 56% of the offenders said that their jobs were their primary source of income, 37% indicated that their income primarily came from illegal sources. Furthermore, those with higher incomes were more likely to indicate that the source was through illegal means. Offenders were more likely to be raised by two parents [47%] than one parent [40%], with 12% indicating that they lived with others, such as their grandparents. Offenders reported that their parents were more likely to have finished high school than they were. While 52% of the offenders had completed high school, 76% of their mothers and 71% of their fathers had a high school education. In addition, both mothers [12%] and fathers [10%] were more likely than the offenders [2%] to have graduated from college. Almost all of the offenders [92%] reported that they had been involved in prior criminal activity [mostly drug dealing and drug use] and the majority had family members [53%] or friends [86%] who had previously been incarcerated. Almost half of the offenders [47%] had been arrested as a juvenile, and of those, 66% had been incarcerated as a juvenile. A majority of offenders [54%] also reported having been the victim of a crime, primarily involving robbery, assault, and theft. Most offenders were in the Boot Camp for drug convictions [70%] and even more [89%] indicated that they had used drugs at some point in their lives. The drugs most frequently used the year before their arrest were marijuana [84%] and cocaine [34%]. Offenders reported being younger [average age of 15 years] when they first tried drugs than when they were first arrested for a crime [average age of 18 years]. The frequency of reported alcohol use was less than the frequency of reported drug use. Beer and liquor were strongly preferred over wine, though much less likely to be consumed on a daily basis [20%, 9%, 2%, respectively] than drugs [57%]. While more offenders reported fear of drug addiction than alcoholism [38% vs. 18%], most were not fearful of having either substance abuse problem. However, 64% of the offenders did report that they had, at some point, tried to quit taking drugs in comparison to 38% indicating that they had attempted to quit drinking alcohol. Offenders were more likely to report using drugs [54%] than alcohol [29%] the day they committed their offense. Offender Expectations of Boot Camp This section of the report discusses the expectations that offenders had upon entering the Boot Camp, and whether those expectations were met.8 Overall, the majority of offenders expressed favorable opinions of the Boot Camp at all three stages: admission, graduation, and parole. In 8 The questions used to measure offender expectations were from the scales developed by MacKenzie and her colleagues in their evaluation of boot camps in other states [see MacKenzie and Souryal, �“Multisite Evaluation of Shock Incarceration�” National Institute of Justice, 1994]. Survey length limitations necessitated using an abbreviated version of their original survey, which included more scales.
addition, about 90% of the respondents consistently responded at all three stages that they were proud at being accepted into the program. However, their responses also indicated somewhat of a divergence between what they expected and what they experienced. Charts 2a-j present those questions for which there was the most significant change in the offenders�’ responses between admission and both graduation and parole.9 [See Appendix D for responses to the entire Evaluation Survey at all three stages.] It should be noted that when a finding is referred to as being significant in this report, it means that the finding was statistically significant.10 While offenders reported at graduation that the program was indeed not easy, there was some evidence that Boot Camp was not as difficult as anticipated. Offenders were significantly more likely at admission than at graduation and parole to feel that Boot Camp would not be easy [86%, 75%, 79%] and that the work was hard [76%, 63%, and 72%]. In addition, while stating that they felt safer in Boot Camp than they would have in prison, they were more likely to respond this way at admission [72%] than at graduation [65%] and parole [62%]. Offenders had high expectations that the Boot Camp would have a positive impact on their lives and provide positive personal change. While most graduated from the program expressing that they had indeed benefited from the experience, they were significantly more likely to respond at admission than at graduation and parole that Boot Camp would help them get a job [67%, 62%, 50%], would change them [87%,79%,85%], and would help in some way [93%,88%,92%]. In addition, they were also significantly more likely to indicate at admission than at graduation and parole that Boot Camp would result in learning self-discipline [93%, 85%, 87%], becoming a better person [88%, 73%, 79%], and reducing the likelihood that they would get into trouble again [79%, 67%, 68%]. Interestingly, perceptions concerning the benefit of the drug and alcohol programs, while overall positive, changed in both directions. That is, upon entering the Boot Camp Program, there was a rather large percentage of offenders [31%] who were undecided about whether these programs would be worthwhile. After attending Boot Camp offenders were more likely to indicate that substance abuse programs were not a waste of time [69%, 70%, 73%], though a greater difference occurred in the opposite direction. That is, while only 1% of the offenders responded at admission that substance abuse programs would be a waste of time, 17% felt this way at graduation and 15% at parole. Attitudinal Changes Among Boot Camp Graduates This Boot Camp Evaluation Survey was designed to measure whether attitudinal changes occurred among graduates in the following areas: 1) self-control, 3) self-efficacy, 3) decision-
9 In determining whether a significant change occurred we used the Paired Sample T-Test of Means. 10 The accepted standard for determining whether a finding is significant is the .05 level. Statistically significant at the .05 level means that the chances that the observed change could have occurred by chance is 5 out of 100; at the .001 level it means that the chances are 1 out of 1,000. For the purposes of this report, when we use the word �‘significant�’, we mean �‘statistically significant�’ at the .05 level or higher.
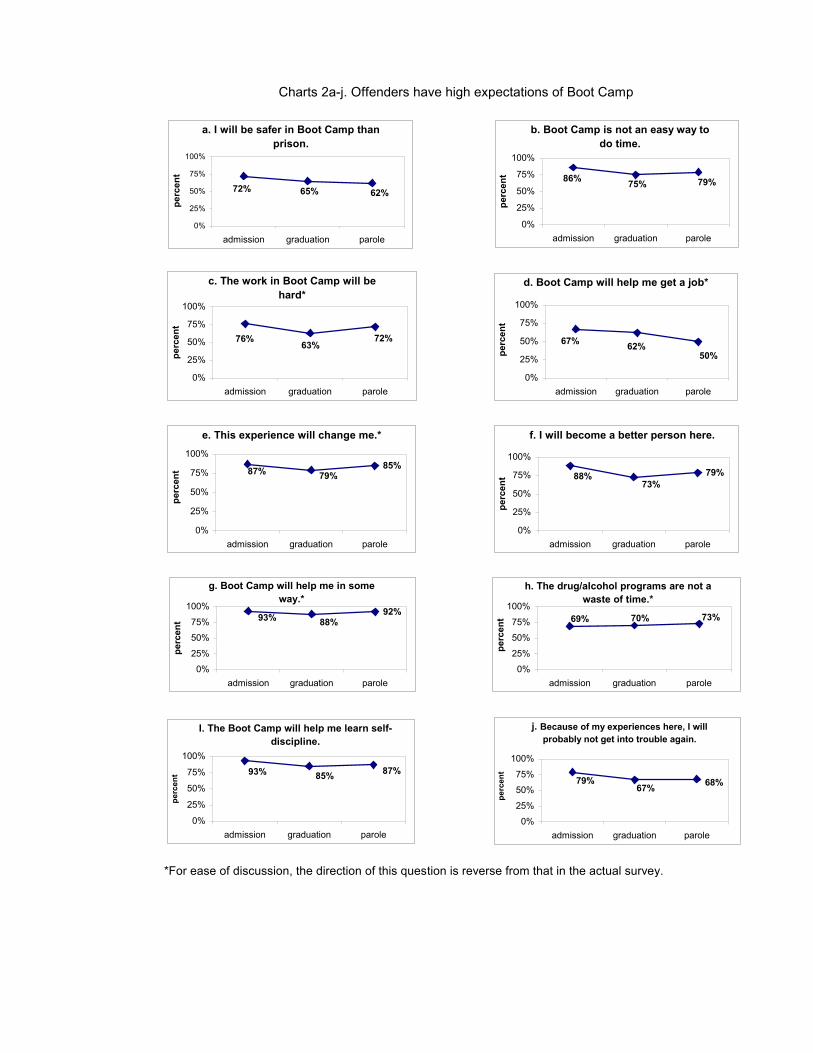
*For ease of discussion, the direction of this question is reverse from that in the actual survey.
Charts 2a-j. Offenders have high expectations of Boot Camp
a. I will be safer in Boot Camp than prison.
62%65%72%
0%
25%
50%
75%
100%
admission graduation parole
perc
ent
b. Boot Camp is not an easy way to do time.
79%75%86%
0%
25%
50%
75%
100%
admission graduation parole
perc
ent
c. The work in Boot Camp will be hard*
76%63%
72%
0%
25%
50%
75%
100%
admission graduation parole
perc
ent
d. Boot Camp will help me get a job*
50%62%67%
0%
25%
50%
75%
100%
admission graduation parole
perc
ent
e. This experience will change me.*
85%87% 79%
0%
25%
50%
75%
100%
admission graduation parole
perc
ent
f. I will become a better person here.
79%73%
88%
0%
25%
50%
75%
100%
admission graduation parole
perc
ent
g. Boot Camp will help me in some way.*
92%93% 88%
0%
25%
50%
75%
100%
admission graduation parole
perc
ent
h. The drug/alcohol programs are not a waste of time.*
69% 70% 73%
0%
25%
50%
75%
100%
admission graduation parole
perc
ent
I. The Boot Camp will help me learn self-discipline.
87%85%93%
0%
25%
50%
75%
100%
admission graduation parole
perc
ent
j. Because of my experiences here, I will probably not get into trouble again.
79%67% 68%
0%
25%
50%
75%
100%
admission graduation parole
perc
ent
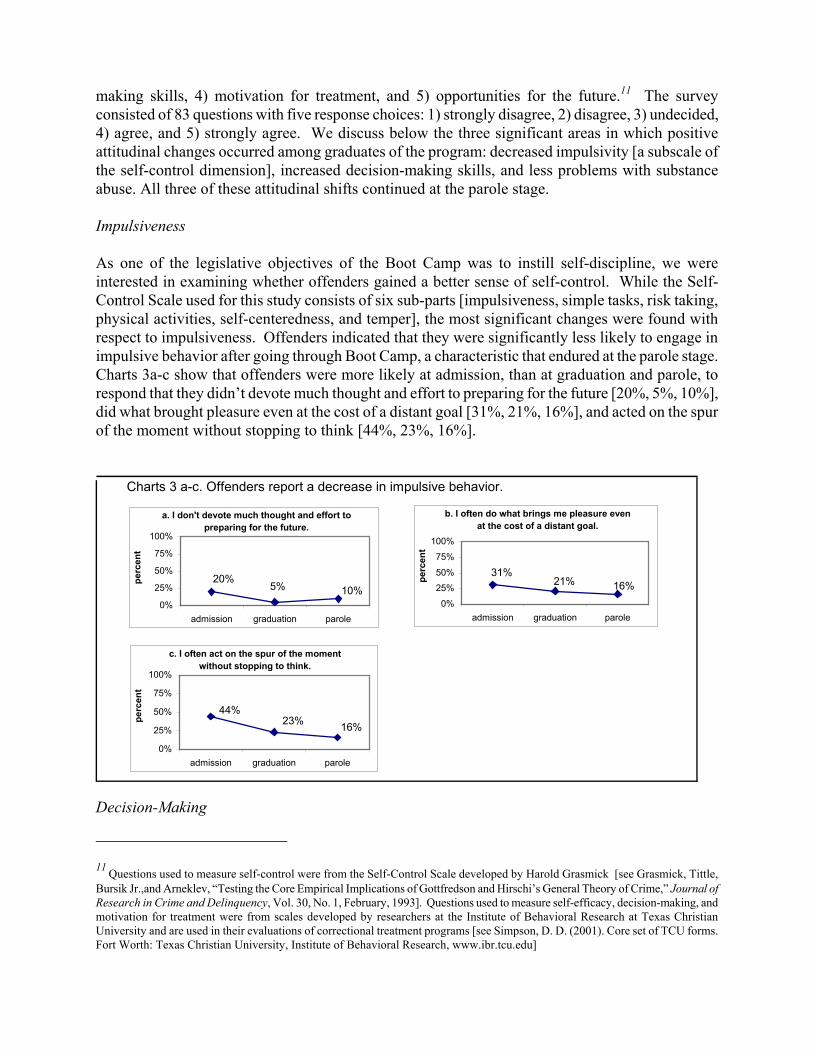
making skills, 4) motivation for treatment, and 5) opportunities for the future.11 The survey consisted of 83 questions with five response choices: 1) strongly disagree, 2) disagree, 3) undecided, 4) agree, and 5) strongly agree. We discuss below the three significant areas in which positive attitudinal changes occurred among graduates of the program: decreased impulsivity [a subscale of the self-control dimension], increased decision-making skills, and less problems with substance abuse. All three of these attitudinal shifts continued at the parole stage. Impulsiveness As one of the legislative objectives of the Boot Camp was to instill self-discipline, we were interested in examining whether offenders gained a better sense of self-control. While the Self-Control Scale used for this study consists of six sub-parts [impulsiveness, simple tasks, risk taking, physical activities, self-centeredness, and temper], the most significant changes were found with respect to impulsiveness. Offenders indicated that they were significantly less likely to engage in impulsive behavior after going through Boot Camp, a characteristic that endured at the parole stage. Charts 3a-c show that offenders were more likely at admission, than at graduation and parole, to respond that they didn�’t devote much thought and effort to preparing for the future [20%, 5%, 10%], did what brought pleasure even at the cost of a distant goal [31%, 21%, 16%], and acted on the spur of the moment without stopping to think [44%, 23%, 16%].
Decision-Making
11 Questions used to measure self-control were from the Self-Control Scale developed by Harold Grasmick [see Grasmick, Tittle, Bursik Jr.,and Arneklev, �“Testing the Core Empirical Implications of Gottfredson and Hirschi�’s General Theory of Crime,�” Journal of Research in Crime and Delinquency, Vol. 30, No. 1, February, 1993]. Questions used to measure self-efficacy, decision-making, and motivation for treatment were from scales developed by researchers at the Institute of Behavioral Research at Texas Christian University and are used in their evaluations of correctional treatment programs [see Simpson, D. D. (2001). Core set of TCU forms. Fort Worth: Texas Christian University, Institute of Behavioral Research, www.ibr.tcu.edu]
Charts 3 a-c. Offenders report a decrease in impulsive behavior.
a. I don't devote much thought and effort to preparing for the future.
10%20%
5%
0%
25%
50%
75%
100%
admission graduation parole
perc
ent
b. I often do what brings me pleasure even at the cost of a distant goal.
21%31%
16%0%
25%
50%
75%
100%
admission graduation parole
perc
ent
c. I often act on the spur of the moment without stopping to think.
16%23%44%
0%
25%
50%
75%
100%
admission graduation parole
perc
ent
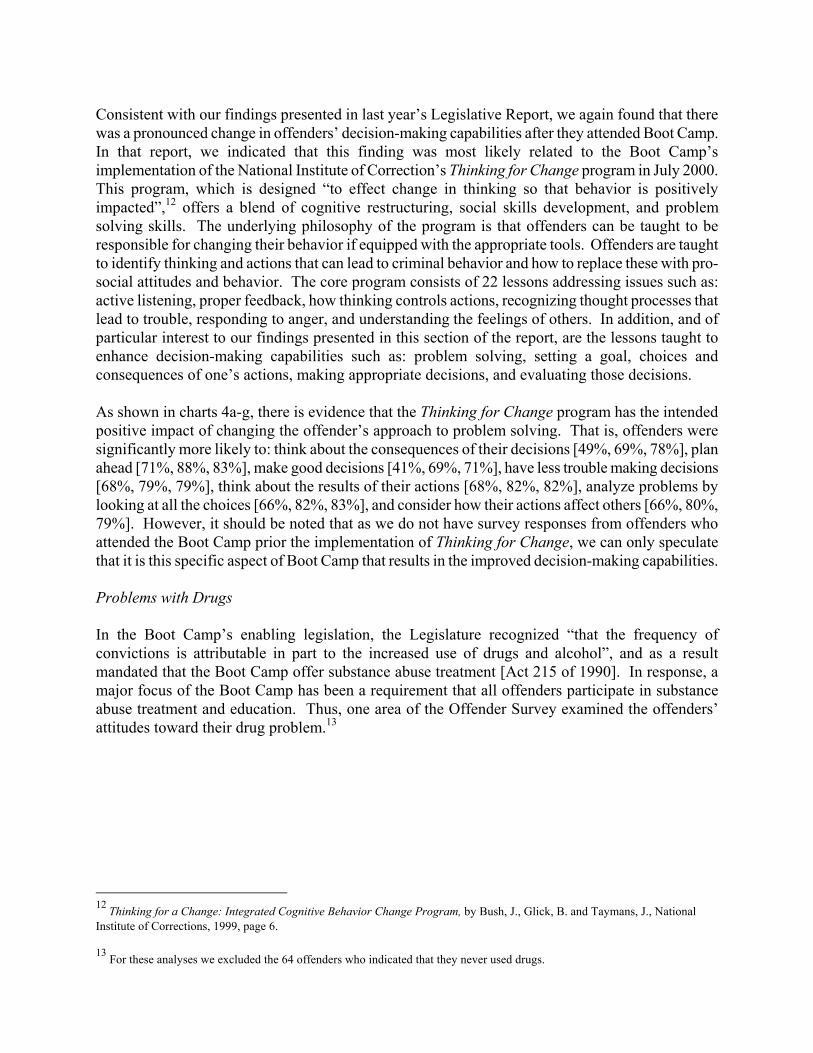
Consistent with our findings presented in last year�’s Legislative Report, we again found that there was a pronounced change in offenders�’ decision-making capabilities after they attended Boot Camp. In that report, we indicated that this finding was most likely related to the Boot Camp�’s implementation of the National Institute of Correction�’s Thinking for Change program in July 2000. This program, which is designed �“to effect change in thinking so that behavior is positively impacted�”,12 offers a blend of cognitive restructuring, social skills development, and problem solving skills. The underlying philosophy of the program is that offenders can be taught to be responsible for changing their behavior if equipped with the appropriate tools. Offenders are taught to identify thinking and actions that can lead to criminal behavior and how to replace these with pro-social attitudes and behavior. The core program consists of 22 lessons addressing issues such as: active listening, proper feedback, how thinking controls actions, recognizing thought processes that lead to trouble, responding to anger, and understanding the feelings of others. In addition, and of particular interest to our findings presented in this section of the report, are the lessons taught to enhance decision-making capabilities such as: problem solving, setting a goal, choices and consequences of one�’s actions, making appropriate decisions, and evaluating those decisions. As shown in charts 4a-g, there is evidence that the Thinking for Change program has the intended positive impact of changing the offender�’s approach to problem solving. That is, offenders were significantly more likely to: think about the consequences of their decisions [49%, 69%, 78%], plan ahead [71%, 88%, 83%], make good decisions [41%, 69%, 71%], have less trouble making decisions [68%, 79%, 79%], think about the results of their actions [68%, 82%, 82%], analyze problems by looking at all the choices [66%, 82%, 83%], and consider how their actions affect others [66%, 80%, 79%]. However, it should be noted that as we do not have survey responses from offenders who attended the Boot Camp prior the implementation of Thinking for Change, we can only speculate that it is this specific aspect of Boot Camp that results in the improved decision-making capabilities. Problems with Drugs In the Boot Camp�’s enabling legislation, the Legislature recognized �“that the frequency of convictions is attributable in part to the increased use of drugs and alcohol�”, and as a result mandated that the Boot Camp offer substance abuse treatment [Act 215 of 1990]. In response, a major focus of the Boot Camp has been a requirement that all offenders participate in substance abuse treatment and education. Thus, one area of the Offender Survey examined the offenders�’ attitudes toward their drug problem.13
12 Thinking for a Change: Integrated Cognitive Behavior Change Program, by Bush, J., Glick, B. and Taymans, J., National Institute of Corrections, 1999, page 6. 13 For these analyses we excluded the 64 offenders who indicated that they never used drugs.
Charts 4 a-g. Offenders Indicate improvement in their decision-making skills
a. I make decisions thinking about the consequences.*
69%49%
78%
0%
25%
50%
75%
100%
admission graduation parole
perc
ent
b. I plan ahead.
83%71%88%
0%
25%
50%
75%
100%
admission graduation parole
perc
ent
d. I don�’t have trouble making decisions. *
79%
68%79%
0%
25%
50%
75%
100%
admission graduation parolepe
rcen
t
e. I think about the results of my actions.
82%82%
68%
0%
25%
50%
75%
100%
admission graduation parole
perc
ent
f. I analyze problems by looking at all the choices.
83%82%
66%
0%
25%
50%
75%
100%
admission graduation parole
perc
ent
c. I make good decisions.
41%
71%69%
0%
25%
50%
75%
100%
admission graduation parole
perc
ent
g. I consider how my actions will affect others.
79%80%66%
0%
25%
50%
75%
100%
admission graduation parole
perc
ent
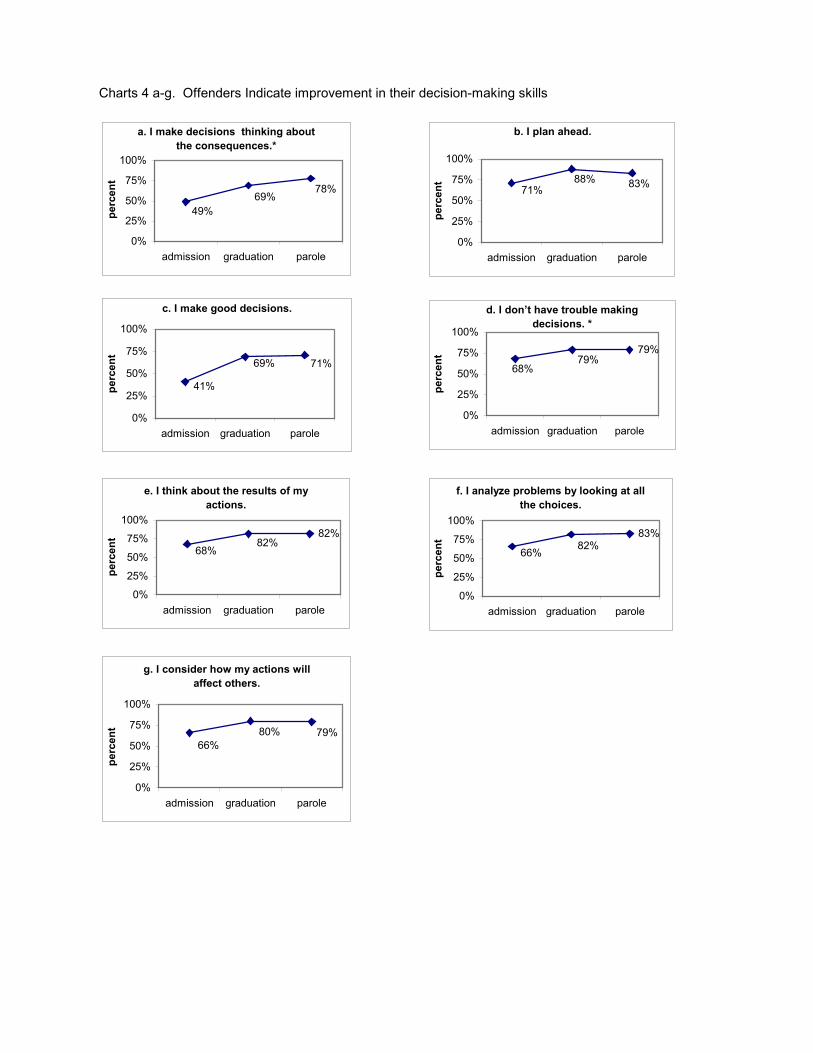
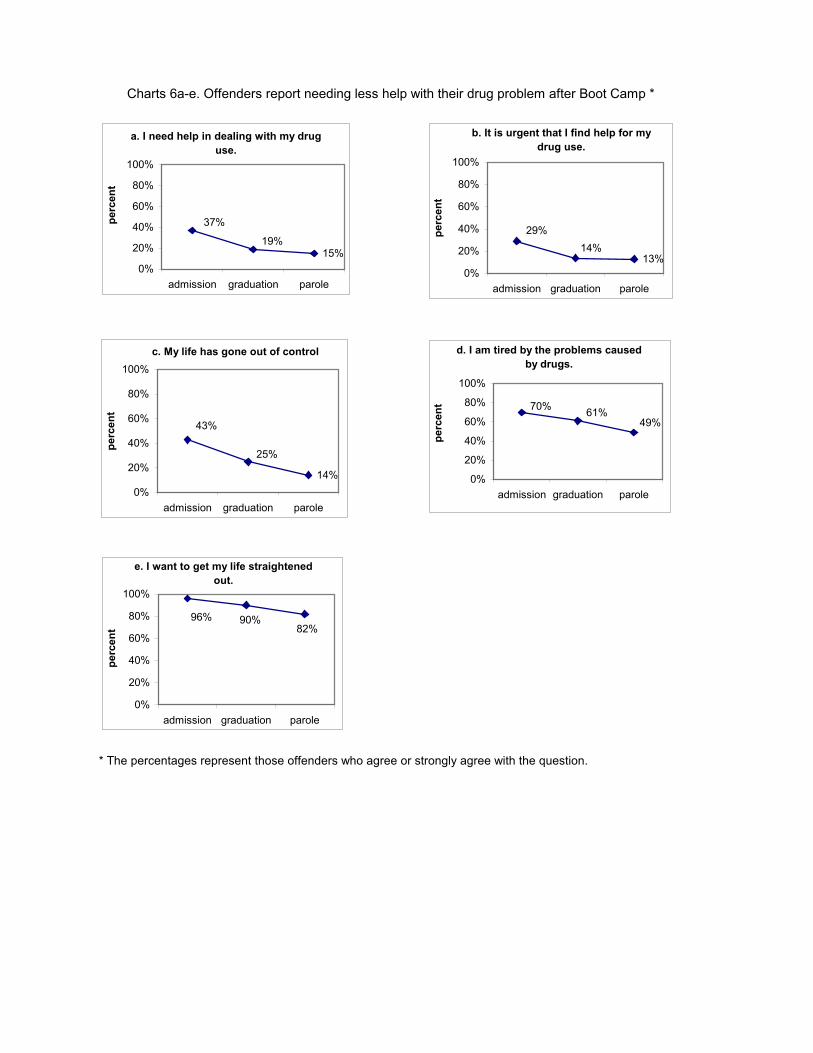
Overall, while most offenders did not view their drug use as presenting problems for them when they entered the Boot Camp, a sizable percentage did indicate the negative impact that drugs were having in their lives. Further, offenders report having less problems with drugs after graduating from Boot Camp and while on parole. Charts 5a-f show that offenders were significantly less likely than before to view drugs as being a problem for them [38%, 22%, 14%], making their lives worse [41%, 29%, 22%], creating more trouble than they were worth [51%, 39%, 32%], causing trouble with the law [53%, 38%, 21%], their work [40%, 27%, 13%], or health [ 30%, 25%, 16%]. In addition, as shown in Charts 6a-e, offenders were significantly less likely to report needing help with their drug use [37%, 19%, 15%], having an urgency to find help for their drug problem [29%, 14%, 13%], feeling that their lives were out of control [43%, 25%, 14%], being tired of the problems caused by drugs [70%, 61%, 49%], and wanting to get their lives straightened out [96%, 90%, 82%].
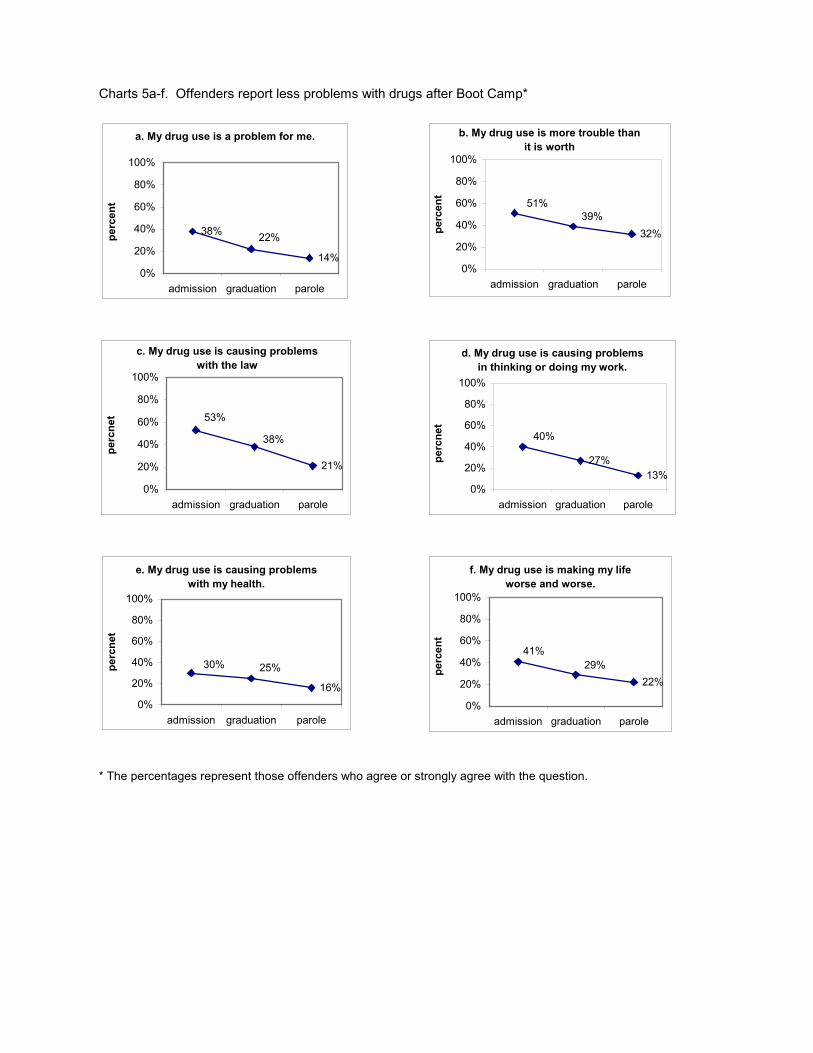
Charts 5a-f. Offenders report less problems with drugs after Boot Camp*
* The percentages represent those offenders who agree or strongly agree with the question.
a. My drug use is a problem for me.
38%
14%
22%
0%
20%
40%
60%
80%
100%
admission graduation parole
perc
ent
b. My drug use is more trouble than it is worth
32%39%
51%
0%
20%
40%
60%
80%
100%
admission graduation parole
perc
ent
c. My drug use is causing problems with the law
21%
38%
53%
0%
20%
40%
60%
80%
100%
admission graduation parole
perc
net
d. My drug use is causing problems in thinking or doing my work.
27%13%
40%
0%
20%
40%
60%
80%
100%
admission graduation parole
perc
net
e. My drug use is causing problems with my health.
16%
25%30%
0%
20%
40%
60%
80%
100%
admission graduation parole
perc
net
f. My drug use is making my life worse and worse.
22%29%
41%
0%
20%
40%
60%
80%
100%
admission graduation parole
perc
ent
* The percentages represent those offenders who agree or strongly agree with the question.
Charts 6a-e. Offenders report needing less help with their drug problem after Boot Camp *
a. I need help in dealing with my drug use.
15%19%
37%
0%
20%
40%
60%
80%
100%
admission graduation parole
perc
ent
c. My life has gone out of control
14%
43%
25%
0%
20%
40%
60%
80%
100%
admission graduation parole
perc
ent
b. It is urgent that I find help for my drug use.
13%
29%14%
0%
20%
40%
60%
80%
100%
admission graduation parole
perc
ent
e. I want to get my life straightened out.
82%90%96%
0%
20%
40%
60%
80%
100%
admission graduation parole
perc
ent
d. I am tired by the problems caused by drugs.
49%61%70%
0%
20%
40%
60%
80%
100%
admission graduation parole
perc
ent
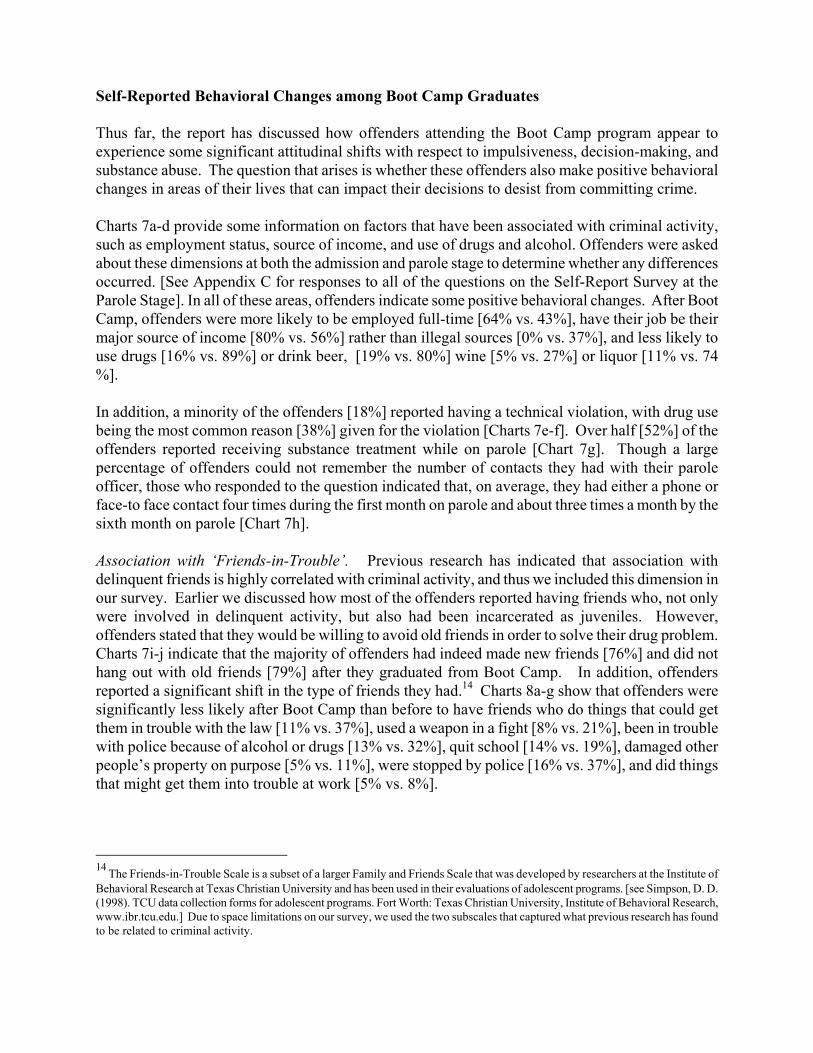
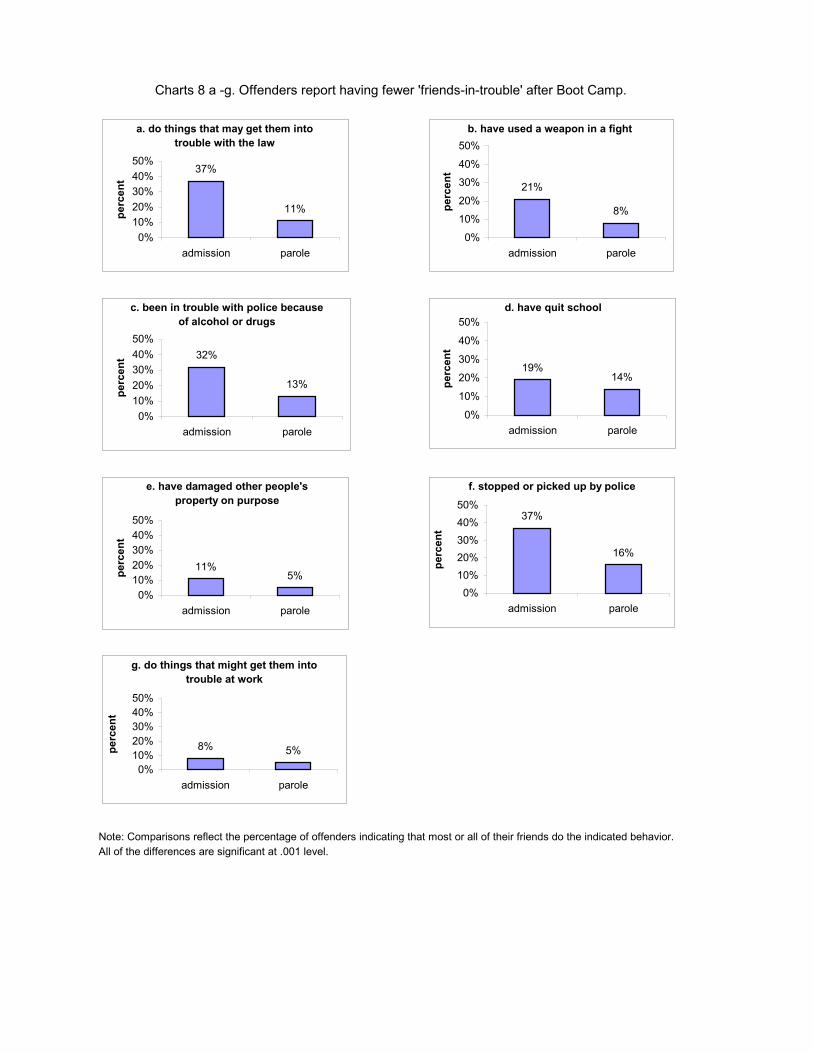
Self-Reported Behavioral Changes among Boot Camp Graduates Thus far, the report has discussed how offenders attending the Boot Camp program appear to experience some significant attitudinal shifts with respect to impulsiveness, decision-making, and substance abuse. The question that arises is whether these offenders also make positive behavioral changes in areas of their lives that can impact their decisions to desist from committing crime. Charts 7a-d provide some information on factors that have been associated with criminal activity, such as employment status, source of income, and use of drugs and alcohol. Offenders were asked about these dimensions at both the admission and parole stage to determine whether any differences occurred. [See Appendix C for responses to all of the questions on the Self-Report Survey at the Parole Stage]. In all of these areas, offenders indicate some positive behavioral changes. After Boot Camp, offenders were more likely to be employed full-time [64% vs. 43%], have their job be their major source of income [80% vs. 56%] rather than illegal sources [0% vs. 37%], and less likely to use drugs [16% vs. 89%] or drink beer, [19% vs. 80%] wine [5% vs. 27%] or liquor [11% vs. 74 %]. In addition, a minority of the offenders [18%] reported having a technical violation, with drug use being the most common reason [38%] given for the violation [Charts 7e-f]. Over half [52%] of the offenders reported receiving substance treatment while on parole [Chart 7g]. Though a large percentage of offenders could not remember the number of contacts they had with their parole officer, those who responded to the question indicated that, on average, they had either a phone or face-to face contact four times during the first month on parole and about three times a month by the sixth month on parole [Chart 7h]. Association with �‘Friends-in-Trouble�’. Previous research has indicated that association with delinquent friends is highly correlated with criminal activity, and thus we included this dimension in our survey. Earlier we discussed how most of the offenders reported having friends who, not only were involved in delinquent activity, but also had been incarcerated as juveniles. However, offenders stated that they would be willing to avoid old friends in order to solve their drug problem. Charts 7i-j indicate that the majority of offenders had indeed made new friends [76%] and did not hang out with old friends [79%] after they graduated from Boot Camp. In addition, offenders reported a significant shift in the type of friends they had.14 Charts 8a-g show that offenders were significantly less likely after Boot Camp than before to have friends who do things that could get them in trouble with the law [11% vs. 37%], used a weapon in a fight [8% vs. 21%], been in trouble with police because of alcohol or drugs [13% vs. 32%], quit school [14% vs. 19%], damaged other people�’s property on purpose [5% vs. 11%], were stopped by police [16% vs. 37%], and did things that might get them into trouble at work [5% vs. 8%].
14 The Friends-in-Trouble Scale is a subset of a larger Family and Friends Scale that was developed by researchers at the Institute of Behavioral Research at Texas Christian University and has been used in their evaluations of adolescent programs. [see Simpson, D. D. (1998). TCU data collection forms for adolescent programs. Fort Worth: Texas Christian University, Institute of Behavioral Research, www.ibr.tcu.edu.] Due to space limitations on our survey, we used the two subscales that captured what previous research has found to be related to criminal activity.
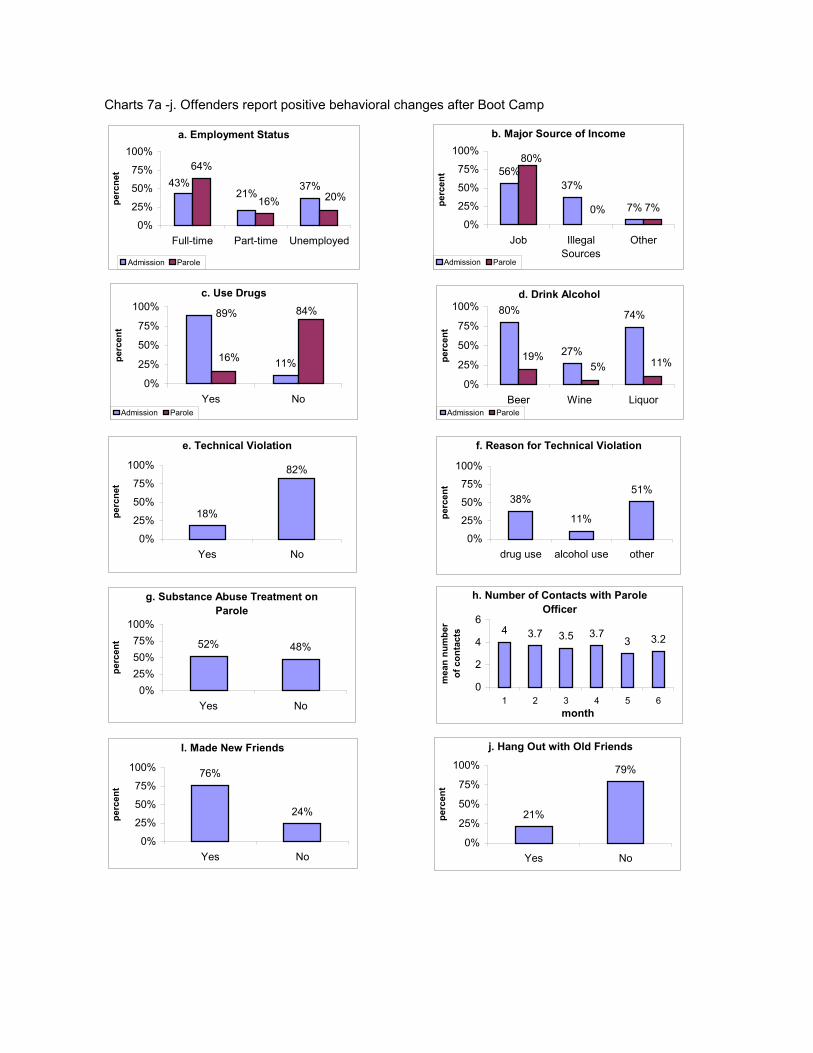
Charts 7a -j. Offenders report positive behavioral changes after Boot Camp
a. Employment Status
37%
64%43%
21% 20%16%
0%
25%
50%
75%
100%
Full-time Part-time Unemployed
perc
net
Admission Parole
b. Major Source of Income
56%37%
7% 7%
80%
0%0%
25%
50%
75%
100%
Job IllegalSources
Other
perc
ent
Admission Parole
c. Use Drugs
11%
89% 84%
16%
0%
25%
50%
75%
100%
Yes No
perc
ent
Admission Parole
d. Drink Alcohol80%
27%
74%
11%5%19%
0%
25%
50%
75%
100%
Beer Wine Liquor
perc
ent
Admission Parole
e. Technical Violation
18%
82%
0%
25%
50%
75%
100%
Yes No
perc
net
g. Substance Abuse Treatment on Parole
52% 48%
0%25%50%75%
100%
Yes No
perc
ent
h. Number of Contacts with Parole Officer
4 3.7 3.5 3.73 3.2
0
2
4
6
1 2 3 4 5 6month
mea
n nu
mbe
r of
con
tact
s
I. Made New Friends
76%
24%
0%
25%
50%
75%
100%
Yes No
perc
ent
f. Reason for Technical Violation
38%
11%
51%
0%
25%
50%
75%
100%
drug use alcohol use other
perc
ent
j. Hang Out with Old Friends
21%
79%
0%
25%
50%
75%
100%
Yes No
perc
ent
Note: Comparisons reflect the percentage of offenders indicating that most or all of their friends do the indicated behavior. All of the differences are significant at .001 level.
Charts 8 a -g. Offenders report having fewer 'friends-in-trouble' after Boot Camp.
a. do things that may get them into trouble with the law
37%
11%
0%10%20%30%40%50%
admission parole
perc
ent
b. have used a weapon in a fight
21%
8%
0%
10%
20%
30%
40%
50%
admission parole
perc
ent
c. been in trouble with police because of alcohol or drugs
32%
13%
0%10%20%30%40%50%
admission parole
perc
ent
d. have quit school
19%14%
0%
10%
20%
30%
40%
50%
admission parolepe
rcen
t
e. have damaged other people's property on purpose
11%5%
0%10%20%30%40%50%
admission parole
perc
ent
f. stopped or picked up by police
37%
16%
0%10%20%30%40%50%
admission parole
perc
ent
g. do things that might get them into trouble at work
8% 5%
0%10%20%30%40%50%
admission parole
perc
ent
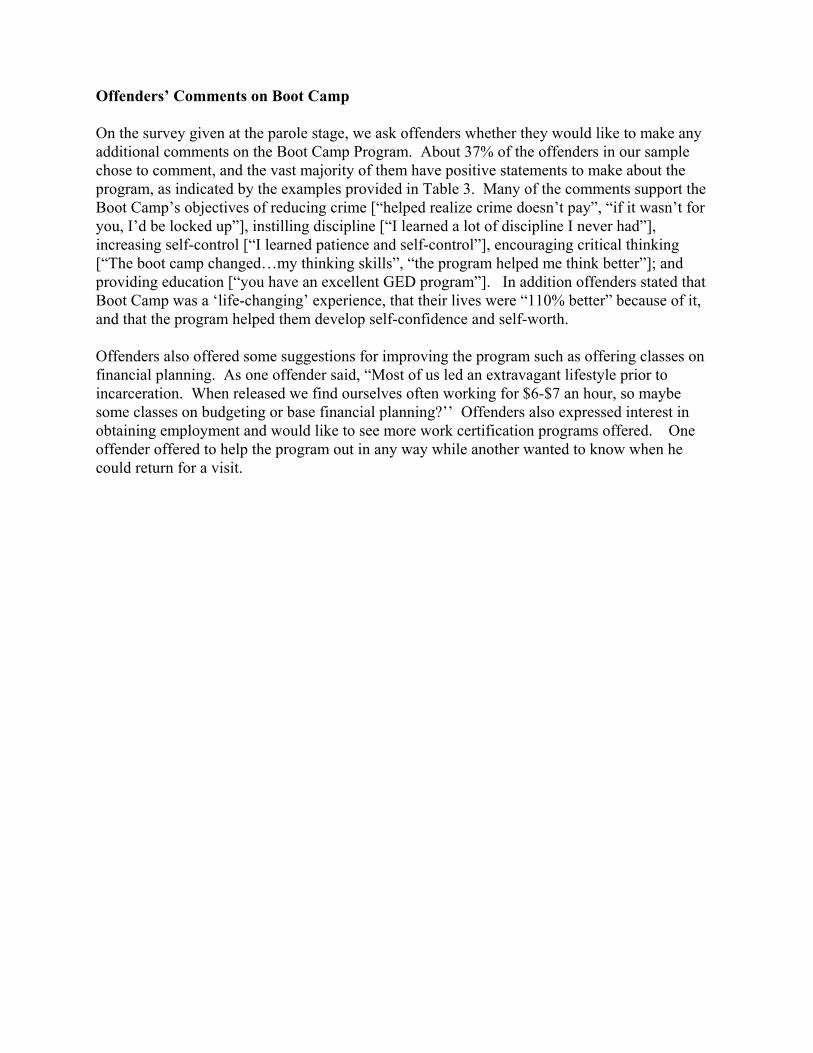
Offenders�’ Comments on Boot Camp On the survey given at the parole stage, we ask offenders whether they would like to make any additional comments on the Boot Camp Program. About 37% of the offenders in our sample chose to comment, and the vast majority of them have positive statements to make about the program, as indicated by the examples provided in Table 3. Many of the comments support the Boot Camp�’s objectives of reducing crime [�“helped realize crime doesn�’t pay�”, �“if it wasn�’t for you, I�’d be locked up�”], instilling discipline [�“I learned a lot of discipline I never had�”], increasing self-control [�“I learned patience and self-control�”], encouraging critical thinking [�“The boot camp changed�…my thinking skills�”, �“the program helped me think better�”]; and providing education [�“you have an excellent GED program�”]. In addition offenders stated that Boot Camp was a �‘life-changing�’ experience, that their lives were �“110% better�” because of it, and that the program helped them develop self-confidence and self-worth. Offenders also offered some suggestions for improving the program such as offering classes on financial planning. As one offender said, �“Most of us led an extravagant lifestyle prior to incarceration. When released we find ourselves often working for $6-$7 an hour, so maybe some classes on budgeting or base financial planning?�’�’ Offenders also expressed interest in obtaining employment and would like to see more work certification programs offered. One offender offered to help the program out in any way while another wanted to know when he could return for a visit.
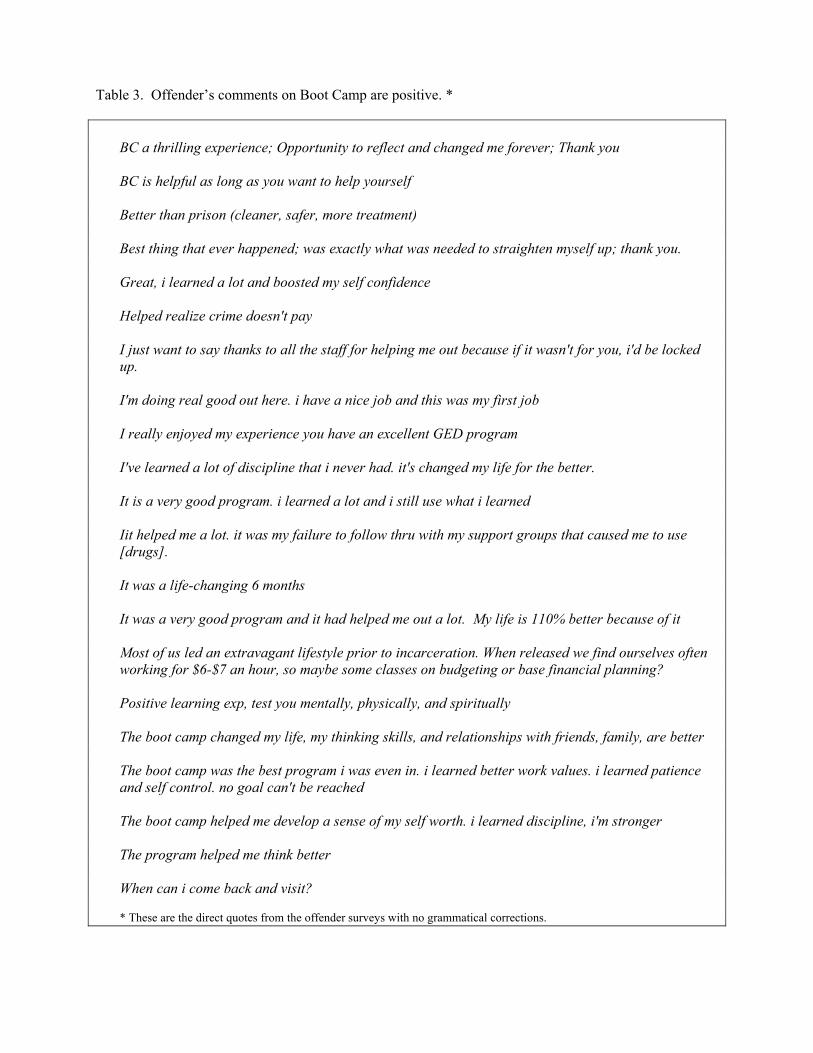
Table 3. Offender�’s comments on Boot Camp are positive. *
BC a thrilling experience; Opportunity to reflect and changed me forever; Thank you BC is helpful as long as you want to help yourself Better than prison (cleaner, safer, more treatment) Best thing that ever happened; was exactly what was needed to straighten myself up; thank you. Great, i learned a lot and boosted my self confidence Helped realize crime doesn't pay I just want to say thanks to all the staff for helping me out because if it wasn't for you, i'd be locked up. I'm doing real good out here. i have a nice job and this was my first job I really enjoyed my experience you have an excellent GED program I've learned a lot of discipline that i never had. it's changed my life for the better. It is a very good program. i learned a lot and i still use what i learned Iit helped me a lot. it was my failure to follow thru with my support groups that caused me to use [drugs]. It was a life-changing 6 months It was a very good program and it had helped me out a lot. My life is 110% better because of it Most of us led an extravagant lifestyle prior to incarceration. When released we find ourselves often working for $6-$7 an hour, so maybe some classes on budgeting or base financial planning? Positive learning exp, test you mentally, physically, and spiritually The boot camp changed my life, my thinking skills, and relationships with friends, family, are better The boot camp was the best program i was even in. i learned better work values. i learned patience and self control. no goal can't be reached The boot camp helped me develop a sense of my self worth. i learned discipline, i'm stronger The program helped me think better When can i come back and visit? * These are the direct quotes from the offender surveys with no grammatical corrections.
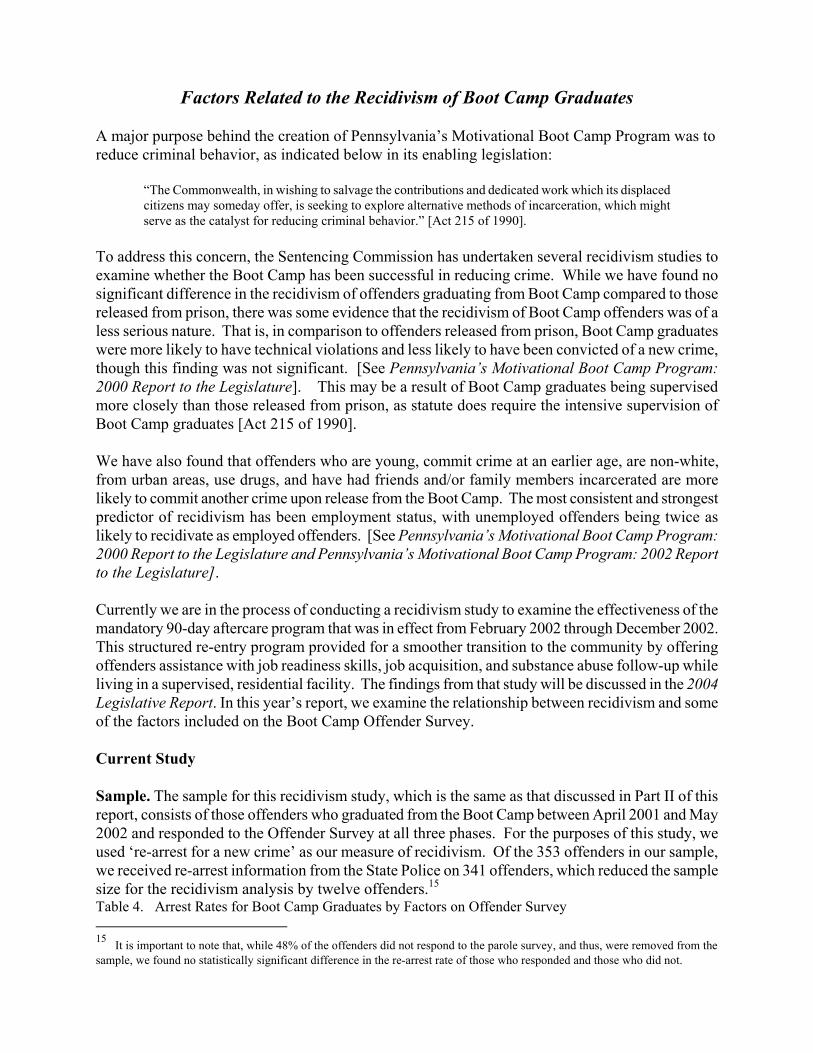
Factors Related to the Recidivism of Boot Camp Graduates A major purpose behind the creation of Pennsylvania�’s Motivational Boot Camp Program was to reduce criminal behavior, as indicated below in its enabling legislation:
�“The Commonwealth, in wishing to salvage the contributions and dedicated work which its displaced citizens may someday offer, is seeking to explore alternative methods of incarceration, which might serve as the catalyst for reducing criminal behavior.�” [Act 215 of 1990].
To address this concern, the Sentencing Commission has undertaken several recidivism studies to examine whether the Boot Camp has been successful in reducing crime. While we have found no significant difference in the recidivism of offenders graduating from Boot Camp compared to those released from prison, there was some evidence that the recidivism of Boot Camp offenders was of a less serious nature. That is, in comparison to offenders released from prison, Boot Camp graduates were more likely to have technical violations and less likely to have been convicted of a new crime, though this finding was not significant. [See Pennsylvania�’s Motivational Boot Camp Program: 2000 Report to the Legislature]. This may be a result of Boot Camp graduates being supervised more closely than those released from prison, as statute does require the intensive supervision of Boot Camp graduates [Act 215 of 1990]. We have also found that offenders who are young, commit crime at an earlier age, are non-white, from urban areas, use drugs, and have had friends and/or family members incarcerated are more likely to commit another crime upon release from the Boot Camp. The most consistent and strongest predictor of recidivism has been employment status, with unemployed offenders being twice as likely to recidivate as employed offenders. [See Pennsylvania�’s Motivational Boot Camp Program: 2000 Report to the Legislature and Pennsylvania�’s Motivational Boot Camp Program: 2002 Report to the Legislature]. Currently we are in the process of conducting a recidivism study to examine the effectiveness of the mandatory 90-day aftercare program that was in effect from February 2002 through December 2002. This structured re-entry program provided for a smoother transition to the community by offering offenders assistance with job readiness skills, job acquisition, and substance abuse follow-up while living in a supervised, residential facility. The findings from that study will be discussed in the 2004 Legislative Report. In this year�’s report, we examine the relationship between recidivism and some of the factors included on the Boot Camp Offender Survey. Current Study Sample. The sample for this recidivism study, which is the same as that discussed in Part II of this report, consists of those offenders who graduated from the Boot Camp between April 2001 and May 2002 and responded to the Offender Survey at all three phases. For the purposes of this study, we used �‘re-arrest for a new crime�’ as our measure of recidivism. Of the 353 offenders in our sample, we received re-arrest information from the State Police on 341 offenders, which reduced the sample size for the recidivism analysis by twelve offenders.15 Table 4. Arrest Rates for Boot Camp Graduates by Factors on Offender Survey 15 It is important to note that, while 48% of the offenders did not respond to the parole survey, and thus, were removed from the sample, we found no statistically significant difference in the re-arrest rate of those who responded and those who did not.
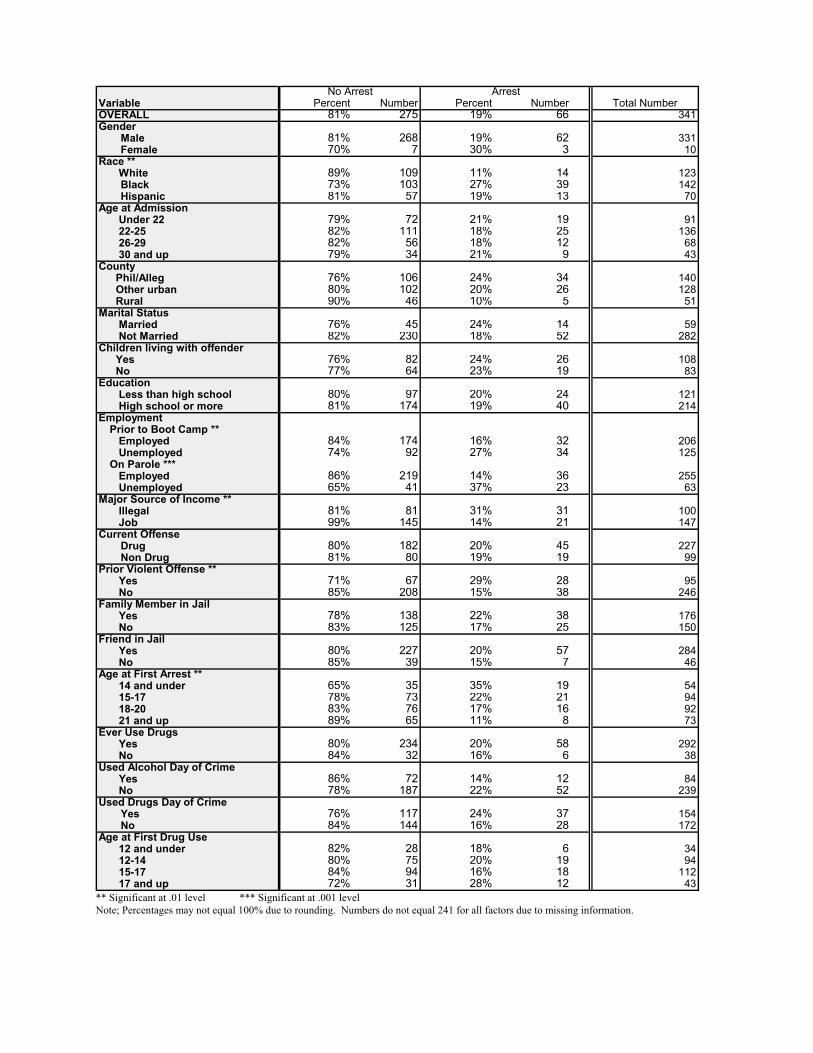
** Significant at .01 level *** Significant at .001 level Note; Percentages may not equal 100% due to rounding. Numbers do not equal 241 for all factors due to missing information.
Variable Percent Number Percent Number Total NumberOVERALL 81% 275 19% 66 341Gender
Male 81% 268 19% 62 331Female 70% 7 30% 3 10
Race ** White 89% 109 11% 14 123
Black 73% 103 27% 39 142Hispanic 81% 57 19% 13 70
Age at Admission Under 22 79% 72 21% 19 91 22-25 82% 111 18% 25 136 26-29 82% 56 18% 12 68 30 and up 79% 34 21% 9 43
County Phil/Alleg 76% 106 24% 34 140 Other urban 80% 102 20% 26 128 Rural 90% 46 10% 5 51
Marital Status Married 76% 45 24% 14 59 Not Married 82% 230 18% 52 282
Children living with offender Yes 76% 82 24% 26 108 No 77% 64 23% 19 83
Education Less than high school 80% 97 20% 24 121 High school or more 81% 174 19% 40 214
EmploymentPrior to Boot Camp ** Employed 84% 174 16% 32 206 Unemployed 74% 92 27% 34 125On Parole *** Employed 86% 219 14% 36 255 Unemployed 65% 41 37% 23 63
Major Source of Income ** Illegal 81% 81 31% 31 100 Job 99% 145 14% 21 147
Current OffenseDrug 80% 182 20% 45 227Non Drug 81% 80 19% 19 99
Prior Violent Offense ** Yes 71% 67 29% 28 95 No 85% 208 15% 38 246
Family Member in Jail Yes 78% 138 22% 38 176 No 83% 125 17% 25 150
Friend in Jail Yes 80% 227 20% 57 284 No 85% 39 15% 7 46
Age at First Arrest ** 14 and under 65% 35 35% 19 54 15-17 78% 73 22% 21 94 18-20 83% 76 17% 16 92 21 and up 89% 65 11% 8 73
Ever Use Drugs Yes 80% 234 20% 58 292 No 84% 32 16% 6 38
Used Alcohol Day of Crime Yes 86% 72 14% 12 84 No 78% 187 22% 52 239
Used Drugs Day of CrimeYes 76% 117 24% 37 154No 84% 144 16% 28 172
Age at First Drug Use 12 and under 82% 28 18% 6 34 12-14 80% 75 20% 19 94 15-17 84% 94 16% 18 112 17 and up 72% 31 28% 12 43
ArrestNo Arrest
Findings Table 4 presents the results of the bivariate analysis that examined re-arrest rates by several factors obtained via the Offender Survey. Overall, 19% of the offenders in the sample were re-arrested for a new crime during the tracking period, which ranged from 7-26 months. With respect to demographic information, we found that the offender�’s race/ethnicity, employment status prior to Boot Camp, employment status after Boot Camp, and major source of income were significantly related to recidivism. With respect to race/ethnicity, white and Hispanic offenders were less likely than black offenders to be arrested for a new crime [11%, 19%, and 27% respectively]. Offenders who were employed prior to going to Boot Camp were less likely than unemployed offenders to recidivate [16% vs. 26%] as were those who were employed after going through the program [14% vs. 35%]. In addition, offenders who indicated that their job was their major source of income prior to Boot Camp were also less likely to recidivate than those who identified illegal sources as their primary means of earning money [14% vs. 31%]. In examining factors related to criminal activity, we found that there was a significant relationship between recidivism and prior violent crimes, age at first arrest, and type of friends. About 92% of the offenders had engaged in prior criminal activity, and we found that those committing prior violent offenses were more likely to recidivate than those who had not [29% vs. 15%]. We found no difference in the recidivism rates of offenders who had committed prior property or drug offenses. The younger offenders were at age of first arrest, the more likely they were to be re-arrested for a new crime after Boot Camp. About 35% of offenders under age 15 at first arrest recidivated in comparison to 11% of those who were 21 or older. While we found that offenders who used drugs [either the day of their crime or at some point in their past] were more likely to recidivate, this finding was not significant. In the previous section we discussed four areas in which offenders reported changes after attending the Boot Camp Program: a decrease in impulsivity, an increase in decision-making skills, having less of a problem with drugs, and associating less with �‘friends-in-trouble�’. Thus, we were interested in knowing whether offenders who indicated that they had made these changes in their lives were also less likely to recidivate. Table 5 shows the mean scores for the scales used to measure these four areas by whether the offender was arrested for a new crime or not after graduating from Boot Camp. The only factor for which there was a significant difference in the arrest rates was with respect to associating with �‘friends-in-trouble�’. For this factor, we used a scale that consisted of questions asking offenders how many of their friends used a weapon in a fight, had been in trouble with police because of drugs, had quit school, had intentionally damaged property, and engaged in activity that could get them into trouble at work. Offenders who indicated that they were more likely to have �‘friends-in-trouble�’ were more likely to recidivate. At the parole stage, the difference in the mean score on the �‘friends-in-trouble�’ scale was significantly higher for offenders who committed a new crime in comparison to those offenders who did not [17.2 vs. 13. 7].
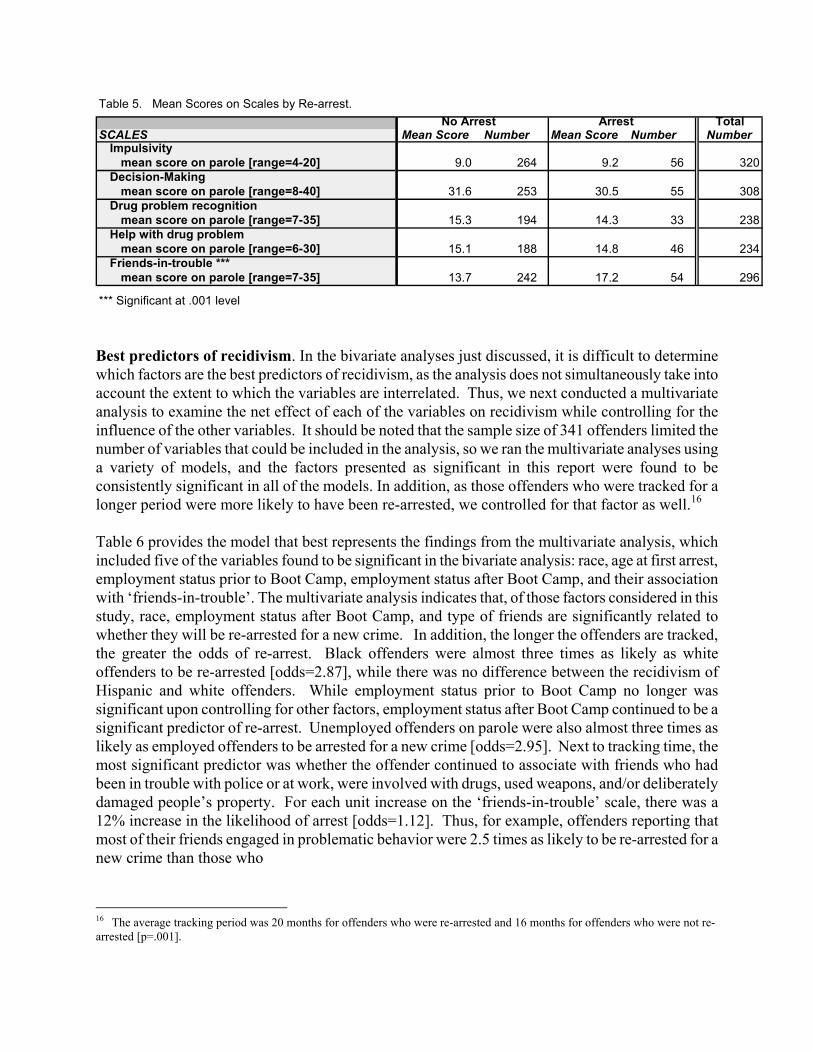
Best predictors of recidivism. In the bivariate analyses just discussed, it is difficult to determine which factors are the best predictors of recidivism, as the analysis does not simultaneously take into account the extent to which the variables are interrelated. Thus, we next conducted a multivariate analysis to examine the net effect of each of the variables on recidivism while controlling for the influence of the other variables. It should be noted that the sample size of 341 offenders limited the number of variables that could be included in the analysis, so we ran the multivariate analyses using a variety of models, and the factors presented as significant in this report were found to be consistently significant in all of the models. In addition, as those offenders who were tracked for a longer period were more likely to have been re-arrested, we controlled for that factor as well.16 Table 6 provides the model that best represents the findings from the multivariate analysis, which included five of the variables found to be significant in the bivariate analysis: race, age at first arrest, employment status prior to Boot Camp, employment status after Boot Camp, and their association with �‘friends-in-trouble�’. The multivariate analysis indicates that, of those factors considered in this study, race, employment status after Boot Camp, and type of friends are significantly related to whether they will be re-arrested for a new crime. In addition, the longer the offenders are tracked, the greater the odds of re-arrest. Black offenders were almost three times as likely as white offenders to be re-arrested [odds=2.87], while there was no difference between the recidivism of Hispanic and white offenders. While employment status prior to Boot Camp no longer was significant upon controlling for other factors, employment status after Boot Camp continued to be a significant predictor of re-arrest. Unemployed offenders on parole were also almost three times as likely as employed offenders to be arrested for a new crime [odds=2.95]. Next to tracking time, the most significant predictor was whether the offender continued to associate with friends who had been in trouble with police or at work, were involved with drugs, used weapons, and/or deliberately damaged people�’s property. For each unit increase on the �‘friends-in-trouble�’ scale, there was a 12% increase in the likelihood of arrest [odds=1.12]. Thus, for example, offenders reporting that most of their friends engaged in problematic behavior were 2.5 times as likely to be re-arrested for a new crime than those who
16 The average tracking period was 20 months for offenders who were re-arrested and 16 months for offenders who were not re-arrested [p=.001].
Table 5. Mean Scores on Scales by Re-arrest. Total
SCALES Mean Score Number Mean Score Number NumberImpulsivity
mean score on parole [range=4-20] 9.0 264 9.2 56 320Decision-Making
mean score on parole [range=8-40] 31.6 253 30.5 55 308Drug problem recognition
mean score on parole [range=7-35] 15.3 194 14.3 33 238Help with drug problem
mean score on parole [range=6-30] 15.1 188 14.8 46 234Friends-in-trouble ***
mean score on parole [range=7-35] 13.7 242 17.2 54 296
*** Significant at .001 level
No Arrest Arrest
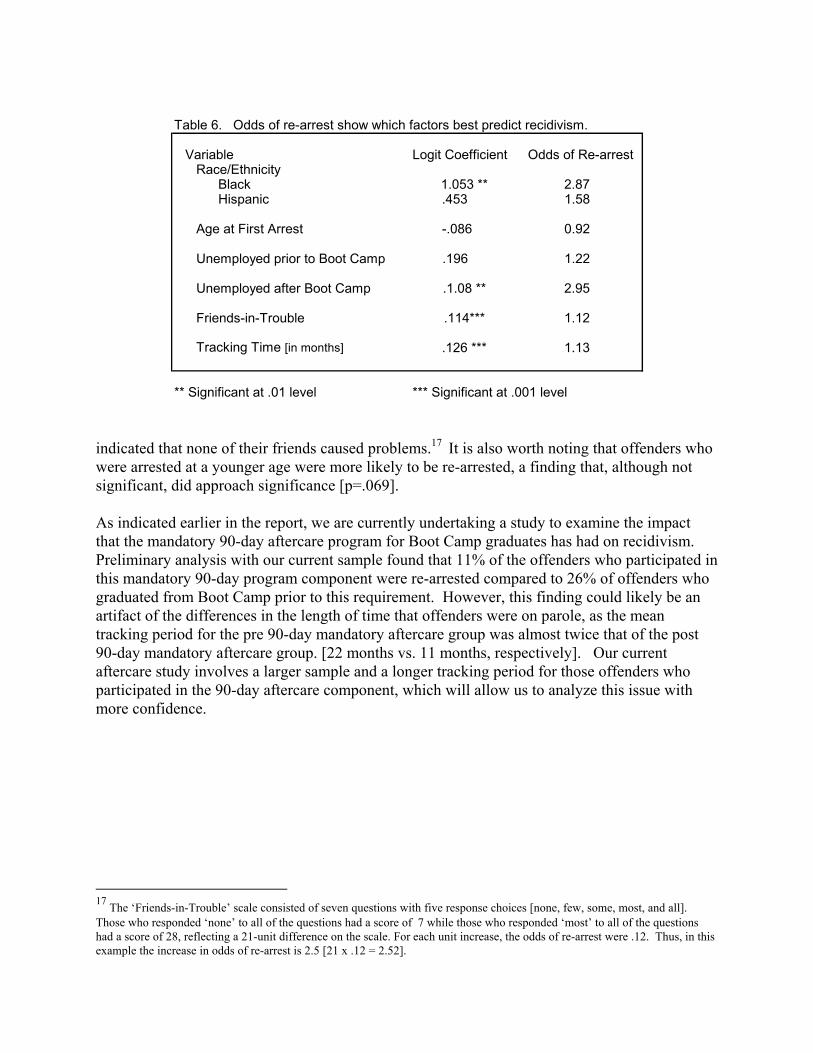
indicated that none of their friends caused problems.17 It is also worth noting that offenders who were arrested at a younger age were more likely to be re-arrested, a finding that, although not significant, did approach significance [p=.069]. As indicated earlier in the report, we are currently undertaking a study to examine the impact that the mandatory 90-day aftercare program for Boot Camp graduates has had on recidivism. Preliminary analysis with our current sample found that 11% of the offenders who participated in this mandatory 90-day program component were re-arrested compared to 26% of offenders who graduated from Boot Camp prior to this requirement. However, this finding could likely be an artifact of the differences in the length of time that offenders were on parole, as the mean tracking period for the pre 90-day mandatory aftercare group was almost twice that of the post 90-day mandatory aftercare group. [22 months vs. 11 months, respectively]. Our current aftercare study involves a larger sample and a longer tracking period for those offenders who participated in the 90-day aftercare component, which will allow us to analyze this issue with more confidence.
17 The �‘Friends-in-Trouble�’ scale consisted of seven questions with five response choices [none, few, some, most, and all]. Those who responded �‘none�’ to all of the questions had a score of 7 while those who responded �‘most�’ to all of the questions had a score of 28, reflecting a 21-unit difference on the scale. For each unit increase, the odds of re-arrest were .12. Thus, in this example the increase in odds of re-arrest is 2.5 [21 x .12 = 2.52].
Table 6. Odds of re-arrest show which factors best predict recidivism.
Variable Logit Coefficient Odds of Re-arrestRace/Ethnicity
Black 1.053 ** 2.87Hispanic .453 1.58
Age at First Arrest -.086 0.92
Unemployed prior to Boot Camp .196 1.22
Unemployed after Boot Camp .1.08 ** 2.95
Friends-in-Trouble .114*** 1.12
Tracking Time [in months] .126 *** 1.13
** Significant at .01 level *** Significant at .001 level
Summary and Conclusion
Responses from the Offender Self-Report Survey provided an in-depth profile of offenders participating in the Boot Camp Program. The typical offender was young, male, a minority, from an urban area, and convicted of a drug offense. While most offenders had never been married, most did have at least one child. The majority of offenders indicated that, prior to attending Boot Camp, they had completed high school, were employed, had a manual labor job, held their current job for over two years, and identified their job as their primary source of income. A sizable percentage, however, identified illegal sources as their primary means of support, and those offenders also reported higher monthly incomes. Offenders were slightly more likely to be raised in a two-parent rather than a one-parent household. Both parents were more likely than the offender to have graduated from high school and attended college. The offender�’s exposure to crime was high; almost all of them had committed prior crimes, and the majority reported having been the victim of a crime. Additionally, most reported that a family member, as well as a friend, had been incarcerated at some point. Beer was the preferred alcohol type, though the frequency of alcohol use was significantly less than that of drugs. The vast majority of offenders used drugs, mostly marijuana and cocaine, and over half were using drugs the day they committed their �‘Boot Camp�’ offense. While most offenders did not have a fear of being addicted to drugs, most also reported having previously made an attempt to quit. Responses to the Boot Camp Evaluation Survey, which was given to offenders at admission, graduation, and parole, indicated that offenders had high expectations, which were not always met. It is noteworthy, however, that even when this was the case, the overwhelming majority still reported favorable opinions about the program at all three stages. The most significant attitudinal shifts occurred with respect to impulsiveness, decision-making and substance abuse. After going through Boot Camp, offenders were significantly more likely to respond that they were less impulsive, made better decisions, and that drugs presented less of a problem. All of these attitudinal shifts endured at the parole stage, six months after Boot Camp. Offenders also reported positive behavioral changes as well. They were more likely to be employed and less likely to use drugs after Boot Camp than when they entered the program. In addition, they indicated that they had made new friends and were significantly less likely to associate with �‘friends-in-trouble�’. These behavioral shifts are encouraging, as previous research has found unemployment, substance abuse, and associating with problematic friends to be related to engaging in criminal activity. In addition to the offender self-report information, we utilized re-arrest data obtained from the state police to examine whether these positive attitudinal and behavioral changes were related to recidivism. Overall, 19% of the study sample were arrested for a new crime during the 7-26 month follow-up period. Our multivariate analysis indicated that offenders were more likely to be arrested when they were black, unemployed, more likely to associate with �‘friends-in-trouble�’, and had a longer follow-up period.
While other studies have found black offenders more likely to commit crime, this is often explained by factors frequently correlated with being black, such as poverty, unemployment, and living in unstable environments. While none of the factors in our study explained this finding, not having information on more of the known correlates with race [e.g. poverty] may have influenced this finding. It is worthy of further attention in our future research on recidivism. It is encouraging that two of the significant predictors of recidivism, employment status and type of friends, were those that are considered �‘dynamic�’ factors, which can be changed [as opposed to �‘static�’ factors, such as race, which are unalterable]. Not only are these findings consistent with the research on recidivism, these are two areas in which the Boot Camp program can impact an offender�’s future behavior. There are some caveats to our findings. First, the sample includes only offenders graduating from the Boot Camp, so we do not know whether these findings would be true for offenders released from prison as well. Second, the number of offenders who recidivated was small [n=66] and while other studies have utilized small samples, it does limit the extent of the analysis. Third, we did not have sentence length information so we were unable to ascertain the impact of an offender�’s parole status. We hope to obtain that information for next year�’s study. Fourth, there is always concern about the accuracy of self-report information, particularly when sensitive information about criminal activity and substance abuse is involved. The fact that previous research has found offenders to be honest in their reporting, in tandem with our findings that most offenders have admitted to committing previous crimes and using illegal substances, gives us some confidence that the information obtained via the Offender Survey is credible. Previous research has shown that a structured re-entry program that provides for continuity of employment, health, and welfare services, is critical to the success of an offender desisting from crime upon returning home. The mandatory 90-day aftercare program that was in effect for Boot Camp graduates from February 2002 to December 2002 was designed to meet those offender needs. Next year�’s report will present the findings from our study that is examining the impact of that aftercare program.

APPENDIX A
Characteristics of Offenders Admitted to Boot Camp by Year
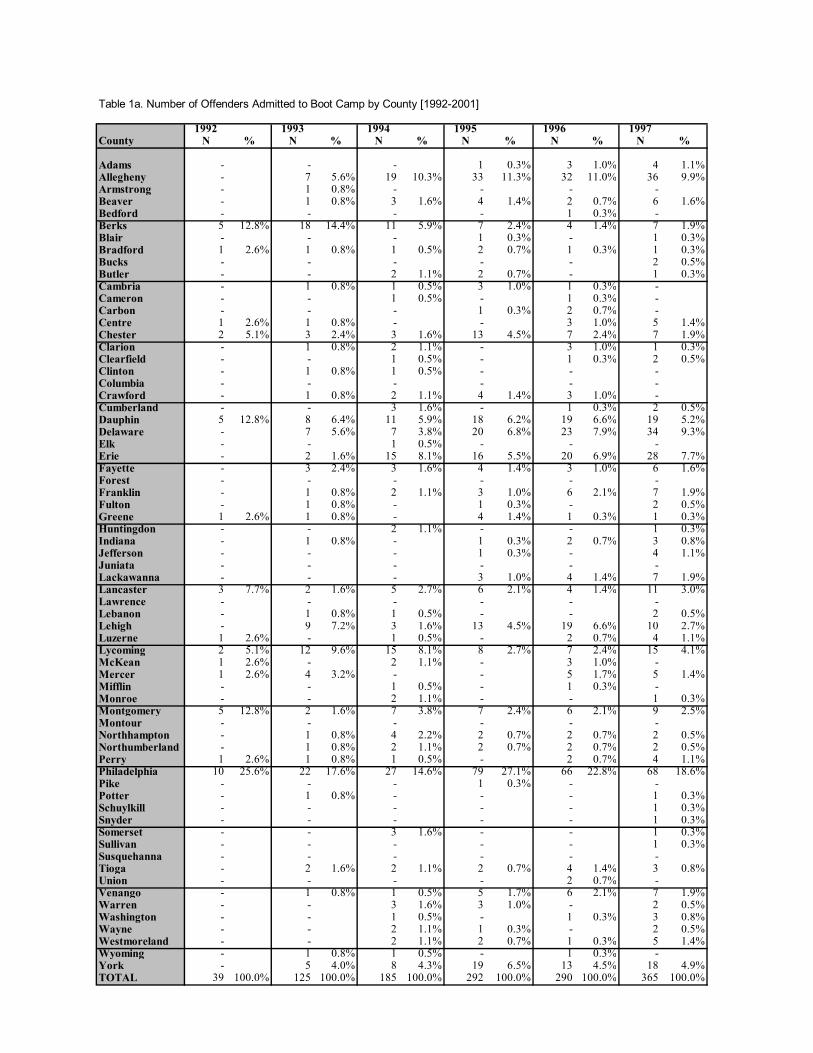
Table 1a. Number of Offenders Admitted to Boot Camp by County [1992-2001]
1992 1993 1994 1995 1996 1997County N % N % N % N % N % N %
Adams - - - 1 0.3% 3 1.0% 4 1.1%Allegheny - 7 5.6% 19 10.3% 33 11.3% 32 11.0% 36 9.9%Armstrong - 1 0.8% - - - -Beaver - 1 0.8% 3 1.6% 4 1.4% 2 0.7% 6 1.6%Bedford - - - - 1 0.3% -Berks 5 12.8% 18 14.4% 11 5.9% 7 2.4% 4 1.4% 7 1.9%Blair - - - 1 0.3% - 1 0.3%Bradford 1 2.6% 1 0.8% 1 0.5% 2 0.7% 1 0.3% 1 0.3%Bucks - - - - - 2 0.5%Butler - - 2 1.1% 2 0.7% - 1 0.3%Cambria - 1 0.8% 1 0.5% 3 1.0% 1 0.3% -Cameron - - 1 0.5% - 1 0.3% -Carbon - - - 1 0.3% 2 0.7% -Centre 1 2.6% 1 0.8% - - 3 1.0% 5 1.4%Chester 2 5.1% 3 2.4% 3 1.6% 13 4.5% 7 2.4% 7 1.9%Clarion - 1 0.8% 2 1.1% - 3 1.0% 1 0.3%Clearfield - - 1 0.5% - 1 0.3% 2 0.5%Clinton - 1 0.8% 1 0.5% - - -Columbia - - - - - -Crawford - 1 0.8% 2 1.1% 4 1.4% 3 1.0% -Cumberland - - 3 1.6% - 1 0.3% 2 0.5%Dauphin 5 12.8% 8 6.4% 11 5.9% 18 6.2% 19 6.6% 19 5.2%Delaware - 7 5.6% 7 3.8% 20 6.8% 23 7.9% 34 9.3%Elk - - 1 0.5% - - -Erie - 2 1.6% 15 8.1% 16 5.5% 20 6.9% 28 7.7%Fayette - 3 2.4% 3 1.6% 4 1.4% 3 1.0% 6 1.6%Forest - - - - - -Franklin - 1 0.8% 2 1.1% 3 1.0% 6 2.1% 7 1.9%Fulton - 1 0.8% - 1 0.3% - 2 0.5%Greene 1 2.6% 1 0.8% - 4 1.4% 1 0.3% 1 0.3%Huntingdon - - 2 1.1% - - 1 0.3%Indiana - 1 0.8% - 1 0.3% 2 0.7% 3 0.8%Jefferson - - - 1 0.3% - 4 1.1%Juniata - - - - - -Lackawanna - - - 3 1.0% 4 1.4% 7 1.9%Lancaster 3 7.7% 2 1.6% 5 2.7% 6 2.1% 4 1.4% 11 3.0%Lawrence - - - - - -Lebanon - 1 0.8% 1 0.5% - - 2 0.5%Lehigh - 9 7.2% 3 1.6% 13 4.5% 19 6.6% 10 2.7%Luzerne 1 2.6% - 1 0.5% - 2 0.7% 4 1.1%Lycoming 2 5.1% 12 9.6% 15 8.1% 8 2.7% 7 2.4% 15 4.1%McKean 1 2.6% - 2 1.1% - 3 1.0% -Mercer 1 2.6% 4 3.2% - - 5 1.7% 5 1.4%Mifflin - - 1 0.5% - 1 0.3% -Monroe - - 2 1.1% - - 1 0.3%Montgomery 5 12.8% 2 1.6% 7 3.8% 7 2.4% 6 2.1% 9 2.5%Montour - - - - - -Northhampton - 1 0.8% 4 2.2% 2 0.7% 2 0.7% 2 0.5%Northumberland - 1 0.8% 2 1.1% 2 0.7% 2 0.7% 2 0.5%Perry 1 2.6% 1 0.8% 1 0.5% - 2 0.7% 4 1.1%Philadelphia 10 25.6% 22 17.6% 27 14.6% 79 27.1% 66 22.8% 68 18.6%Pike - - - 1 0.3% - -Potter - 1 0.8% - - - 1 0.3%Schuylkill - - - - - 1 0.3%Snyder - - - - - 1 0.3%Somerset - - 3 1.6% - - 1 0.3%Sullivan - - - - - 1 0.3%Susquehanna - - - - - -Tioga - 2 1.6% 2 1.1% 2 0.7% 4 1.4% 3 0.8%Union - - - - 2 0.7% -Venango - 1 0.8% 1 0.5% 5 1.7% 6 2.1% 7 1.9%Warren - - 3 1.6% 3 1.0% - 2 0.5%Washington - - 1 0.5% - 1 0.3% 3 0.8%Wayne - - 2 1.1% 1 0.3% - 2 0.5%Westmoreland - - 2 1.1% 2 0.7% 1 0.3% 5 1.4%Wyoming - 1 0.8% 1 0.5% - 1 0.3% -York - 5 4.0% 8 4.3% 19 6.5% 13 4.5% 18 4.9%TOTAL 39 100.0% 125 100.0% 185 100.0% 292 100.0% 290 100.0% 365 100.0%
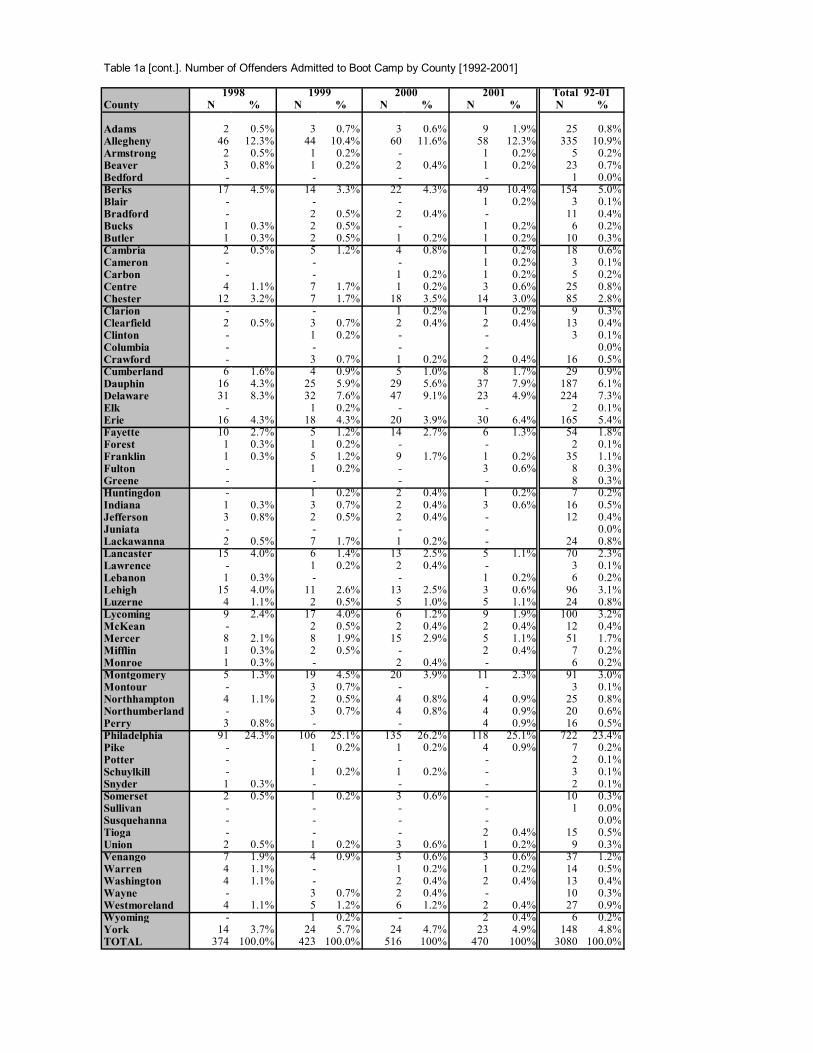
Table 1a [cont.]. Number of Offenders Admitted to Boot Camp by County [1992-2001]
County N % N % N % N % N %
Adams 2 0.5% 3 0.7% 3 0.6% 9 1.9% 25 0.8%Allegheny 46 12.3% 44 10.4% 60 11.6% 58 12.3% 335 10.9%Armstrong 2 0.5% 1 0.2% - 1 0.2% 5 0.2%Beaver 3 0.8% 1 0.2% 2 0.4% 1 0.2% 23 0.7%Bedford - - - - 1 0.0%Berks 17 4.5% 14 3.3% 22 4.3% 49 10.4% 154 5.0%Blair - - - 1 0.2% 3 0.1%Bradford - 2 0.5% 2 0.4% - 11 0.4%Bucks 1 0.3% 2 0.5% - 1 0.2% 6 0.2%Butler 1 0.3% 2 0.5% 1 0.2% 1 0.2% 10 0.3%Cambria 2 0.5% 5 1.2% 4 0.8% 1 0.2% 18 0.6%Cameron - - - 1 0.2% 3 0.1%Carbon - - 1 0.2% 1 0.2% 5 0.2%Centre 4 1.1% 7 1.7% 1 0.2% 3 0.6% 25 0.8%Chester 12 3.2% 7 1.7% 18 3.5% 14 3.0% 85 2.8%Clarion - - 1 0.2% 1 0.2% 9 0.3%Clearfield 2 0.5% 3 0.7% 2 0.4% 2 0.4% 13 0.4%Clinton - 1 0.2% - - 3 0.1%Columbia - - - - 0.0%Crawford - 3 0.7% 1 0.2% 2 0.4% 16 0.5%Cumberland 6 1.6% 4 0.9% 5 1.0% 8 1.7% 29 0.9%Dauphin 16 4.3% 25 5.9% 29 5.6% 37 7.9% 187 6.1%Delaware 31 8.3% 32 7.6% 47 9.1% 23 4.9% 224 7.3%Elk - 1 0.2% - - 2 0.1%Erie 16 4.3% 18 4.3% 20 3.9% 30 6.4% 165 5.4%Fayette 10 2.7% 5 1.2% 14 2.7% 6 1.3% 54 1.8%Forest 1 0.3% 1 0.2% - - 2 0.1%Franklin 1 0.3% 5 1.2% 9 1.7% 1 0.2% 35 1.1%Fulton - 1 0.2% - 3 0.6% 8 0.3%Greene - - - - 8 0.3%Huntingdon - 1 0.2% 2 0.4% 1 0.2% 7 0.2%Indiana 1 0.3% 3 0.7% 2 0.4% 3 0.6% 16 0.5%Jefferson 3 0.8% 2 0.5% 2 0.4% - 12 0.4%Juniata - - - - 0.0%Lackawanna 2 0.5% 7 1.7% 1 0.2% - 24 0.8%Lancaster 15 4.0% 6 1.4% 13 2.5% 5 1.1% 70 2.3%Lawrence - 1 0.2% 2 0.4% - 3 0.1%Lebanon 1 0.3% - - 1 0.2% 6 0.2%Lehigh 15 4.0% 11 2.6% 13 2.5% 3 0.6% 96 3.1%Luzerne 4 1.1% 2 0.5% 5 1.0% 5 1.1% 24 0.8%Lycoming 9 2.4% 17 4.0% 6 1.2% 9 1.9% 100 3.2%McKean - 2 0.5% 2 0.4% 2 0.4% 12 0.4%Mercer 8 2.1% 8 1.9% 15 2.9% 5 1.1% 51 1.7%Mifflin 1 0.3% 2 0.5% - 2 0.4% 7 0.2%Monroe 1 0.3% - 2 0.4% - 6 0.2%Montgomery 5 1.3% 19 4.5% 20 3.9% 11 2.3% 91 3.0%Montour - 3 0.7% - - 3 0.1%Northhampton 4 1.1% 2 0.5% 4 0.8% 4 0.9% 25 0.8%Northumberland - 3 0.7% 4 0.8% 4 0.9% 20 0.6%Perry 3 0.8% - - 4 0.9% 16 0.5%Philadelphia 91 24.3% 106 25.1% 135 26.2% 118 25.1% 722 23.4%Pike - 1 0.2% 1 0.2% 4 0.9% 7 0.2%Potter - - - - 2 0.1%Schuylkill - 1 0.2% 1 0.2% - 3 0.1%Snyder 1 0.3% - - - 2 0.1%Somerset 2 0.5% 1 0.2% 3 0.6% - 10 0.3%Sullivan - - - - 1 0.0%Susquehanna - - - - 0.0%Tioga - - - 2 0.4% 15 0.5%Union 2 0.5% 1 0.2% 3 0.6% 1 0.2% 9 0.3%Venango 7 1.9% 4 0.9% 3 0.6% 3 0.6% 37 1.2%Warren 4 1.1% - 1 0.2% 1 0.2% 14 0.5%Washington 4 1.1% - 2 0.4% 2 0.4% 13 0.4%Wayne - 3 0.7% 2 0.4% - 10 0.3%Westmoreland 4 1.1% 5 1.2% 6 1.2% 2 0.4% 27 0.9%Wyoming - 1 0.2% - 2 0.4% 6 0.2%York 14 3.7% 24 5.7% 24 4.7% 23 4.9% 148 4.8%TOTAL 374 100.0% 423 100.0% 516 100% 470 100% 3080 100.0%
Total 92-011998 1999 2000 2001
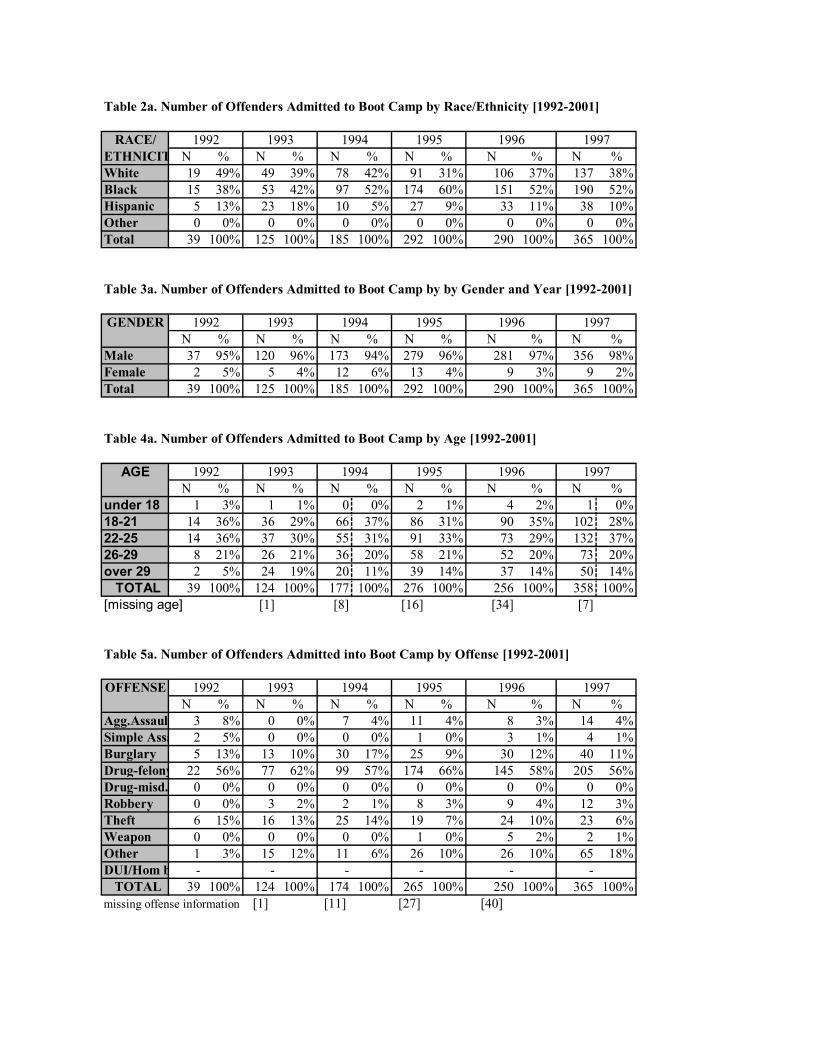
RACE/ETHNICIT N % N % N % N % N % N %White 19 49% 49 39% 78 42% 91 31% 106 37% 137 38%Black 15 38% 53 42% 97 52% 174 60% 151 52% 190 52%Hispanic 5 13% 23 18% 10 5% 27 9% 33 11% 38 10%Other 0 0% 0 0% 0 0% 0 0% 0 0% 0 0%Total 39 100% 125 100% 185 100% 292 100% 290 100% 365 100%
GENDERN % N % N % N % N % N %
Male 37 95% 120 96% 173 94% 279 96% 281 97% 356 98%Female 2 5% 5 4% 12 6% 13 4% 9 3% 9 2%Total 39 100% 125 100% 185 100% 292 100% 290 100% 365 100%
AGEN % N % N % N % N % N %
under 18 1 3% 1 1% 0 0% 2 1% 4 2% 1 0%18-21 14 36% 36 29% 66 37% 86 31% 90 35% 102 28%22-25 14 36% 37 30% 55 31% 91 33% 73 29% 132 37%26-29 8 21% 26 21% 36 20% 58 21% 52 20% 73 20%over 29 2 5% 24 19% 20 11% 39 14% 37 14% 50 14% TOTAL 39 100% 124 100% 177 100% 276 100% 256 100% 358 100%[missing age] [1] [8] [16] [34] [7]
OFFENSEN % N % N % N % N % N %
Agg.Assaul 3 8% 0 0% 7 4% 11 4% 8 3% 14 4%Simple Assa 2 5% 0 0% 0 0% 1 0% 3 1% 4 1%Burglary 5 13% 13 10% 30 17% 25 9% 30 12% 40 11%Drug-felony 22 56% 77 62% 99 57% 174 66% 145 58% 205 56%Drug-misd. 0 0% 0 0% 0 0% 0 0% 0 0% 0 0%Robbery 0 0% 3 2% 2 1% 8 3% 9 4% 12 3%Theft 6 15% 16 13% 25 14% 19 7% 24 10% 23 6%Weapon 0 0% 0 0% 0 0% 1 0% 5 2% 2 1%Other 1 3% 15 12% 11 6% 26 10% 26 10% 65 18%DUI/Hom b - - - - - - TOTAL 39 100% 124 100% 174 100% 265 100% 250 100% 365 100%missing offense information [1] [11] [27] [40]
Table 4a. Number of Offenders Admitted to Boot Camp by Age [1992-2001]
19961992 1993 1994
1994 1995 1996
1995
1997
1997
1992 1993
1997
1993 1994 19971995 19961992
1993 1994 1995 1996
Table 2a. Number of Offenders Admitted to Boot Camp by Race/Ethnicity [1992-2001]
Table 3a. Number of Offenders Admitted to Boot Camp by by Gender and Year [1992-2001]
Table 5a. Number of Offenders Admitted into Boot Camp by Offense [1992-2001]
1992
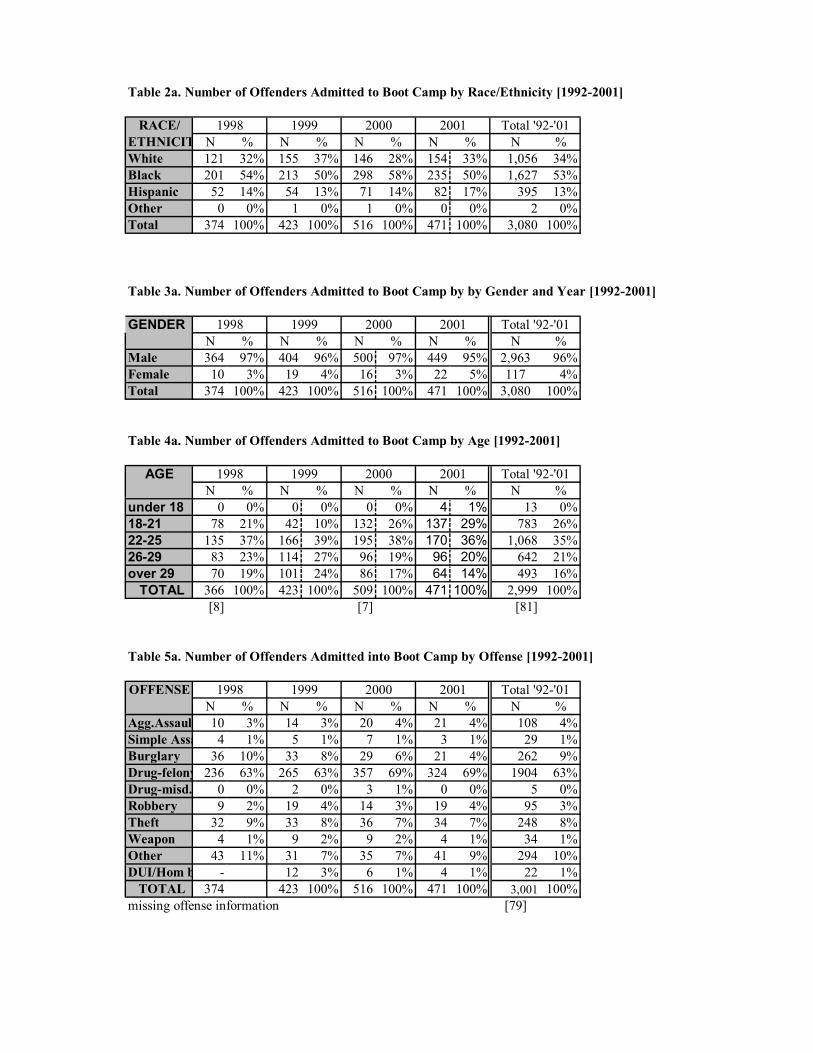
RACE/ETHNICIT N % N % N % N % N %White 121 32% 155 37% 146 28% 154 33% 1,056 34%Black 201 54% 213 50% 298 58% 235 50% 1,627 53%Hispanic 52 14% 54 13% 71 14% 82 17% 395 13%Other 0 0% 1 0% 1 0% 0 0% 2 0%Total 374 100% 423 100% 516 100% 471 100% 3,080 100%
GENDERN % N % N % N % N %
Male 364 97% 404 96% 500 97% 449 95% 2,963 96%Female 10 3% 19 4% 16 3% 22 5% 117 4%Total 374 100% 423 100% 516 100% 471 100% 3,080 100%
AGEN % N % N % N % N %
under 18 0 0% 0 0% 0 0% 4 1% 13 0%18-21 78 21% 42 10% 132 26% 137 29% 783 26%22-25 135 37% 166 39% 195 38% 170 36% 1,068 35%26-29 83 23% 114 27% 96 19% 96 20% 642 21%over 29 70 19% 101 24% 86 17% 64 14% 493 16% TOTAL 366 100% 423 100% 509 100% 471 100% 2,999 100%
[8] [7] [81]
OFFENSEN % N % N % N % N %
Agg.Assaul 10 3% 14 3% 20 4% 21 4% 108 4%Simple Assa 4 1% 5 1% 7 1% 3 1% 29 1%Burglary 36 10% 33 8% 29 6% 21 4% 262 9%Drug-felony 236 63% 265 63% 357 69% 324 69% 1904 63%Drug-misd. 0 0% 2 0% 3 1% 0 0% 5 0%Robbery 9 2% 19 4% 14 3% 19 4% 95 3%Theft 32 9% 33 8% 36 7% 34 7% 248 8%Weapon 4 1% 9 2% 9 2% 4 1% 34 1%Other 43 11% 31 7% 35 7% 41 9% 294 10%DUI/Hom b - 12 3% 6 1% 4 1% 22 1% TOTAL 374 423 100% 516 100% 471 100% 3,001 100%missing offense information [79]
Table 4a. Number of Offenders Admitted to Boot Camp by Age [1992-2001]
Total '92-'0120011998 2000
Table 5a. Number of Offenders Admitted into Boot Camp by Offense [1992-2001]
1998
1999
Total '92-'01
Table 3a. Number of Offenders Admitted to Boot Camp by by Gender and Year [1992-2001]
1999 2000 2001 Total '92-'01
1998 1999 2000 2001
Table 2a. Number of Offenders Admitted to Boot Camp by Race/Ethnicity [1992-2001]
1998 1999 2000 2001 Total '92-'01
APPENDIX B
Responses from Self-Report Survey at Admission Stage
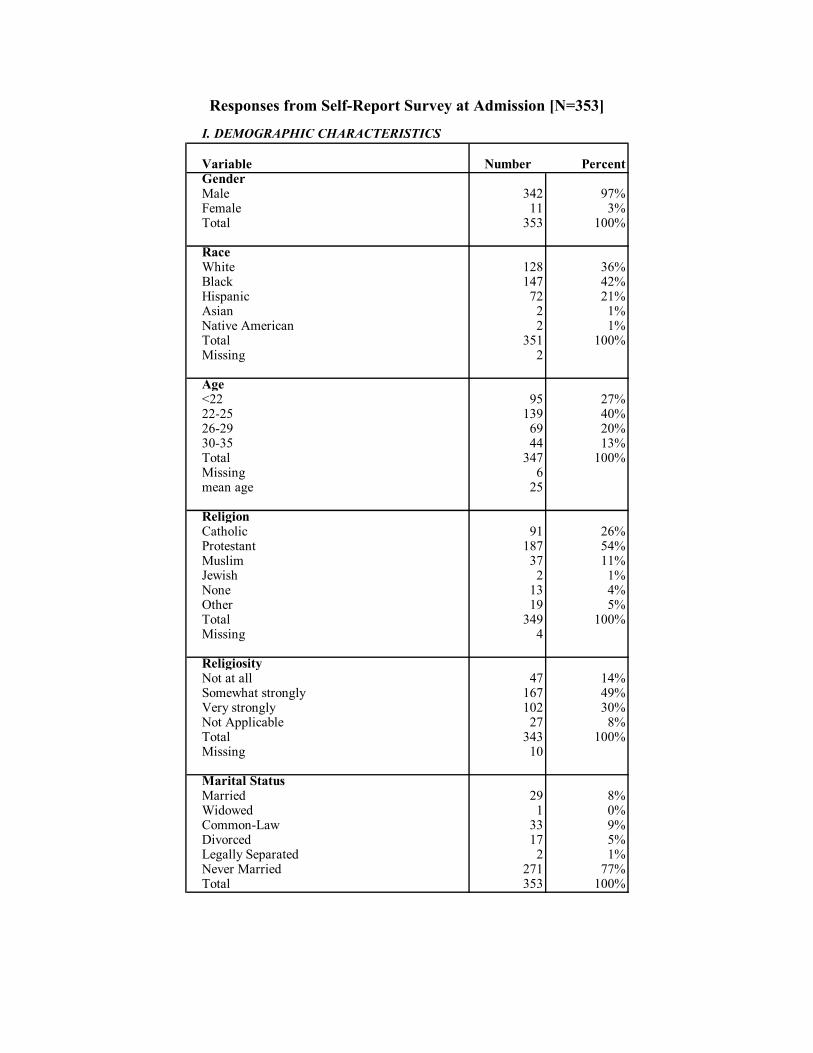
Responses from Self-Report Survey at Admission [N=353]
I. DEMOGRAPHIC CHARACTERISTICS
Variable Number PercentGenderMale 342 97%Female 11 3%Total 353 100%
RaceWhite 128 36%Black 147 42%Hispanic 72 21%Asian 2 1%Native American 2 1%Total 351 100%Missing 2
Age<22 95 27%22-25 139 40%26-29 69 20%30-35 44 13%Total 347 100%Missing 6mean age 25
ReligionCatholic 91 26%Protestant 187 54%Muslim 37 11%Jewish 2 1%None 13 4%Other 19 5%Total 349 100%Missing 4
ReligiosityNot at all 47 14%Somewhat strongly 167 49%Very strongly 102 30%Not Applicable 27 8%Total 343 100%Missing 10
Marital StatusMarried 29 8%Widowed 1 0%Common-Law 33 9%Divorced 17 5%Legally Separated 2 1%Never Married 271 77%Total 353 100%

Responses from Self-Report Survey at Admission [N=353]
Variable Number PercentLiving Arrangement Prior to ArrestAlone 42 12%Spouse or Partner 157 45%Mother and Father 36 10%Mother only 42 12%Father only 9 3%Friend 32 9%Homeless 3 1%Parent and Stepparent 4 1%Other Family Member 17 5%Other 10 3%Total 352 100%Missing 1
Months at Residence Under 7 79 24%7-12 70 22%13-24 51 16%25-59 41 13%Over 59 83 26%Total 324 100%Missing 29mean 55.32
Times Moved in Last 5 Years0 60 18%1 53 16%2-3 139 43%4 or more 74 23%Total 326 100%Missing 27mean 2.51
Number of Children0 138 41%1 81 24%2 58 17%3 34 10%4 15 4%5 6 2%6 or more 4 1%Total 336 100%Missing 17
Children Living with youYes 112 57%No 83 43%Total 195 100%No Children 138Missing (number of children) 17Missing (children living with you) 3
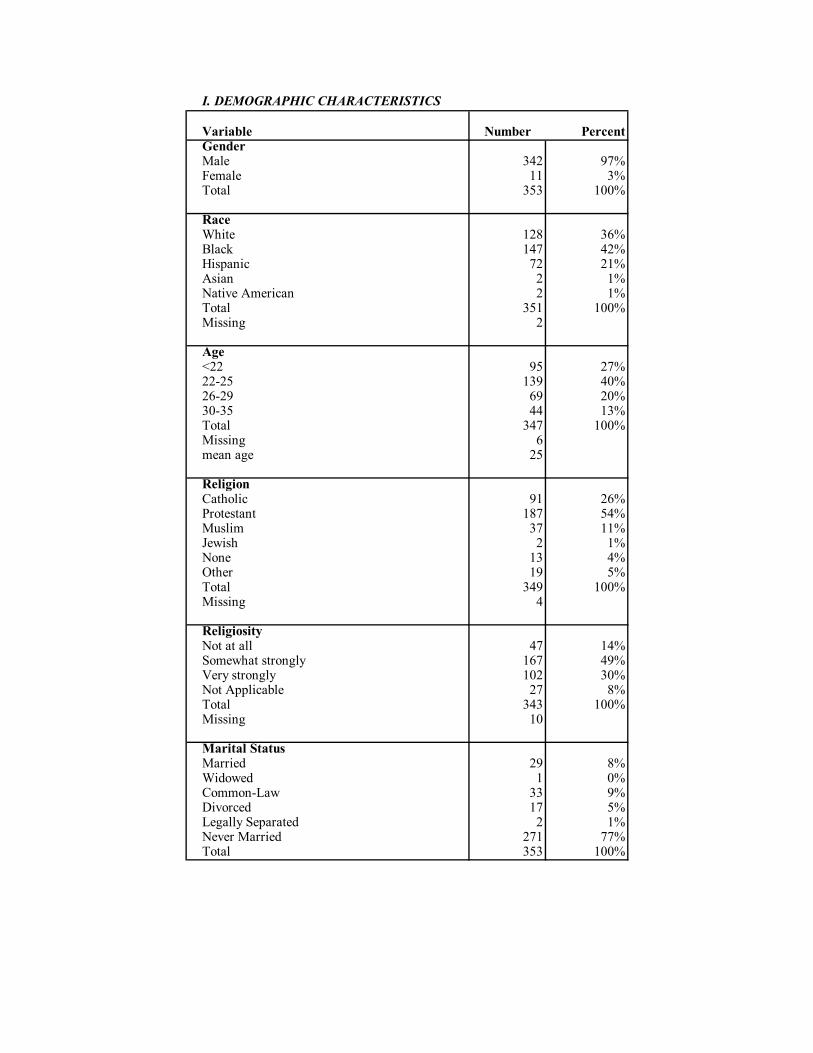
I. DEMOGRAPHIC CHARACTERISTICS
Variable Number PercentGenderMale 342 97%Female 11 3%Total 353 100%
RaceWhite 128 36%Black 147 42%Hispanic 72 21%Asian 2 1%Native American 2 1%Total 351 100%Missing 2
Age<22 95 27%22-25 139 40%26-29 69 20%30-35 44 13%Total 347 100%Missing 6mean age 25
ReligionCatholic 91 26%Protestant 187 54%Muslim 37 11%Jewish 2 1%None 13 4%Other 19 5%Total 349 100%Missing 4
ReligiosityNot at all 47 14%Somewhat strongly 167 49%Very strongly 102 30%Not Applicable 27 8%Total 343 100%Missing 10
Marital StatusMarried 29 8%Widowed 1 0%Common-Law 33 9%Divorced 17 5%Legally Separated 2 1%Never Married 271 77%Total 353 100%
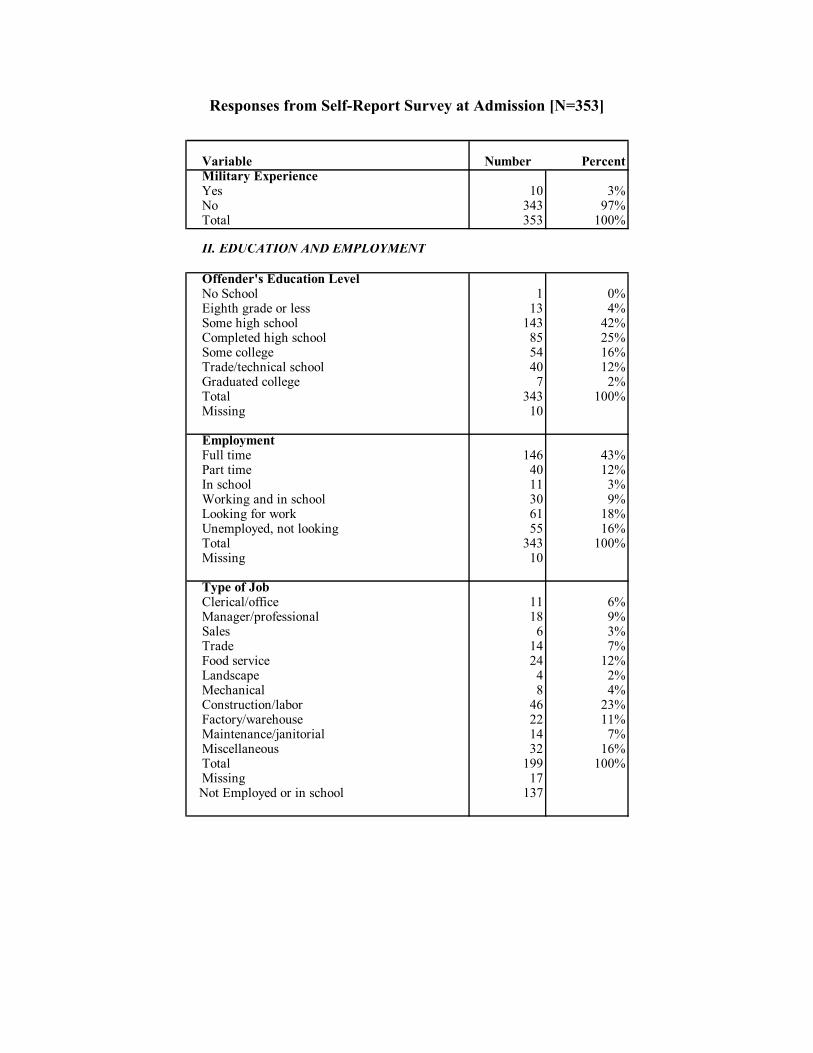
Responses from Self-Report Survey at Admission [N=353]
Variable Number PercentMilitary ExperienceYes 10 3%No 343 97%Total 353 100%
II. EDUCATION AND EMPLOYMENT
Offender's Education LevelNo School 1 0%Eighth grade or less 13 4%Some high school 143 42%Completed high school 85 25%Some college 54 16%Trade/technical school 40 12%Graduated college 7 2%Total 343 100%Missing 10
EmploymentFull time 146 43%Part time 40 12%In school 11 3%Working and in school 30 9%Looking for work 61 18%Unemployed, not looking 55 16%Total 343 100%Missing 10
Type of JobClerical/office 11 6%Manager/professional 18 9%Sales 6 3%Trade 14 7%Food service 24 12%Landscape 4 2%Mechanical 8 4%Construction/labor 46 23%Factory/warehouse 22 11%Maintenance/janitorial 14 7%Miscellaneous 32 16%Total 199 100%Missing 17
Not Employed or in school 137

I. DEMOGRAPHIC CHARACTERISTICS
Variable Number PercentGenderMale 342 97%Female 11 3%Total 353 100%
RaceWhite 128 36%Black 147 42%Hispanic 72 21%Asian 2 1%Native American 2 1%Total 351 100%Missing 2
Age<22 95 27%22-25 139 40%26-29 69 20%30-35 44 13%Total 347 100%Missing 6mean age 25
ReligionCatholic 91 26%Protestant 187 54%Muslim 37 11%Jewish 2 1%None 13 4%Other 19 5%Total 349 100%Missing 4
ReligiosityNot at all 47 14%Somewhat strongly 167 49%Very strongly 102 30%Not Applicable 27 8%Total 343 100%Missing 10
Marital StatusMarried 29 8%Widowed 1 0%Common-Law 33 9%Divorced 17 5%Legally Separated 2 1%Never Married 271 77%Total 353 100%
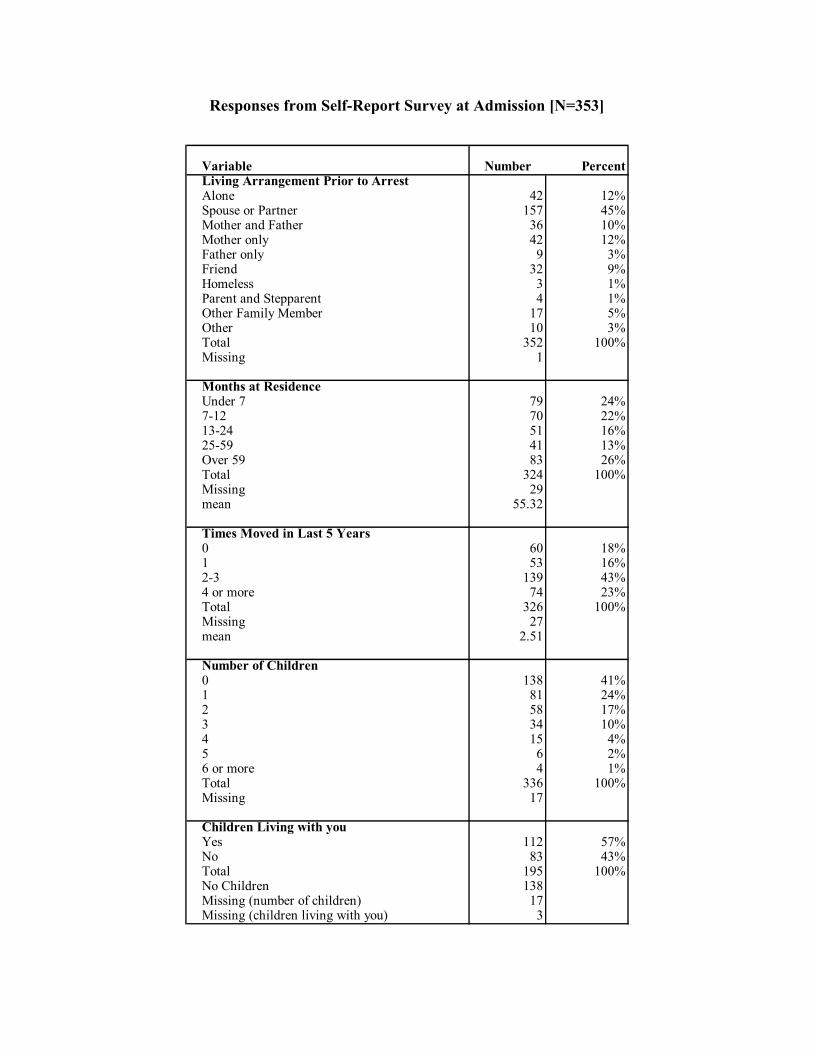
Responses from Self-Report Survey at Admission [N=353]
Variable Number PercentLiving Arrangement Prior to ArrestAlone 42 12%Spouse or Partner 157 45%Mother and Father 36 10%Mother only 42 12%Father only 9 3%Friend 32 9%Homeless 3 1%Parent and Stepparent 4 1%Other Family Member 17 5%Other 10 3%Total 352 100%Missing 1
Months at Residence Under 7 79 24%7-12 70 22%13-24 51 16%25-59 41 13%Over 59 83 26%Total 324 100%Missing 29mean 55.32
Times Moved in Last 5 Years0 60 18%1 53 16%2-3 139 43%4 or more 74 23%Total 326 100%Missing 27mean 2.51
Number of Children0 138 41%1 81 24%2 58 17%3 34 10%4 15 4%5 6 2%6 or more 4 1%Total 336 100%Missing 17
Children Living with youYes 112 57%No 83 43%Total 195 100%No Children 138Missing (number of children) 17Missing (children living with you) 3

I. DEMOGRAPHIC CHARACTERISTICS
Variable Number PercentGenderMale 342 97%Female 11 3%Total 353 100%
RaceWhite 128 36%Black 147 42%Hispanic 72 21%Asian 2 1%Native American 2 1%Total 351 100%Missing 2
Age<22 95 27%22-25 139 40%26-29 69 20%30-35 44 13%Total 347 100%Missing 6mean age 25
ReligionCatholic 91 26%Protestant 187 54%Muslim 37 11%Jewish 2 1%None 13 4%Other 19 5%Total 349 100%Missing 4
ReligiosityNot at all 47 14%Somewhat strongly 167 49%Very strongly 102 30%Not Applicable 27 8%Total 343 100%Missing 10
Marital StatusMarried 29 8%Widowed 1 0%Common-Law 33 9%Divorced 17 5%Legally Separated 2 1%Never Married 271 77%Total 353 100%
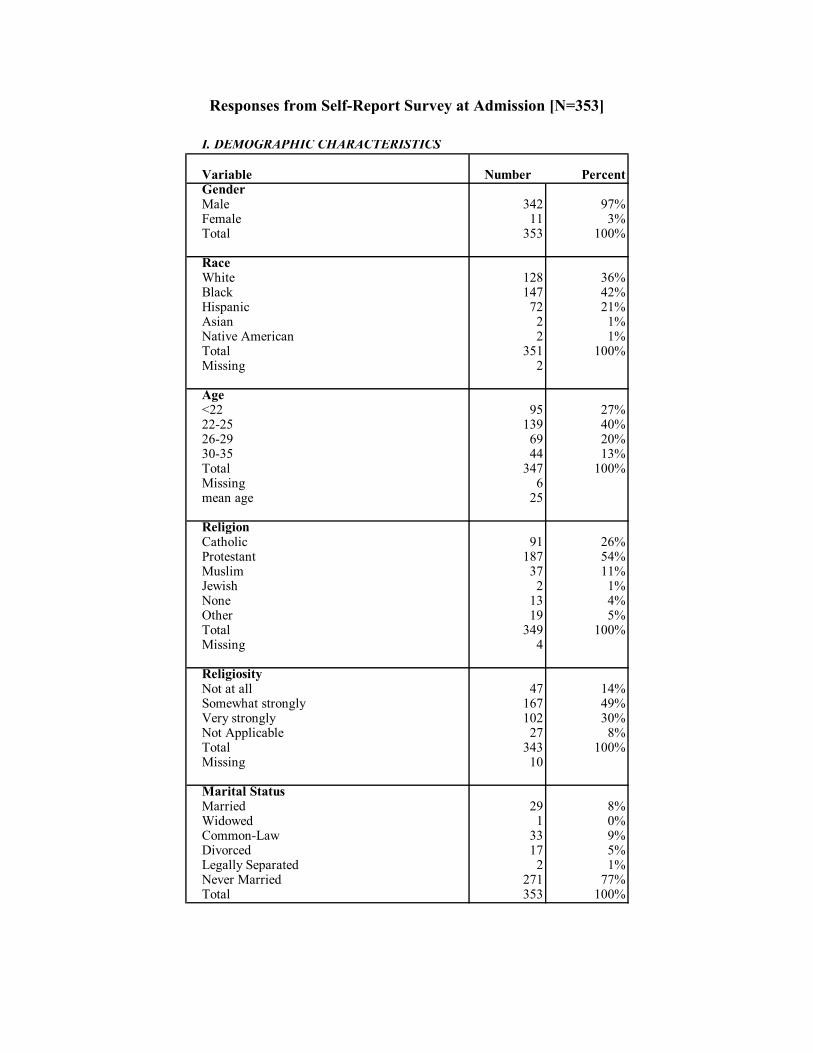
Responses from Self-Report Survey at Admission [N=353]
I. DEMOGRAPHIC CHARACTERISTICS
Variable Number PercentGenderMale 342 97%Female 11 3%Total 353 100%
RaceWhite 128 36%Black 147 42%Hispanic 72 21%Asian 2 1%Native American 2 1%Total 351 100%Missing 2
Age<22 95 27%22-25 139 40%26-29 69 20%30-35 44 13%Total 347 100%Missing 6mean age 25
ReligionCatholic 91 26%Protestant 187 54%Muslim 37 11%Jewish 2 1%None 13 4%Other 19 5%Total 349 100%Missing 4
ReligiosityNot at all 47 14%Somewhat strongly 167 49%Very strongly 102 30%Not Applicable 27 8%Total 343 100%Missing 10
Marital StatusMarried 29 8%Widowed 1 0%Common-Law 33 9%Divorced 17 5%Legally Separated 2 1%Never Married 271 77%Total 353 100%
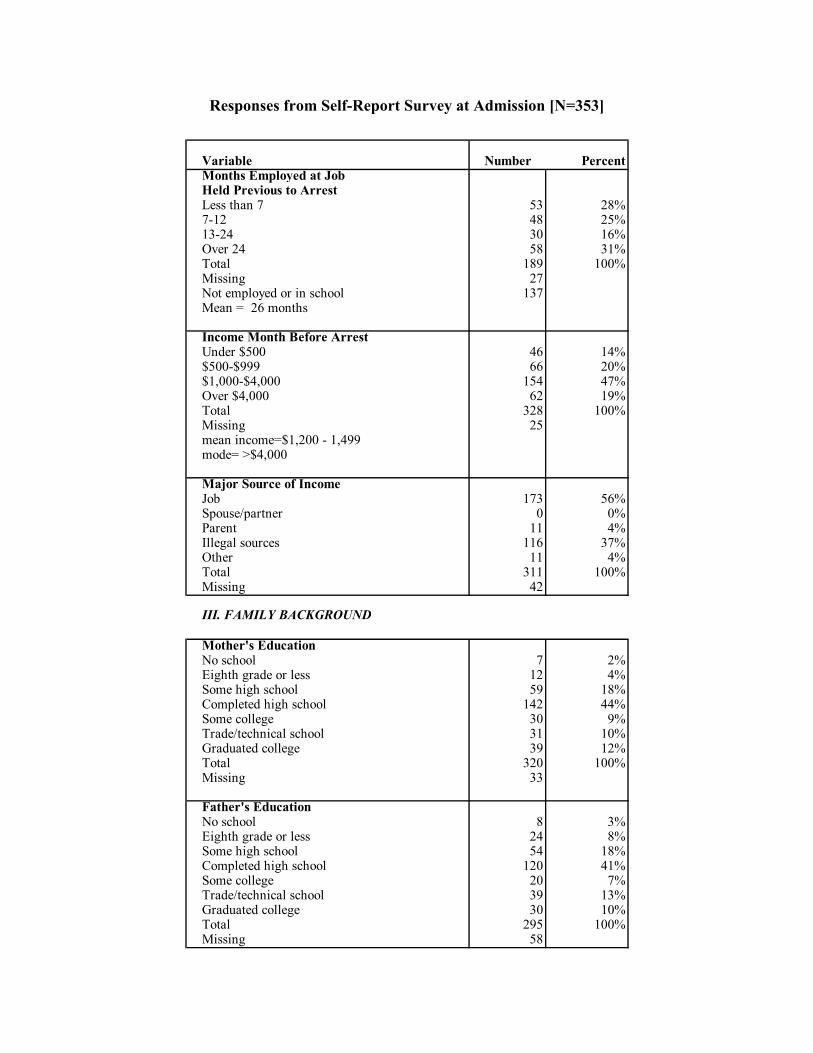
Responses from Self-Report Survey at Admission [N=353]
Variable Number PercentMonths Employed at JobHeld Previous to ArrestLess than 7 53 28%7-12 48 25%13-24 30 16%Over 24 58 31%Total 189 100%Missing 27Not employed or in school 137Mean = 26 months
Income Month Before ArrestUnder $500 46 14%$500-$999 66 20%$1,000-$4,000 154 47%Over $4,000 62 19%Total 328 100%Missing 25mean income=$1,200 - 1,499mode= >$4,000
Major Source of IncomeJob 173 56%Spouse/partner 0 0%Parent 11 4%Illegal sources 116 37%Other 11 4%Total 311 100%Missing 42
III. FAMILY BACKGROUND
Mother's EducationNo school 7 2%Eighth grade or less 12 4%Some high school 59 18%Completed high school 142 44%Some college 30 9%Trade/technical school 31 10%Graduated college 39 12%Total 320 100%Missing 33
Father's EducationNo school 8 3%Eighth grade or less 24 8%Some high school 54 18%Completed high school 120 41%Some college 20 7%Trade/technical school 39 13%Graduated college 30 10%Total 295 100%Missing 58
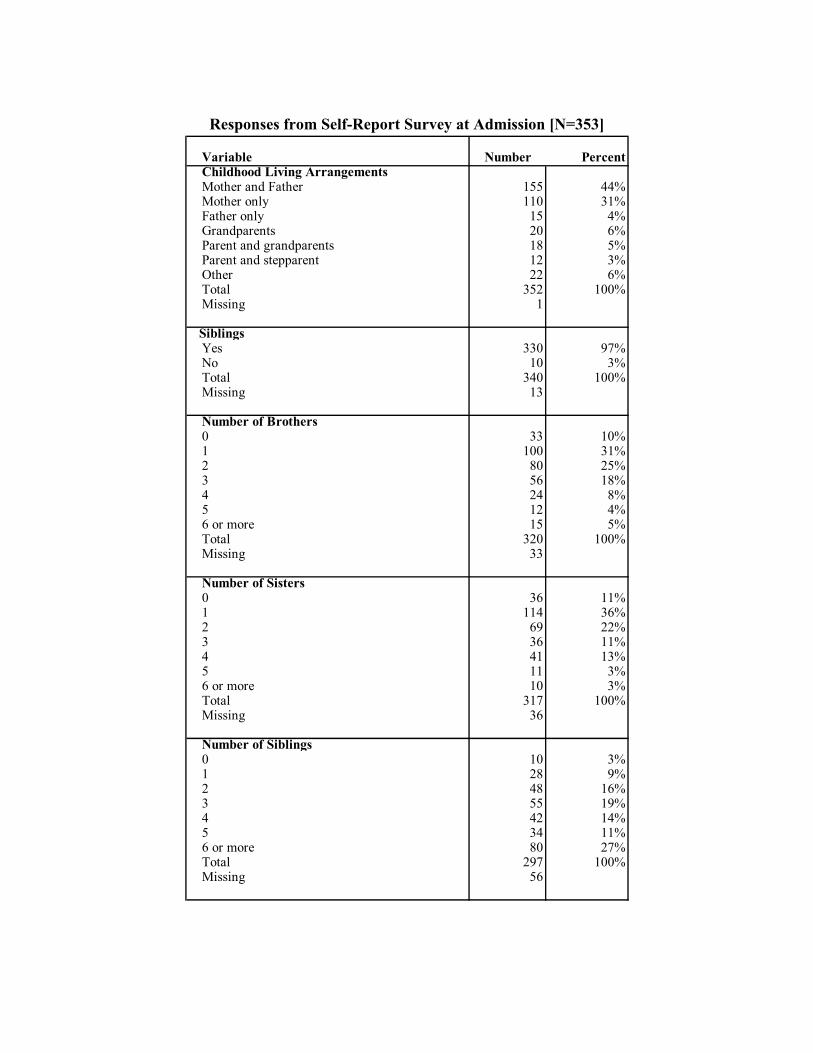
Responses from Self-Report Survey at Admission [N=353]
Variable Number PercentChildhood Living ArrangementsMother and Father 155 44%Mother only 110 31%Father only 15 4%Grandparents 20 6%Parent and grandparents 18 5%Parent and stepparent 12 3%Other 22 6%Total 352 100%Missing 1
SiblingsYes 330 97%No 10 3%Total 340 100%Missing 13
Number of Brothers0 33 10%1 100 31%2 80 25%3 56 18%4 24 8%5 12 4%6 or more 15 5%Total 320 100%Missing 33
Number of Sisters0 36 11%1 114 36%2 69 22%3 36 11%4 41 13%5 11 3%6 or more 10 3%Total 317 100%Missing 36
Number of Siblings0 10 3%1 28 9%2 48 16%3 55 19%4 42 14%5 34 11%6 or more 80 27%Total 297 100%Missing 56
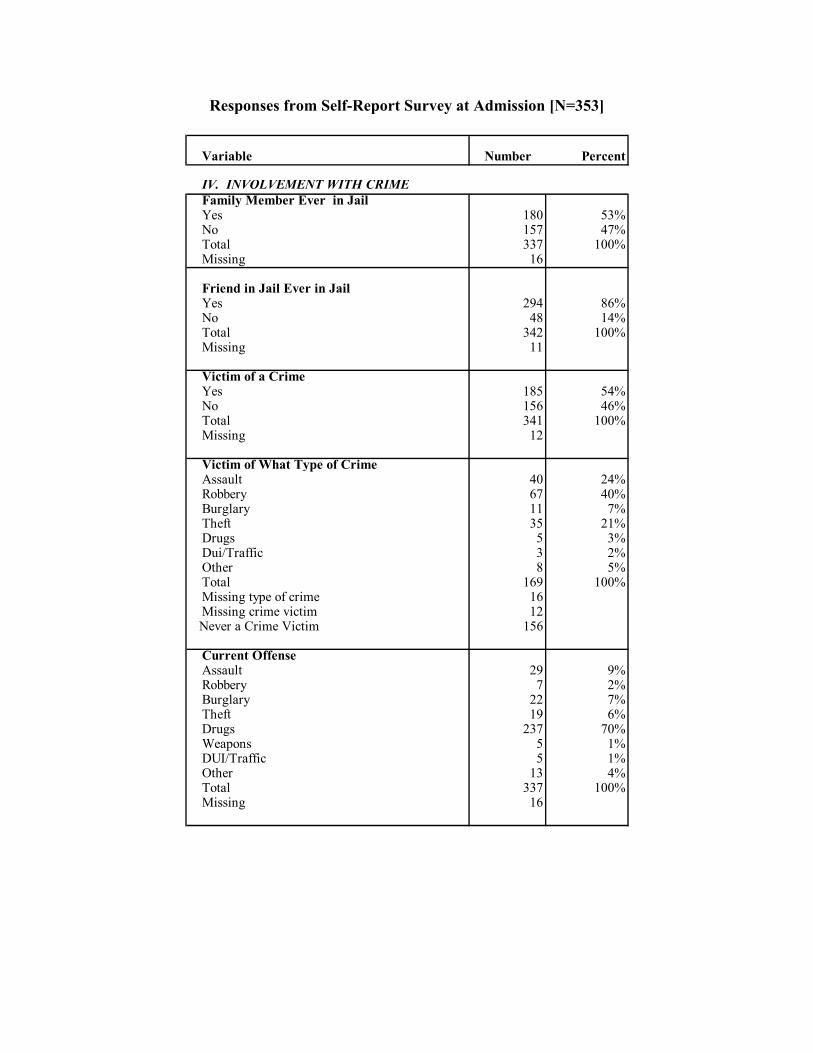
Responses from Self-Report Survey at Admission [N=353]
Variable Number Percent
IV. INVOLVEMENT WITH CRIMEFamily Member Ever in JailYes 180 53%No 157 47%Total 337 100%Missing 16
Friend in Jail Ever in JailYes 294 86%No 48 14%Total 342 100%Missing 11
Victim of a CrimeYes 185 54%No 156 46%Total 341 100%Missing 12
Victim of What Type of CrimeAssault 40 24%Robbery 67 40%Burglary 11 7%Theft 35 21%Drugs 5 3%Dui/Traffic 3 2%Other 8 5%Total 169 100%Missing type of crime 16Missing crime victim 12
Never a Crime Victim 156
Current OffenseAssault 29 9%Robbery 7 2%Burglary 22 7%Theft 19 6%Drugs 237 70%Weapons 5 1%DUI/Traffic 5 1%Other 13 4%Total 337 100%Missing 16
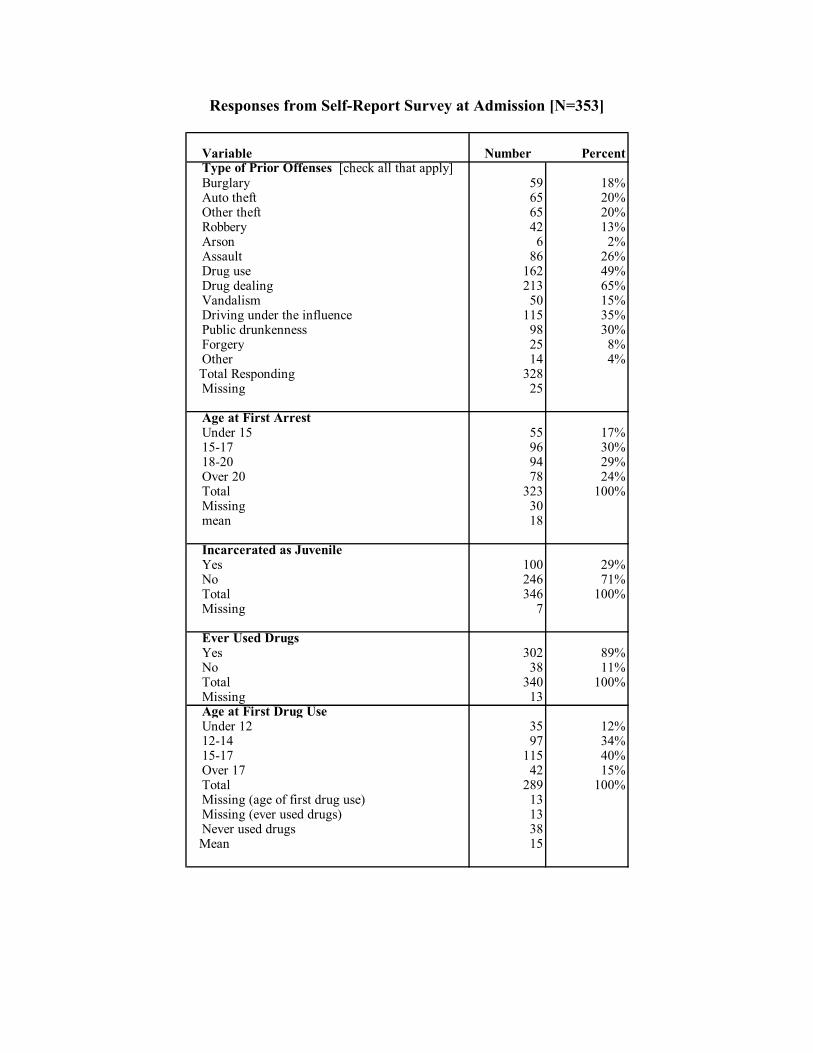
Responses from Self-Report Survey at Admission [N=353]
Variable Number PercentType of Prior Offenses [check all that apply]Burglary 59 18%Auto theft 65 20%Other theft 65 20%Robbery 42 13%Arson 6 2%Assault 86 26%Drug use 162 49%Drug dealing 213 65%Vandalism 50 15%Driving under the influence 115 35%Public drunkenness 98 30%Forgery 25 8%Other 14 4%
Total Responding 328Missing 25
Age at First Arrest Under 15 55 17%15-17 96 30%18-20 94 29%Over 20 78 24%Total 323 100%Missing 30mean 18
Incarcerated as JuvenileYes 100 29%No 246 71%Total 346 100%Missing 7
Ever Used DrugsYes 302 89%No 38 11%Total 340 100%Missing 13Age at First Drug UseUnder 12 35 12%12-14 97 34%15-17 115 40%Over 17 42 15%Total 289 100%Missing (age of first drug use) 13Missing (ever used drugs) 13Never used drugs 38
Mean 15
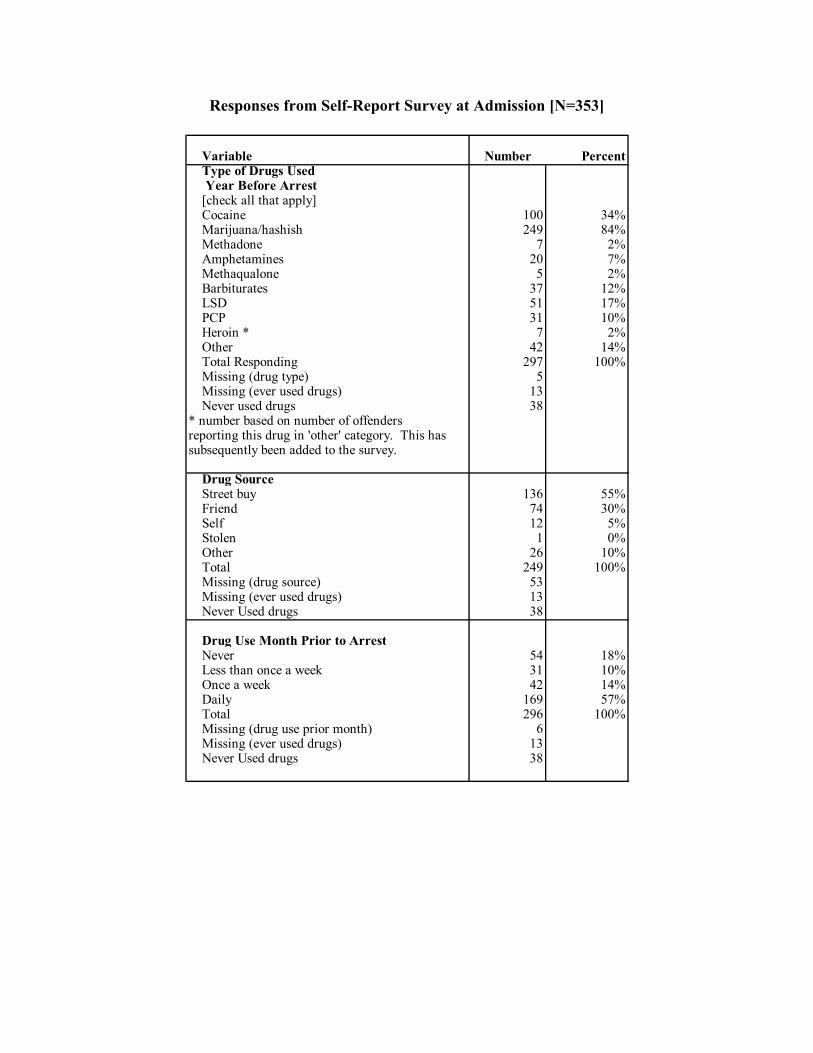
Responses from Self-Report Survey at Admission [N=353]
Variable Number PercentType of Drugs Used Year Before Arrest [check all that apply]Cocaine 100 34%Marijuana/hashish 249 84%Methadone 7 2%Amphetamines 20 7%Methaqualone 5 2%Barbiturates 37 12%LSD 51 17%PCP 31 10%Heroin * 7 2%Other 42 14%Total Responding 297 100%Missing (drug type) 5Missing (ever used drugs) 13Never used drugs 38
* number based on number of offenders reporting this drug in 'other' category. This hassubsequently been added to the survey.
Drug SourceStreet buy 136 55%Friend 74 30%Self 12 5%Stolen 1 0%Other 26 10%Total 249 100%Missing (drug source) 53Missing (ever used drugs) 13Never Used drugs 38
Drug Use Month Prior to ArrestNever 54 18%Less than once a week 31 10%Once a week 42 14%Daily 169 57%Total 296 100%Missing (drug use prior month) 6Missing (ever used drugs) 13Never Used drugs 38
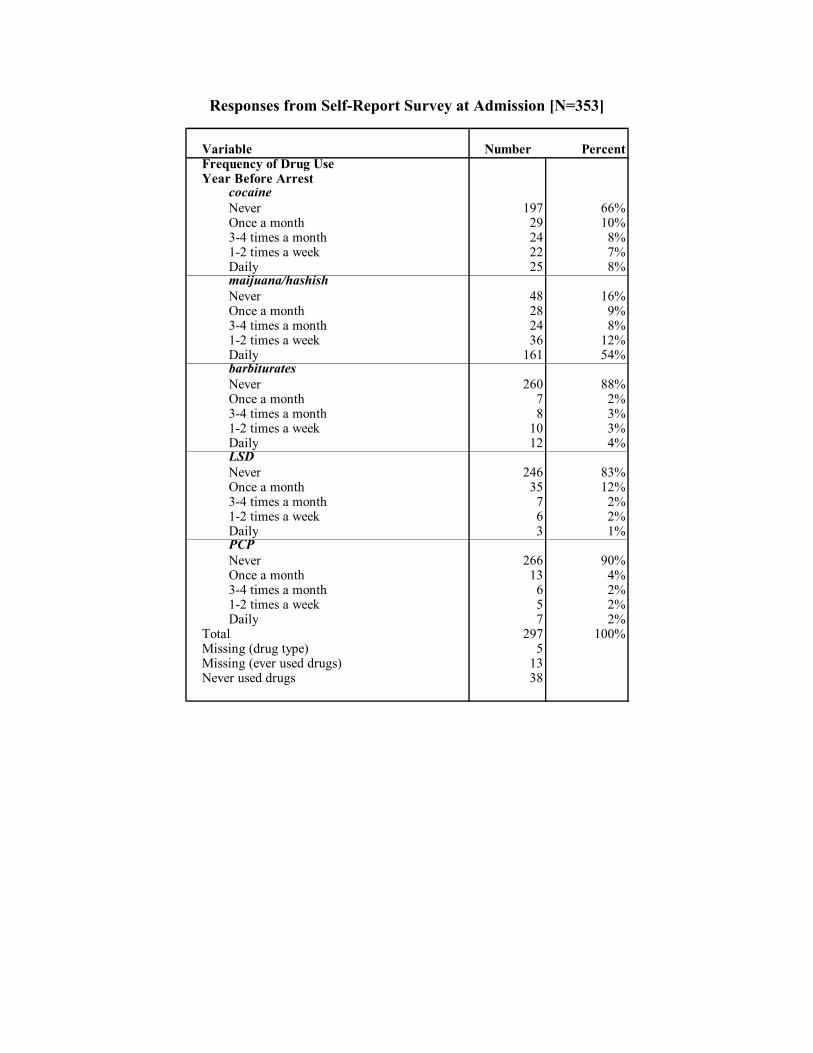
Responses from Self-Report Survey at Admission [N=353]
Variable Number PercentFrequency of Drug Use Year Before Arrest
cocaineNever 197 66%Once a month 29 10%3-4 times a month 24 8%1-2 times a week 22 7%Daily 25 8%maijuana/hashishNever 48 16%Once a month 28 9%3-4 times a month 24 8%1-2 times a week 36 12%Daily 161 54%barbituratesNever 260 88%Once a month 7 2%3-4 times a month 8 3%1-2 times a week 10 3%Daily 12 4%LSDNever 246 83%Once a month 35 12%3-4 times a month 7 2%1-2 times a week 6 2%Daily 3 1%PCP Never 266 90%Once a month 13 4%3-4 times a month 6 2%1-2 times a week 5 2%Daily 7 2%
Total 297 100%Missing (drug type) 5Missing (ever used drugs) 13Never used drugs 38
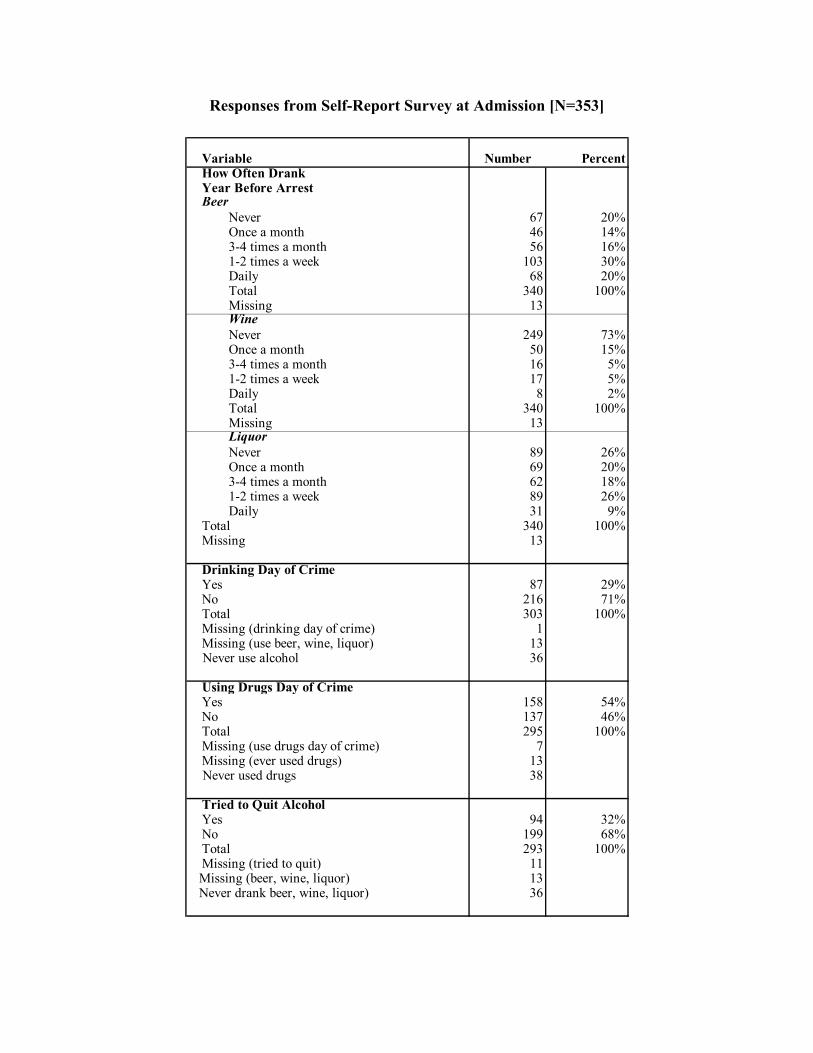
Responses from Self-Report Survey at Admission [N=353]
Variable Number PercentHow Often Drank Year Before Arrest Beer
Never 67 20%Once a month 46 14%3-4 times a month 56 16%1-2 times a week 103 30%Daily 68 20%Total 340 100%Missing 13WineNever 249 73%Once a month 50 15%3-4 times a month 16 5%1-2 times a week 17 5%Daily 8 2%Total 340 100%Missing 13LiquorNever 89 26%Once a month 69 20%3-4 times a month 62 18%1-2 times a week 89 26%Daily 31 9%
Total 340 100%Missing 13
Drinking Day of CrimeYes 87 29%No 216 71%Total 303 100%Missing (drinking day of crime) 1Missing (use beer, wine, liquor) 13
Never use alcohol 36
Using Drugs Day of CrimeYes 158 54%No 137 46%Total 295 100%Missing (use drugs day of crime) 7Missing (ever used drugs) 13
Never used drugs 38
Tried to Quit AlcoholYes 94 32%No 199 68%Total 293 100%Missing (tried to quit) 11
Missing (beer, wine, liquor) 13 Never drank beer, wine, liquor) 36
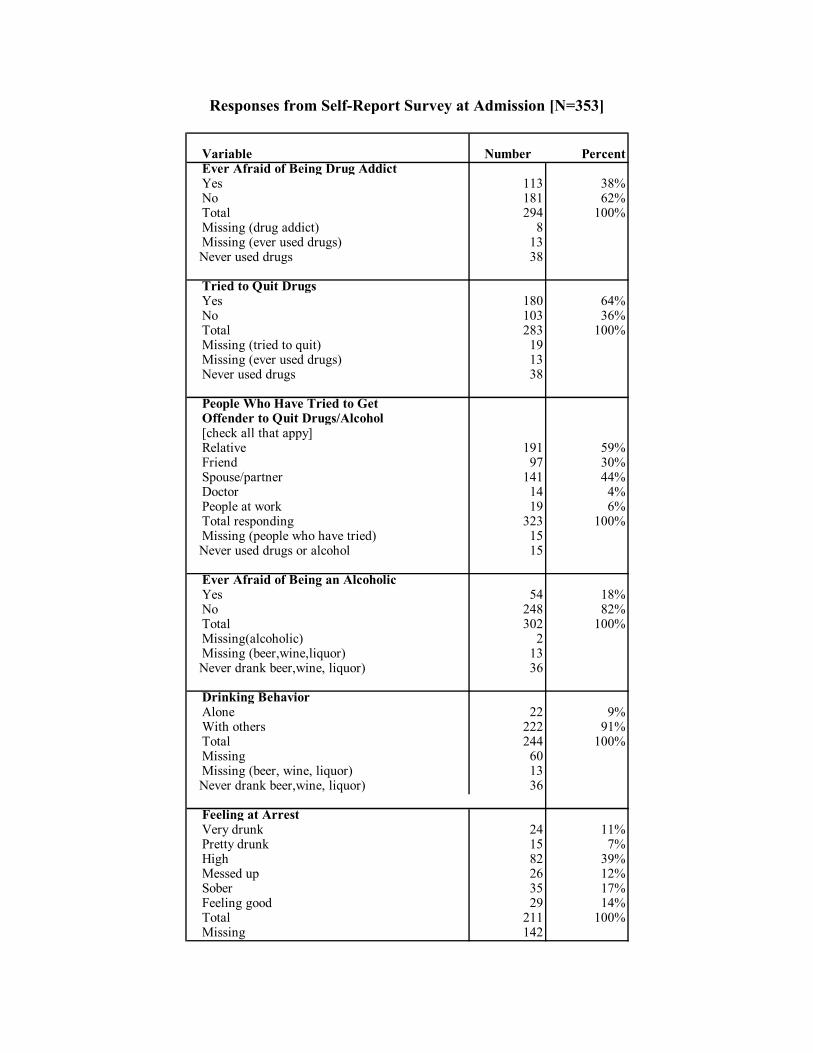
Responses from Self-Report Survey at Admission [N=353]
Variable Number PercentEver Afraid of Being Drug AddictYes 113 38%No 181 62%Total 294 100%Missing (drug addict) 8Missing (ever used drugs) 13
Never used drugs 38
Tried to Quit DrugsYes 180 64%No 103 36%Total 283 100%Missing (tried to quit) 19Missing (ever used drugs) 13Never used drugs 38
People Who Have Tried to GetOffender to Quit Drugs/Alcohol[check all that appy]Relative 191 59%Friend 97 30%Spouse/partner 141 44%Doctor 14 4%People at work 19 6%Total responding 323 100%Missing (people who have tried) 15
Never used drugs or alcohol 15
Ever Afraid of Being an AlcoholicYes 54 18%No 248 82%Total 302 100%Missing(alcoholic) 2Missing (beer,wine,liquor) 13
Never drank beer,wine, liquor) 36
Drinking BehaviorAlone 22 9%With others 222 91%Total 244 100%Missing 60Missing (beer, wine, liquor) 13
Never drank beer,wine, liquor) 36
Feeling at ArrestVery drunk 24 11%Pretty drunk 15 7%High 82 39%Messed up 26 12%Sober 35 17%Feeling good 29 14%Total 211 100%Missing 142

APPENDIX C
Responses from Self-Report Survey at Parole Stage
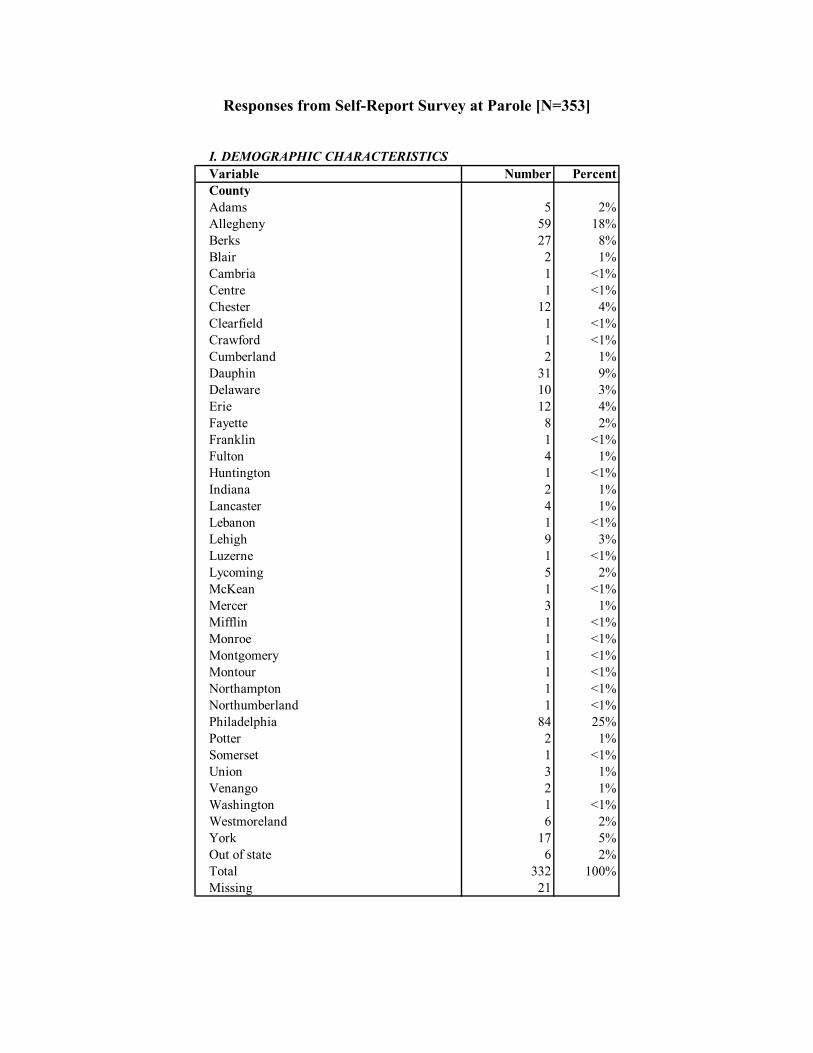
Responses from Self-Report Survey at Parole [N=353]
I. DEMOGRAPHIC CHARACTERISTICSVariable Number PercentCountyAdams 5 2%Allegheny 59 18%Berks 27 8%Blair 2 1%Cambria 1 <1%Centre 1 <1%Chester 12 4%Clearfield 1 <1%Crawford 1 <1%Cumberland 2 1%Dauphin 31 9%Delaware 10 3%Erie 12 4%Fayette 8 2%Franklin 1 <1%Fulton 4 1%Huntington 1 <1%Indiana 2 1%Lancaster 4 1%Lebanon 1 <1%Lehigh 9 3%Luzerne 1 <1%Lycoming 5 2%McKean 1 <1%Mercer 3 1%Mifflin 1 <1%Monroe 1 <1%Montgomery 1 <1%Montour 1 <1%Northampton 1 <1%Northumberland 1 <1%Philadelphia 84 25%Potter 2 1%Somerset 1 <1%Union 3 1%Venango 2 1%Washington 1 <1%Westmoreland 6 2%York 17 5%Out of state 6 2%Total 332 100%Missing 21
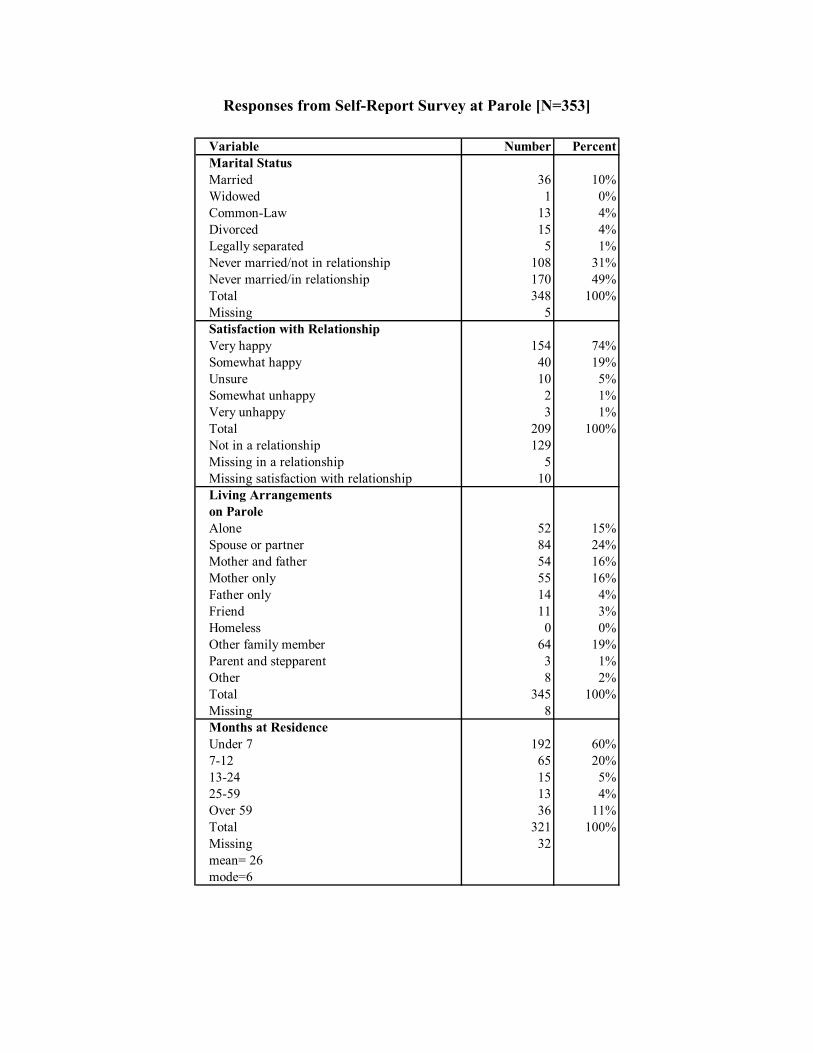
Responses from Self-Report Survey at Parole [N=353]
Variable Number PercentMarital StatusMarried 36 10%Widowed 1 0%Common-Law 13 4%Divorced 15 4%Legally separated 5 1%Never married/not in relationship 108 31%Never married/in relationship 170 49%Total 348 100%Missing 5Satisfaction with RelationshipVery happy 154 74%Somewhat happy 40 19%Unsure 10 5%Somewhat unhappy 2 1%Very unhappy 3 1%Total 209 100%Not in a relationship 129Missing in a relationship 5Missing satisfaction with relationship 10Living Arrangements on ParoleAlone 52 15%Spouse or partner 84 24%Mother and father 54 16%Mother only 55 16%Father only 14 4%Friend 11 3%Homeless 0 0%Other family member 64 19%Parent and stepparent 3 1%Other 8 2%Total 345 100%Missing 8Months at Residence Under 7 192 60%7-12 65 20%13-24 15 5%25-59 13 4%Over 59 36 11%Total 321 100%Missing 32mean= 26mode=6
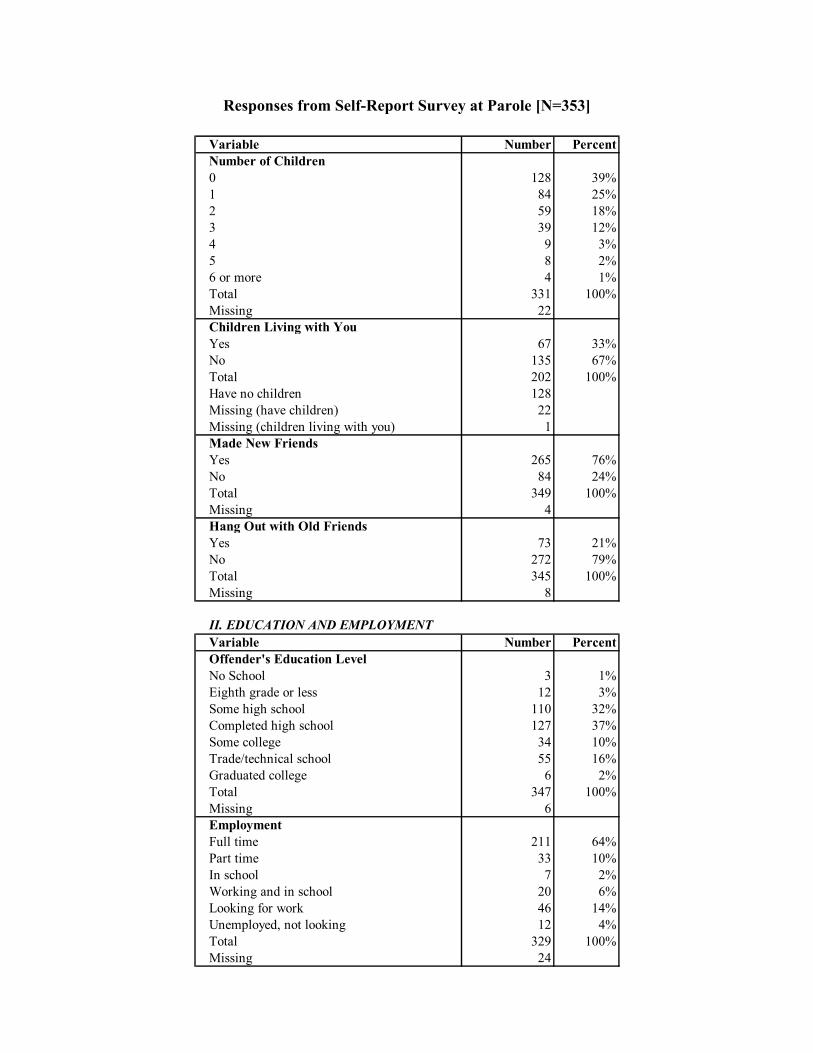
Responses from Self-Report Survey at Parole [N=353]
Variable Number PercentNumber of Children0 128 39%1 84 25%2 59 18%3 39 12%4 9 3%5 8 2%6 or more 4 1%Total 331 100%Missing 22Children Living with YouYes 67 33%No 135 67%Total 202 100%Have no children 128Missing (have children) 22Missing (children living with you) 1Made New FriendsYes 265 76%No 84 24%Total 349 100%Missing 4Hang Out with Old FriendsYes 73 21%No 272 79%Total 345 100%Missing 8
II. EDUCATION AND EMPLOYMENTVariable Number PercentOffender's Education LevelNo School 3 1%Eighth grade or less 12 3%Some high school 110 32%Completed high school 127 37%Some college 34 10%Trade/technical school 55 16%Graduated college 6 2%Total 347 100%Missing 6EmploymentFull time 211 64%Part time 33 10%In school 7 2%Working and in school 20 6%Looking for work 46 14%Unemployed, not looking 12 4%Total 329 100%Missing 24
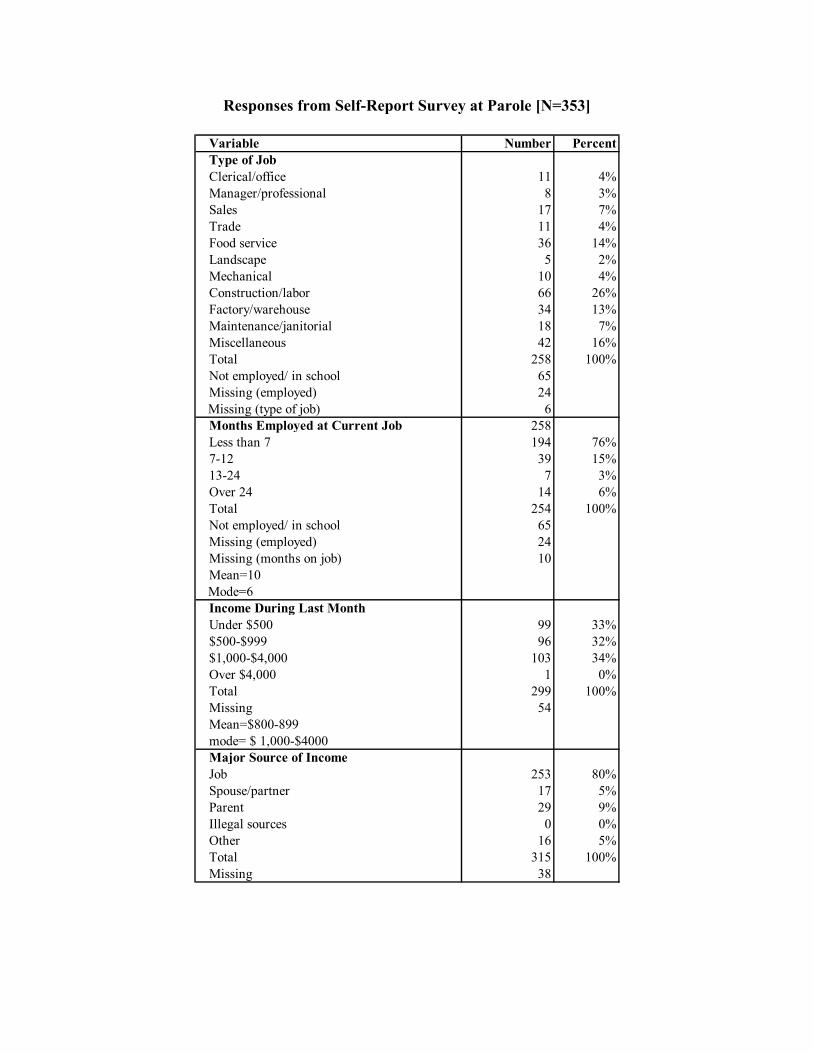
Responses from Self-Report Survey at Parole [N=353]
Variable Number PercentType of JobClerical/office 11 4%Manager/professional 8 3%Sales 17 7%Trade 11 4%Food service 36 14%Landscape 5 2%Mechanical 10 4%Construction/labor 66 26%Factory/warehouse 34 13%Maintenance/janitorial 18 7%Miscellaneous 42 16%Total 258 100%Not employed/ in school 65Missing (employed) 24
Missing (type of job) 6Months Employed at Current Job 258Less than 7 194 76%7-12 39 15%13-24 7 3%Over 24 14 6%Total 254 100%Not employed/ in school 65Missing (employed) 24Missing (months on job) 10Mean=10
Mode=6Income During Last MonthUnder $500 99 33%$500-$999 96 32%$1,000-$4,000 103 34%Over $4,000 1 0%Total 299 100%Missing 54Mean=$800-899mode= $ 1,000-$4000Major Source of IncomeJob 253 80%Spouse/partner 17 5%Parent 29 9%Illegal sources 0 0%Other 16 5%Total 315 100%Missing 38
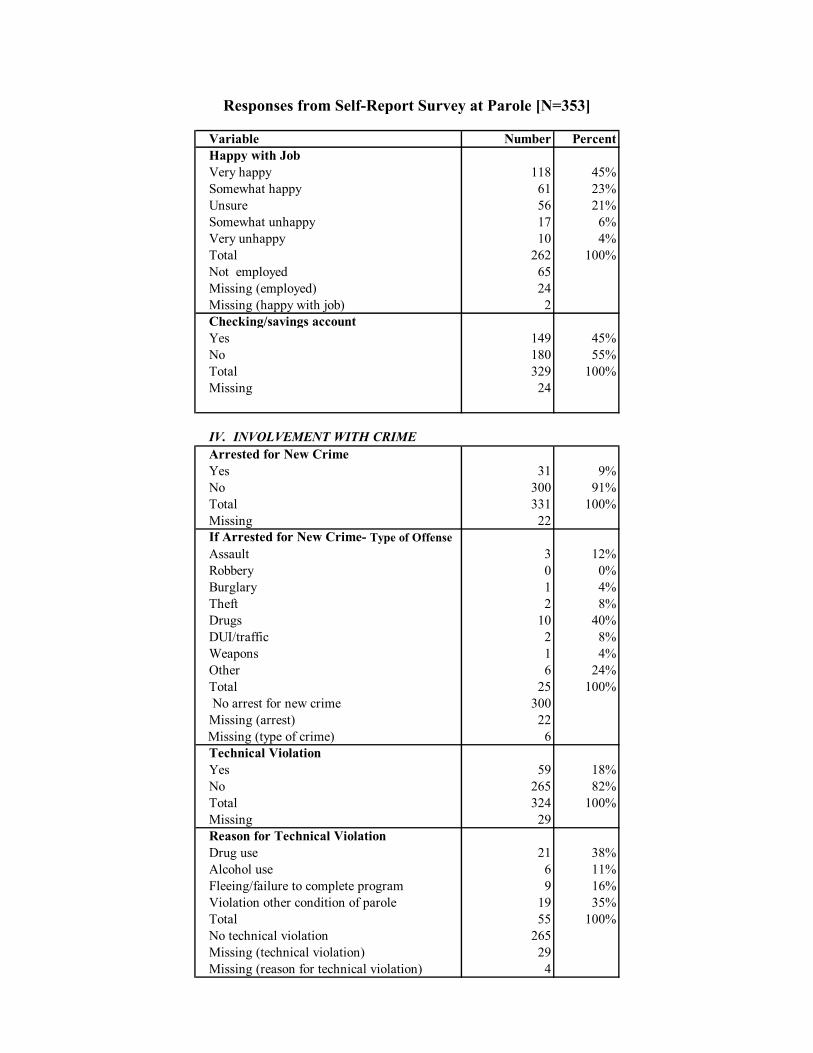
Responses from Self-Report Survey at Parole [N=353]
Variable Number PercentHappy with JobVery happy 118 45%Somewhat happy 61 23%Unsure 56 21%Somewhat unhappy 17 6%Very unhappy 10 4%Total 262 100%Not employed 65Missing (employed) 24Missing (happy with job) 2Checking/savings accountYes 149 45%No 180 55%Total 329 100%Missing 24
IV. INVOLVEMENT WITH CRIMEArrested for New Crime Yes 31 9%No 300 91%Total 331 100%Missing 22If Arrested for New Crime- Type of OffenseAssault 3 12%Robbery 0 0%Burglary 1 4%Theft 2 8%Drugs 10 40%DUI/traffic 2 8%Weapons 1 4%Other 6 24%Total 25 100% No arrest for new crime 300Missing (arrest) 22
Missing (type of crime) 6Technical ViolationYes 59 18%No 265 82%Total 324 100%Missing 29Reason for Technical ViolationDrug use 21 38%Alcohol use 6 11%Fleeing/failure to complete program 9 16%Violation other condition of parole 19 35%Total 55 100%No technical violation 265Missing (technical violation) 29Missing (reason for technical violation) 4
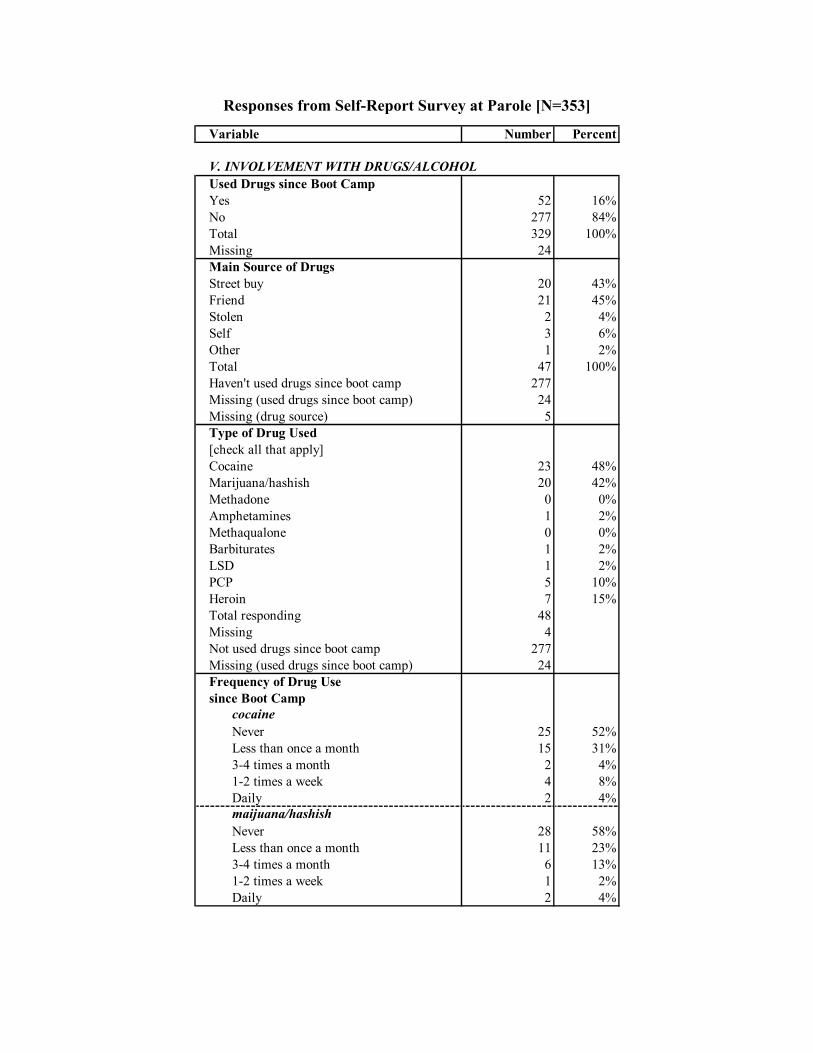
Responses from Self-Report Survey at Parole [N=353]
Variable Number Percent
V. INVOLVEMENT WITH DRUGS/ALCOHOLUsed Drugs since Boot CampYes 52 16%No 277 84%Total 329 100%Missing 24Main Source of DrugsStreet buy 20 43%Friend 21 45%Stolen 2 4%Self 3 6%Other 1 2%Total 47 100%Haven't used drugs since boot camp 277Missing (used drugs since boot camp) 24Missing (drug source) 5Type of Drug Used[check all that apply]Cocaine 23 48%Marijuana/hashish 20 42%Methadone 0 0%Amphetamines 1 2%Methaqualone 0 0%Barbiturates 1 2%LSD 1 2%PCP 5 10%Heroin 7 15%Total responding 48Missing 4Not used drugs since boot camp 277Missing (used drugs since boot camp) 24Frequency of Drug Use since Boot Camp
cocaineNever 25 52%Less than once a month 15 31%3-4 times a month 2 4%1-2 times a week 4 8%Daily 2 4%maijuana/hashishNever 28 58%Less than once a month 11 23%3-4 times a month 6 13%1-2 times a week 1 2%Daily 2 4%
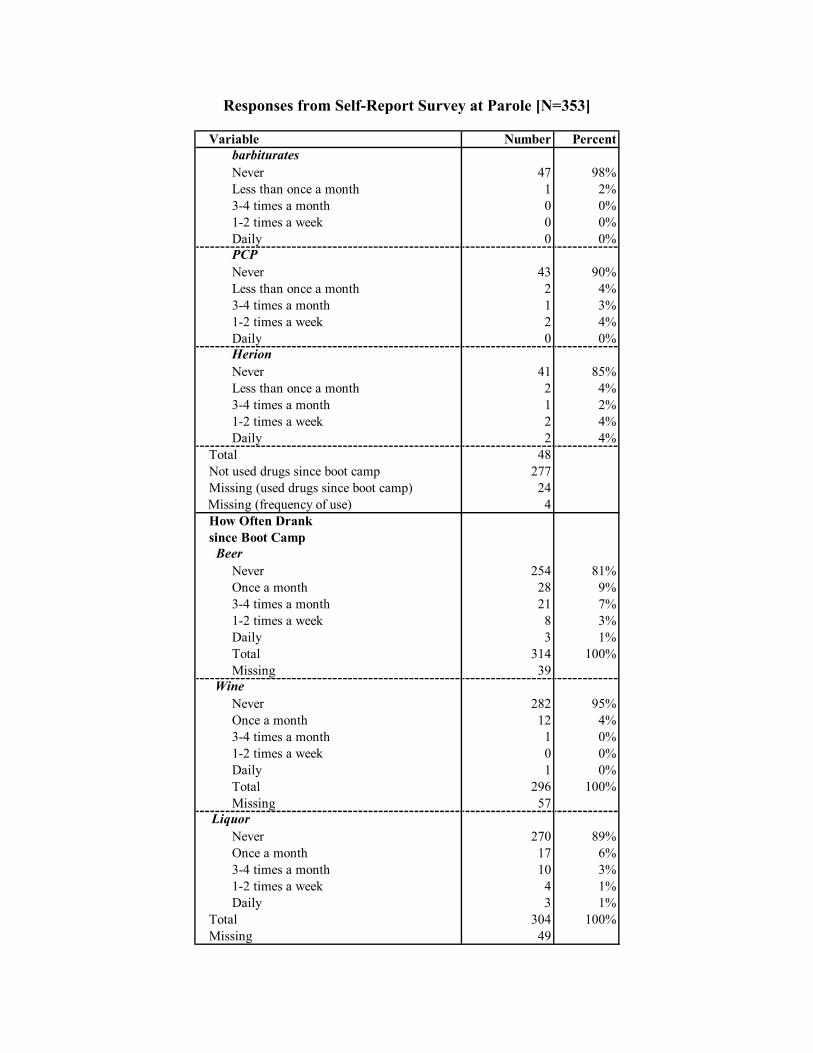
Responses from Self-Report Survey at Parole [N=353]
Variable Number PercentbarbituratesNever 47 98%Less than once a month 1 2%3-4 times a month 0 0%1-2 times a week 0 0%Daily 0 0%PCP Never 43 90%Less than once a month 2 4%3-4 times a month 1 3%1-2 times a week 2 4%Daily 0 0%HerionNever 41 85%Less than once a month 2 4%3-4 times a month 1 2%1-2 times a week 2 4%Daily 2 4%
Total 48Not used drugs since boot camp 277Missing (used drugs since boot camp) 24
Missing (frequency of use) 4How Often Drank since Boot Camp Beer
Never 254 81%Once a month 28 9%3-4 times a month 21 7%1-2 times a week 8 3%Daily 3 1%Total 314 100%Missing 39
WineNever 282 95%Once a month 12 4%3-4 times a month 1 0%1-2 times a week 0 0%Daily 1 0%Total 296 100%Missing 57
LiquorNever 270 89%Once a month 17 6%3-4 times a month 10 3%1-2 times a week 4 1%Daily 3 1%
Total 304 100%Missing 49
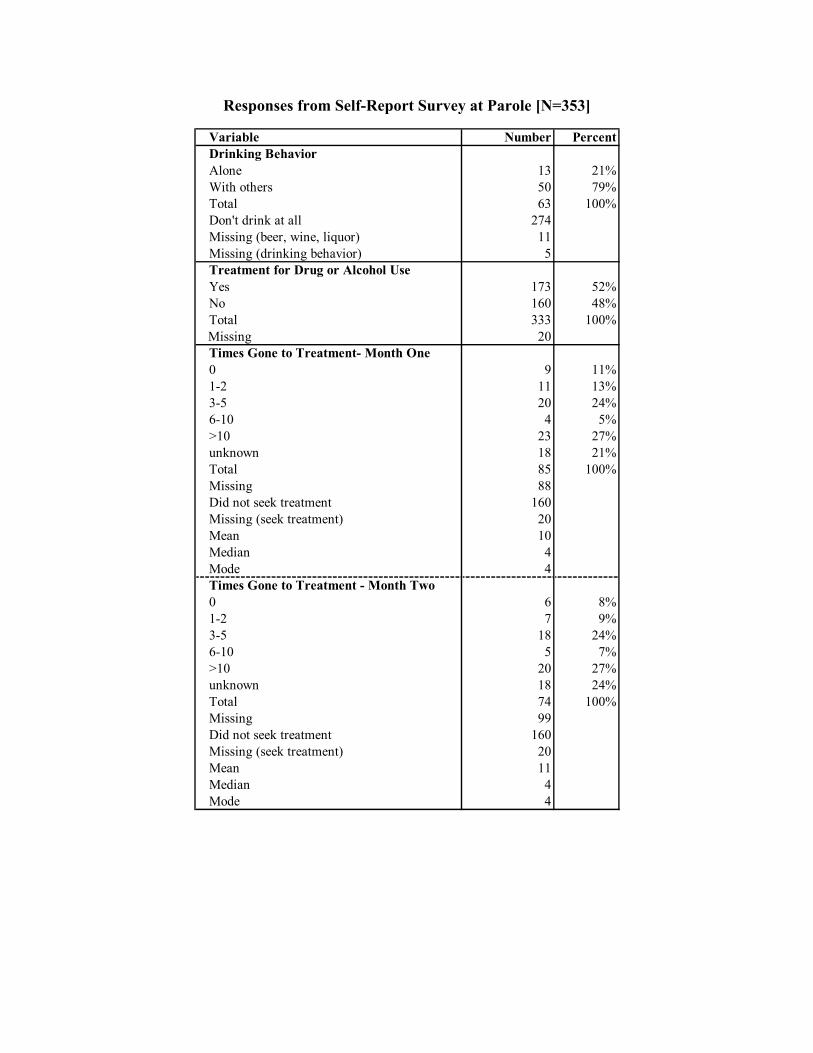
Responses from Self-Report Survey at Parole [N=353]
Variable Number PercentDrinking BehaviorAlone 13 21%With others 50 79%Total 63 100%Don't drink at all 274Missing (beer, wine, liquor) 11Missing (drinking behavior) 5Treatment for Drug or Alcohol UseYes 173 52%No 160 48%Total 333 100%
Missing 20Times Gone to Treatment- Month One0 9 11%1-2 11 13%3-5 20 24%6-10 4 5%>10 23 27%unknown 18 21%Total 85 100%Missing 88Did not seek treatment 160Missing (seek treatment) 20Mean 10Median 4Mode 4Times Gone to Treatment - Month Two0 6 8%1-2 7 9%3-5 18 24%6-10 5 7%>10 20 27%unknown 18 24%Total 74 100%Missing 99Did not seek treatment 160Missing (seek treatment) 20Mean 11Median 4Mode 4
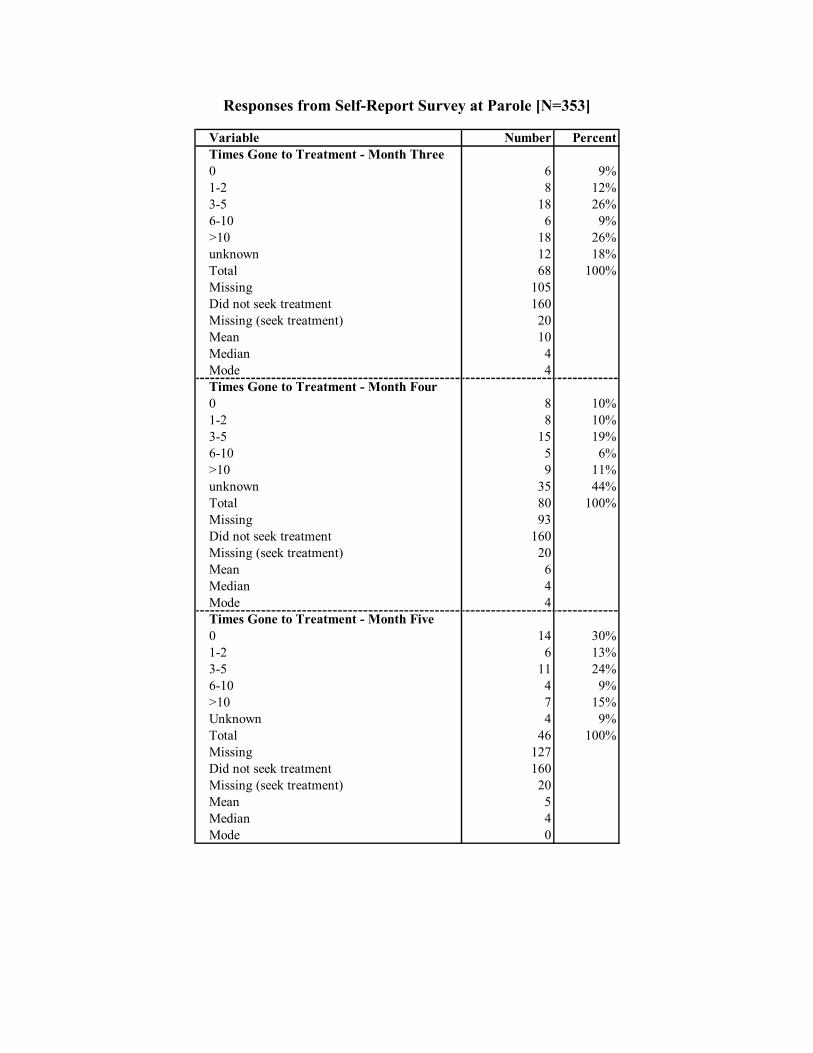
Responses from Self-Report Survey at Parole [N=353]
Variable Number PercentTimes Gone to Treatment - Month Three0 6 9%1-2 8 12%3-5 18 26%6-10 6 9%>10 18 26%unknown 12 18%Total 68 100%Missing 105Did not seek treatment 160Missing (seek treatment) 20Mean 10Median 4Mode 4Times Gone to Treatment - Month Four0 8 10%1-2 8 10%3-5 15 19%6-10 5 6%>10 9 11%unknown 35 44%Total 80 100%Missing 93Did not seek treatment 160Missing (seek treatment) 20Mean 6Median 4Mode 4Times Gone to Treatment - Month Five0 14 30%1-2 6 13%3-5 11 24%6-10 4 9%>10 7 15%Unknown 4 9%Total 46 100%Missing 127Did not seek treatment 160Missing (seek treatment) 20Mean 5Median 4Mode 0
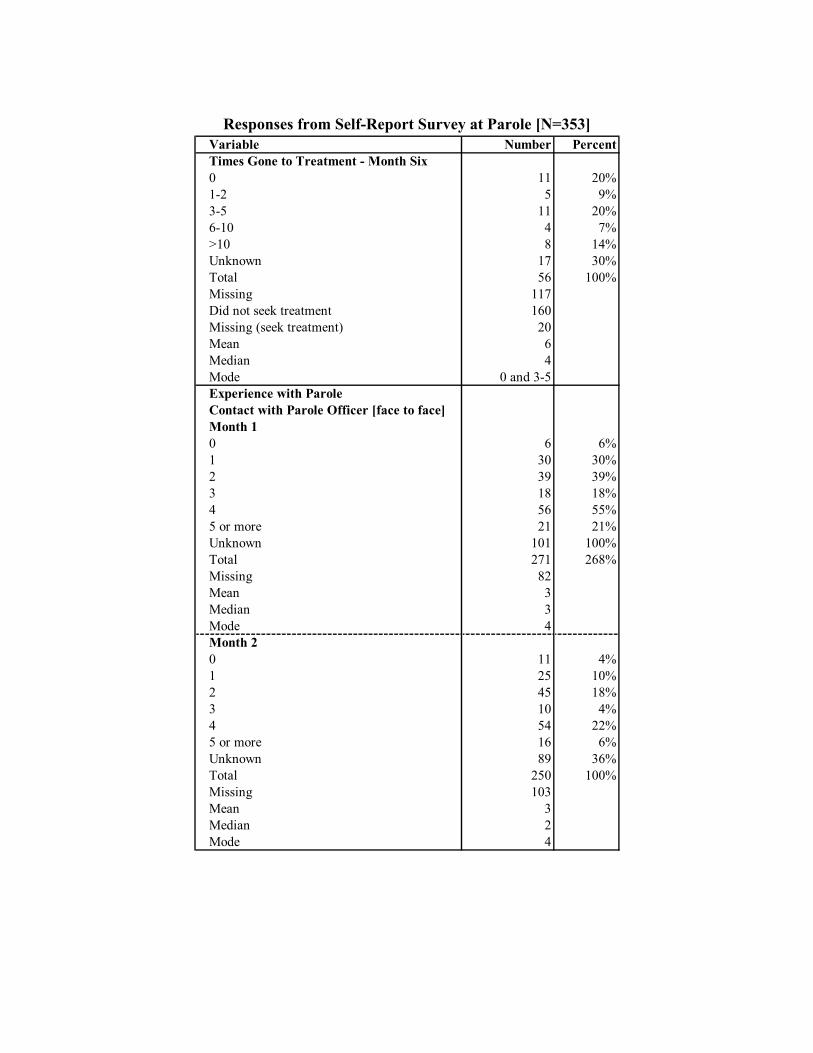
Responses from Self-Report Survey at Parole [N=353]
Variable Number PercentTimes Gone to Treatment - Month Six0 11 20%1-2 5 9%3-5 11 20%6-10 4 7%>10 8 14%Unknown 17 30%Total 56 100%Missing 117Did not seek treatment 160Missing (seek treatment) 20Mean 6Median 4Mode 0 and 3-5Experience with ParoleContact with Parole Officer [face to face]Month 10 6 6%1 30 30%2 39 39%3 18 18%4 56 55%5 or more 21 21%Unknown 101 100%Total 271 268%Missing 82Mean 3Median 3Mode 4Month 20 11 4%1 25 10%2 45 18%3 10 4%4 54 22%5 or more 16 6%Unknown 89 36%Total 250 100%Missing 103Mean 3Median 2Mode 4
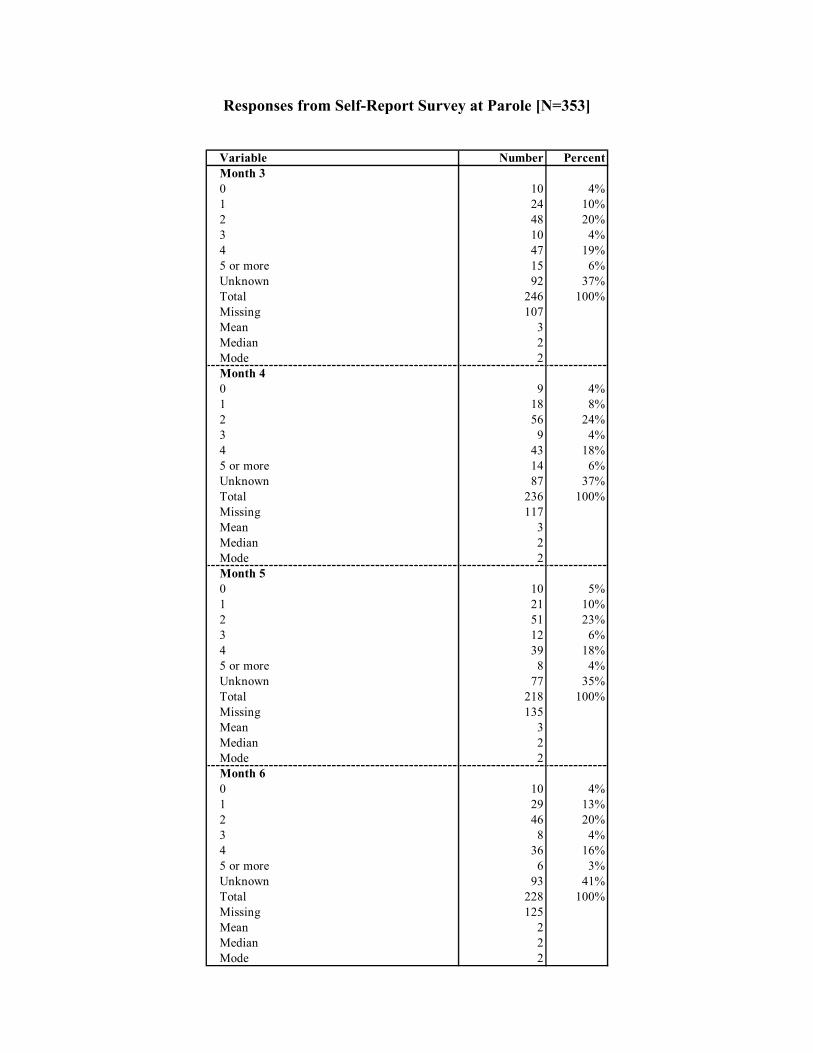
Responses from Self-Report Survey at Parole [N=353]
Variable Number PercentMonth 30 10 4%1 24 10%2 48 20%3 10 4%4 47 19%5 or more 15 6%Unknown 92 37%Total 246 100%Missing 107Mean 3Median 2Mode 2Month 40 9 4%1 18 8%2 56 24%3 9 4%4 43 18%5 or more 14 6%Unknown 87 37%Total 236 100%Missing 117Mean 3Median 2Mode 2Month 50 10 5%1 21 10%2 51 23%3 12 6%4 39 18%5 or more 8 4%Unknown 77 35%Total 218 100%Missing 135Mean 3Median 2Mode 2Month 60 10 4%1 29 13%2 46 20%3 8 4%4 36 16%5 or more 6 3%Unknown 93 41%Total 228 100%Missing 125Mean 2Median 2Mode 2
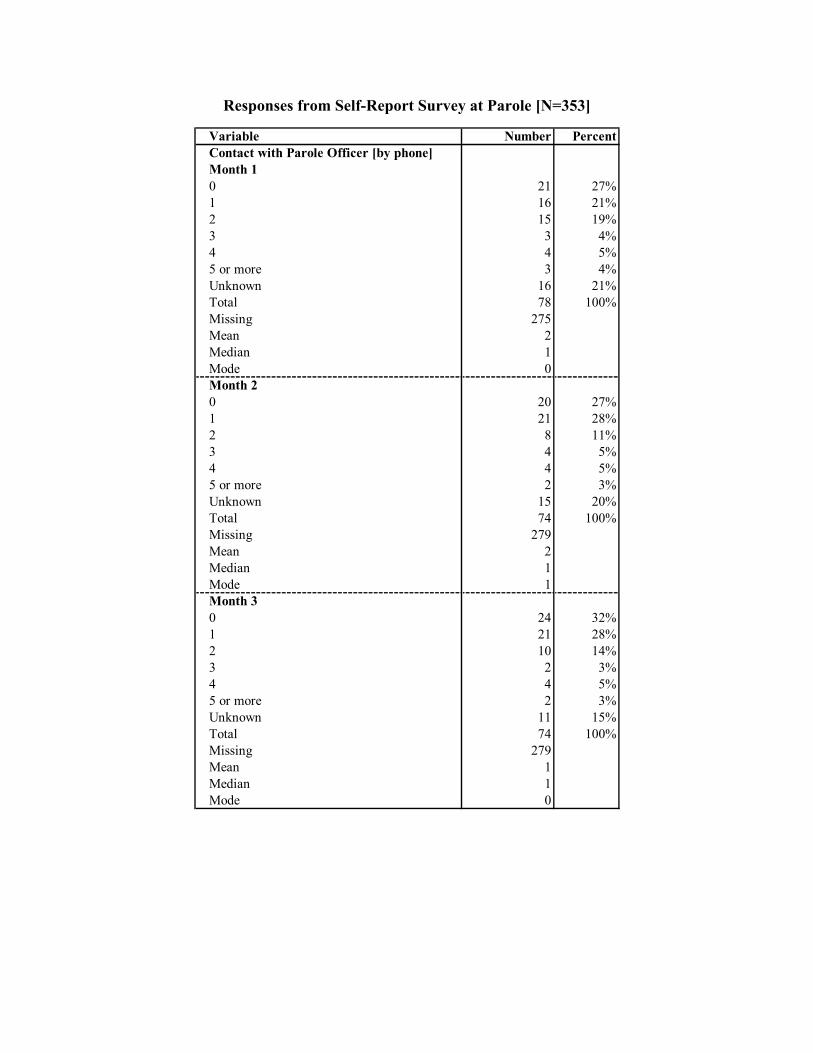
Responses from Self-Report Survey at Parole [N=353]
Variable Number PercentContact with Parole Officer [by phone]Month 10 21 27%1 16 21%2 15 19%3 3 4%4 4 5%5 or more 3 4%Unknown 16 21%Total 78 100%Missing 275Mean 2Median 1Mode 0Month 20 20 27%1 21 28%2 8 11%3 4 5%4 4 5%5 or more 2 3%Unknown 15 20%Total 74 100%Missing 279Mean 2Median 1Mode 1Month 30 24 32%1 21 28%2 10 14%3 2 3%4 4 5%5 or more 2 3%Unknown 11 15%Total 74 100%Missing 279Mean 1Median 1Mode 0
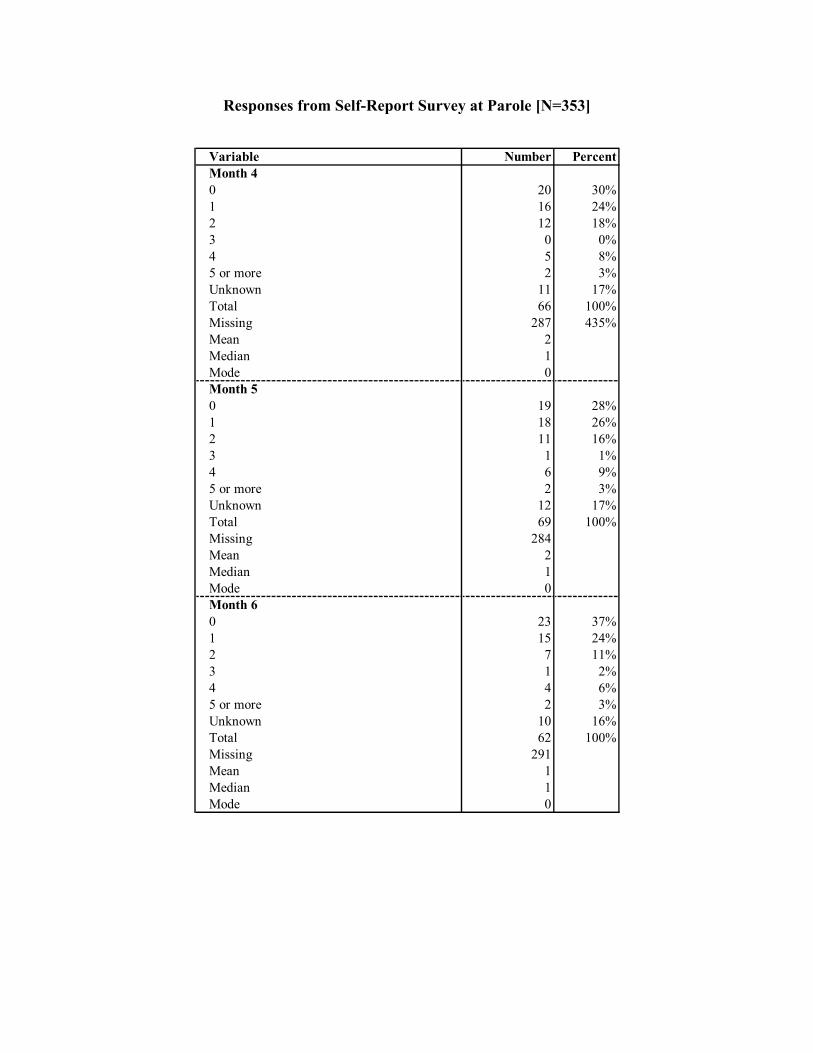
Responses from Self-Report Survey at Parole [N=353]
Variable Number PercentMonth 40 20 30%1 16 24%2 12 18%3 0 0%4 5 8%5 or more 2 3%Unknown 11 17%Total 66 100%Missing 287 435%Mean 2Median 1Mode 0Month 50 19 28%1 18 26%2 11 16%3 1 1%4 6 9%5 or more 2 3%Unknown 12 17%Total 69 100%Missing 284Mean 2Median 1Mode 0Month 60 23 37%1 15 24%2 7 11%3 1 2%4 4 6%5 or more 2 3%Unknown 10 16%Total 62 100%Missing 291Mean 1Median 1Mode 0
APPENDIX D
Responses from Boot Camp Evaluation Survey for Admission, Graduation, and Parole Stages
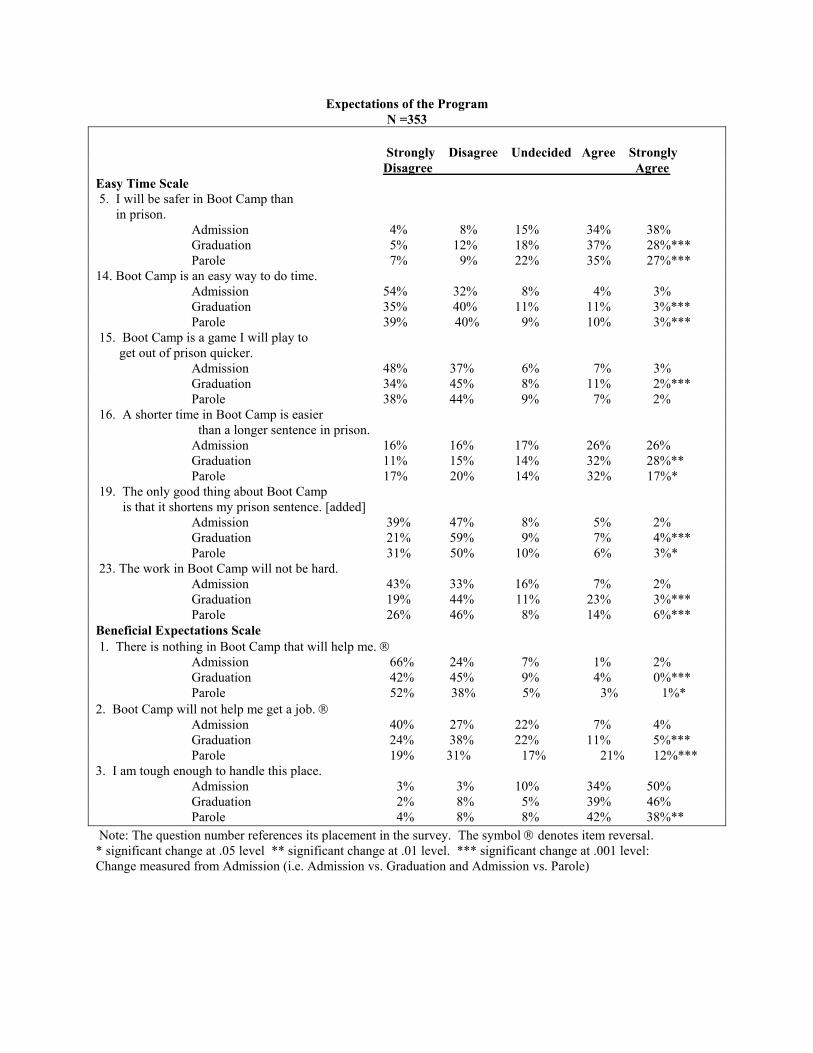
Expectations of the Program N =353
Strongly Disagree Undecided Agree Strongly Disagree Agree Easy Time Scale 5. I will be safer in Boot Camp than in prison. Admission 4% 8% 15% 34% 38% Graduation 5% 12% 18% 37% 28%*** Parole 7% 9% 22% 35% 27%*** 14. Boot Camp is an easy way to do time. Admission 54% 32% 8% 4% 3% Graduation 35% 40% 11% 11% 3%*** Parole 39% 40% 9% 10% 3%*** 15. Boot Camp is a game I will play to get out of prison quicker. Admission 48% 37% 6% 7% 3% Graduation 34% 45% 8% 11% 2%*** Parole 38% 44% 9% 7% 2%
16. A shorter time in Boot Camp is easier than a longer sentence in prison. Admission 16% 16% 17% 26% 26% Graduation 11% 15% 14% 32% 28%** Parole 17% 20% 14% 32% 17%* 19. The only good thing about Boot Camp is that it shortens my prison sentence. [added] Admission 39% 47% 8% 5% 2% Graduation 21% 59% 9% 7% 4%*** Parole 31% 50% 10% 6% 3%* 23. The work in Boot Camp will not be hard. Admission 43% 33% 16% 7% 2% Graduation 19% 44% 11% 23% 3%*** Parole 26% 46% 8% 14% 6%*** Beneficial Expectations Scale 1. There is nothing in Boot Camp that will help me. Admission 66% 24% 7% 1% 2% Graduation 42% 45% 9% 4% 0%*** Parole 52% 38% 5% 3% 1%* 2. Boot Camp will not help me get a job. Admission 40% 27% 22% 7% 4% Graduation 24% 38% 22% 11% 5%***
Parole 19% 31% 17% 21% 12%*** 3. I am tough enough to handle this place. Admission 3% 3% 10% 34% 50% Graduation 2% 8% 5% 39% 46% Parole 4% 8% 8% 42% 38%** Note: The question number references its placement in the survey. The symbol denotes item reversal. * significant change at .05 level ** significant change at .01 level. *** significant change at .001 level: Change measured from Admission (i.e. Admission vs. Graduation and Admission vs. Parole)
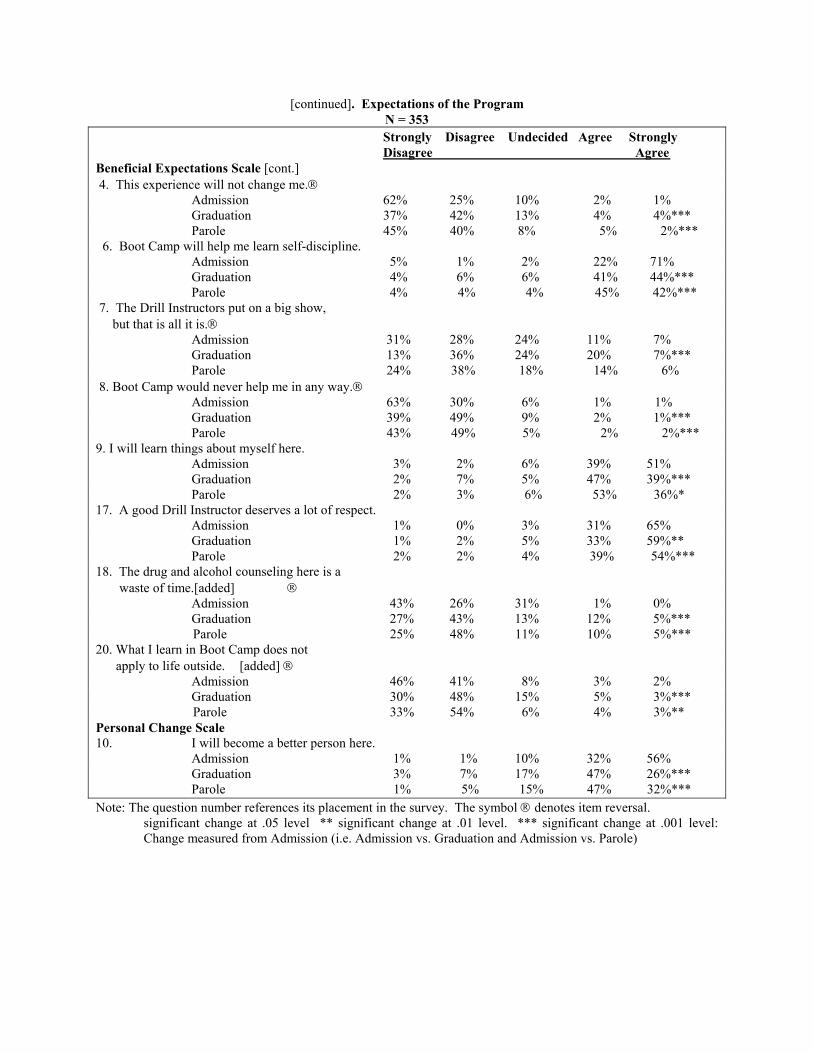
[continued]. Expectations of the Program N = 353
Strongly Disagree Undecided Agree Strongly Disagree Agree Beneficial Expectations Scale [cont.] 4. This experience will not change me. Admission 62% 25% 10% 2% 1% Graduation 37% 42% 13% 4% 4%*** Parole 45% 40% 8% 5% 2%*** 6. Boot Camp will help me learn self-discipline. Admission 5% 1% 2% 22% 71% Graduation 4% 6% 6% 41% 44%*** Parole 4% 4% 4% 45% 42%*** 7. The Drill Instructors put on a big show, but that is all it is. Admission 31% 28% 24% 11% 7% Graduation 13% 36% 24% 20% 7%*** Parole 24% 38% 18% 14% 6% 8. Boot Camp would never help me in any way. Admission 63% 30% 6% 1% 1%
Graduation 39% 49% 9% 2% 1%*** Parole 43% 49% 5% 2% 2%***
9. I will learn things about myself here. Admission 3% 2% 6% 39% 51%
Graduation 2% 7% 5% 47% 39%*** Parole 2% 3% 6% 53% 36%*
17. A good Drill Instructor deserves a lot of respect. Admission 1% 0% 3% 31% 65%
Graduation 1% 2% 5% 33% 59%** Parole 2% 2% 4% 39% 54%*** 18. The drug and alcohol counseling here is a waste of time.[added] Admission 43% 26% 31% 1% 0% Graduation 27% 43% 13% 12% 5%*** Parole 25% 48% 11% 10% 5%*** 20. What I learn in Boot Camp does not apply to life outside. [added] Admission 46% 41% 8% 3% 2% Graduation 30% 48% 15% 5% 3%*** Parole 33% 54% 6% 4% 3%** Personal Change Scale 10. I will become a better person here. Admission 1% 1% 10% 32% 56% Graduation 3% 7% 17% 47% 26%*** Parole 1% 5% 15% 47% 32%*** Note: The question number references its placement in the survey. The symbol denotes item reversal.
significant change at .05 level ** significant change at .01 level. *** significant change at .001 level: Change measured from Admission (i.e. Admission vs. Graduation and Admission vs. Parole)
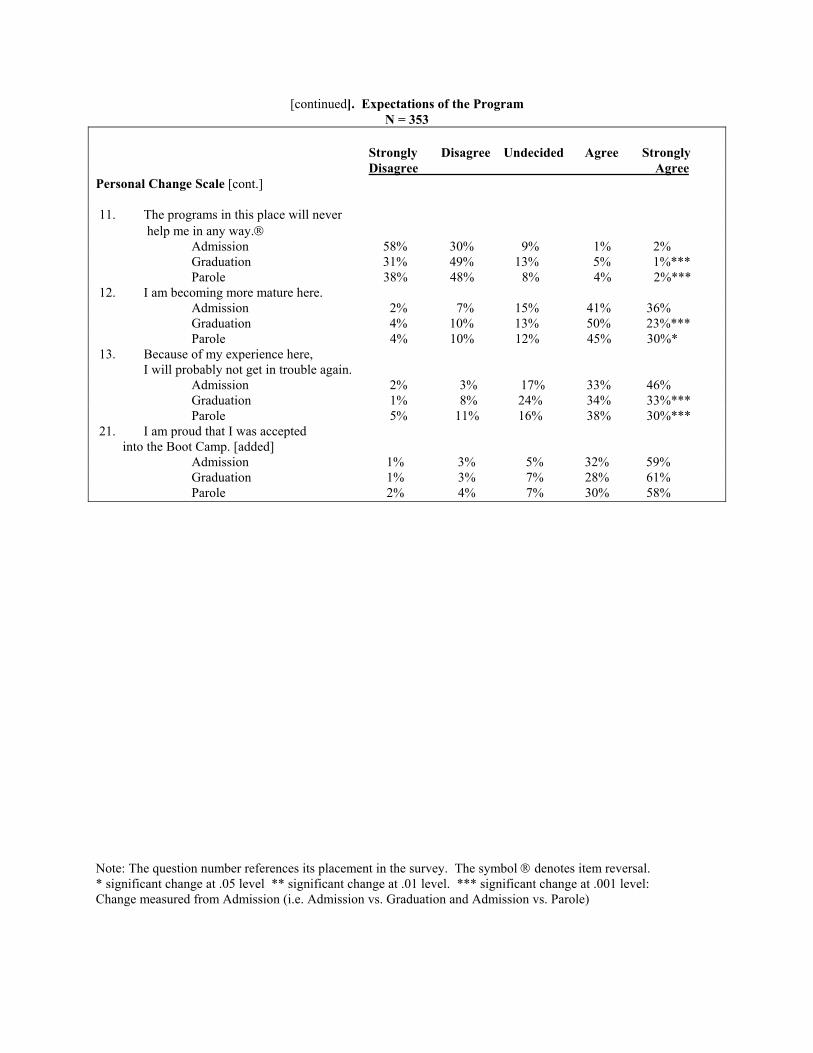
[continued]. Expectations of the Program N = 353
Strongly Disagree Undecided Agree Strongly Disagree Agree Personal Change Scale [cont.] 11. The programs in this place will never help me in any way. Admission 58% 30% 9% 1% 2% Graduation 31% 49% 13% 5% 1%*** Parole 38% 48% 8% 4% 2%*** 12. I am becoming more mature here. Admission 2% 7% 15% 41% 36% Graduation 4% 10% 13% 50% 23%*** Parole 4% 10% 12% 45% 30%* 13. Because of my experience here, I will probably not get in trouble again. Admission 2% 3% 17% 33% 46% Graduation 1% 8% 24% 34% 33%*** Parole 5% 11% 16% 38% 30%*** 21. I am proud that I was accepted into the Boot Camp. [added] Admission 1% 3% 5% 32% 59% Graduation 1% 3% 7% 28% 61% Parole 2% 4% 7% 30% 58% Note: The question number references its placement in the survey. The symbol denotes item reversal. * significant change at .05 level ** significant change at .01 level. *** significant change at .001 level: Change measured from Admission (i.e. Admission vs. Graduation and Admission vs. Parole)
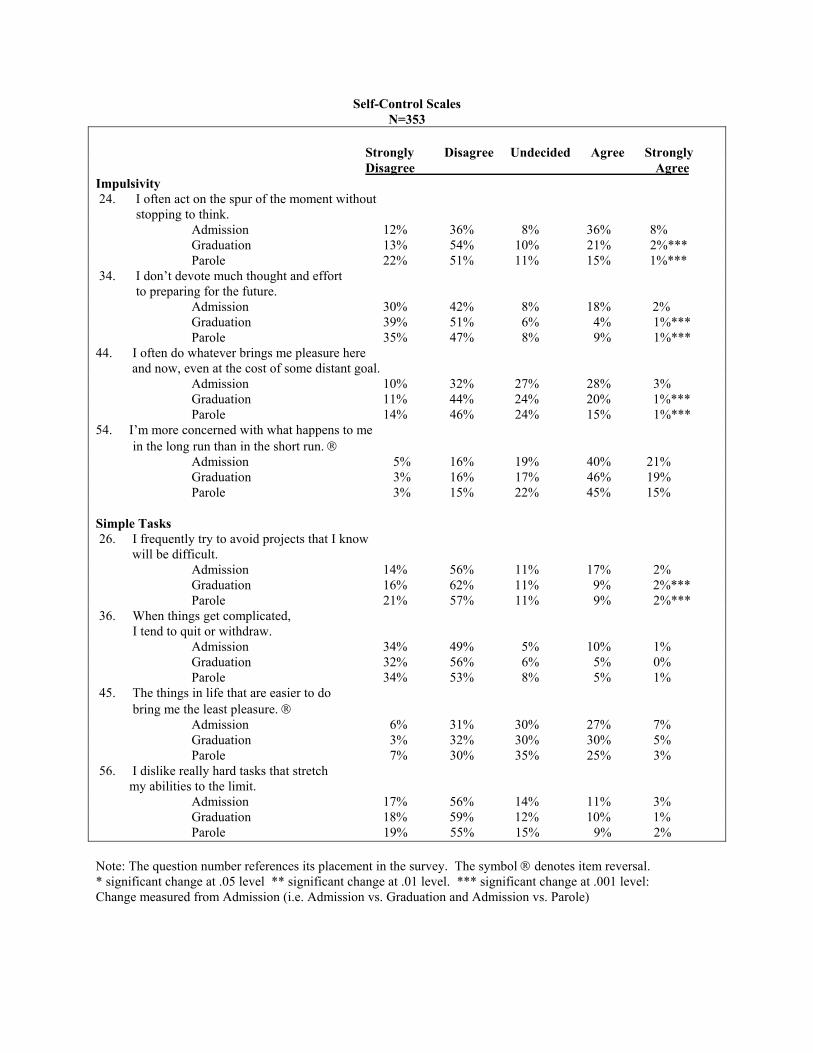
Self-Control Scales N=353
Strongly Disagree Undecided Agree Strongly Disagree Agree Impulsivity 24. I often act on the spur of the moment without stopping to think. Admission 12% 36% 8% 36% 8% Graduation 13% 54% 10% 21% 2%*** Parole 22% 51% 11% 15% 1%*** 34. I don�’t devote much thought and effort to preparing for the future. Admission 30% 42% 8% 18% 2% Graduation 39% 51% 6% 4% 1%*** Parole 35% 47% 8% 9% 1%*** 44. I often do whatever brings me pleasure here
and now, even at the cost of some distant goal. Admission 10% 32% 27% 28% 3% Graduation 11% 44% 24% 20% 1%*** Parole 14% 46% 24% 15% 1%*** 54. I�’m more concerned with what happens to me in the long run than in the short run. Admission 5% 16% 19% 40% 21% Graduation 3% 16% 17% 46% 19% Parole 3% 15% 22% 45% 15% Simple Tasks 26. I frequently try to avoid projects that I know
will be difficult. Admission 14% 56% 11% 17% 2% Graduation 16% 62% 11% 9% 2%*** Parole 21% 57% 11% 9% 2%*** 36. When things get complicated, I tend to quit or withdraw. Admission 34% 49% 5% 10% 1% Graduation 32% 56% 6% 5% 0% Parole 34% 53% 8% 5% 1% 45. The things in life that are easier to do bring me the least pleasure. Admission 6% 31% 30% 27% 7% Graduation 3% 32% 30% 30% 5% Parole 7% 30% 35% 25% 3% 56. I dislike really hard tasks that stretch my abilities to the limit. Admission 17% 56% 14% 11% 3% Graduation 18% 59% 12% 10% 1% Parole 19% 55% 15% 9% 2% Note: The question number references its placement in the survey. The symbol denotes item reversal. * significant change at .05 level ** significant change at .01 level. *** significant change at .001 level: Change measured from Admission (i.e. Admission vs. Graduation and Admission vs. Parole)
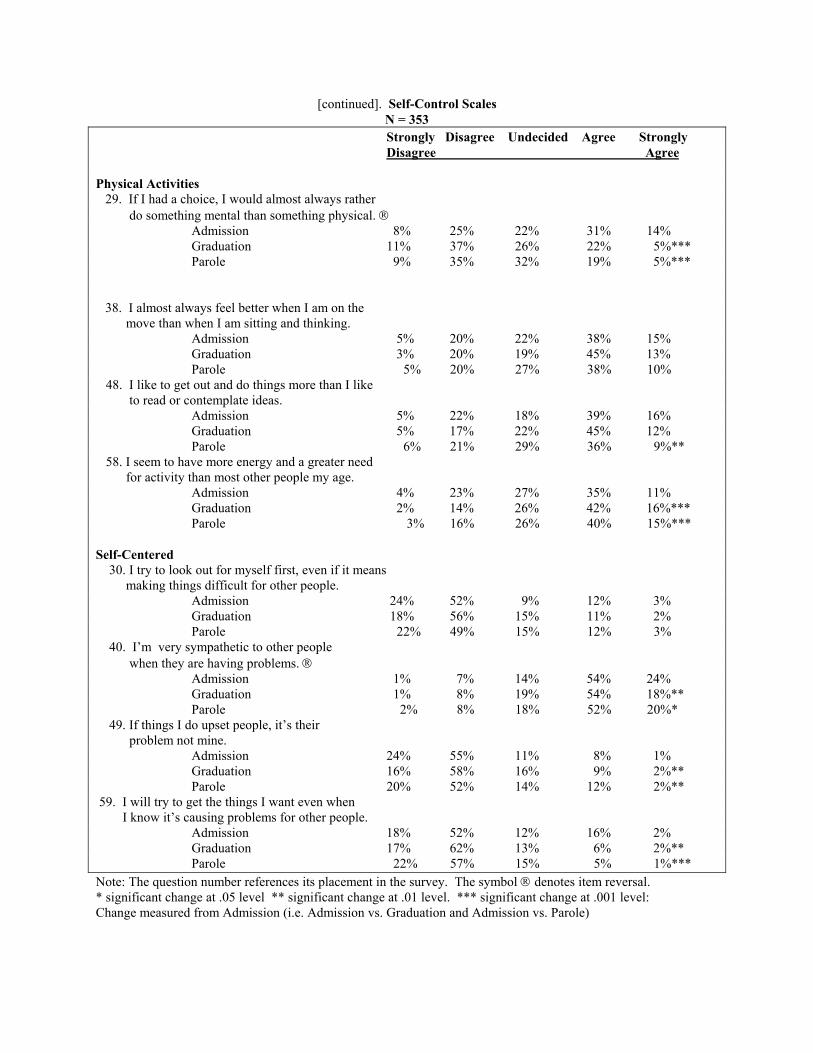
[continued]. Self-Control Scales N = 353
Strongly Disagree Undecided Agree Strongly Disagree Agree Physical Activities
29. If I had a choice, I would almost always rather do something mental than something physical. Admission 8% 25% 22% 31% 14% Graduation 11% 37% 26% 22% 5%*** Parole 9% 35% 32% 19% 5%***
38. I almost always feel better when I am on the move than when I am sitting and thinking. Admission 5% 20% 22% 38% 15% Graduation 3% 20% 19% 45% 13% Parole 5% 20% 27% 38% 10% 48. I like to get out and do things more than I like to read or contemplate ideas. Admission 5% 22% 18% 39% 16% Graduation 5% 17% 22% 45% 12% Parole 6% 21% 29% 36% 9%** 58. I seem to have more energy and a greater need for activity than most other people my age. Admission 4% 23% 27% 35% 11% Graduation 2% 14% 26% 42% 16%*** Parole 3% 16% 26% 40% 15%*** Self-Centered 30. I try to look out for myself first, even if it means making things difficult for other people. Admission 24% 52% 9% 12% 3% Graduation 18% 56% 15% 11% 2% Parole 22% 49% 15% 12% 3% 40. I�’m very sympathetic to other people when they are having problems. Admission 1% 7% 14% 54% 24% Graduation 1% 8% 19% 54% 18%** Parole 2% 8% 18% 52% 20%* 49. If things I do upset people, it�’s their problem not mine. Admission 24% 55% 11% 8% 1% Graduation 16% 58% 16% 9% 2%** Parole 20% 52% 14% 12% 2%** 59. I will try to get the things I want even when I know it�’s causing problems for other people. Admission 18% 52% 12% 16% 2% Graduation 17% 62% 13% 6% 2%** Parole 22% 57% 15% 5% 1%*** Note: The question number references its placement in the survey. The symbol denotes item reversal. * significant change at .05 level ** significant change at .01 level. *** significant change at .001 level: Change measured from Admission (i.e. Admission vs. Graduation and Admission vs. Parole)
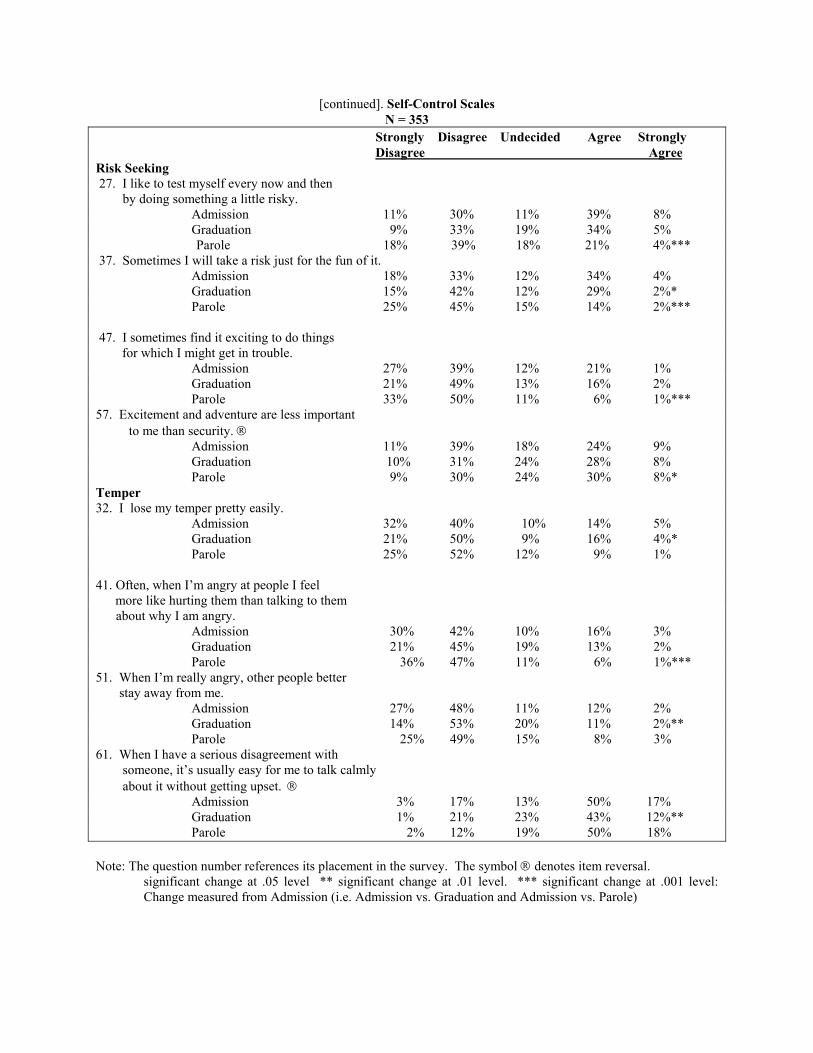
[continued]. Self-Control Scales N = 353
Strongly Disagree Undecided Agree Strongly Disagree Agree Risk Seeking 27. I like to test myself every now and then by doing something a little risky. Admission 11% 30% 11% 39% 8% Graduation 9% 33% 19% 34% 5% Parole 18% 39% 18% 21% 4%*** 37. Sometimes I will take a risk just for the fun of it. Admission 18% 33% 12% 34% 4% Graduation 15% 42% 12% 29% 2%* Parole 25% 45% 15% 14% 2%*** 47. I sometimes find it exciting to do things
for which I might get in trouble. Admission 27% 39% 12% 21% 1% Graduation 21% 49% 13% 16% 2% Parole 33% 50% 11% 6% 1%*** 57. Excitement and adventure are less important
to me than security. Admission 11% 39% 18% 24% 9% Graduation 10% 31% 24% 28% 8% Parole 9% 30% 24% 30% 8%* Temper 32. I lose my temper pretty easily. Admission 32% 40% 10% 14% 5% Graduation 21% 50% 9% 16% 4%* Parole 25% 52% 12% 9% 1% 41. Often, when I�’m angry at people I feel
more like hurting them than talking to them about why I am angry. Admission 30% 42% 10% 16% 3% Graduation 21% 45% 19% 13% 2% Parole 36% 47% 11% 6% 1%*** 51. When I�’m really angry, other people better stay away from me. Admission 27% 48% 11% 12% 2% Graduation 14% 53% 20% 11% 2%** Parole 25% 49% 15% 8% 3% 61. When I have a serious disagreement with someone, it�’s usually easy for me to talk calmly about it without getting upset. Admission 3% 17% 13% 50% 17% Graduation 1% 21% 23% 43% 12%** Parole 2% 12% 19% 50% 18% Note: The question number references its placement in the survey. The symbol denotes item reversal.
significant change at .05 level ** significant change at .01 level. *** significant change at .001 level: Change measured from Admission (i.e. Admission vs. Graduation and Admission vs. Parole)
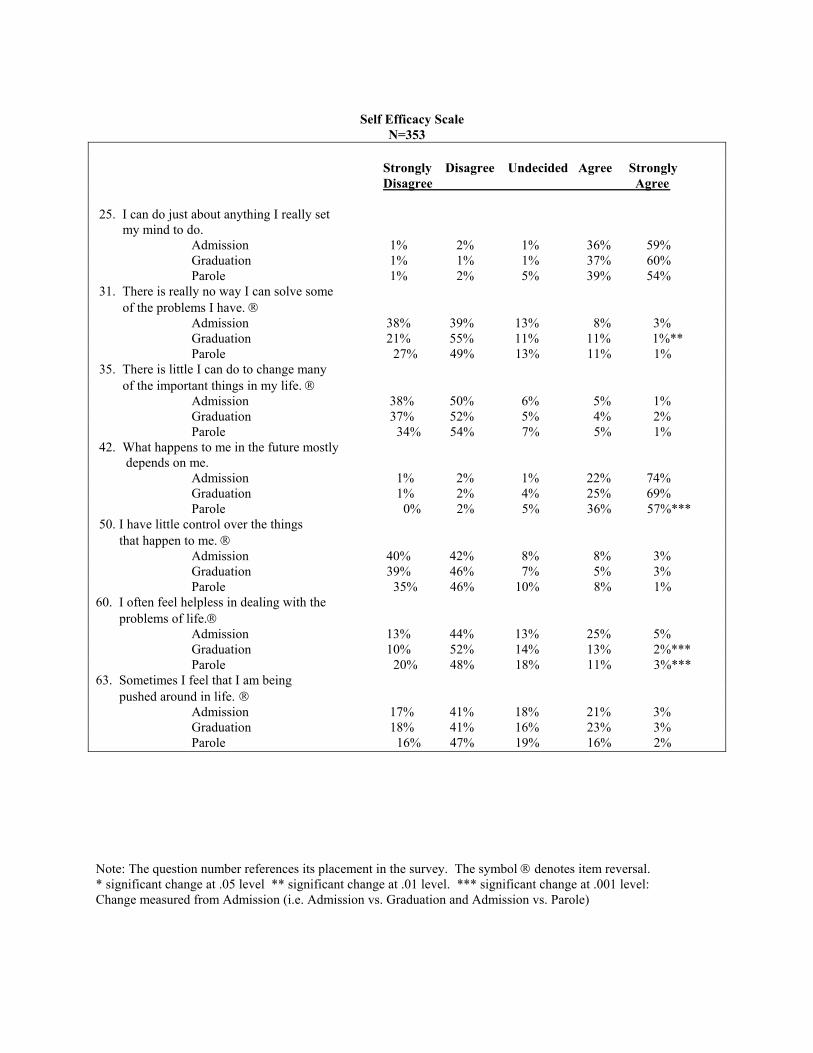
Self Efficacy Scale
N=353 Strongly Disagree Undecided Agree Strongly Disagree Agree 25. I can do just about anything I really set my mind to do. Admission 1% 2% 1% 36% 59% Graduation 1% 1% 1% 37% 60% Parole 1% 2% 5% 39% 54% 31. There is really no way I can solve some of the problems I have. Admission 38% 39% 13% 8% 3% Graduation 21% 55% 11% 11% 1%** Parole 27% 49% 13% 11% 1% 35. There is little I can do to change many of the important things in my life. Admission 38% 50% 6% 5% 1% Graduation 37% 52% 5% 4% 2% Parole 34% 54% 7% 5% 1% 42. What happens to me in the future mostly depends on me. Admission 1% 2% 1% 22% 74% Graduation 1% 2% 4% 25% 69% Parole 0% 2% 5% 36% 57%*** 50. I have little control over the things that happen to me. Admission 40% 42% 8% 8% 3% Graduation 39% 46% 7% 5% 3% Parole 35% 46% 10% 8% 1% 60. I often feel helpless in dealing with the problems of life. Admission 13% 44% 13% 25% 5% Graduation 10% 52% 14% 13% 2%*** Parole 20% 48% 18% 11% 3%*** 63. Sometimes I feel that I am being pushed around in life. Admission 17% 41% 18% 21% 3% Graduation 18% 41% 16% 23% 3% Parole 16% 47% 19% 16% 2% Note: The question number references its placement in the survey. The symbol denotes item reversal. * significant change at .05 level ** significant change at .01 level. *** significant change at .001 level: Change measured from Admission (i.e. Admission vs. Graduation and Admission vs. Parole)
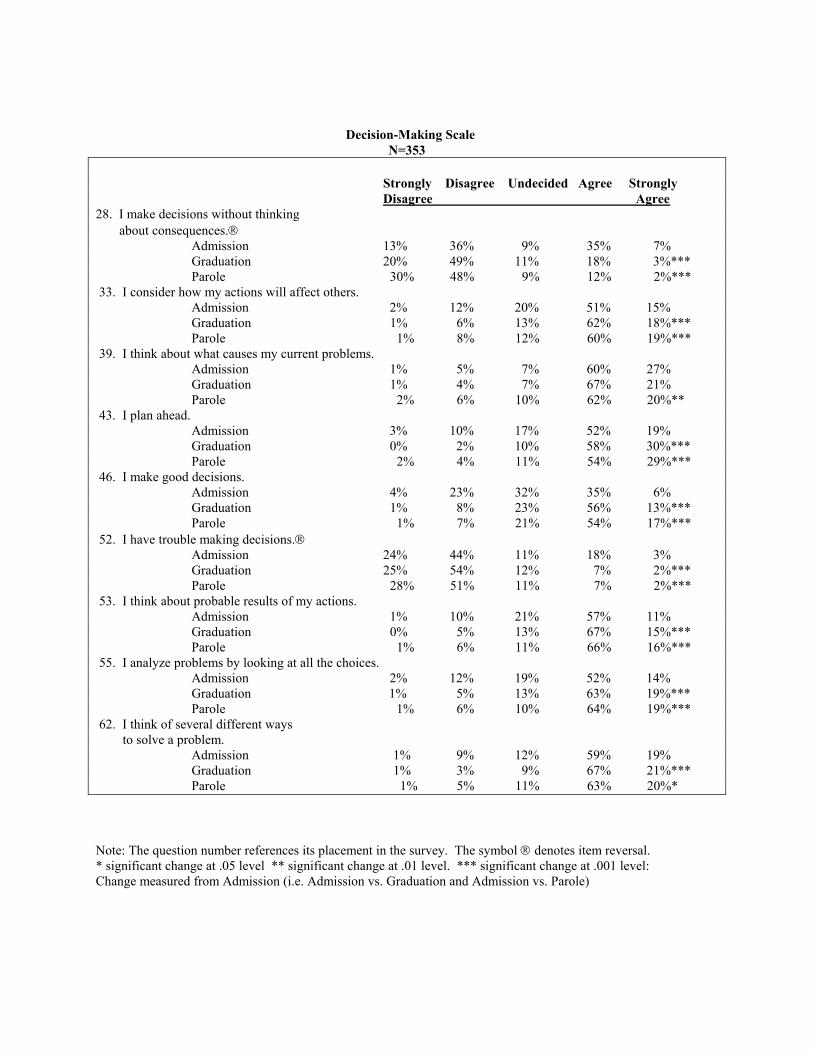
Decision-Making Scale N=353
Strongly Disagree Undecided Agree Strongly Disagree Agree 28. I make decisions without thinking about consequences. Admission 13% 36% 9% 35% 7% Graduation 20% 49% 11% 18% 3%*** Parole 30% 48% 9% 12% 2%*** 33. I consider how my actions will affect others. Admission 2% 12% 20% 51% 15% Graduation 1% 6% 13% 62% 18%*** Parole 1% 8% 12% 60% 19%*** 39. I think about what causes my current problems. Admission 1% 5% 7% 60% 27% Graduation 1% 4% 7% 67% 21% Parole 2% 6% 10% 62% 20%** 43. I plan ahead. Admission 3% 10% 17% 52% 19% Graduation 0% 2% 10% 58% 30%*** Parole 2% 4% 11% 54% 29%*** 46. I make good decisions. Admission 4% 23% 32% 35% 6% Graduation 1% 8% 23% 56% 13%*** Parole 1% 7% 21% 54% 17%*** 52. I have trouble making decisions. Admission 24% 44% 11% 18% 3% Graduation 25% 54% 12% 7% 2%*** Parole 28% 51% 11% 7% 2%*** 53. I think about probable results of my actions. Admission 1% 10% 21% 57% 11% Graduation 0% 5% 13% 67% 15%*** Parole 1% 6% 11% 66% 16%*** 55. I analyze problems by looking at all the choices. Admission 2% 12% 19% 52% 14% Graduation 1% 5% 13% 63% 19%*** Parole 1% 6% 10% 64% 19%*** 62. I think of several different ways to solve a problem. Admission 1% 9% 12% 59% 19% Graduation 1% 3% 9% 67% 21%*** Parole 1% 5% 11% 63% 20%* Note: The question number references its placement in the survey. The symbol denotes item reversal. * significant change at .05 level ** significant change at .01 level. *** significant change at .001 level: Change measured from Admission (i.e. Admission vs. Graduation and Admission vs. Parole)
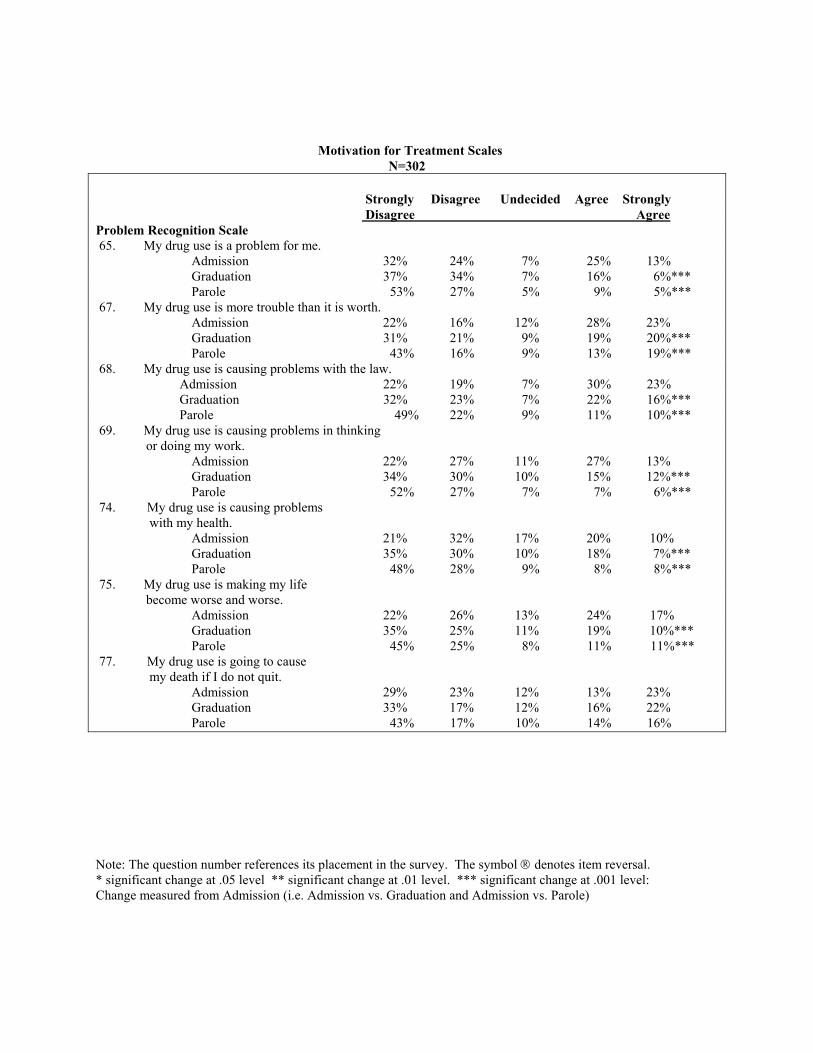
Motivation for Treatment Scales N=302
Strongly Disagree Undecided Agree Strongly Disagree Agree Problem Recognition Scale 65. My drug use is a problem for me. Admission 32% 24% 7% 25% 13% Graduation 37% 34% 7% 16% 6%*** Parole 53% 27% 5% 9% 5%*** 67. My drug use is more trouble than it is worth. Admission 22% 16% 12% 28% 23% Graduation 31% 21% 9% 19% 20%*** Parole 43% 16% 9% 13% 19%*** 68. My drug use is causing problems with the law. Admission 22% 19% 7% 30% 23% Graduation 32% 23% 7% 22% 16%*** Parole 49% 22% 9% 11% 10%*** 69. My drug use is causing problems in thinking or doing my work. Admission 22% 27% 11% 27% 13% Graduation 34% 30% 10% 15% 12%*** Parole 52% 27% 7% 7% 6%*** 74. My drug use is causing problems with my health. Admission 21% 32% 17% 20% 10% Graduation 35% 30% 10% 18% 7%*** Parole 48% 28% 9% 8% 8%*** 75. My drug use is making my life become worse and worse. Admission 22% 26% 13% 24% 17% Graduation 35% 25% 11% 19% 10%*** Parole 45% 25% 8% 11% 11%*** 77. My drug use is going to cause my death if I do not quit. Admission 29% 23% 12% 13% 23% Graduation 33% 17% 12% 16% 22% Parole 43% 17% 10% 14% 16% Note: The question number references its placement in the survey. The symbol denotes item reversal. * significant change at .05 level ** significant change at .01 level. *** significant change at .001 level: Change measured from Admission (i.e. Admission vs. Graduation and Admission vs. Parole)
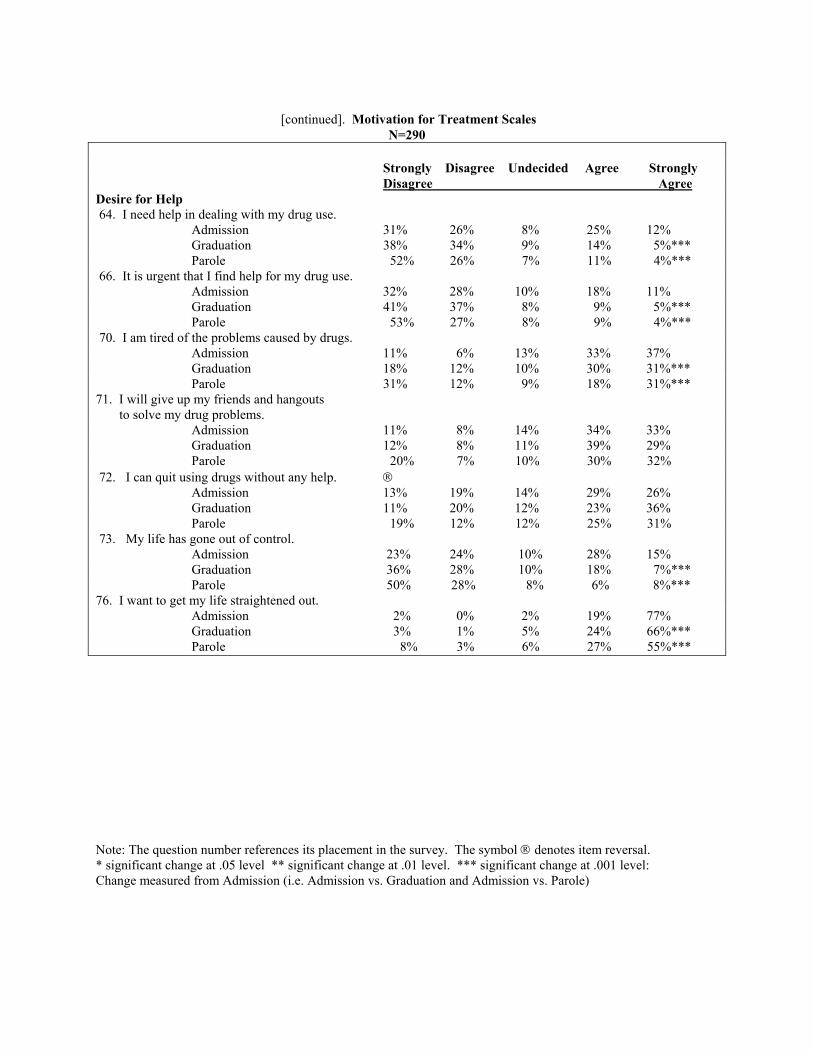
[continued]. Motivation for Treatment Scales
N=290 Strongly Disagree Undecided Agree Strongly Disagree Agree Desire for Help 64. I need help in dealing with my drug use. Admission 31% 26% 8% 25% 12% Graduation 38% 34% 9% 14% 5%*** Parole 52% 26% 7% 11% 4%*** 66. It is urgent that I find help for my drug use. Admission 32% 28% 10% 18% 11% Graduation 41% 37% 8% 9% 5%*** Parole 53% 27% 8% 9% 4%*** 70. I am tired of the problems caused by drugs. Admission 11% 6% 13% 33% 37% Graduation 18% 12% 10% 30% 31%*** Parole 31% 12% 9% 18% 31%*** 71. I will give up my friends and hangouts to solve my drug problems. Admission 11% 8% 14% 34% 33% Graduation 12% 8% 11% 39% 29% Parole 20% 7% 10% 30% 32% 72. I can quit using drugs without any help. Admission 13% 19% 14% 29% 26% Graduation 11% 20% 12% 23% 36% Parole 19% 12% 12% 25% 31% 73. My life has gone out of control. Admission 23% 24% 10% 28% 15% Graduation 36% 28% 10% 18% 7%*** Parole 50% 28% 8% 6% 8%*** 76. I want to get my life straightened out. Admission 2% 0% 2% 19% 77% Graduation 3% 1% 5% 24% 66%*** Parole 8% 3% 6% 27% 55%*** Note: The question number references its placement in the survey. The symbol denotes item reversal. * significant change at .05 level ** significant change at .01 level. *** significant change at .001 level: Change measured from Admission (i.e. Admission vs. Graduation and Admission vs. Parole)
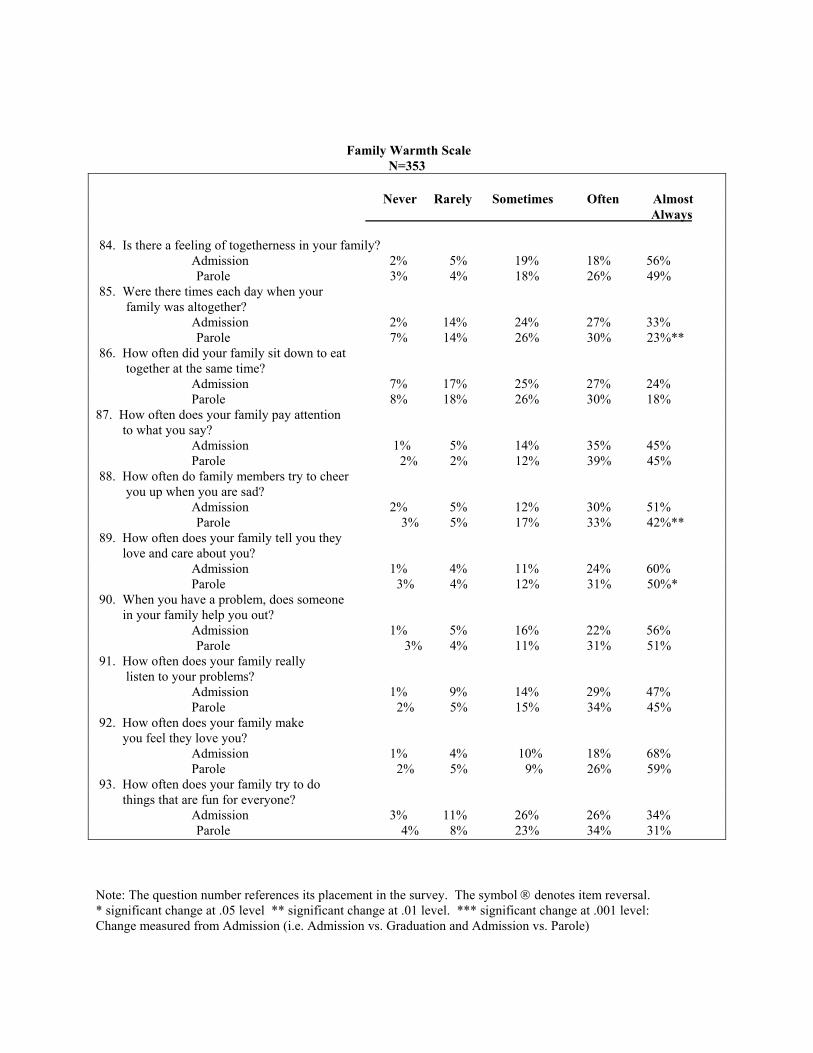
Family Warmth Scale N=353
Never Rarely Sometimes Often Almost Always 84. Is there a feeling of togetherness in your family? Admission 2% 5% 19% 18% 56% Parole 3% 4% 18% 26% 49% 85. Were there times each day when your family was altogether? Admission 2% 14% 24% 27% 33% Parole 7% 14% 26% 30% 23%** 86. How often did your family sit down to eat together at the same time? Admission 7% 17% 25% 27% 24% Parole 8% 18% 26% 30% 18% 87. How often does your family pay attention to what you say? Admission 1% 5% 14% 35% 45% Parole 2% 2% 12% 39% 45% 88. How often do family members try to cheer you up when you are sad? Admission 2% 5% 12% 30% 51% Parole 3% 5% 17% 33% 42%** 89. How often does your family tell you they love and care about you? Admission 1% 4% 11% 24% 60% Parole 3% 4% 12% 31% 50%* 90. When you have a problem, does someone in your family help you out? Admission 1% 5% 16% 22% 56% Parole 3% 4% 11% 31% 51% 91. How often does your family really listen to your problems? Admission 1% 9% 14% 29% 47% Parole 2% 5% 15% 34% 45% 92. How often does your family make you feel they love you? Admission 1% 4% 10% 18% 68% Parole 2% 5% 9% 26% 59% 93. How often does your family try to do things that are fun for everyone? Admission 3% 11% 26% 26% 34% Parole 4% 8% 23% 34% 31% Note: The question number references its placement in the survey. The symbol denotes item reversal. * significant change at .05 level ** significant change at .01 level. *** significant change at .001 level: Change measured from Admission (i.e. Admission vs. Graduation and Admission vs. Parole)
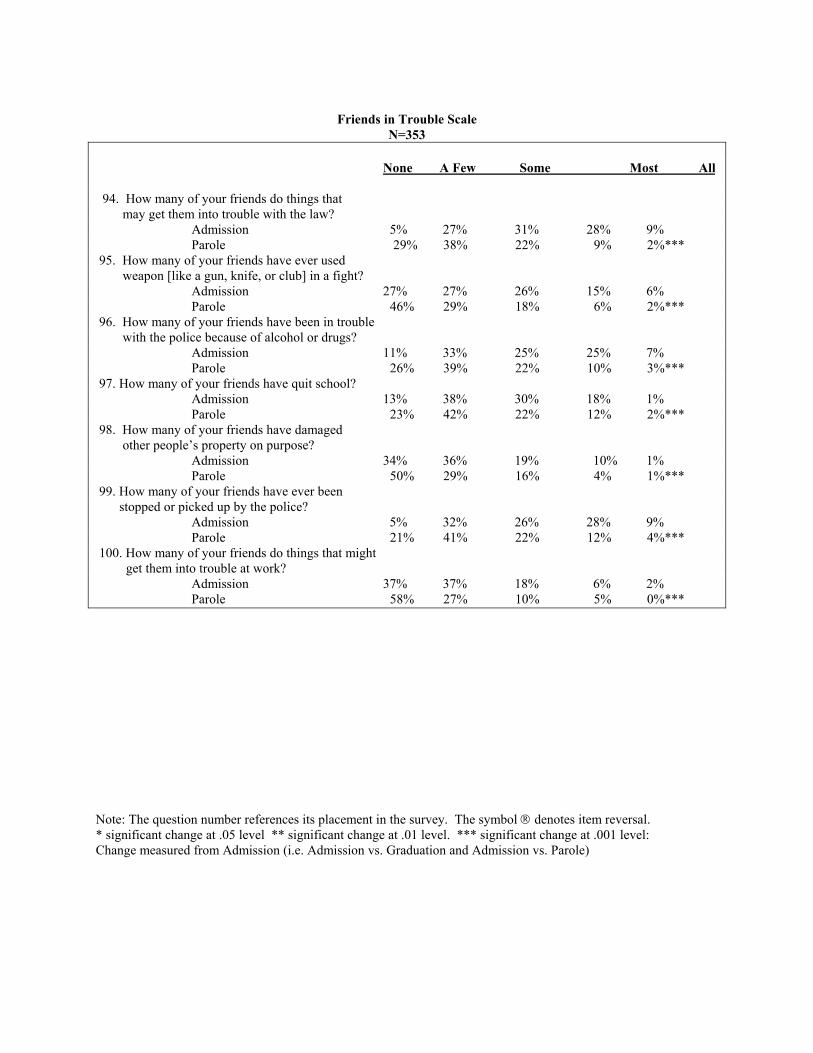
Friends in Trouble Scale
N=353 None A Few Some Most All 94. How many of your friends do things that may get them into trouble with the law? Admission 5% 27% 31% 28% 9% Parole 29% 38% 22% 9% 2%*** 95. How many of your friends have ever used weapon [like a gun, knife, or club] in a fight? Admission 27% 27% 26% 15% 6% Parole 46% 29% 18% 6% 2%*** 96. How many of your friends have been in trouble with the police because of alcohol or drugs? Admission 11% 33% 25% 25% 7% Parole 26% 39% 22% 10% 3%*** 97. How many of your friends have quit school? Admission 13% 38% 30% 18% 1% Parole 23% 42% 22% 12% 2%*** 98. How many of your friends have damaged other people�’s property on purpose? Admission 34% 36% 19% 10% 1% Parole 50% 29% 16% 4% 1%*** 99. How many of your friends have ever been stopped or picked up by the police? Admission 5% 32% 26% 28% 9% Parole 21% 41% 22% 12% 4%*** 100. How many of your friends do things that might get them into trouble at work? Admission 37% 37% 18% 6% 2% Parole 58% 27% 10% 5% 0%*** Note: The question number references its placement in the survey. The symbol denotes item reversal. * significant change at .05 level ** significant change at .01 level. *** significant change at .001 level: Change measured from Admission (i.e. Admission vs. Graduation and Admission vs. Parole)
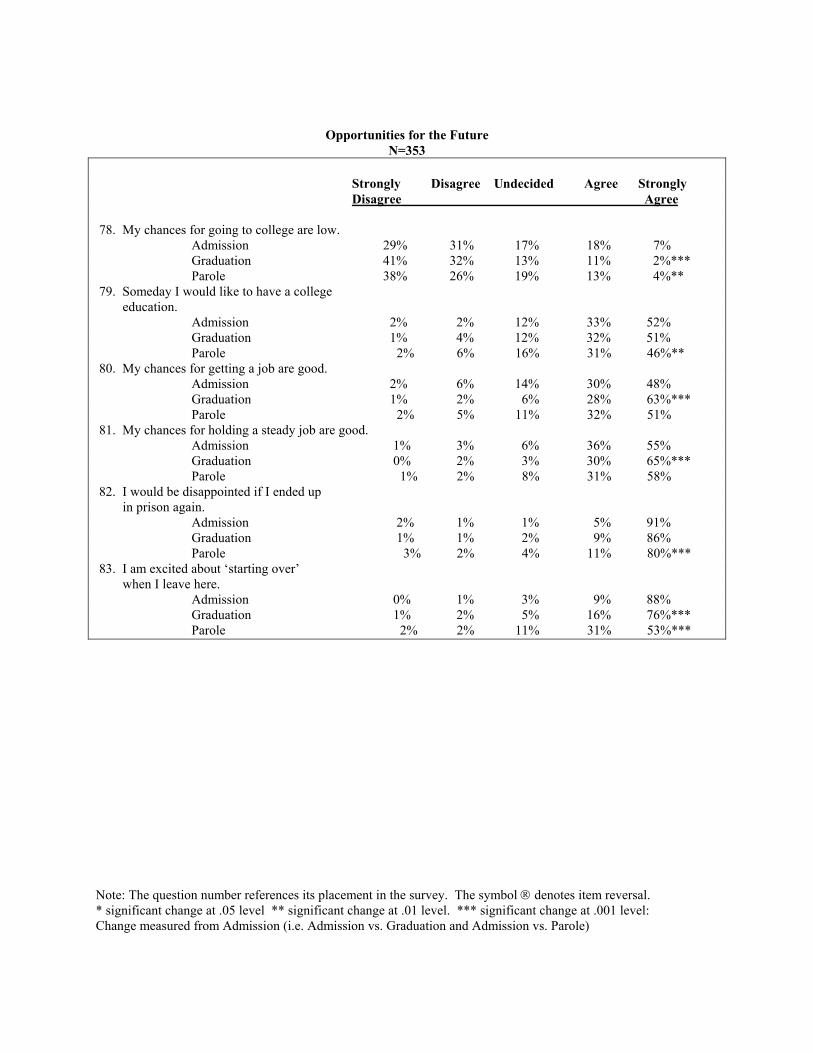
Opportunities for the Future N=353
Strongly Disagree Undecided Agree Strongly Disagree Agree 78. My chances for going to college are low. Admission 29% 31% 17% 18% 7% Graduation 41% 32% 13% 11% 2%*** Parole 38% 26% 19% 13% 4%** 79. Someday I would like to have a college education. Admission 2% 2% 12% 33% 52% Graduation 1% 4% 12% 32% 51% Parole 2% 6% 16% 31% 46%** 80. My chances for getting a job are good. Admission 2% 6% 14% 30% 48% Graduation 1% 2% 6% 28% 63%*** Parole 2% 5% 11% 32% 51% 81. My chances for holding a steady job are good. Admission 1% 3% 6% 36% 55% Graduation 0% 2% 3% 30% 65%*** Parole 1% 2% 8% 31% 58% 82. I would be disappointed if I ended up in prison again. Admission 2% 1% 1% 5% 91% Graduation 1% 1% 2% 9% 86% Parole 3% 2% 4% 11% 80%*** 83. I am excited about �‘starting over�’ when I leave here. Admission 0% 1% 3% 9% 88% Graduation 1% 2% 5% 16% 76%*** Parole 2% 2% 11% 31% 53%*** Note: The question number references its placement in the survey. The symbol denotes item reversal. * significant change at .05 level ** significant change at .01 level. *** significant change at .001 level: Change measured from Admission (i.e. Admission vs. Graduation and Admission vs. Parole)
The Pennsylvania Commission on Sentencing P.O. Box 1200
State College, PA 16804-1200 Phone: 814-863-2797
Fax: 814-863-2129 http://pcs.la.psu.edu/
The Pennsylvania Commission on Sentencing is an agency of the General Assembly located on the University Park campus of the Pennsylvania State University. The Commission was created in 1978 for the primary purpose of creating a consistent and rational statewide sentencing policy to promote fairer and more uniform sentencing practices.