Optimizing Turning Process by Taguchi Method Under · PDF file1045 steel, Taguchi Method,...
6
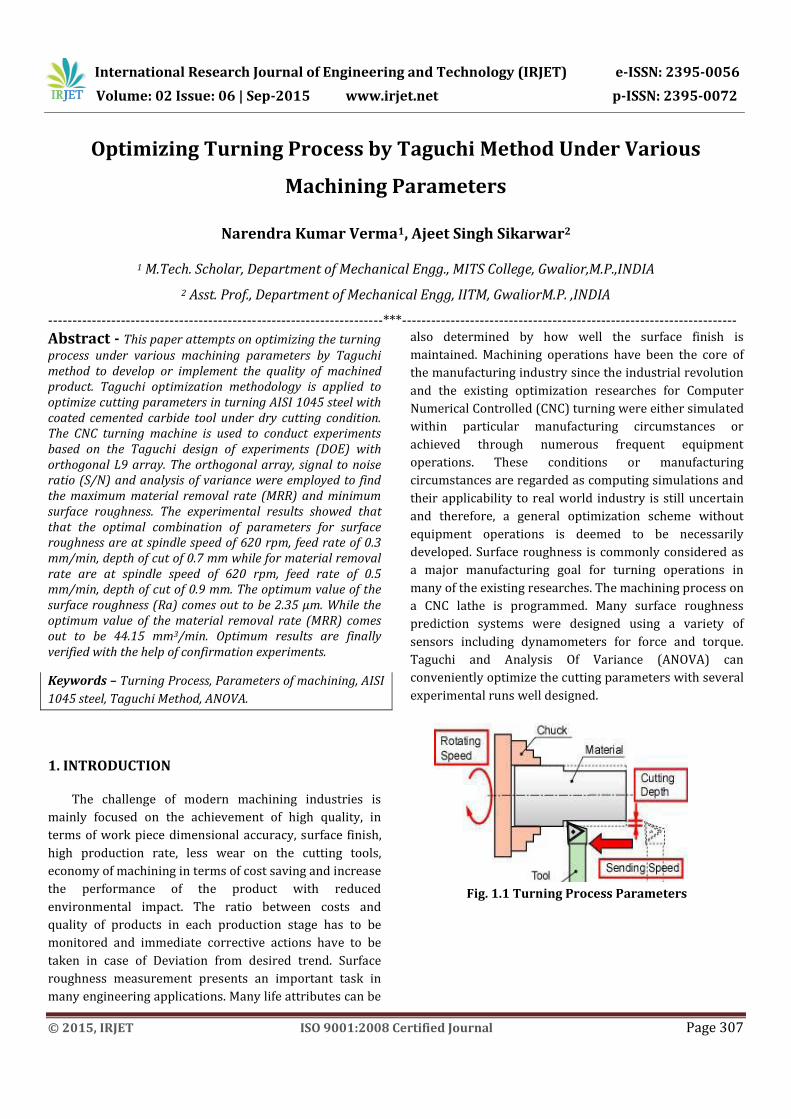
International Research Journal of Engineering and Technology (IRJET) e-ISSN: 2395-0056 Volume: 02 Issue: 06 | Sep-2015 www.irjet.net p-ISSN: 2395-0072 © 2015, IRJET ISO 9001:2008 Certified Journal Page 307 Optimizing Turning Process by Taguchi Method Under Various Machining Parameters Narendra Kumar Verma 1 , Ajeet Singh Sikarwar 2 1 M.Tech. Scholar, Department of Mechanical Engg., MITS College, Gwalior,M.P.,INDIA 2 Asst. Prof., Department of Mechanical Engg, IITM, GwaliorM.P. ,INDIA ---------------------------------------------------------------------***--------------------------------------------------------------------- Abstract - This paper attempts on optimizing the turning process under various machining parameters by Taguchi method to develop or implement the quality of machined product. Taguchi optimization methodology is applied to optimize cutting parameters in turning AISI 1045 steel with coated cemented carbide tool under dry cutting condition. The CNC turning machine is used to conduct experiments based on the Taguchi design of experiments (DOE) with orthogonal L9 array. The orthogonal array, signal to noise ratio (S/N) and analysis of variance were employed to find the maximum material removal rate (MRR) and minimum surface roughness. The experimental results showed that that the optimal combination of parameters for surface roughness are at spindle speed of 620 rpm, feed rate of 0.3 mm/min, depth of cut of 0.7 mm while for material removal rate are at spindle speed of 620 rpm, feed rate of 0.5 mm/min, depth of cut of 0.9 mm. The optimum value of the surface roughness (Ra) comes out to be 2.35 μm. While the optimum value of the material removal rate (MRR) comes out to be 44.15 mm 3 /min. Optimum results are finally verified with the help of confirmation experiments. Keywords – Turning Process, Parameters of machining, AISI 1045 steel, Taguchi Method, ANOVA. 1. INTRODUCTION The challenge of modern machining industries is mainly focused on the achievement of high quality, in terms of work piece dimensional accuracy, surface finish, high production rate, less wear on the cutting tools, economy of machining in terms of cost saving and increase the performance of the product with reduced environmental impact. The ratio between costs and quality of products in each production stage has to be monitored and immediate corrective actions have to be taken in case of Deviation from desired trend. Surface roughness measurement presents an important task in many engineering applications. Many life attributes can be also determined by how well the surface finish is maintained. Machining operations have been the core of the manufacturing industry since the industrial revolution and the existing optimization researches for Computer Numerical Controlled (CNC) turning were either simulated within particular manufacturing circumstances or achieved through numerous frequent equipment operations. These conditions or manufacturing circumstances are regarded as computing simulations and their applicability to real world industry is still uncertain and therefore, a general optimization scheme without equipment operations is deemed to be necessarily developed. Surface roughness is commonly considered as a major manufacturing goal for turning operations in many of the existing researches. The machining process on a CNC lathe is programmed. Many surface roughness prediction systems were designed using a variety of sensors including dynamometers for force and torque. Taguchi and Analysis Of Variance (ANOVA) can conveniently optimize the cutting parameters with several experimental runs well designed. Fig. 1.1 Turning Process Parameters
Transcript of Optimizing Turning Process by Taguchi Method Under · PDF file1045 steel, Taguchi Method,...
International Research Journal of Engineering and Technology (IRJET) e-ISSN: 2395-0056
Volume: 02 Issue: 06 | Sep-2015 www.irjet.net p-ISSN: 2395-0072
© 2015, IRJET ISO 9001:2008 Certified Journal Page 307
Optimizing Turning Process by Taguchi Method Under Various
Machining Parameters
Narendra Kumar Verma1, Ajeet Singh Sikarwar2
1 M.Tech. Scholar, Department of Mechanical Engg., MITS College, Gwalior,M.P.,INDIA
2 Asst. Prof., Department of Mechanical Engg, IITM, GwaliorM.P. ,INDIA
---------------------------------------------------------------------***---------------------------------------------------------------------
Abstract - This paper attempts on optimizing the turning process under various machining parameters by Taguchi method to develop or implement the quality of machined product. Taguchi optimization methodology is applied to optimize cutting parameters in turning AISI 1045 steel with coated cemented carbide tool under dry cutting condition. The CNC turning machine is used to conduct experiments based on the Taguchi design of experiments (DOE) with orthogonal L9 array. The orthogonal array, signal to noise ratio (S/N) and analysis of variance were employed to find the maximum material removal rate (MRR) and minimum surface roughness. The experimental results showed that that the optimal combination of parameters for surface roughness are at spindle speed of 620 rpm, feed rate of 0.3 mm/min, depth of cut of 0.7 mm while for material removal rate are at spindle speed of 620 rpm, feed rate of 0.5 mm/min, depth of cut of 0.9 mm. The optimum value of the surface roughness (Ra) comes out to be 2.35 µm. While the optimum value of the material removal rate (MRR) comes out to be 44.15 mm3/min. Optimum results are finally verified with the help of confirmation experiments.
Keywords – Turning Process, Parameters of machining, AISI
1045 steel, Taguchi Method, ANOVA.
1. INTRODUCTION
The challenge of modern machining industries is
mainly focused on the achievement of high quality, in
terms of work piece dimensional accuracy, surface finish,
high production rate, less wear on the cutting tools,
economy of machining in terms of cost saving and increase
the performance of the product with reduced
environmental impact. The ratio between costs and
quality of products in each production stage has to be
monitored and immediate corrective actions have to be
taken in case of Deviation from desired trend. Surface
roughness measurement presents an important task in
many engineering applications. Many life attributes can be
also determined by how well the surface finish is
maintained. Machining operations have been the core of
the manufacturing industry since the industrial revolution
and the existing optimization researches for Computer
Numerical Controlled (CNC) turning were either simulated
within particular manufacturing circumstances or
achieved through numerous frequent equipment
operations. These conditions or manufacturing
circumstances are regarded as computing simulations and
their applicability to real world industry is still uncertain
and therefore, a general optimization scheme without
equipment operations is deemed to be necessarily
developed. Surface roughness is commonly considered as
a major manufacturing goal for turning operations in
many of the existing researches. The machining process on
a CNC lathe is programmed. Many surface roughness
prediction systems were designed using a variety of
sensors including dynamometers for force and torque.
Taguchi and Analysis Of Variance (ANOVA) can
conveniently optimize the cutting parameters with several
experimental runs well designed.
Fig. 1.1 Turning Process Parameters

International Research Journal of Engineering and Technology (IRJET) e-ISSN: 2395-0056
Volume: 02 Issue: 06 | Sep-2015 www.irjet.net p-ISSN: 2395-0072
© 2015, IRJET ISO 9001:2008 Certified Journal Page 308
1.1 Taguchi Method Taguchi method is a powerful tool for the design of
high quality systems. It provides simple, efficient and
systematic approach to optimize designs for
performance, quality and cost. Taguchi method is
efficient method for designing process that operates
consistently and optimally over a variety of
conditions[2].
Steps of Taguchi method are as follows:
(1) Identification of main function, side effects and
failure mode.
(2) Identification of noise factor, testing condition and
quality characteristics.
(3) Identification of the main function to be optimized.
(4) Identification the control factor and their levels.
(5) Selection of orthogonal array and matrix
experiment.
(6) Conducting the matrix experiment.
(7) Analyzing the data, prediction of the optimum
level and performance.
(8) Performing the verification experiment and
planning the future action. [4]
1.2 Analysis of variance (ANOVA)
Since there are a large number of variables controlling
the process, some mathematical models are required
to represent the process. However, these models are
to be developed using only the significant parameters
influencing the process rather than including all the
parameters. In order to achieve this, statistical
analysis of the experimental results will have to be
processed using the analysis of variance (ANOVA)[7].
ANOVA is a computational technique that enables the
estimation of the relative contributions of each of the
control factors to the overall measured response.
2. RESULTS AND ANALYSIS
2.1 Data Collection
MS bars (of diameter 50 mm and length 100 mm) required
for conducting the experiment have been prepared first.
Nine numbers of samples of same material and same
dimensions have been made. Then, using different levels
of the process parameters nine specimens have been
turned in CNC lathe accordingly. After machining, surface
roughness measured precisely with the help of a portable
stylus-type profilometer, Talysurf (Taylor Hobson,
Surtronic 3+, UK).
The results of the experiments have been shown in Table.
Analysis has been made based on experimental data in the
following chapter. Optimization of surface roughness and
material removal rate has been made by Taguchi.
Confirmatory tests have also been conducted finally to
validate optimal results. Experimental Data Related to
Surface Roughness Characteristics
Table No. 1
2.2 Surface Roughness Measurement
The surface roughness test was done by using Mitutoyo
surface roughness tester ‘Surftest SJ 201’ was used. The
probe was adjusted to measure the Ra value. The probe
was moved a distance of 3mm.
2.3 Material Removal Rate Measurement
Material removal rate is used to determine the amount of
material removed per second. It is given by the formula
MRR = 1000 V f d
Where V = Cutting speed (m/min)
Experi
ment
no.
Spindle speed (rpm),
N
Feed rate
(mm/rev), f
Depth of cut (mm),
d
Surface roughness, Ra (µm)
S/N ratio of surfaces
roughness
1 160 0.3 0.7 2.24 -7
2 160 0.4 0.8 5.67 -15.07
3 160 0.5 0.9 5.93 -15.46
4 320 0.3 0.8 5.34 -14.55
5 320 0.4 0.9 4.87 -13.75
6 320 0.5 0.7 6.07 -15.66
7 620 0.3 0.9 2.91 -9.27
8 620 0.4 0.7 3.78 -11.54
9 620 0.5 0.8 5.05 -14.06

International Research Journal of Engineering and Technology (IRJET) e-ISSN: 2395-0056
Volume: 02 Issue: 06 | Sep-2015 www.irjet.net p-ISSN: 2395-0072
© 2015, IRJET ISO 9001:2008 Certified Journal Page 309
f = feed rate (mm/rev)
d= depth of cut (mm)
MRR= Material removal rate (mm3/ min)
As the conditions for feed, cutting velocity and depth of cut
are fixed so this formula is used to calculate the MRR
instead of calculating the initial and the final weight, the
above formula was used to calculate the MRR.
2.4 Calculations Of S/N Ratios For Surface
Roughness Of Table No. 1
Calculation for Table 1.
1. S/N Ratio (Experiment 1) = η1= -10log [1/n (∑ Yi2)] =-10
log [1/ (2.24)2] = -7
2. S/N Ratio (Experiment t 2) = η2= -10 log [(5.67)2] = -
15.07
3. S/N Ratio (Experiment 3) = η3= -10 log [(5.93)2] = -
15.46
4. S/N Ratio (Experiment 4) = η4= -10 log [(5.34)2] = -
14.55
5. S/N Ratio (Experiment 5) =η5 = -10 log [(4.87)2] = -
13.75
6. S/N Ratio (Experiment 6) = η6= -10 log [(6.07)2] = -
15.66
7. S/N Ratio (Experiment 7) = η7= -10 log [(2.91)2] = -9.27
8. S/N Ratio (Experiment 8) = η8= -10 log [(3.78)2] = -
11.54
9. S/N Ratio (Experiment 9) = η9= -10 log [(5.05)2] = -
14.06
2.5 Calculations Of S/N Ratios For Material
Removal Rate Of Table
Calculation for Table 2
1. S/N Ratio (Experiment 1) = η1= -10log [1/n (∑ 1/Yi2)] =-
10 log [1/(5.27)2] = 14.43
2. S/N Ratio (Experiment t 2) = η2= -10 log [1/ (8.03)2] =
18.09
3. S/N Ratio (Experiment 3) = η3= -10 log [1/ (11.3)2] =
21.06
4. S/N Ratio (Experiment 4) = η4= -10 log [1/ (12.19)2] =
21.79
5. S/N Ratio (Experiment 5) =η5 = -10 log [1/ (18.28)2] =
25.23
6. S/N Ratio (Experiment 6) = η6= -10 log [1/ (17.78)2] =
24.99
7. S/N Ratio (Experiment 7) = η7= -10 log [1/ (26.28)2] =
28.39
8. S/N Ratio (Experiment 8) = η8= -10 log [1/ (27.25)2] =
28.70
9. S/N Ratio (Experiment 9) = η9= -10 log [1/ (38.93)2] =
31.80
Measurement of Material Removal Rate (MRR) Experime
nt no.
Spindle speed
(rpm), N
Feed rate
(mm/rev), f
Depth of cut (mm),
A
MRR (mm3/min)
S/N ratio of
MRR
1 160 0.3 0.7 5.27 14.43 2 160 0.4 0.8 8.03 18.09
3 160 0.5 0.9 11.30 21.06 4 320 0.3 0.8 12.19 21.79
5 320 0.4 0.9 18.28 25.23 6 320 0.5 0.7 17.78 24.99
7 620 0.3 0.9 26.28 28.39 8 620 0.4 0.7 27.25 28.70
9 620 0.5 0.8 38.93 31.80
Table No. 2
2.6 Signal –To - Noise Ratio
Parameters that affect the output can be divided in
two parts: controllable (or design) factors and
uncontrollable (or noise) factors. The value of controllable
factors can be adjusted by the designer but the value of
uncontrollable factors cannot be changed because they are
the sources for variation because of operational
environment. The best setting of control factors as they
influence the output is determined by performing
experiments. Smaller-the-Better is used for surface
roughness and Bigger-the-Better is used for material
removal rate because we minimize the surface roughness
and maximize the material removal rate.

International Research Journal of Engineering and Technology (IRJET) e-ISSN: 2395-0056
Volume: 02 Issue: 06 | Sep-2015 www.irjet.net p-ISSN: 2395-0072
© 2015, IRJET ISO 9001:2008 Certified Journal Page 310
2.7 Measurement Off-Value Of Fisher’s F Ratio
The F values determine the significance of the
parameters. Larger the F value, the greater the effect on
the performance characteristic due to the change in that
process parameter, F value is defined as:
F=
2.6 Anova For Surface Roughness
Results obtained for the surface roughness are shown in the
Table 1. The results for surface roughness were obtained
from the 9 experiments performed of Taguchi. The
experimental results analyzed with ANOVA are shown in the
Table 3. The F value calculated through MINITAB 15
software is shown in the second last column of ANOVA
table which suggests the significance of the factors on the
desired characteristics. Larger is the F value higher is the
significance (considering confidence level of 95%). The
results show that only feed is the most significant factor.
Table No. 3: Analysis of Variance for Means of
Surface Roughness (Ra)
Source DF Seq
SS
Adj SS Adj MS F P
Spindle
speed
(rpm), N
2 3.44
17
3.4417 1.7208 2.11 0.322
Feed rate
(mm/rev), f
2 7.23
95
7.2395 3.6197 4.43 0.184
Depth of
cut (mm), d
2 2.65
64
2.6564 1.3282 1.63 0.381
Error 2 1.63
47
1.6347 0.8173
Total 8 14.9
723
S = 0.904071 R-Sq = 89.08 % R-Sq (adj) = 56.33%
2.7 Main Effect Plots For Surface Roughness
Main effect plots for surface roughness are shown in the
figure2.1. Main effect plot shows the variation of surface
roughness with respect to Spindle speed, feed rate and
depth of cut. X axis represents change in level of the
variable and y axis represents the change in the resultant
response.
Figure 2.1: Main effects plot for means for surface roughness
620320160
5.5
5.0
4.5
4.0
3.5
0.50.40.3
0.90.80.7
5.5
5.0
4.5
4.0
3.5
Spindle speed (rpm), N
Me
an
of
Me
an
s
Feed rate (mm/rev), f
Depth of cut (mm), a
Main Effects Plot for MeansData Means
Figure 2.1: Main effects plot for S/N ratios for surface
roughness
620320160
-13
-14
-15
-16
0.50.40.3
0.90.80.7
-13
-14
-15
-16
Spindle speed (rpm), N
Me
an
of
SN
ra
tio
s
Feed rate (mm/rev), f
Depth of cut (mm), a
Main Effects Plot for SN ratiosData Means
Signal-to-noise: Smaller is better
Figure 2.2
2.8 Anova For Material Removal Rate (MRR)
Results obtained for the material removal rate (mrr) are
shown in the Table 2. The results for material removal rate
(mrr) were obtained from the 9 experiments performed
of Taguchi. The experimental results analyzed with ANOVA
are shown in the Table 3. The F value calculated through
MINITAB software is shown in the second last column of
ANOVA table which suggests the significance of the factors
on the desired characteristics. Larger is the F value higher
is the significance (considering confidence level of 95%).
International Research Journal of Engineering and Technology (IRJET) e-ISSN: 2395-0056
Volume: 02 Issue: 06 | Sep-2015 www.irjet.net p-ISSN: 2395-0072
© 2015, IRJET ISO 9001:2008 Certified Journal Page 311
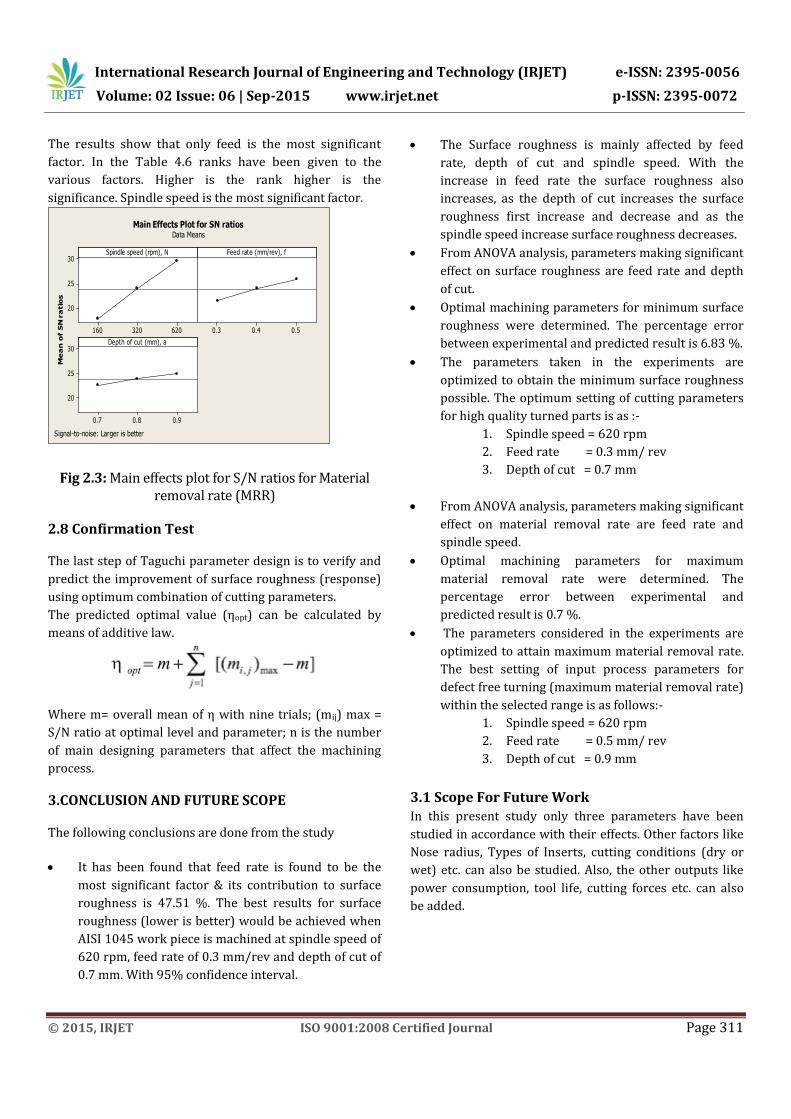
The results show that only feed is the most significant
factor. In the Table 4.6 ranks have been given to the
various factors. Higher is the rank higher is the
significance. Spindle speed is the most significant factor.
620320160
30
25
20
0.50.40.3
0.90.80.7
30
25
20
Spindle speed (rpm), N
Me
an
of
SN
ra
tio
s
Feed rate (mm/rev), f
Depth of cut (mm), a
Main Effects Plot for SN ratiosData Means
Signal-to-noise: Larger is better
Fig 2.3: Main effects plot for S/N ratios for Material removal rate (MRR)
2.8 Confirmation Test
The last step of Taguchi parameter design is to verify and
predict the improvement of surface roughness (response)
using optimum combination of cutting parameters.
The predicted optimal value (ηopt) can be calculated by
means of additive law.
Where m= overall mean of η with nine trials; (mij) max =
S/N ratio at optimal level and parameter; n is the number
of main designing parameters that affect the machining
process.
3.CONCLUSION AND FUTURE SCOPE
The following conclusions are done from the study
It has been found that feed rate is found to be the
most significant factor & its contribution to surface
roughness is 47.51 %. The best results for surface
roughness (lower is better) would be achieved when
AISI 1045 work piece is machined at spindle speed of
620 rpm, feed rate of 0.3 mm/rev and depth of cut of
0.7 mm. With 95% confidence interval.
The Surface roughness is mainly affected by feed
rate, depth of cut and spindle speed. With the
increase in feed rate the surface roughness also
increases, as the depth of cut increases the surface
roughness first increase and decrease and as the
spindle speed increase surface roughness decreases.
From ANOVA analysis, parameters making significant
effect on surface roughness are feed rate and depth
of cut.
Optimal machining parameters for minimum surface
roughness were determined. The percentage error
between experimental and predicted result is 6.83 %.
The parameters taken in the experiments are
optimized to obtain the minimum surface roughness
possible. The optimum setting of cutting parameters
for high quality turned parts is as :-
1. Spindle speed = 620 rpm
2. Feed rate = 0.3 mm/ rev
3. Depth of cut = 0.7 mm
From ANOVA analysis, parameters making significant
effect on material removal rate are feed rate and
spindle speed.
Optimal machining parameters for maximum
material removal rate were determined. The
percentage error between experimental and
predicted result is 0.7 %.
The parameters considered in the experiments are
optimized to attain maximum material removal rate.
The best setting of input process parameters for
defect free turning (maximum material removal rate)
within the selected range is as follows:-
1. Spindle speed = 620 rpm
2. Feed rate = 0.5 mm/ rev
3. Depth of cut = 0.9 mm
3.1 Scope For Future Work In this present study only three parameters have been
studied in accordance with their effects. Other factors like
Nose radius, Types of Inserts, cutting conditions (dry or
wet) etc. can also be studied. Also, the other outputs like
power consumption, tool life, cutting forces etc. can also
be added.

International Research Journal of Engineering and Technology (IRJET) e-ISSN: 2395-0056
Volume: 02 Issue: 06 | Sep-2015 www.irjet.net p-ISSN: 2395-0072
© 2015, IRJET ISO 9001:2008 Certified Journal Page 312
REFERENCES
[1] Quazi T Z, Pratik More, Vipul sonawane, A Case Study
of Taguchi Method in the Optimization of Turning
Parameters, International Journal of Emerging Technology
and Advanced Engineering, ISSN 2250-2459, Volume 3,
Issue 2, February 2013, pp. 616-626.
[2] T. Sreenivasa Murthy, R.K.Suresh, G. Krishnaiah, V.
Diwakar Reddy, Optimization Of Process Parameters In
Dry Turning Operation Of EN 41B Alloy Steels With
Cermet Tool Based On The Taguchi Method, International
Journal of Engineering Research and Applications (IJERA)
ISSN: 2248-9622, Vol. 3, Issue 2, March -April 2013,
pp.1144-1148.
[3] Sodhi Singh Harsimran, Singh Harjot, Parametric
Analysis of Copper for Cutting Processes Using Turning
Operations Based on Taguchi Method, International
Journal of research In Mechanical engineerIng &
technology, ISSN : 2249-5762, Vol. 3, Issue 2, May – Oct.
2013,pp. 202-204.
[4] Verma Jitendra, Agrawal Pankaj, Bajpai Lokesh,
Turning Parameter Optimization For Surface Roughness
Of Astm A242 Type-1 Alloys Steel By Taguchi Method,
International Journal of Advances in Engineering &
Technology, ISSN: 2231-1963 March 2012, Vol. 3, Issue 1,
pp. 255-261.
[5] Rama Rao. S, Padmanabhan. G ,” Application of Taguchi
methods and ANOVA in optimization of process
parameters for metal removal rate in electrochemical
machining of Al/5%SiC composites ,” International Journal
of Engineering Research and Applications (IJERA) ISSN:
2248-9622 www.ijera.com Vol. 2, Issue 3, May-Jun 2012,
pp. 192-197
[6] Krishankant, Taneja Jatin, Bector Mohit, Kumar Rajesh,
Application of Taguchi Method for Optimizing Turning
Process by the effects of Machining Parameters,
International Journal of Engineering and Advanced
Technology (IJEAT) ISSN: 2249 – 8958, Volume-2, Issue-1,
October 2012, pp. 263-274
[7] Davis Rahul, Madhukar Singh Jitendra, Rana Singh
Vikash, Singh Prince, Optimization of Cutting Parameters
in Dry Turning Operation of EN24 Steel, International
Journal of Emerging Technology and Advanced
Engineering, ISSN 2250-2459, Volume 2, Issue 10, October
2012, pp. 559-563.
[8] E. Daniel Kirby, Optimizing the Turning Process
Toward an Ideal Surface Roughness Target, Journal of
Industrial Technology, Volume 26, Issue 1, March 2010.
[9] S. Thamizhmanii, S. Hasan, Analyses of roughness,
forces and wear in turning gray cast iron, Journal of
Achievements in Materials and Manufacturing
Engineering, Volume 17, Issue 1-2, July-August 2006, pp.
401-404.
[10] Mohan N.S., Ramachndra A., Kulkarni S.M. Influence
of Process Parameters on Cutting Force and Torque
During Drilling of Glass Fiber Polyester reinforced
Composites, Journal of Composite Structures, Volume 71,
Issue 3-4, December 2005, pp. 407–413.
[11] E. Daniel Kirby, Zhe Zhang, joseph C. Chen, Jacob
Chen, Optimizing surface finish in a turning operation
using the Taguchi parameter design method, Int J Adv
Manuf Technol, Volume 30, 1021–1029, December 2005.
BIOGRAPHIES
Narendra Kumar Verma
M.Tech. (production) Scholar, MITS,
Gwalior
Ajeet Singh Sikarwar
Asst. Prof. (Mechanical Engg. Deptt.)
IITM,Gwalior
.