Application of Regression Analysis and Taguchi Method for...
11
I J C T A, 9(7), 2016, pp. 3181-3191 © International Science Press Application of Regression Analysis and Taguchi Method for Prognostication and Optimization of EDM Process P. Gopu*, M. Dev Anand** and R. Rajesh*** ABSTRACT Prognostication and optimization of Electrical Discharge Machining (EDM) process parameters is an important achievement for almost all of the modern manufacturing industries to obtain a quality of the product. This paper utilizes Regression Analysis method to predicting the process parameters and Taguchi method to optimize the process parameters for Material Removal Rate (MRR)and Surface Roughness (SR) of the EDM process. The composite material used to conduct the experiment is Aluminium LM 25 and 10% SiC.There are six machining parameters like Discharge voltage, Discharge current, Pulse-ON time, Pulse-OFF time, Gap between the tool and work piece and Oil pressure is used for getting the output parameter Material removal rate and Surface finish. Based on this research a result found for Regression analysis is 0.442 mg/sec average error for material removal rate and 0.6434 µm average error for surface roughness when compared with the experimental result and the optimum values of the Taguchi method in case of Material Removal Rate is, Discharge voltage 75 V, Discharge current 15 A, Pulse-ON time 45 sec, Pulse-OFF time 9 sec, Gap between the tool and work piece 0.2 mm and Oil pressure 2 Kg/cm² and for Surface Roughness is Discharge voltage 65 V, Discharge current 5 A, Pulse-ON time 15 sec, Pulse-OFF time 7 sec, Gap between the tool and work piece 0.3 mm and Oil pressure 1.5 Kg/cm². Keywords: Electrical Discharge Machining, Regression Analysis, Taguchi Method, Material Removal Rate, Surface Roughness. 1. INTRODUCTION In order to machining difficult to machine hard conductive materials and high strength alloys to procure very high accuracy, Electrical Discharge Machining occupies an indispensable role in industries. Electrical Discharge Machining is one of the unconventional machining process in which the material is removed from the work piece in the form of erosion, where the high temperature electric spark discharge is produced by the electrical energy is used for erosion of the material to get the required shape. From the literature survey, Jong Hyuk Jung and Won Tae Kwon, [1] develop a Taguchi method for found out the relation between the process parameters and process characteristics of EDM process and they consider input voltage, capacitance, resistance, feed rate and spindle speed as input parameters.Mohid.Junaid Mir, Khalid Sheikh, Balbir Singh and NavdeepMalhotra, [2] consider pulse time on, discharge current and concentration of aluminum powder added in to the dielectric fluid as input process parameters and investigate a parametric optimization of surface roughness study on the powder mixed EDM of H11 Steel. U. Esme, A. Sagbas and F. Kahraman, [3] has been consider pulse duration, open voltage, wire speed and dielectric flushing pressure for WEDM process parameters and using neural network and regression analysis for prediction of surface * Assistant Professor, Department of Mechanical Engineering Sandwich, Lord Jegannath College of Engineering and Technology, PSN Nagar, Ramanathichanputhur-629402, Tamilnadu, India, Email: [email protected] ** Professor and Deputy Director, Academic Affiars, Mechanical Engineering Department, Noorul Islam University, Kumaracoil-629180, Tamilnadu, India. *** Assistant Professor, Department of Mechanical Engineering, Mechanical Engineering Department, Noorul Islam University, Kumaracoil-629180, Tamilnadu, India. ISSN: 0974-5572
Transcript of Application of Regression Analysis and Taguchi Method for...
I J C T A, 9(7), 2016, pp. 3181-3191© International Science Press
Application of Regression Analysis andTaguchi Method for Prognostication andOptimization of EDM ProcessP. Gopu*, M. Dev Anand** and R. Rajesh***
ABSTRACT
Prognostication and optimization of Electrical Discharge Machining (EDM) process parameters is an importantachievement for almost all of the modern manufacturing industries to obtain a quality of the product. This paperutilizes Regression Analysis method to predicting the process parameters and Taguchi method to optimize theprocess parameters for Material Removal Rate (MRR)and Surface Roughness (SR) of the EDM process. Thecomposite material used to conduct the experiment is Aluminium LM 25 and 10% SiC.There are six machiningparameters like Discharge voltage, Discharge current, Pulse-ON time, Pulse-OFF time, Gap between the tool andwork piece and Oil pressure is used for getting the output parameter Material removal rate and Surface finish.Based on this research a result found for Regression analysis is 0.442 mg/sec average error for material removalrate and 0.6434 µm average error for surface roughness when compared with the experimental result and theoptimum values of the Taguchi method in case of Material Removal Rate is, Discharge voltage 75 V, Dischargecurrent 15 A, Pulse-ON time 45 sec, Pulse-OFF time 9 sec, Gap between the tool and work piece 0.2 mm and Oilpressure 2 Kg/cm² and for Surface Roughness is Discharge voltage 65 V, Discharge current 5 A, Pulse-ON time 15sec, Pulse-OFF time 7 sec, Gap between the tool and work piece 0.3 mm and Oil pressure 1.5 Kg/cm².
Keywords: Electrical Discharge Machining, Regression Analysis, Taguchi Method, Material Removal Rate, SurfaceRoughness.
1. INTRODUCTION
In order to machining difficult to machine hard conductive materials and high strength alloys to procurevery high accuracy, Electrical Discharge Machining occupies an indispensable role in industries. ElectricalDischarge Machining is one of the unconventional machining process in which the material is removedfrom the work piece in the form of erosion, where the high temperature electric spark discharge is producedby the electrical energy is used for erosion of the material to get the required shape. From the literaturesurvey, Jong Hyuk Jung and Won Tae Kwon, [1] develop a Taguchi method for found out the relationbetween the process parameters and process characteristics of EDM process and they consider input voltage,capacitance, resistance, feed rate and spindle speed as input parameters.Mohid.Junaid Mir, Khalid Sheikh,Balbir Singh and NavdeepMalhotra, [2] consider pulse time on, discharge current and concentration ofaluminum powder added in to the dielectric fluid as input process parameters and investigate a parametricoptimization of surface roughness study on the powder mixed EDM of H11 Steel. U. Esme, A. Sagbas andF. Kahraman, [3] has been consider pulse duration, open voltage, wire speed and dielectric flushing pressurefor WEDM process parameters and using neural network and regression analysis for prediction of surface
* Assistant Professor, Department of Mechanical Engineering Sandwich, Lord Jegannath College of Engineering and Technology,PSN Nagar, Ramanathichanputhur-629402, Tamilnadu, India, Email: [email protected]
** Professor and Deputy Director, Academic Affiars, Mechanical Engineering Department, Noorul Islam University, Kumaracoil-629180,Tamilnadu, India.
*** Assistant Professor, Department of Mechanical Engineering, Mechanical Engineering Department, Noorul Islam University,Kumaracoil-629180, Tamilnadu, India.
ISSN: 0974-5572
3182 P. Gopu , M. Dev Anand and R. Rajesh
roughness.Krishankant, Jatin Taneja, Mohit Bector, Rajesh Kumar, [4] optimizing the material removalrate in turning process by using Taguchi method. Rama Rao.S, Padmanabhan. G., [5] optimizing the processparameters for matel removal rate using Taguchi method, Signal to Noise ratio, Analysis of Variance andRegression Analysis.Chandramouli S., ShrinivasBalraj U and Eswaraiah K., [6] optimizing the EDMparameters Material Removal Rate, Tool Wear Rate and Surface Roughness using Taguchi method andANOVA with the consideration of current, pulse on time, pulse off time.KompanChomsamutr,SomkiatJongprasitpom, [7] has been optimizing the turning opearation by Taguchi method and ResponseSurface Methodology. In this paper both the method producing almost close values.Vishal Parashar, A.Rehman, J.L. Bhagoria, Y.M. Puri, [8] consider gap voltage, pulse ON time, pulse OFF time, wire feed anddielectric flushing pressure as input parameters for statistical and regression analysis of material removalrate of WEDM.Singaram Lakshmanan, Prakash Chinnakutti, Mahesh Kumar Namballa, [9] has been utilizingpulse on time, pulse off time, pulse current and voltage as input parameters for optimizing the process ofsurface roughness of EDM by Response Surface Methodology.Md. AshikurRahman Khan, M.M. Rahman,K. Kadirgama, M.A. Maleque and M. Ishak, [10] the effect of the peak ampere, pulse on time and pulse offtime on surface roughness of the EDM process has been investigated and optimize using RSM. Based onthe deep literature survey the ultimate aim of this paper is to conduct an experiment in Electrical DischargeMachining operation with increasing the input process parameters up to six numbers and develop a modelfor Prognostication and Optimization of EDM process for Material Removal Rate and Surface Roughnessusing Regression Analysis and Taguchi Method.
2. EXPERIMENTAL DETAILS
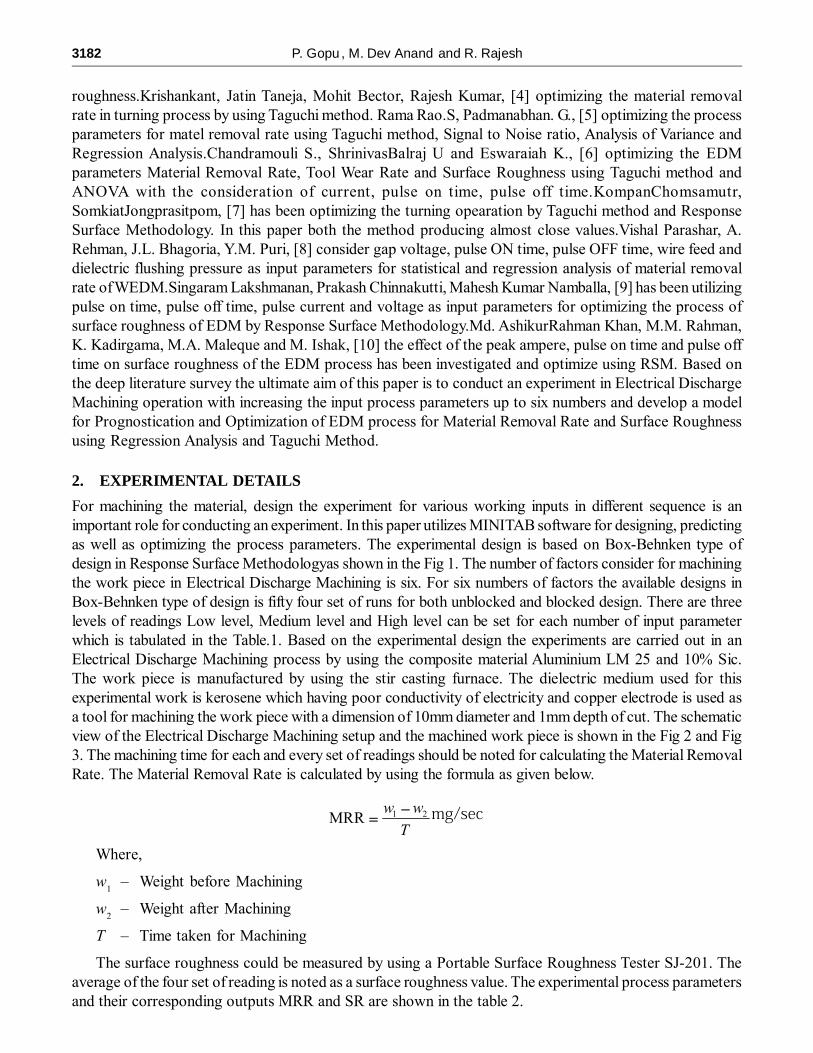
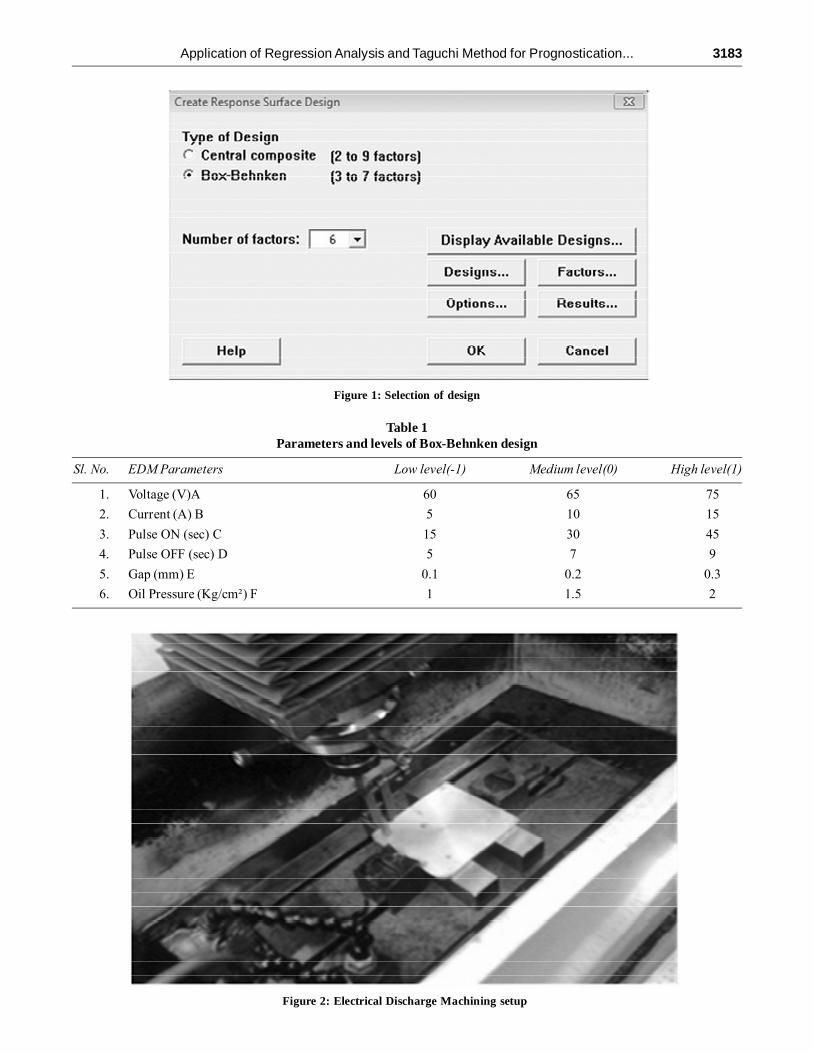
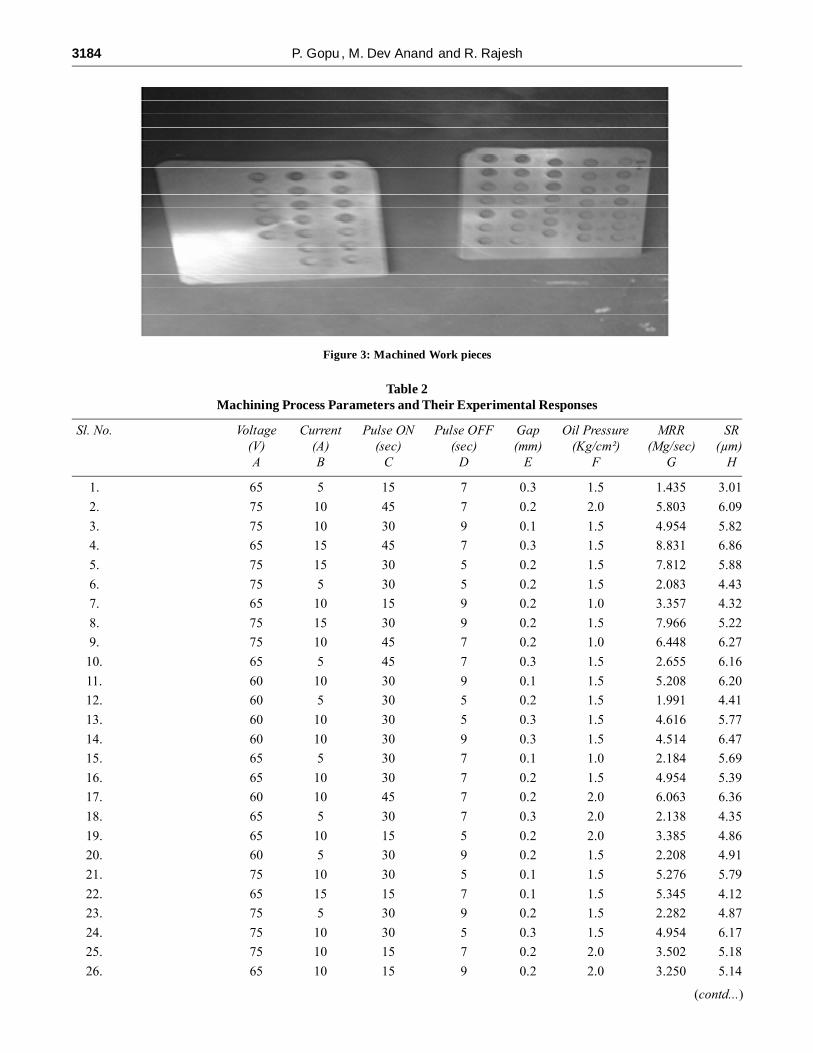
For machining the material, design the experiment for various working inputs in different sequence is animportant role for conducting an experiment. In this paper utilizes MINITAB software for designing, predictingas well as optimizing the process parameters. The experimental design is based on Box-Behnken type ofdesign in Response Surface Methodologyas shown in the Fig 1. The number of factors consider for machiningthe work piece in Electrical Discharge Machining is six. For six numbers of factors the available designs inBox-Behnken type of design is fifty four set of runs for both unblocked and blocked design. There are threelevels of readings Low level, Medium level and High level can be set for each number of input parameterwhich is tabulated in the Table.1. Based on the experimental design the experiments are carried out in anElectrical Discharge Machining process by using the composite material Aluminium LM 25 and 10% Sic.The work piece is manufactured by using the stir casting furnace. The dielectric medium used for thisexperimental work is kerosene which having poor conductivity of electricity and copper electrode is used asa tool for machining the work piece with a dimension of 10mm diameter and 1mm depth of cut. The schematicview of the Electrical Discharge Machining setup and the machined work piece is shown in the Fig 2 and Fig3. The machining time for each and every set of readings should be noted for calculating the Material RemovalRate. The Material Removal Rate is calculated by using the formula as given below.
1 2MRRw w
T
� � � � � �
Where,
w1
– Weight before Machining
w2
– Weight after Machining
T – Time taken for Machining
The surface roughness could be measured by using a Portable Surface Roughness Tester SJ-201. Theaverage of the four set of reading is noted as a surface roughness value. The experimental process parametersand their corresponding outputs MRR and SR are shown in the table 2.
Application of Regression Analysis and Taguchi Method for Prognostication... 3183
Figure 1: Selection of design
Table 1Parameters and levels of Box-Behnken design
Sl. No. EDM Parameters Low level(-1) Medium level(0) High level(1)
1. Voltage (V)A 60 65 75
2. Current (A) B 5 10 15
3. Pulse ON (sec) C 15 30 45
4. Pulse OFF (sec) D 5 7 9
5. Gap (mm) E 0.1 0.2 0.3
6. Oil Pressure (Kg/cm²) F 1 1.5 2
Figure 2: Electrical Discharge Machining setup
3184 P. Gopu , M. Dev Anand and R. Rajesh
Figure 3: Machined Work pieces
Table 2Machining Process Parameters and Their Experimental Responses
Sl. No. Voltage Current Pulse ON Pulse OFF Gap Oil Pressure MRR SR(V) (A) (sec) (sec) (mm) (Kg/cm²) (Mg/sec) (µm)A B C D E F G H
1. 65 5 15 7 0.3 1.5 1.435 3.01
2. 75 10 45 7 0.2 2.0 5.803 6.09
3. 75 10 30 9 0.1 1.5 4.954 5.82
4. 65 15 45 7 0.3 1.5 8.831 6.86
5. 75 15 30 5 0.2 1.5 7.812 5.88
6. 75 5 30 5 0.2 1.5 2.083 4.43
7. 65 10 15 9 0.2 1.0 3.357 4.32
8. 75 15 30 9 0.2 1.5 7.966 5.22
9. 75 10 45 7 0.2 1.0 6.448 6.27
10. 65 5 45 7 0.3 1.5 2.655 6.16
11. 60 10 30 9 0.1 1.5 5.208 6.20
12. 60 5 30 5 0.2 1.5 1.991 4.41
13. 60 10 30 5 0.3 1.5 4.616 5.77
14. 60 10 30 9 0.3 1.5 4.514 6.47
15. 65 5 30 7 0.1 1.0 2.184 5.69
16. 65 10 30 7 0.2 1.5 4.954 5.39
17. 60 10 45 7 0.2 2.0 6.063 6.36
18. 65 5 30 7 0.3 2.0 2.138 4.35
19. 65 10 15 5 0.2 2.0 3.385 4.86
20. 60 5 30 9 0.2 1.5 2.208 4.91
21. 75 10 30 5 0.1 1.5 5.276 5.79
22. 65 15 15 7 0.1 1.5 5.345 4.12
23. 75 5 30 9 0.2 1.5 2.282 4.87
24. 75 10 30 5 0.3 1.5 4.954 6.17
25. 75 10 15 7 0.2 2.0 3.502 5.18
26. 65 10 15 9 0.2 2.0 3.250 5.14
(contd...)
Application of Regression Analysis and Taguchi Method for Prognostication... 3185
27. 65 5 30 7 0.1 2.0 2.149 5.09
28. 65 10 45 5 0.2 2.0 4.779 7.44
29. 65 5 30 7 0.3 1.0 1.907 4.30
30. 65 15 30 7 0.1 1.0 7.386 6.39
31. 65 15 30 7 0.3 2.0 7.523 6.33
32. 65 10 30 7 0.2 1.5 5.276 5.10
33. 65 10 45 9 0.2 1.0 6.348 5.60
34. 60 10 15 7 0.2 1.0 3.385 3.74
35. 65 10 45 9 0.2 2.0 6.348 5.60
36. 65 10 45 5 0.2 1.0 6.771 8.19
37. 65 5 15 7 0.1 1.5 1.685 4.20
38. 75 10 15 7 0.2 1.0 2.861 5.31
39. 65 15 30 7 0.1 2.0 6.659 8.12
40. 65 15 15 7 0.3 1.5 3.869 4.01
41. 65 10 30 7 0.2 1.5 4.616 6.82
42. 75 10 30 9 0.3 1.5 4.145 7.08
43. 65 10 30 7 0.2 1.5 4.514 6.49
44. 65 10 30 7 0.2 1.5 4.724 6.51
45. 65 15 45 7 0.1 1.5 9.448 7.77
46. 60 15 30 5 0.2 1.5 6.771 7.70
47. 60 10 45 7 0.2 1.0 5.489 7.98
48. 65 15 30 7 0.3 1.0 5.208 8.02
49. 60 15 30 9 0.2 1.5 6.448 7.31
50. 65 10 30 7 0.2 1.5 3.944 5.01
51. 65 10 15 5 0.2 1.0 2.745 4.91
52. 60 10 15 7 0.2 2.0 2.987 4.97
53. 65 5 45 7 0.1 1.5 2.041 5.28
54. 60 10 30 5 0.1 1.5 4.779 6.54
3. RESULTS AND DISCUSSIONS
3.1. Regression Analysis
For investigating and modeling the relationship between the experimental parameters and one or morepredictor’s regression analysis is used. MINITAB software having three types of estimation methods likeleast squares, partial least squares and logistic regression procedure. In this paper least square type estimationmethod is used to develop the regression equation. For getting the parameter estimates least square regressionminimizes the sum of squared errors. The regression equation for the output parameters Material RemovalRate and the Surface Roughness are given below.
MRR (G) = –4.35 + 0.0230 A + 0.488 B + 0.0923 C + 0.0222 D – 2.22 E + 0.041 F
SR (H) = +3.98 – 0.0187 A + 0.175 B + 0.0718 C - 0.0740 D – 1.03 E – 0.099 F
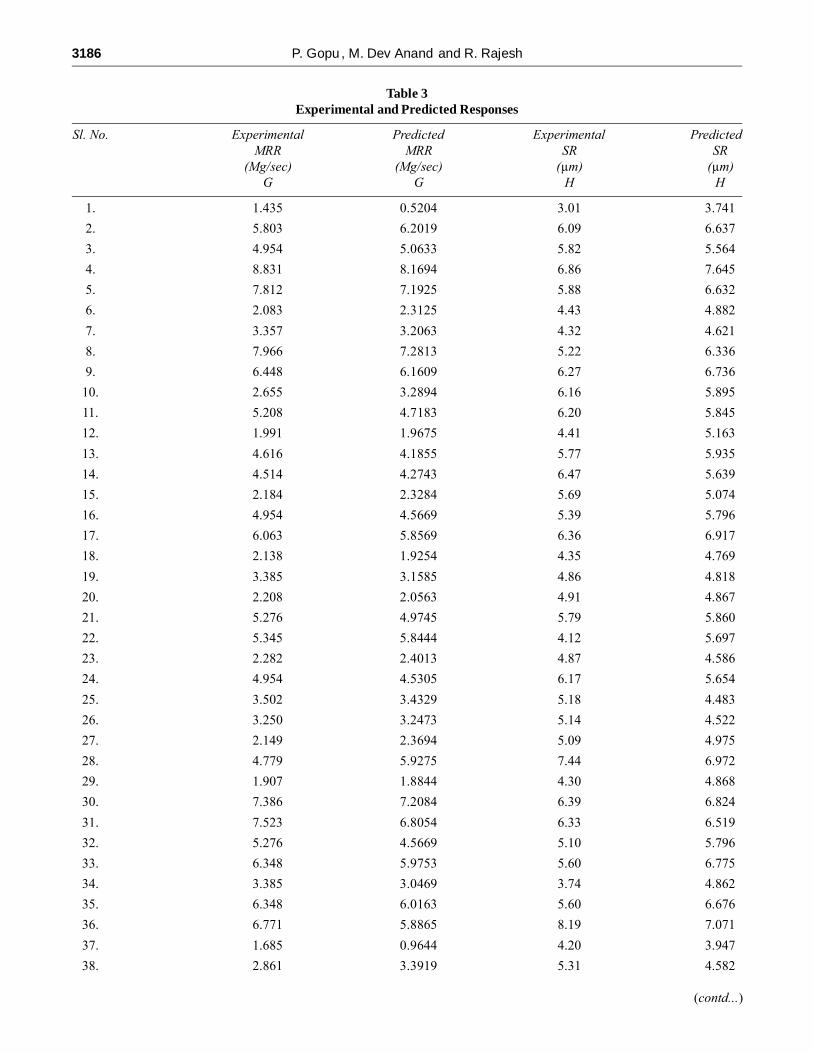
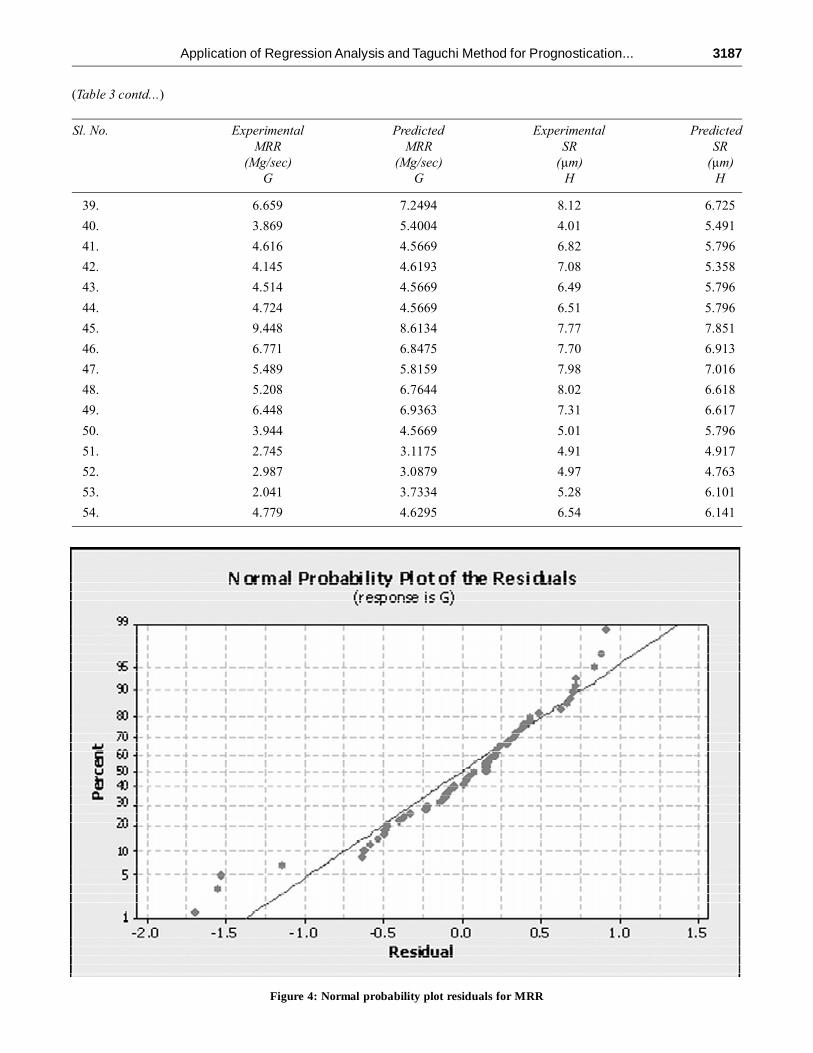
From the predicted results, the average error for predicted MRR is 0.442 mg/sec and the average errorfor the predicted SR is 0.6434 µm. The normal probability plot of the residuals for MRR and SR are shown
(Table 2 contd...)
Sl. No. Voltage Current Pulse ON Pulse OFF Gap Oil Pressure MRR SR(V) (A) (sec) (sec) (mm) (Kg/cm²) (Mg/sec) (µm)A B C D E F G H
3186 P. Gopu , M. Dev Anand and R. Rajesh
Table 3Experimental and Predicted Responses
Sl. No. Experimental Predicted Experimental PredictedMRR MRR SR SR
(Mg/sec) (Mg/sec) (µm) (µm)G G H H
1. 1.435 0.5204 3.01 3.741
2. 5.803 6.2019 6.09 6.637
3. 4.954 5.0633 5.82 5.564
4. 8.831 8.1694 6.86 7.645
5. 7.812 7.1925 5.88 6.632
6. 2.083 2.3125 4.43 4.882
7. 3.357 3.2063 4.32 4.621
8. 7.966 7.2813 5.22 6.336
9. 6.448 6.1609 6.27 6.736
10. 2.655 3.2894 6.16 5.895
11. 5.208 4.7183 6.20 5.845
12. 1.991 1.9675 4.41 5.163
13. 4.616 4.1855 5.77 5.935
14. 4.514 4.2743 6.47 5.639
15. 2.184 2.3284 5.69 5.074
16. 4.954 4.5669 5.39 5.796
17. 6.063 5.8569 6.36 6.917
18. 2.138 1.9254 4.35 4.769
19. 3.385 3.1585 4.86 4.818
20. 2.208 2.0563 4.91 4.867
21. 5.276 4.9745 5.79 5.860
22. 5.345 5.8444 4.12 5.697
23. 2.282 2.4013 4.87 4.586
24. 4.954 4.5305 6.17 5.654
25. 3.502 3.4329 5.18 4.483
26. 3.250 3.2473 5.14 4.522
27. 2.149 2.3694 5.09 4.975
28. 4.779 5.9275 7.44 6.972
29. 1.907 1.8844 4.30 4.868
30. 7.386 7.2084 6.39 6.824
31. 7.523 6.8054 6.33 6.519
32. 5.276 4.5669 5.10 5.796
33. 6.348 5.9753 5.60 6.775
34. 3.385 3.0469 3.74 4.862
35. 6.348 6.0163 5.60 6.676
36. 6.771 5.8865 8.19 7.071
37. 1.685 0.9644 4.20 3.947
38. 2.861 3.3919 5.31 4.582
(contd...)
Application of Regression Analysis and Taguchi Method for Prognostication... 3187
39. 6.659 7.2494 8.12 6.725
40. 3.869 5.4004 4.01 5.491
41. 4.616 4.5669 6.82 5.796
42. 4.145 4.6193 7.08 5.358
43. 4.514 4.5669 6.49 5.796
44. 4.724 4.5669 6.51 5.796
45. 9.448 8.6134 7.77 7.851
46. 6.771 6.8475 7.70 6.913
47. 5.489 5.8159 7.98 7.016
48. 5.208 6.7644 8.02 6.618
49. 6.448 6.9363 7.31 6.617
50. 3.944 4.5669 5.01 5.796
51. 2.745 3.1175 4.91 4.917
52. 2.987 3.0879 4.97 4.763
53. 2.041 3.7334 5.28 6.101
54. 4.779 4.6295 6.54 6.141
(Table 3 contd...)
Sl. No. Experimental Predicted Experimental PredictedMRR MRR SR SR
(Mg/sec) (Mg/sec) (µm) (µm)G G H H
Figure 4: Normal probability plot residuals for MRR
3188 P. Gopu , M. Dev Anand and R. Rajesh
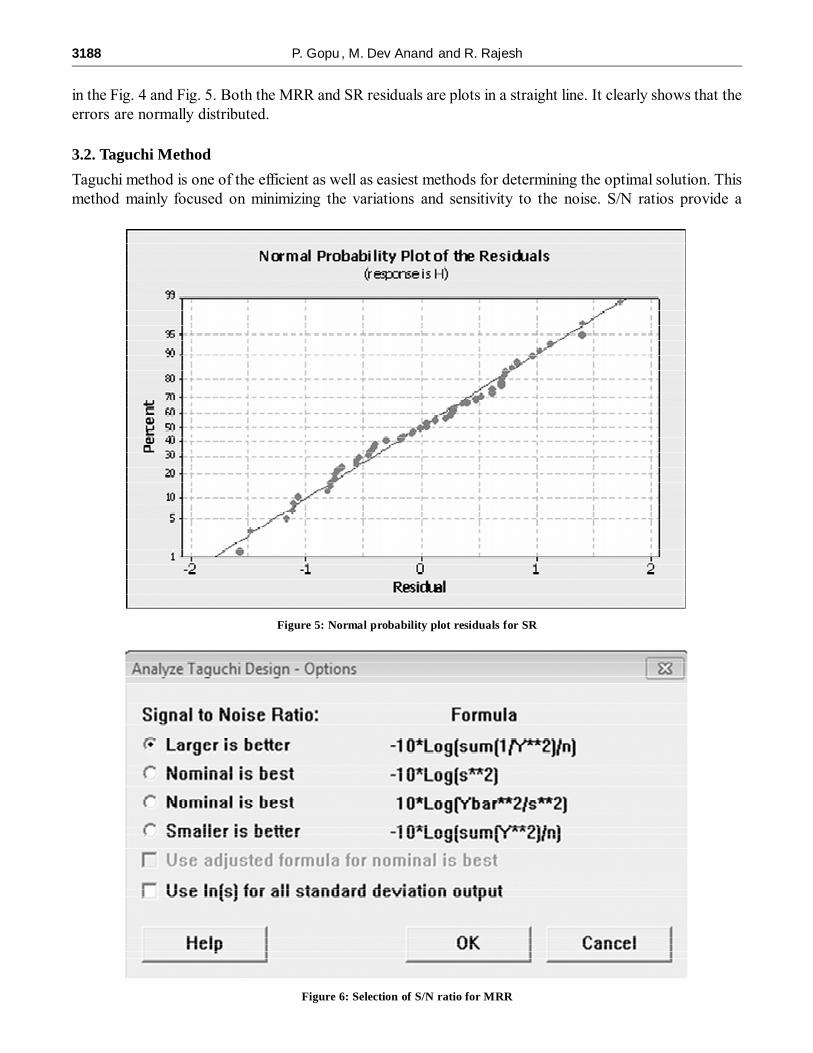
in the Fig. 4 and Fig. 5. Both the MRR and SR residuals are plots in a straight line. It clearly shows that theerrors are normally distributed.
3.2. Taguchi Method
Taguchi method is one of the efficient as well as easiest methods for determining the optimal solution. Thismethod mainly focused on minimizing the variations and sensitivity to the noise. S/N ratios provide a
Figure 5: Normal probability plot residuals for SR
Figure 6: Selection of S/N ratio for MRR

Application of Regression Analysis and Taguchi Method for Prognostication... 3189
measure of robustness. Signal to noise ratio can be classified in to three types namely, Larger is better,Nominal is better and Smaller is better. For all these types of S/N ratios having a separate formula and forOptimizing the process parameter for Material removal rate, Larger is better is selected as shown in the Fig.6. Table.4 shows the response table for signal to noise ratios for the three levels of the process parametersof MRR. From the Fig. 8 it clearly shows that the Material Removal Rate is better, when the voltage is at 75V, current is at 15 A, pulse ON time is at 45 sec, pulse OFF time is at 9 sec, Gap is at 0.2 mm and Oilpressure is at 2 Kg/cm².
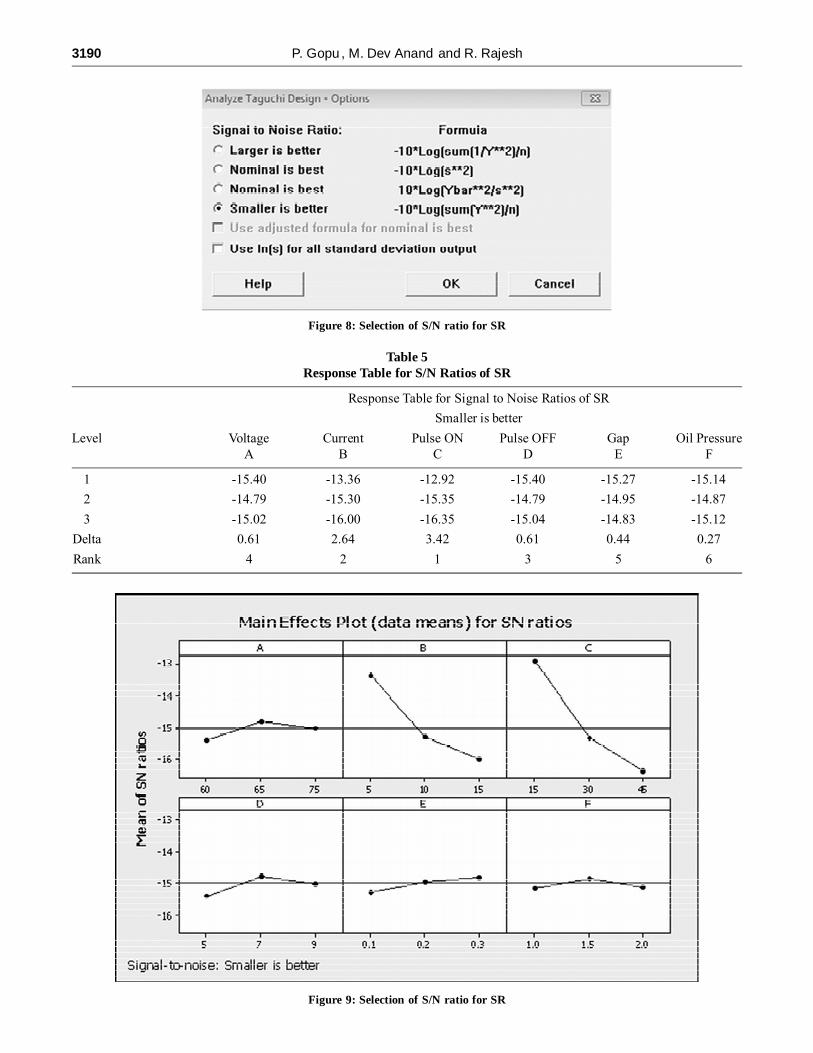
For optimizing the process parameter of Surface Roughness, Smaller is better is selected as shown inthe Fig. 8. Table.5 which shows the response table for signal to noise ratios for the three levels of theprocess parameters of SR and the Fig. 9 it clearly shows that the Surface Roughness is better, when thevoltage is at 65 V, current is at 5 A, pulse ON time is at 15 sec, pulse OFF time is at 7 sec, Gap is at 0.3 mmand Oil pressure is at 1.5 Kg/cm².
Table 4Response Table for S/N Ratios of MRR
Response Table for Signal to Noise Ratios of MRR
Larger is better
Level Voltage Current Pulse ON Pulse OFF Gap Oil PressureA B C D E F
1 12.542 6.199 9.518 12.634 12.361 12.229
2 11.765 13.065 12.344 11.749 12.512 12.174
3 12.958 16.593 14.776 12.900 11.582 12.419
Delta 1.193 10.394 5.259 1.151 0.930 0.245
Rank 3 1 2 4 5 6
Figure 7: Selection of S/N ratio for MRR
3190 P. Gopu , M. Dev Anand and R. Rajesh
Figure 8: Selection of S/N ratio for SR
Table 5Response Table for S/N Ratios of SR
Response Table for Signal to Noise Ratios of SR
Smaller is better
Level Voltage Current Pulse ON Pulse OFF Gap Oil PressureA B C D E F
1 -15.40 -13.36 -12.92 -15.40 -15.27 -15.14
2 -14.79 -15.30 -15.35 -14.79 -14.95 -14.87
3 -15.02 -16.00 -16.35 -15.04 -14.83 -15.12
Delta 0.61 2.64 3.42 0.61 0.44 0.27
Rank 4 2 1 3 5 6
Figure 9: Selection of S/N ratio for SR
Application of Regression Analysis and Taguchi Method for Prognostication... 3191
4. CONCLUSION
In this research we found the Prognostic and Optimistic parameters for the Material Removal Rate and theSurface Roughness of the Electrical Discharge Machining for a composite material Aluminium LM 25 and10% SiC. The results found for Regression analysis is 0.442 mg/sec average error for material removal rateand 0.6434 µm average error for surface roughness when compared with the experimental results and byusing Taguchi method, optimize theparameters of the Material Removal Rate is, Discharge voltage 75 V,Discharge current 15 A, Pulse-ON time 45 sec, Pulse-OFF time 9 sec, Gap between the tool and work piece0.2 mm and Oil pressure 2 Kg/cm² and for Surface Roughness is Discharge voltage 65 V, Discharge current5 A, Pulse-ON time 15 sec, Pulse-OFF time 7 sec, Gap between the tool and work piece 0.3 mm and Oilpressure 1.5 Kg/cm².
REFERENCES
[1] Jong Hyuk Jung and Won Tae Kwon, Optimization of EDM process for multiple performance characteristics usingTaguchi method and Grey relation analysis. Journal of Mechanical Science and Technology 24 (5) (2010) 1083-109.
[2] Mohid. Junaid Mir, Khalid Sheikh, Balbir Singh and NavdeepMalhotra, Modeling and analysis of machining parametersfor surface roughness in powder mixed EDM using RSM approach. International Journal of Engineering, Science andTechnology Vol. 4, No. 3, 2012, pp. 45-52.
[3] U. ESME, A. SAGBAS and F. KAHRAMAN, PREDICTION OF SURFACE ROUGHNESS IN WIRE ELECTRICALDISCHARGE MACHINING USING DESIGN OF EXPERIMENTS AND NEURAL NETWORKS. Iranian Journal ofScience & Technology, Transaction B, Engineering, Vol. 33, No. B3, pp. 231-240, 2009.
[4] Krishankant, Jatin Taneja, Mohit Bector, Rajesh Kumar, Aplication of Taguchi Method for Optimizing Turning Processby the effects of Machining Parameters.International Journal of Engineering and Advanced Technology (IJEAT) ISSN:2249-8958, Volume-2, Issue-1, October 2012.
[5] Rama Rao. S, Padmanabhan, Application of Taguchi methods and ANOVA in optimization of process parameters formetal removal rate in electrochemical machining of Al/5%SiC composites. International Journal of Engineering Researchand Applications (IJERA) ISSN: 2248-9622. Vol. 2, Issue 3, May-June 2012, pp. 192-197.
[6] Chandramouli S., ShrinivasBalraj U. and Eswaraiah K., Optimization of Electrical Discharge Machining Process ParametersUsing Taguchi Method. International Journal of Advanced Mechanical Engineering. ISSN 2250-3234 Volume 4, Number4 (2014), pp. 425-434.
[7] Kompan Chomsamutr, Somkiat Jongprasitpom, Optimization Parameters of tool life Model Using the Taguchi Approachand Response Surface Methodology. IJCSI International Journal of Computer Science Issues, Vol. 9, Issue 1, No 3,January 2012. ISSN (Online): 1694-0814.
[8] Vishal Parashar, A. Rehman, J.L. Bhagoria, Y.M. Puri, Statistical and regression analysis of Material Removal Rate forwire cut Electro Discharge Machining of SS 304L using design of experiments. International Journal of EngineeringScience and Technology, Vol. 2(5), 2010, 1021-1028.
[9] Singaram Lakshmanan, Prakash Chinnakutti, Mahesh Kumar Namballa, Optimization of Surface Roughness using ResponseSurface Methodology for EN31 Tool Steel EDM Machining. International Journal of Recent Development in Engineeringand Technology. ISSN 2347-6435(Online), Volume 1, Issue 3, December 2013.
[10] Md. Ashikur Rahman Khan, M.M. Rahman, K. Kadirgama, M.A. Maleque and M. Ishak, PREDICTION OF SURFACEROUGHNESS OF TI-6AL-4V IN ELECTRICAL DISCHARGE MACHINING: A REGRESSION MODEL. Journal ofMechanical Engineering and Sciences (JMES) e-ISSN; 2231-8380; Volume 1, pp. 16-24, December 2011.