Optimizing Railroad Transportation Safety Improvement Strategies
17
Slide 1 ILLINOIS - RAILROAD ENGINEERING Optimizing Railroad Transportation Safety Improvement Strategies Rapik Saat, Ph.D., Chris Barkan, Ph.D. Rail Transportation and Engineering Center (RailTEC) University of Illinois at Urbana-Champaign 14 November 2011 INFORMS Meeting
Transcript of Optimizing Railroad Transportation Safety Improvement Strategies

Slide 1ILLINOIS - RAILROAD ENGINEERING
Optimizing Railroad Transportation Safety Improvement Strategiesy p g
Rapik Saat, Ph.D., Chris Barkan, Ph.D.p , , ,Rail Transportation and Engineering Center (RailTEC)
University of Illinois at Urbana-Champaign
14 November 2011INFORMS Meeting
Slide 2ILLINOIS - RAILROAD ENGINEERING
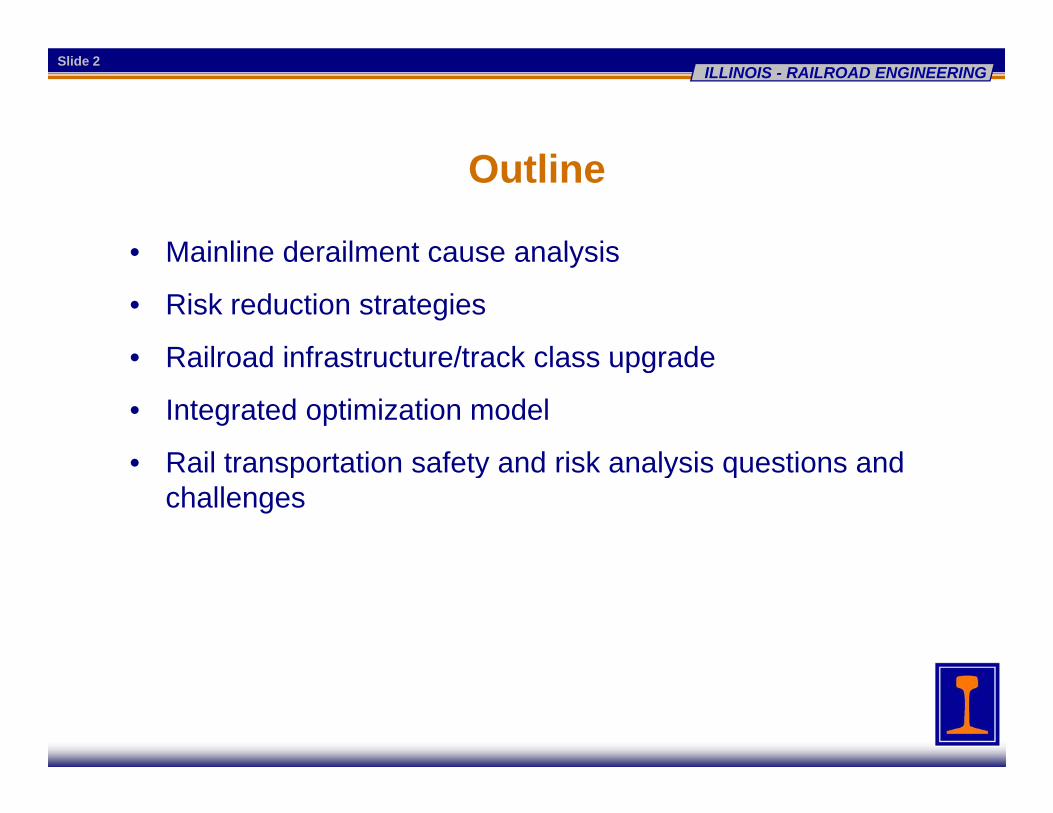
Outline
• Mainline derailment cause analysis• Mainline derailment cause analysis
• Risk reduction strategies
• Railroad infrastructure/track class upgrade• Railroad infrastructure/track class upgrade
• Integrated optimization model
Rail transportation safety and risk analysis questions and• Rail transportation safety and risk analysis questions and challenges

Slide 3ILLINOIS - RAILROAD ENGINEERING
U.S. Class I railroad mainline derailments by accident cause group: 2000 2009accident cause group: 2000-2009
Signals 0.5%
Misc.(12%)
Track(38%)
Human Factors(15%)
Equipment(35%)
Notes:1. FRA Railroad Accident/Incident Reporting System (RAIRS) database, 2000-20092. Total of 3,995 train derailments involving Class I trains derailed on Class I railroad mainline track, track classes 1 to 53. Includes BNSF, UP, CSX, NS, KCS, CP (SOO) and CN (GTW)4. Excludes derailments due to train collisions and highway-rail crossing collisions

Slide 4ILLINOIS - RAILROAD ENGINEERING
Mainline derailments due to track-related causes
562 (37%)*
0 100 200 300 400 500 600
Broken Rails or Welds
Number of Class I Mainline Derailments, 2000-2009
( )
277 (18%)
134 (9%)
120 (8%)
Track Geometry (excl. Wide Gauge)
Wide Gauge
B ckled Track 120 (8%)
92 (6%)
66 (4%)
Buckled Track
Turnout Defects - Switches
Misc. Track and Structure Defects
64 (4%)
59 (4%)
45 (3%)
Joint Bar Defects
Roadbed Defects
Other Rail and Joint Defects
40 (3%)
37 (2%)
10 (1%)
Rail Defects at Bolted Joint
Non-Traffic, Weather Causes
Turnout Defects - FrogsNote: 1. Indicates percentage of all track-related derailments, e.g. broken rails or welds caused 37%2. 1,506 total track-related derailments from 2000-2009, involving Class I trains derailed on Class I mainline track, track classes 1 to 53. Includes BNSF, UP, CSX, NS, KCS, CP (SOO) and CN (GTW)4. Excludes derailments due to train collisions and highway-rail crossing collisions
10 (1%)Turnout Defects Frogs

Slide 5ILLINOIS - RAILROAD ENGINEERING
Derailments due to equipment-related causes
252 (18%)*
214 (15%)
0 50 100 150 200 250 300
Bearing Failure (Car)Broken Wheels (Car)
Number of Class I Mainline Derailments, 2000-2009
( %)
128 (9%)
124 (9%)116 (8%)
113 (8%)
( )Other Wheel Defects (Car)
Other Axle/Journal Defects (Car)Coupler Defects (Car)
Sidebearing, Suspension Defects (Car)89 (6%)
51 (4%)
51 (4%)
44 (3%)
43 (3%)
Centerplate/Carbody Defects (Car)Loco Trucks /Bearings /Wheels
Stiff Truck (Car)All Other Car Defects
Track/Train Interaction (Hunting) (Car) 43 (3%)
40 (3%)
37 (3%)
31 (2%)
17 (1%)
Track/Train Interaction (Hunting) (Car)Other Brake Defect (Car)
Truck Structure Defects (Car)Brake Rigging Defect (Car)
Air Hose Defect (Car)15 (1%)
13 (1%)
6 (0.4%)
2 (0.1%)
1 (0 1%)
All Other Locomotive DefectsLoco Electrical and Fires
UDE (Car or Loco)TOFC/COFC Defects
Handbrake Defects (Car)Note: 1. Indicates percentage of all equipment-related derailments, e.g. bearing failure caused 18%2. 1,387 total equipment-related derailments from 2000-2009, involving Class I trains derailed on Class I mainline track, track classes 1 to 53. Includes BNSF, UP, CSX, NS, KCS, CP (SOO) and CN (GTW)4. Excludes derailments due to train collisions and highway-rail crossing collisions
1 (0.1%)Handbrake Defects (Car)

Slide 6ILLINOIS - RAILROAD ENGINEERING
Distribution of cars derailed for different accident causes
Broken Rails Bearing Defectg

Slide 7ILLINOIS - RAILROAD ENGINEERING
Frequency-severity graph of track- and equipment-related Class I mainline derailments 2000-2009related Class I mainline derailments, 2000 2009
25
d
Ave. = 90.4
20
Joint Bar Defects
Other Rail and Joint Defects
Rail Defects at Bolted Joint
ars
Der
aile
d
10
15 Broken Rails or Welds
Wide Gauge
Buckled Track
Num
ber o
f Ca
A 9 2
5
10
Track Geometry Defects (other than wide gauge)
Bearing Failure (Car)
Broken Wheels (Car)
Aver
age
N Ave. = 9.2
00 100 200 300 400 500 600
Number of DerailmentsNote: 1. Total of 2,893 track- and equipment-related derailments from 2000-2009, involving Class I trains derailed on Class I mainline track2. Includes BNSF, UP, CSX, NS, KCS, CP (SOO) and CN (GTW)3. Excludes derailments due to train collisions and highway-rail crossing collisions

Slide 8ILLINOIS - RAILROAD ENGINEERING
Potential risk reduction strategiesInfrastructure Operational
Railcar/Container
Track class upgradeReduce accident occurrence
Speed reductionReduce accident severity
RoutingRailcar/Container Routing
Tank car safety designReduce incidence and
severity of releases
Alternative routingsReduce impact of releases

Slide 9ILLINOIS - RAILROAD ENGINEERING
Example risk reduction strategy optimization:Example risk reduction strategy optimization: Railroad infrastructure/track class upgrade
Kawprasert, A (2010). Quantitative Analysis of Options to Reduce Risk of Hazardous Materials Transportation by Railroad. PhD Dissertation, Department of Civil and Environmental Engineering, University of Illinois at Urbana-Champaign, Urbana, IL.

Slide 10ILLINOIS - RAILROAD ENGINEERING
Route-specific risk analysis
f “ ”• Identify high-risk “hot spots”
• Risk is due to accident rate and population exposure
Hi h i k h h i id• Highest risk areas are where these coincide

Slide 11ILLINOIS - RAILROAD ENGINEERING
Risk along a route is highly concentrated
23% of route96% of risk
sk
77% of route
Ris
4% of risk
• Small portion of track segments account for majority of risk
• Enables efficient prioritization of risk reduction strategies

Slide 12ILLINOIS - RAILROAD ENGINEERING
Graphical representation of optimal track class upgrade decisions
Upgrade class‐3 segments anywherepg
0 6
0.7
0.8
0.9
0.01
0.1
1
skisk
Upgrade consecutive‐like class‐3 segments
0 6
0.7
0.8
0.9
0.01
0.1
1
sksk
0.1
0.2
0.3
0.4
0.5
0.6
0.0000001
0.000001
0.00001
0.0001
0.001
Cum
ulat
ive
Ris
Segm
ent R
i
0.1
0.2
0.3
0.4
0.5
0.6
0.0000001
0.000001
0.00001
0.0001
0.001
Cum
ulat
ive
Ris
Segm
ent R
is
0.8
0.9
0.1
11.0
d)
0.01E-080 250 500 750 1,000 1,250 1,500
Distance from Origin (miles)
0.01E-080 250 500 750 1,000 1,250 1,500
Distance from Origin (miles)
Upgrade class‐4 segments or lower anywhere
0.3
0.4
0.5
0.6
0.7
0 000001
0.00001
0.0001
0.001
0.01
Cum
ulat
ive
Ris
k
Segm
ent R
isk
0.6
0.8
Pers
ons A
ffec
ted
0.0
0.1
0.2
1E-08
0.0000001
0.000001
0 250 500 750 1,000 1,250 1,500Distance from Origin (miles)0.2
0.4
Ann
ual R
isk (P
Optimal Solutionfor $30 Million
0.00 30 60 90 120 150
Investment Level(million $)

Slide 13ILLINOIS - RAILROAD ENGINEERING
Integrated optimization model to manage the risk of transporting hazardous materials on railroad networks
Capacity
Accident Rate Maintenance N
Optimal Set of DecisionsRoute &Infrastructure
Track Class
Tank CarConditional
Probability of Release
Cost
Transportation Cost
Netw
ork Assignm
Speed Reduction
Product Hazard Consequence
Release Cost
Risk Cost Shipment Routes
ment M
odel
Container Design
Demand
Routes
Lai, Y.C., Kawprasert, A, Lin, C.Y., Saat, M.R., Liang, C.H. and C.P.L. Barkan (2011). Integrated Optimization Model to Manage the Risk of Transporting Hazardous Materials on Railroad Networks. Transportation Research Record, in-press.

Slide 14ILLINOIS - RAILROAD ENGINEERING
Example integrated optimization model
Lai, Y.C., Kawprasert, A, Lin, C.Y., Saat, M.R., Liang, C.H. and C.P.L. Barkan (2011). Integrated Optimization Model to Manage the Risk of Transporting Hazardous Materials on Railroad Networks. Transportation Research Record, in-press.

Slide 15ILLINOIS - RAILROAD ENGINEERING
Railway Safety and Capacity Researchy y p y
1. A Multivariate Analysis of Railroad Toxic-Inhalation-Hazard (TIH) Transportation Release Rate (Xiang Liu)p ( g )
2. Effects of Highway-Rail Grade Crossings on Hazardous Materials Release Rates (Samantha Chadwick)
3 Measuring the Capacity Impact of Higher Speed Passenger Trains3. Measuring the Capacity Impact of Higher Speed Passenger Trains (Samuel Sogin)

Slide 16ILLINOIS - RAILROAD ENGINEERING
Rail transportation safety and risk analysis ti d h llquestions and challenges
• Development of quantitative causal relationships between various accident prevention options, safety performance and cost
• Optimized integration of different risk reduction strategies– How to decide among different strategies, within and between major areas:
infrastructure, operations, routing, package & shipper operating practices– How to account for interactive effects, e.g. reducing accident rate reduces
the benefit of improving the package, and vice versa• Use of risk profile or F/N curves versus single-point estimates of risk in p g p
decision-making– How to select among risk management decisions regarding prevention of
incidents of differing frequency and magnitude– Hazardous materials risk reduction measures generally affect probability
rather than severity• Evaluation of emerging safety issues and risk with shared freight and
( )passenger rail corridors (www.sharedcorridors.org)

Slide 17ILLINOIS - RAILROAD ENGINEERING
Any questions?y q
Christopher P.L. Barkan, Ph.D.M. Rapik Saat, Ph.D. p ,Professor
Director - Rail Transportation & Engineering CenterDepartment of Civil and Environmental Engineering
University of Illinois at Urbana-Champaign1245 Newmark Civil Engineering Laboratory, MC-250
p ,Research Assistant Professor
Rail Transportation & Engineering CenterDepartment of Civil and Environmental Engineering
University of Illinois at Urbana-Champaign1243 Newmark Civil Engineering Laboratory, MC-250
205 North Mathews AvenueUrbana, Illinois 61801
Tel: (217) 244-6338Email: [email protected]
Website: http://ict illinois edu/railroad
205 North Mathews AvenueUrbana, Illinois 61801
Tel: (217) 333-6974Email: [email protected]
Website: http://ict illinois edu/railroad Website: http://ict.illinois.edu/railroadWebsite: http://ict.illinois.edu/railroad
Thank you!Thank you!