

Optimizing Energy Systems to Increase Efficiency Energy Systems to Increase Efficiency . 2 ... Case...
63
In partnership Optimizing Energy Systems to Increase Efficiency
Transcript of Optimizing Energy Systems to Increase Efficiency Energy Systems to Increase Efficiency . 2 ... Case...

2
Why does efficiency matter ?
• Assume electricity rate = AUD 0.115 / kWh.
• Yearly cost of producing 10 kW = AUD 10000.
Efficiency (%) Power
consumed
(kW)
Cost (AUD) AUD of
wasted
energy
20 50.0 50000 40000
30 33.3 33333 23333
40 25.0 25000 15000
50 20.0 20000 10000
60 16.6 16666 6666
70 14.3 14288 4288

3
© ABB Group
December 4, 2012 |
Slide 3
The case for energy efficiency
Fast and Affordable: technology is
already available
“Improving energy efficiency worldwide is the fastest, the most sustainable and the cheapest way to reduce greenhouse gas emissions and enhance energy security.”
“(Final statement of G-8 summit, Germany, June 2007)”
“On average, an additional dollar invested in more efficient electrical equipment, appliances and buildings avoids more than two dollars in investment in electricity supply.”
“(International Energy Agency's World Energy Outlook, Nov. 2006)”

4
Energy audit to establish performance benchmark
for improvements
Standard Audit Guideline –AS/NZS3598:2000
Energy Efficiency =
Output/Input
EE measures in energy
consuming equipment
Monitoring & control
energy outputs:
overload, demand,
wastage, configuration
Level 1 Benchmarking
Level 2 Metering and Validating
Energy Foot print
Level 3 Recommendations
Implementation

5
Quantify Energy Usage, Losses and Energy
Functions
Treated Water Pumps, Fans, Motors and
Mechanical applications Inc
HVAC – 70% -80%
Total Energy Input
(Cost)
Lighting
4%-10%
Water
Heating
10% Ancillary
Equipment
2%-3%

6
Energy Efficiency
Why measure Electrical Energy ?
Save Energy and Costs
Inspection of consumers behavior
Consumption becomes transparent
Fair splitting of costs
Internal billing
Detection of “Energy Thieves”
Creation of incentives for cost saving
Change of consumers behavior
Approach for automation
Load management
Monitoring of the installation
…
"If you cannot
measure it,
you cannot
improve it."
Lord Kelvin
1824 -1907

9 RMIT Power & Energy
Group
Example: Efficiency Analysis & Applications

10
© ABB Group
December 4, 2012 |
Slide 10
Primary energy Transport Generation T&D Industrial processes
Industrial production
80% of energy
is lost
Ava
ilab
le e
ne
rgy
Only 20% of primary energy generates economic value The rest is lost to conversion processes, transportation and
operational inefficiencies

11
© ABB Group
December 4, 2012 |
Slide 11
Primary energy Transport Generation T&D Industrial processes
Industrial production
Ava
ilab
le e
ne
rgy
ABB technology can
double energy productivity
More efficient fuel combustion
Higher
pipeline flows
Improved well
efficiency Lower line losses, higher substation
efficiency Improved
productivity
More efficient motors & drives
Drives & motors
Process
Automation
Marine & pipelines
Power plant automation
Grid operation
Process automation
Reducing losses along the energy chain ABB technology helping at every step

12
© ABB Group
December 4, 2012 | Slide 12
Typical Control Regime In Motor Driven
applications
Throttling by a valve
Parallel running of Pumps
Variable speed control of the pump
On-off control of the pump
By-passing by a valve
Flow control methods

13
© ABB Group
December 4, 2012 |
Slide 13 | Ver. B
Saving with variable speed drives
Load types
• Drives save Energy by varying the speed of the driven load
• There are 2 basic types of load
– Variable Torque loads – Power varies with the cube of the speed
– Centrifugal Pumps
– Centrifugal Fans
– Cooling Tower Fans
– Constant Torque loads – Power varies linearly with speed
– Conveyors
– Extruders
– Screw Type Air Compressors
– Positive Displacement Pumps, Vacuum Pumps
– Hydraulic power packs
– Punch Presses

14
© ABB Group
December 4, 2012 |
Slide 14 | Ver. B
100
75
50
25
25 50 75 100
12.
5
Saving with variable speed drives
Variable Torque loads
Power is
proportional to
(Speed)3
100
75
50
25
25 50 75 100
12.
5
100
75
50
25
25 50 80 100
12.
5
100
75
50
25
25 50 75 100
12.5
Speed (%RPM), Flow (%GPM or %CFM)
Po
wer
(%H
P)
(%k
W)

15
© ABB Group
December 4, 2012 |
Slide 15 | Ver. B
Saving with variable speed drives
Variable torque loads – pumps and fans
• Variable Torque loads yield the best savings,
because of the cube relationship between the
speed and the power
0
20
40
60
80
100
120
0 20 40 60 80 100
Flow (%)
Po
wer
Power to pump toproduce useful flow
Power to throttlecontrolled pump
Power input to VSDcontrolled pump

16
© ABB Group
December 4, 2012 |
Slide 16 | Ver. B
Saving with variable speed drives
Constant torque loads
Speed (%RPM), Flow (%GPM or %CFM)
Po
wer
(%H
P)
(%k
W)
100
75
50
25
25 50 75 100
100
75
50
25
25 50 75 100
Power is
proportional to
Speed
100
75
50
25
25 50 75 100
100
75
50
25
25 50 75 100

17
© ABB Group
December 4, 2012 |
Slide 17 | Ver. B
Savings with motors and machines
Manage the motor population for better efficiency
• Rewinding can just introduce inefficiencies
Has it been
rewound before?
Send for repair
Replace with
high efficiency motor
Motor fails
Does it run for
long periods?
Power < 18.5 kW
Metric or imperial
Cost to change
Is it a High
Eff. Motor?
Metric
Imperial
low high
no yes
no
no
no
yes
yes
yes
18 7 September, 2012 © RMIT University
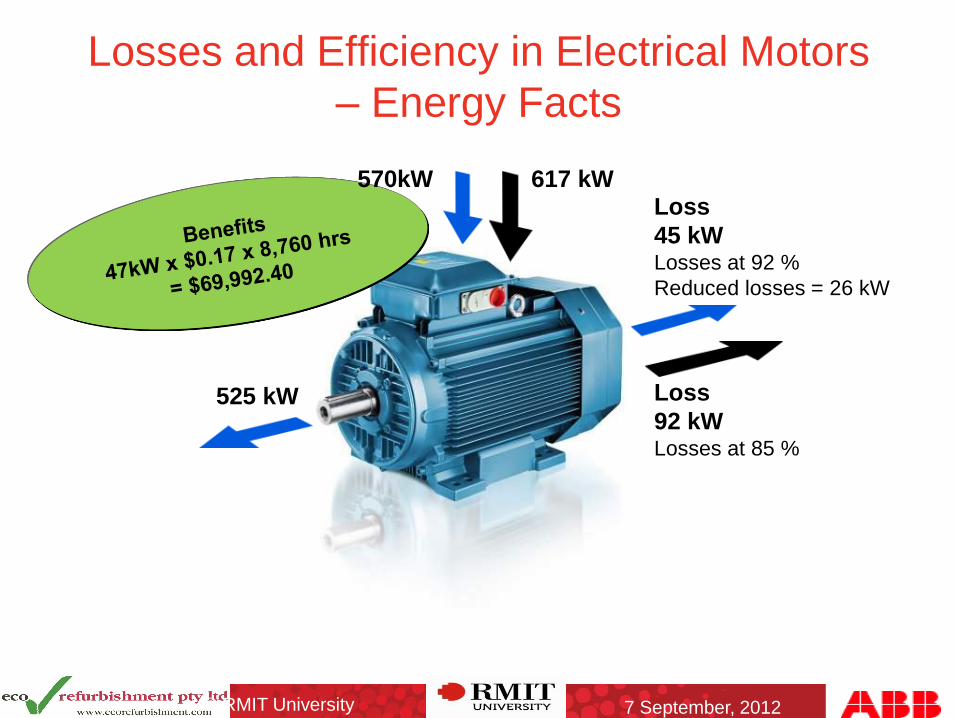
Loss
92 kW Losses at 85 %
Loss
45 kW Losses at 92 %
Reduced losses = 26 kW
617 kW
525 kW
570kW
Losses and Efficiency in Electrical Motors
– Energy Facts

19
Guest room theoretical
modelling and what-if
analysis
0
20
40
60
80
100
120
140
160
180
200
0 1 2 3 4 5 6
Hours
kW
Hr E(ON/OFF)
E(Prop)
tPTT
dtghTcKE a
ro
ww
)(4
tPTQcE ww
tPE aON/OFF
Proportional
Air
vent
Cooli
ng
coil
Air filter Motor
and
fan
Air flow
Living
area
Case Study – Sheraton Fiji Resort Guestroom Cooling Model

20
Melbourne Airport HVAC – Energy
Efficiency Case Study
• RMIT University – Sustainable Lighting System Research,
Design And Implementation:

21
OPEX
Running Time
Efficiency
Cost of energy
ABB has high efficiency product and tools to
help improve efficiency.
Components affecting your motor electricity cost
Which would you like to influence ?

22
Bridging Industry with Academia
RMIT’s Research Lounge B28 - LED Retrofit –A Case Study
On Solid State Lighting in DC Environment
ABB
CREE
Eco Refurbishment
Selectronics
RMIT Industry Partners

23
Case Study Outcome
• AREA 297.4 M2
• TOTAL RMIT CITY CAMPUS FLOOR SPACE 200,000 M2
• BENCHMARK BASE 0.15% OF EXISTING USED SPACE
Why LED?
• MERCURY-FREE
• SOFT START NO RAMP UP POWER
• INTERMITTENT SWITCHING WITHOUT SACRIFICING LAMP LIFE
• LEDS EMIT NO UV LIGHT
• SCOPE OF USING SOLAR ENERGY IN DC ENVIRONMENT
• SUSTAINABLE
7 September, 2012 © RMIT University

24
B28 System Outline
LED and DC power reticulation
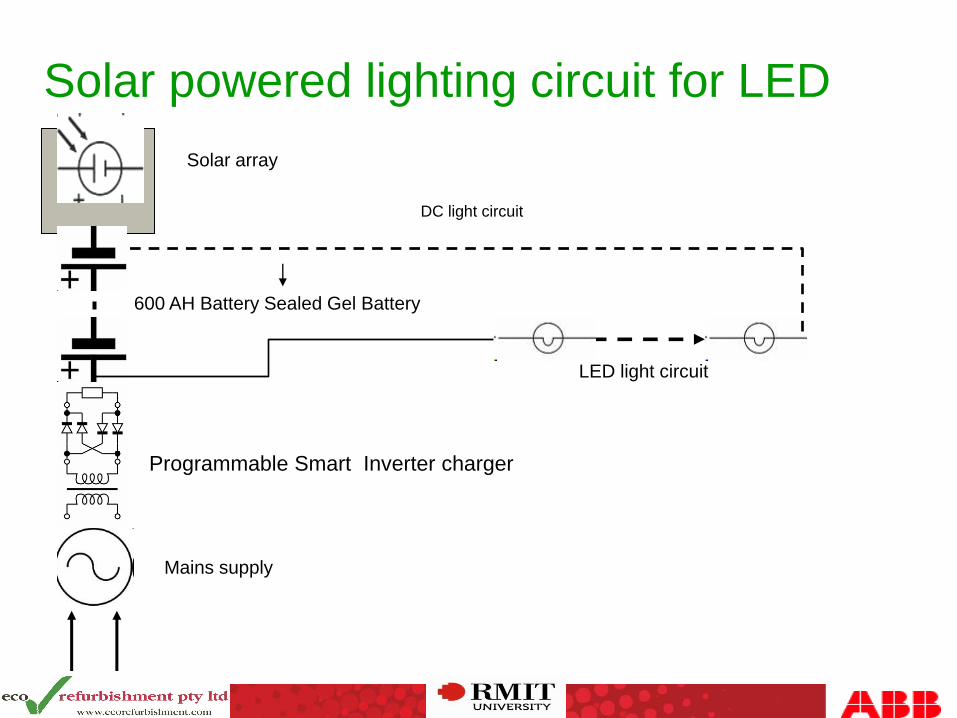
DC power is the Native Environment for LED lighting, and
Renewable Energy Source. Coupling the two reduces
waste, increases efficiency, and provides better control
mechanism.
Changing the lighting circuit to DC power - the losses
from these numerous transformers and rectifiers are
eliminated, increasing the total system reliability.
25
Solar powered lighting circuit for LED
Mains supply
LED light circuit
Programmable Smart Inverter charger
DC light circuit
600 AH Battery Sealed Gel Battery
AH Battery
1 KW Solar array Solar array
DC light circuit
Mains supply

26
B28 Utilisation – BEFORE
14 days from Sept 2010
Total power used = 210 kWh

27
B28 Utilisation –
AFTER
Total power used = 71.3 kWh
Revised kW per mode
assuming LED lighting
had been used
~65% power reduction (for this utilisation pattern)
Estimate:
Lower power
means
possible
direct solar
feed

28
B28 – RESEARCH LOUNGE DC LIGHTING RETROFIT OUTCOME
Lighting Scene - Using CFL Technology “BEFORE”

29
B28 – RESEARCH LOUNGE DC LIGHTING RETROFIT OUTCOME
Lighting Scene - Using CFL Technology “AFTER”

30
B28 Case Study – Commercial Application
Sofitel on Collins
DC Lighting Design and Installation For Guestroom Corridors – 1.3Km of High
Powered LED Lighting

31
B28 Case Study – Commercial Application
Sofitel on Collins
Prototyping and Design Verification:

32
B28 Case Study – Commercial Application
Sofitel on Collins
Project Roll Out 14 Floors:

33
B28 Case Study – Commercial Application
Sofitel on Collins
Project Roll Out 14 Floors:

34
Cree’s Led Technology and Basics
7 September, 2012 © RMIT University

35
Cree’s Led Technology and Basics
7 September, 2012 © RMIT University
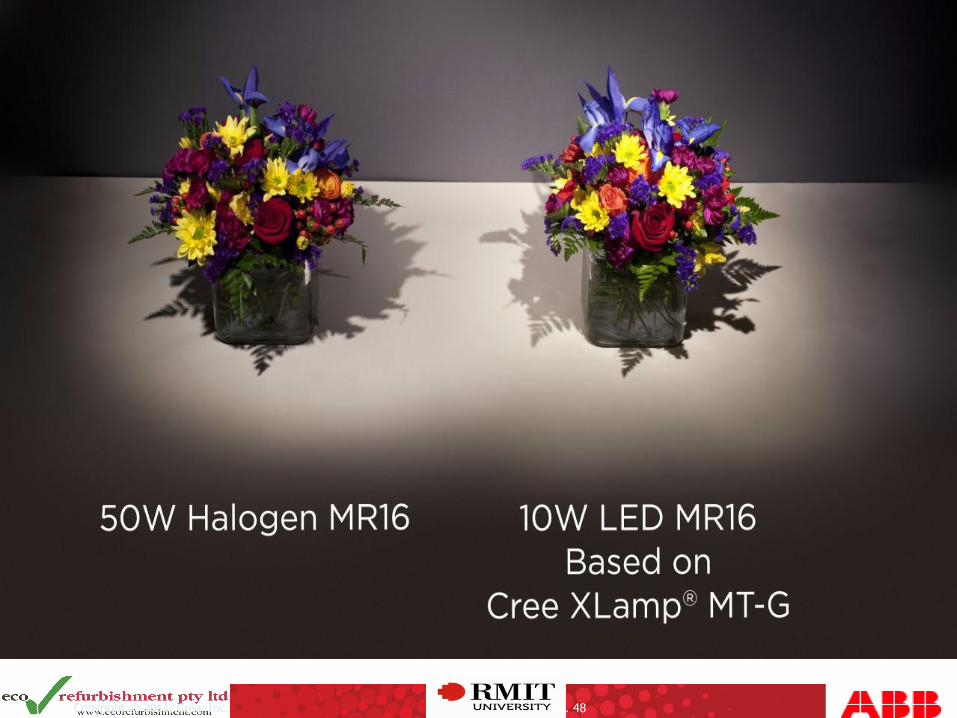
With efficient blue LEDs the opportunity to produce
white emitting LEDs is now present.
White LEDs are made by coating them with a
phosphor that absorbs a proportion of the blue light
emitted by the diode and emitting light across the
rest of the visible spectrum.
Typically one or two phosphors are used to convert
the blue to white. Either a single broad yellow
phosphor or a combination of green and red will
produce the desired effect.

36
Philips and Osram have acquired a license to Cree’s remote phosphor technology. Others such as TG and Nichia have acquired rights only to certain patents (e.g. ‘175).

37
COLORIMETRY AND BINNING BASICS
Light is the visible portion of electromagnetic spectrum covering from 380 nm to
780 nm

38
Easy White Chromaticity Bins
Cree provides industry leading granularity by defining sub-bins within each of the
ANSI C78.377 bins for warm, neutral and cool white XLamp products
Cree EasyWhite LEDs are built using the color mixing techniques offering
both excellent consistency and manufacturing repeatability

39
ANSI C78.377A ~7-step MacAdams
~2-step MacAdams
How Does Crees EasyWhite Compare To Traditional
Lighting?
Cree EasyWhite™
~2/4-steps
XLamp MC, MP
~4-step MacAdams XLamp ML, MX, XP
Copyright © 2011, Cree, Inc. pg. 39

40
Cree LED Components Enable LED Lighting
Copyright © 2011, Cree, Inc. pg. 40
Enable LED Lighting
Lighting-Class
Performance
Light output, Efficacy,
Quality of light,
Reliability

41
INDOOR OUTDOOR PORTABLE
Discretes (Directional)
XM-L • High Bay / Industrial • Roadway
• Parking Area • High Output
XP • Replacement Lamps
• Directional
• Roadway, Parking &
Bollard
• High-End
• Consumer
XR • Ceiling-mounted • High-End
Discretes (Non-Directional)
MX • Value LED Bulbs
• Pixelated Linear • Pedestrian
ML • Smooth Look Linear • Landscape • Consumer
Arrays (Directional)
MP-L • Replacement Lamps
• Directional (MR/PAR)
MC-E • Security
• Landscape
Arrays (Non-Directional)
CXA20 • Omnidirectional Lamps
• Downlights • Area Lighting
Cree LEDs for Lighting Applications Matrix
Copyright © 2011, Cree, Inc. pg. 41

42
Lighting Class LED Efficacy & Light Output
0
20
40
60
80
100
120
140
160
180
200
220
240
260
2003 2004 2005 2006 2007 2008 2009 2010 2011 2012 2013 2014
Co
ol
Wh
ite
(lu
me
ns
/Wa
tt)
CFL
LED
Fluorescent
HID
High Volume
Production 131 LPW 3 yrs
R&D Capability
186 LPW
208 LPW
Incandescent
XR-E
XR-E
XP-E
XP-G
161 LPW XM-L
231 LPW

43
Design Options with Cree’s Brightest
LEDs
Copyright © 2011, Cree, Inc. pg. 43

44
Leverage Cree’s Experience
• Over the past 4-5 years we
have seen every method to
ruin a perfectly good LED
and every way to poorly
design a LED fixture.
CONFIDENTIAL

45
Another Example – Chemical
Compatibility
Normal LED Contaminated LED
45

46
LED Lifetime Is Not the Only factory….
System Lifetime is What Creates Value
LED Lamps: Practically never
fail; depreciate very slowly in a
well-designed system
Optical Components: Can
(rarely) yellow over time and
lose light; system design choice
Driver: Currently the weakest
point of the system, but the big
companies are working on this
Heat Sink: Linchpin of the entire system.
If this is poorly designed, all the other
components can be compromised
Copyright © 2011, Cree, Inc. pg. 46

47
XLamp XP-G White L70 Lifetime (Ta=85ºC)
Copyright © 2011, Cree, Inc. pg. 47
Current Ta/Tsp (ºC) L70 (hours)
350 mA 85 174,071
400 mA* 85 163,116
500 mA* 85 143,231
600 mA* 85 125,771
700 mA* 85 110,439
800 mA* 85 96,976
900 mA* 85 85,154
1000 mA 85 74,773
Notes:
• These extrapolations are for informational purposes only and are not a warranty or a specification.
• Extrapolated lifetimes are subject to change without notice.
• Extrapolations use the best-fit exponential method (fit to all data points).
• Notice: Cree will revise L70 lifetimes to those calculated by IES TM-21 methods once TM-21 is finalized.
* Interpolated values

49
July, 2011
Cree TEMPO™ Services
(Thermal, Electrical, Mechanical, Photometric, Optical)

50
Cree TEMPO™ Services
• Quantitative & qualitative tests and analyses for lighting fixtures and
bulbs
Thermal
Electrical
Mechanical
Photometric
Optical
• Performed at Cree Technology Centers
• Direct access to Cree Application Engineers
1-hour consultation included with certain service options
What could you learn?
• Formal TEMPO™ report with 21 & 24 point services
Authoritative marketing material for your customers

51
TEMPO™ Services
• Cree takes its responsibility as a leader in driving the adoption of
LED Lighting seriously
• TEMPO™ Services
Removes barriers to market adoption
Distributes Cree’s vast system knowledge to developers
Improves the confidence in LEDs for Luminaire buyers
Fills critical LED lighting market test gaps
Provides measurable & factual baselines
–System design & performance

52
Electrical Testing
Driver efficiency
Transient analysis (surge, inrush, hot-plug)
Power analysis (Power factor, THD)
Vf/current balancing of series-parallel arrays
Hi-pot (dielectric breakdown) testing
Dimmer compatibility check
Cree TEMPO™ – 24 Point $1500.00
CONFIDENTIAL
Unique Cree TEMPO tests
Electrical Testing
Driver efficiency
Transient analysis (surge, inrush, hot-plug)
Power analysis (Power factor, THD)
Vf/current balancing of series-parallel arrays
Hi-pot (dielectric breakdown) testing
Dimmer compatibility check
Thermal / Mechanical testing
Solder point to determine Tj
Thermal imaging with IR camera
Qualitative mechanical construction
Chemical compatibility analysis
X-ray of printed circuit board (soldering issues)
LED lifetime estimate (TM-21)
Review against Energy Star Criteria
Photometric testing
Luminous flux
Radiant flux
Chromaticity (CRI, CCT, x-y, u’v’, etc.)
Spectral distribution (350nm to 850nm)
Illuminance (ft-cd, lux)
Fixture optical efficiency (% loss)
Fixture efficacy (lumens/Watt)
Binning and color point evaluation
Target Processing Time = 2.5 Weeks
Intensity distribution (goniophotometer)
Spatial color uniformity
Certified LM-79 testing
1 Hour Consultation Included

53
Cree TEMPO™ – SPOT $300.00
CONFIDENTIAL
Photometric testing
Luminous flux
Radiant flux
Chromaticity (CRI, CCT, x-y, u’v’, etc.)
Fixture efficacy (lumens/Watt)
Target Processing Time = 3 Days
Photometric validation with trusted results

54
An Industry – Academy Collaboration Training Centre
RMIT University partners with power and automation technology group ABB to launch an Australian-first training facility, world-Leading KNX Building Control and Automation System
55 7 September, 2012 © RMIT University
Intelligent Building Technology
ABB i-bus® KNX

56
Intelligent Building Technology ABB i-bus® KNX
Energy switching Air flow control
Energy efficiency

57
An Industry – Academy Collaboration Training Centre
KNX is well established as the number one protocol in the
world for Building automation and Control
• Lighting control and regulation
• Control of heating, ventilation, cooling
• Blinds and shutter control
• Security and monitoring
• Energy and load management
• Visualization and operation
• Central automation
• Remote control / maintenance
• Interface to other control systems
• Movement detection

58
ABB DEBJE XH – Slide
58
Intelligent Building Technology
The technology for everyone and everything
Proprietary systems
Proprietary systems
One complete solution instead of
limited individual solutions
BUS Systems KNX
Signalling
Monitoring
HVAC
Blinds
Lighting

59 © ABB
4/12/2012 DESTO Jürgen Schilder | 59
Lighting, 12%
HVAC, 67%
Hot water, 8%
Cooking/Washing, 9%
Lighting
HVAC
Hot water
Cooking/Washing
ABB i-bus® KNX Building Automation
Typical energy usage in a hotel

60 © ABB
4/12/2012 DESTO
Jürgen Schilder | 60
Case Study: Energy efficiency
University of Bremen University with Seminar Rooms: Comparison of
two Rooms (Energy for Heating) Q
uantity
of heat used (
kW
h)

61 © ABB
4/12/2012 DESTO
Jürgen Schilder | 61
Case Study: Energy efficiency
University of Bremen University with Seminar Rooms: Comparison of
two Rooms (Energy for Light)
K
ilow
att h
ours
of ele
ctr
icity (
kW
h)

62
KNX certified courses commences February 2013 at RMIT
city campus (Carlton)
The courses available are: KNX Basic (Certified)
KNX Advanced (Certified)
KNX An introduction (Non certified)
KNX Specific application (Non Certified)
For information or registering for a course contact RMIT. Ross Bousie 9925 4917 [email protected]