Optimal design of multi-nozzle etching process for shadow mask
9
1519 † To whom correspondence should be addressed. E-mail: [email protected] Korean J. Chem. Eng., 26(6), 1519-1527 (2009) DOI: 10.1007/s11814-009-0318-0 RAPID COMMUNICATION Optimal design of multi-nozzle etching process for shadow mask Minkyo Seo*, Jin Soo Park*, Sangdae Park**, and Jae Hak Jung* ,† *School of Display and Chemical Engineering, Yeungnam University, 214-1, Dae-dong, Gyeongsan, Gyeongbuk, Korea **Samsung Everland Inc., 87 Euljiro 1ga, Jung-gu, Seoul, Korea (Received 16 June 2009 • accepted 29 June 2009) Abstract −This paper presents a new design approach of a multi-nozzle etching process which is the core system for the production of a shadow mask. The shadow mask, which is a thin metal plate with a huge number of small holes in regular patterns, is a key component of televisions and computer monitors. The shadow mask plays an important role in controlling the definition, color and distinction of televisions and computer monitors. Thus, the development of a rigorous and systematic design method for a multi-nozzle etching process to manufacture the shadow mask is bene- ficial particularly from the viewpoint of increasing efficiency and improving productivity. The proposed design method is based on simulating the complex spraying pattern using a Monte-Carlo method, whereas a stochastic method, so- called genetic algorithm, is used for an optimization tool. In such a highly complex solution space, the genetic algorithm searches optimal solutions efficiently and effectively. The simulation of spraying pattern for the multi-nozzle system and the genetic algorithm are coded by C language, while the graphic representations are attained by MATLAB graphic tools. Key words: Multi-nozzle, Etching Process, GA, MATLAB INTRODUCTION For the last three decades, many shadow masks have been con- sumed in television manufacturing and for the production of com- puter monitors. The most common way of shadow mask manufac- turing is to utilize a multi-nozzle etching process. Recently, large sizes of shadow masks are increasingly required as customers prefer larger televisions and computer monitors. To deal with the demand flexibly and effectively, a systematic design tool for the multi-nozzle etching process to produce shadow mask is even more needed. The multi-nozzle etching process considered in this study is the system for the production of shadow mask. Here, the shadow mask is a perforated metal sheet inside a television and a color monitor. Most color monitor screens use cathode-ray tube (CRT) technology in which electrons are fired from an electron gun onto a fluorescent plate. The phosphor converts the kinetic energy of the electrons into light and is illuminated in small red, green and blue dots. Before the electron beam reaches the phosphor dots, it passes through shadow mask and the shadow mask ensures that the electron beam hits only the correctly colored phosphor dots and does not illuminate more than one dot. In addition, the shadow mask absorbs electrons that are directed at the wrong color phosphor, guiding the electron beams from the electron gun in the right direction. For the shadow mask, a variety of researches have been performed and can be readily found [1-3]. However, it is worth mentioning that the previous researches focused on the etching process and the raw materials rather than the multi-nozzle process. The nozzle considered in this study is a spray nozzle which has been applied in a variety of areas such as coating, etching, cooling processes, pollution control, etc. [4-7]. In general, a spray is the break- up of a volume of liquid into droplets (mist), i.e., atomization of liquid. The droplets (mist) are produced when a liquid enters the thin channel of nozzle. Of course, the size of the cone angle and the uniformity of droplets are highly dependent upon the pressure, the flow rate of a solution, the size of holes, and so forth. Finally, this spray occurs in a single nozzle, and these single nozzles are the elements of a multi-nozzle process. Although the multi-nozzle etching process is commonly used to produce the shadow masks, there has been little attention for the design of the multi-nozzle process. It is purely because of a large number of parameters to be handled and their complex interrela- tionships. Fig. 1 shows the multi-nozzle etching process considered Fig. 1. The process diagram of the multi-nozzle system.
Transcript of Optimal design of multi-nozzle etching process for shadow mask
1519
†To whom correspondence should be addressed.E-mail: [email protected]
Korean J. Chem. Eng., 26(6), 1519-1527 (2009)DOI: 10.1007/s11814-009-0318-0
RAPID COMMUNICATION
Optimal design of multi-nozzle etching process for shadow mask
Minkyo Seo*, Jin Soo Park*, Sangdae Park**, and Jae Hak Jung*,†
*School of Display and Chemical Engineering, Yeungnam University,214-1, Dae-dong, Gyeongsan, Gyeongbuk, Korea
**Samsung Everland Inc., 87 Euljiro 1ga, Jung-gu, Seoul, Korea(Received 16 June 2009 • accepted 29 June 2009)
Abstract−This paper presents a new design approach of a multi-nozzle etching process which is the core systemfor the production of a shadow mask. The shadow mask, which is a thin metal plate with a huge number of small holesin regular patterns, is a key component of televisions and computer monitors. The shadow mask plays an importantrole in controlling the definition, color and distinction of televisions and computer monitors. Thus, the developmentof a rigorous and systematic design method for a multi-nozzle etching process to manufacture the shadow mask is bene-ficial particularly from the viewpoint of increasing efficiency and improving productivity. The proposed design methodis based on simulating the complex spraying pattern using a Monte-Carlo method, whereas a stochastic method, so-called genetic algorithm, is used for an optimization tool. In such a highly complex solution space, the genetic algorithmsearches optimal solutions efficiently and effectively. The simulation of spraying pattern for the multi-nozzle systemand the genetic algorithm are coded by C language, while the graphic representations are attained by MATLAB graphictools.
Key words: Multi-nozzle, Etching Process, GA, MATLAB
INTRODUCTION
For the last three decades, many shadow masks have been con-sumed in television manufacturing and for the production of com-puter monitors. The most common way of shadow mask manufac-turing is to utilize a multi-nozzle etching process. Recently, largesizes of shadow masks are increasingly required as customers preferlarger televisions and computer monitors. To deal with the demandflexibly and effectively, a systematic design tool for the multi-nozzleetching process to produce shadow mask is even more needed.
The multi-nozzle etching process considered in this study is thesystem for the production of shadow mask. Here, the shadow maskis a perforated metal sheet inside a television and a color monitor.Most color monitor screens use cathode-ray tube (CRT) technologyin which electrons are fired from an electron gun onto a fluorescentplate. The phosphor converts the kinetic energy of the electrons intolight and is illuminated in small red, green and blue dots. Before theelectron beam reaches the phosphor dots, it passes through shadowmask and the shadow mask ensures that the electron beam hits onlythe correctly colored phosphor dots and does not illuminate morethan one dot. In addition, the shadow mask absorbs electrons thatare directed at the wrong color phosphor, guiding the electron beamsfrom the electron gun in the right direction. For the shadow mask, avariety of researches have been performed and can be readily found[1-3]. However, it is worth mentioning that the previous researchesfocused on the etching process and the raw materials rather thanthe multi-nozzle process.
The nozzle considered in this study is a spray nozzle which hasbeen applied in a variety of areas such as coating, etching, cooling
processes, pollution control, etc. [4-7]. In general, a spray is the break-up of a volume of liquid into droplets (mist), i.e., atomization ofliquid. The droplets (mist) are produced when a liquid enters thethin channel of nozzle. Of course, the size of the cone angle andthe uniformity of droplets are highly dependent upon the pressure,the flow rate of a solution, the size of holes, and so forth. Finally,this spray occurs in a single nozzle, and these single nozzles arethe elements of a multi-nozzle process.
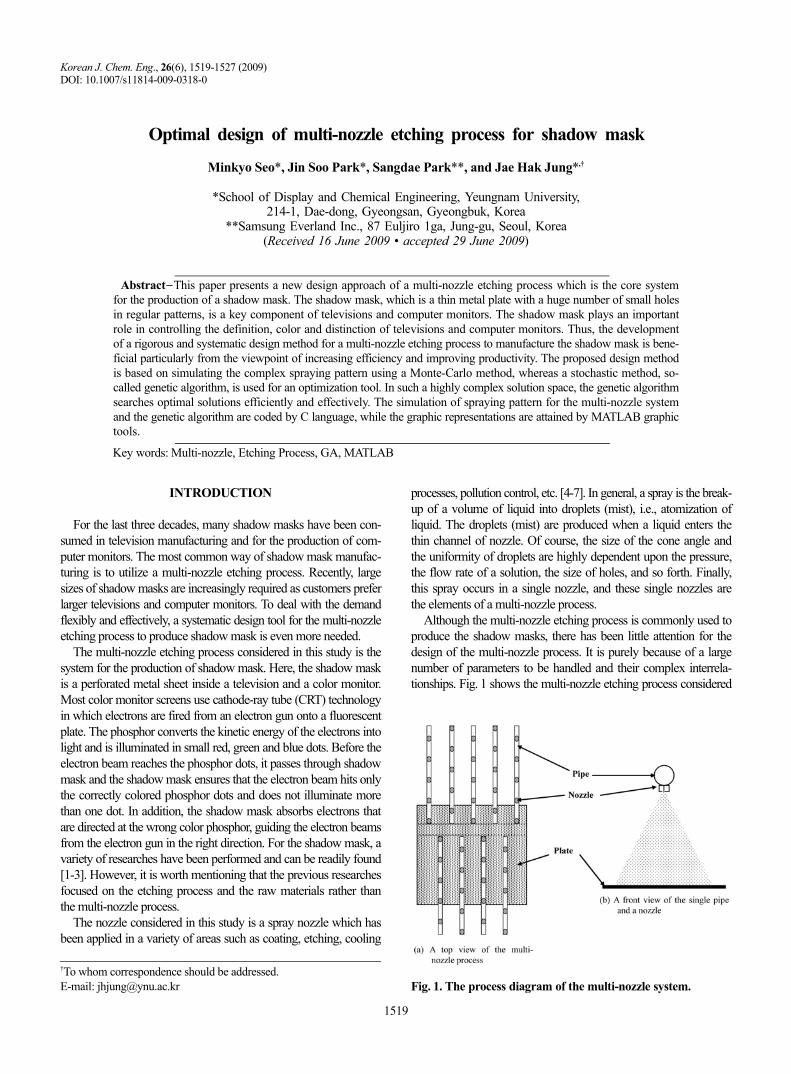
Although the multi-nozzle etching process is commonly used toproduce the shadow masks, there has been little attention for thedesign of the multi-nozzle process. It is purely because of a largenumber of parameters to be handled and their complex interrela-tionships. Fig. 1 shows the multi-nozzle etching process considered
Fig. 1. The process diagram of the multi-nozzle system.
1520 M. Seo et al.
November, 2009
in this study. Fig. 1(a) depicts the top view of the arrangements ofpipes and nozzles, while its front view is shown in Fig. 1(b). Asseen in Fig. 1, various parameters which affect the quality of shadowmask can be found, such as the distance between pipes, interval ofnozzles, distance between a nozzle and the plate, etc.
In general, the objective of the multi-nozzle etching process is toget a uniform etching quality of the surface on the moving platewith the least surface roughness on the moving plate by sprayingthe etching liquid equally all over the plate. To tackle this complexoptimization problem, a rigorous simulation model for a spray noz-zle was firstly developed by using the Monte-Carlo approach. Then,the complex design problem with a number of design variables washandled by genetic algorithm (GA). The genetic algorithm was basedon natural selection and mechanics of nature and developed for thepurpose of modeling the adaptation and evolution of nature [8-12].The genetic algorithm is also able to decrease the probability of search-ing the wrong peak in multi-modal search spaces because it has thecharacteristic of parallel search. Therefore, the genetic algorithm hasa wide acceptance as an efficient and robust search method becauseit increases the search speed for optimal solution and helps to escapefrom a local optimum in complex search spaces [13-18]. In this study,the simulation model for the spray nozzle and genetic algorithmwere coded by C programming language. However, MATLAB wasused for the visual representation of the simulation results. All com-putational results were obtained from an IBM-PC, 1.5 GHz CPUwith 512 MB memory. Finally, the optimal design values were suc-cessfully obtained by the proposed method, and the GA showed asuperior performance in search speed and efficiency.
MODELING OF MULTI-NOZZLEETCHING PROCESS
As mentioned earlier, the multi-nozzle etching process consid-ered in this study is for the production of the shadow mask whichis the key element of televisions and computer monitors. As theraw materials of the shadow mask, both aluminum-killed steel andinvar alloy steel are commonly used for the shadow mask manu-facturing. Although aluminum-killed steel plate has uniform etch-ing and forming features, the invar alloy (64% Fe - 36% Ni) withthe low thermal expanding feature is more commonly used. On theother hand, the ferric chloride solution (FeCl3) as the etching liquidis sprayed from the nozzles onto the plate. As a result, the chemi-cal etching of the plate is complete. The particular features in themulti-nozzle etching process are i) that the plate is moving at a givenspeed by a conveyer, and ii) that the pipes with nozzles are oscillat-ing within an angle generated by the 4-bar crank-rocker mechanism(see the Appendix). In this study, the spray processing of the singlenozzle was firstly analyzed, and then the modeling and simulationof the multi-nozzle etching process is explained in detail.1. Analysis for Single Nozzle System
In this study, simulation for the spray processing of single nozzleis carried out on the basis of the experiment data. For the samplingof a liquid distribution, a 150 cm×150 cm plate was divided intoequal-sized cells of 1 cm×1 cm. Then all of the cells were individ-ually measured after spraying a liquid. In this case water was usedas the spray liquid for the sampling. As a result, the experimentaldistribution data could be attained. Based on the volumetric distri-
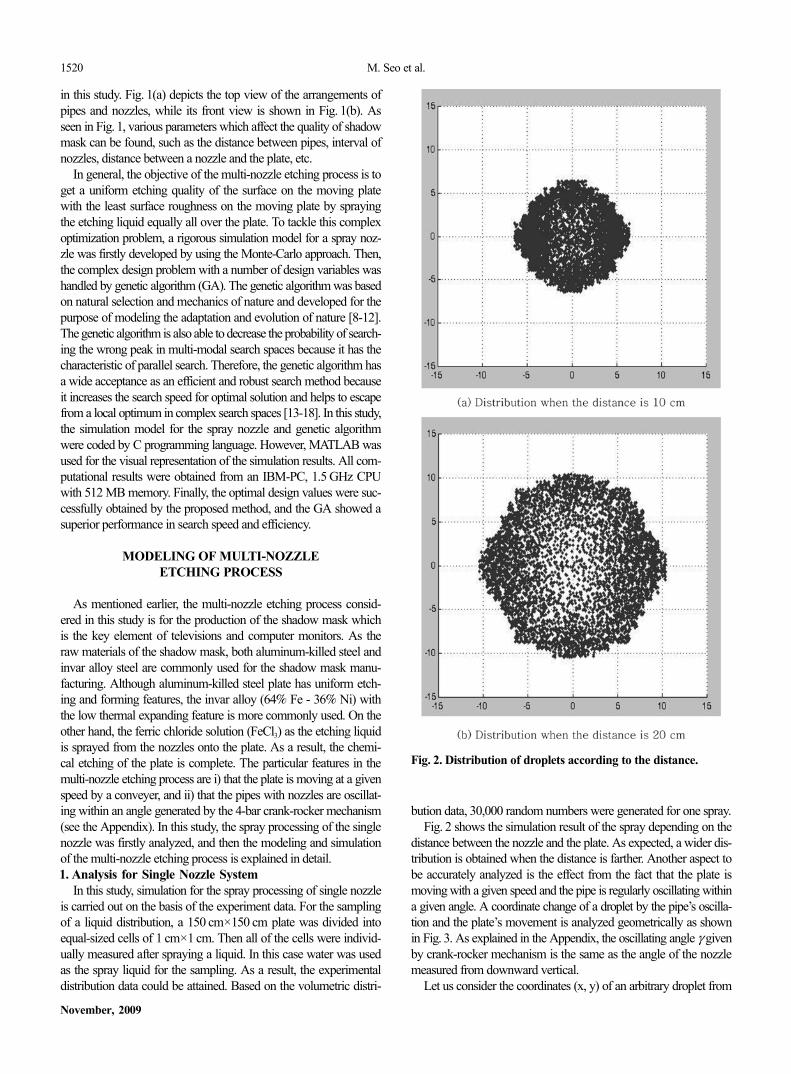
bution data, 30,000 random numbers were generated for one spray.Fig. 2 shows the simulation result of the spray depending on the
distance between the nozzle and the plate. As expected, a wider dis-tribution is obtained when the distance is farther. Another aspect tobe accurately analyzed is the effect from the fact that the plate ismoving with a given speed and the pipe is regularly oscillating withina given angle. A coordinate change of a droplet by the pipe’s oscilla-tion and the plate’s movement is analyzed geometrically as shownin Fig. 3. As explained in the Appendix, the oscillating angle γ givenby crank-rocker mechanism is the same as the angle of the nozzlemeasured from downward vertical.
Let us consider the coordinates (x, y) of an arbitrary droplet from
Fig. 2. Distribution of droplets according to the distance.

Optimal design of multi-nozzle etching process for shadow mask 1521
Korean J. Chem. Eng.(Vol. 26, No. 6)
a nozzle. When the pipe is oscillated by γ and the plate moves for-ward by d, new coordinates (x', y') can be presented as below inEq. (1).
(1)
In Eq. (1), L indicates the perpendicular distance between a noz-zle and the plate. And the two angles α and β can be obtained byEq. (2).
α =tan−1(x/L)β=tan−1(y/L) (2)
As explained in the Appendix, the oscillating angle γ can be esti-mated by Eq. (A6). Eq. (3) below shows the relationship betweenthe distance d and the rotating angle θ. In the equation, v is a con-stant linear velocity of the plate, while ω is an angular velocity ofthe shortest link AB in Fig. A1. In particular, the numerator v/ωmeans the moving interval per one rotation of the link AB.
(3)
Consequently, new coordinates (x', y') can be estimated by Eqs.(1), (2) (3) and (A6). Although the nozzle system is operating con-tinuously, i.e., droplets are sprayed continuously from the nozzles,it is not straightforward to simulate this system as it stands. For thisreason, the spray operation is considered and simulated as a dis-crete operation. Moreover, it is more beneficial to use discrete func-tions in the simulation from the viewpoint of the computational times.In this study, the rotating angle θ is divided into an equal-sized angleas shown in Eq. (4). And, the number of discretizations consideredis 20 (N=20), which are obtained by heuristically. Lastly, Eqs. (5)and (6), which are correspondent with Eqs. (2) and (A6), respec-tively, are used in the simulation.
(4)
(5)
(6)
A new distribution of droplets caused by the changes of an oscillat-ing angle is illustrated in Fig. 4. As seen in Fig. 4(b), the distributionthat an oscillating angle is −25o becomes clearly asymmetrical, andthe distribution area is bigger and wider.
x' = L α + γ( )tan⋅
y' = L β( )tan⋅
α + γ( )cos------------------------ + d
d = v/ω2π--------- θ, θ θ 2π≤ ≤⋅
θi = 2πN------ i, i = 0 1 … N −1 N, , , ,{ }⋅
di = v/ω2π--------- θi⋅
γ1= cos−1 2AD2 − 2ADABcosθi
2AD AD2 + AB2
− 2ADABcosθi
-------------------------------------------------------------------------------⎝ ⎠⎜ ⎟⎛ ⎞
γ2 = cos−1 CD2 + AD2
+ AB2 − BC2
− 2ADABcosθi
2CD AD2 + AB2
− 2ADABcosθi
---------------------------------------------------------------------------------------------⎝ ⎠⎜ ⎟⎛ ⎞
γi = γ2 + γ1, 0 θ π≤ ≤γ2 − γ1, π θ 2π≤ ≤⎩
⎨⎧
Fig. 3. Graphical representations for the coordinate change of adroplet.
Fig. 4. The Effects for the changes of the oscillating angle.
1522 M. Seo et al.
November, 2009
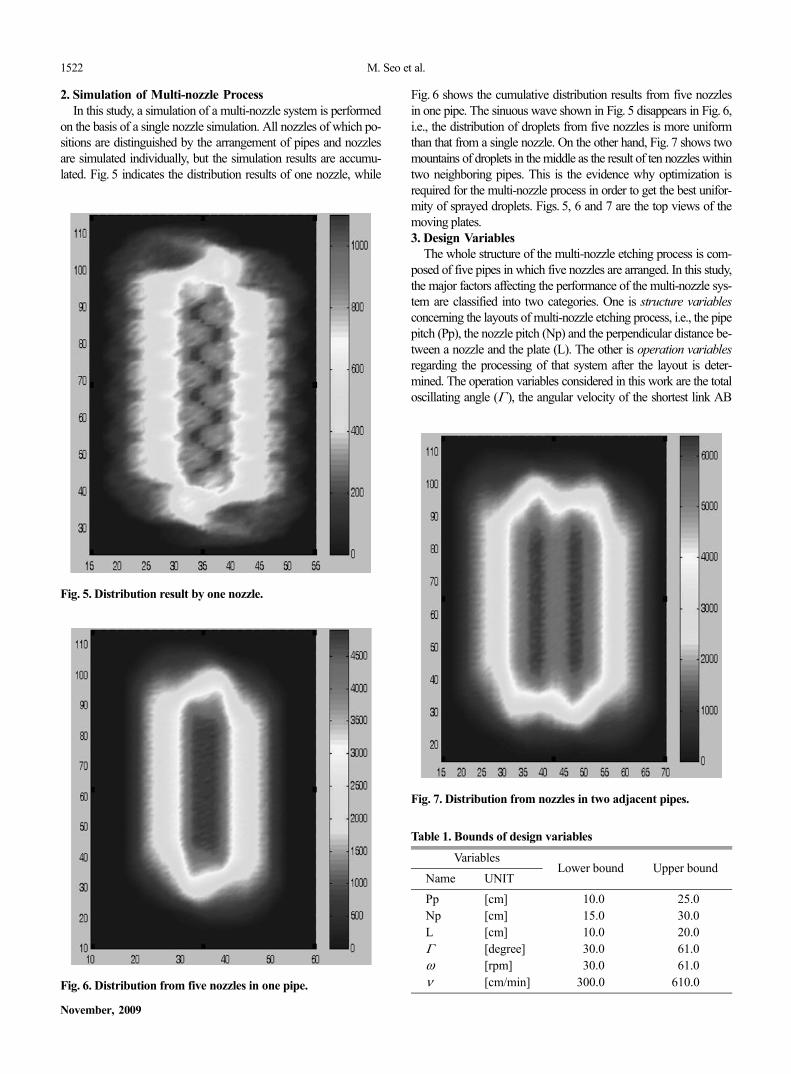
2. Simulation of Multi-nozzle ProcessIn this study, a simulation of a multi-nozzle system is performed
on the basis of a single nozzle simulation. All nozzles of which po-sitions are distinguished by the arrangement of pipes and nozzlesare simulated individually, but the simulation results are accumu-lated. Fig. 5 indicates the distribution results of one nozzle, while
Fig. 6 shows the cumulative distribution results from five nozzlesin one pipe. The sinuous wave shown in Fig. 5 disappears in Fig. 6,i.e., the distribution of droplets from five nozzles is more uniformthan that from a single nozzle. On the other hand, Fig. 7 shows twomountains of droplets in the middle as the result of ten nozzles withintwo neighboring pipes. This is the evidence why optimization isrequired for the multi-nozzle process in order to get the best unifor-mity of sprayed droplets. Figs. 5, 6 and 7 are the top views of themoving plates.3. Design Variables
The whole structure of the multi-nozzle etching process is com-posed of five pipes in which five nozzles are arranged. In this study,the major factors affecting the performance of the multi-nozzle sys-tem are classified into two categories. One is structure variablesconcerning the layouts of multi-nozzle etching process, i.e., the pipepitch (Pp), the nozzle pitch (Np) and the perpendicular distance be-tween a nozzle and the plate (L). The other is operation variablesregarding the processing of that system after the layout is deter-mined. The operation variables considered in this work are the totaloscillating angle (Γ ), the angular velocity of the shortest link AB
Fig. 5. Distribution result by one nozzle.
Fig. 6. Distribution from five nozzles in one pipe.
Fig. 7. Distribution from nozzles in two adjacent pipes.
Table 1. Bounds of design variables
VariablesLower bound Upper bound
Name UNITPp [cm] 010.0 025.0Np [cm] 015.0 030.0L [cm] 010.0 020.0Γ [degree] 030.0 061.0ω [rpm] 030.0 061.0ν [cm/min] 300.0 610.0
Optimal design of multi-nozzle etching process for shadow mask 1523
Korean J. Chem. Eng.(Vol. 26, No. 6)
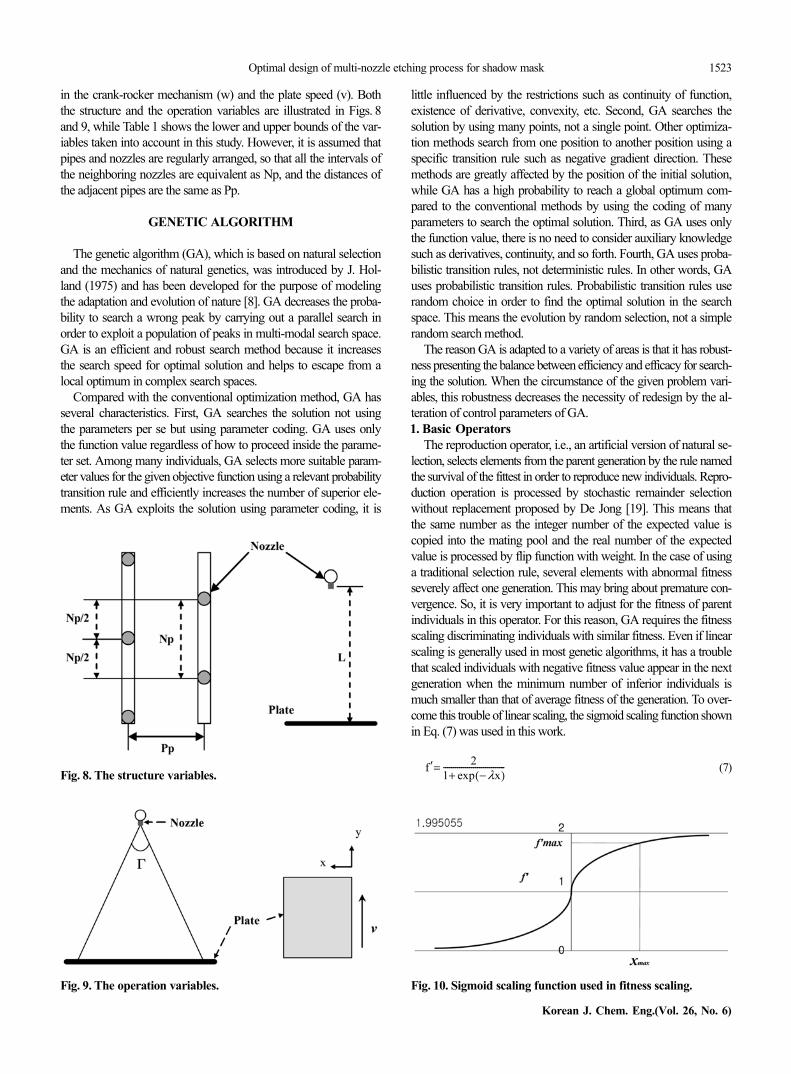
in the crank-rocker mechanism (w) and the plate speed (v). Boththe structure and the operation variables are illustrated in Figs. 8and 9, while Table 1 shows the lower and upper bounds of the var-iables taken into account in this study. However, it is assumed thatpipes and nozzles are regularly arranged, so that all the intervals ofthe neighboring nozzles are equivalent as Np, and the distances ofthe adjacent pipes are the same as Pp.
GENETIC ALGORITHM
The genetic algorithm (GA), which is based on natural selectionand the mechanics of natural genetics, was introduced by J. Hol-land (1975) and has been developed for the purpose of modelingthe adaptation and evolution of nature [8]. GA decreases the proba-bility to search a wrong peak by carrying out a parallel search inorder to exploit a population of peaks in multi-modal search space.GA is an efficient and robust search method because it increasesthe search speed for optimal solution and helps to escape from alocal optimum in complex search spaces.
Compared with the conventional optimization method, GA hasseveral characteristics. First, GA searches the solution not usingthe parameters per se but using parameter coding. GA uses onlythe function value regardless of how to proceed inside the parame-ter set. Among many individuals, GA selects more suitable param-eter values for the given objective function using a relevant probabilitytransition rule and efficiently increases the number of superior ele-ments. As GA exploits the solution using parameter coding, it is
little influenced by the restrictions such as continuity of function,existence of derivative, convexity, etc. Second, GA searches thesolution by using many points, not a single point. Other optimiza-tion methods search from one position to another position using aspecific transition rule such as negative gradient direction. Thesemethods are greatly affected by the position of the initial solution,while GA has a high probability to reach a global optimum com-pared to the conventional methods by using the coding of manyparameters to search the optimal solution. Third, as GA uses onlythe function value, there is no need to consider auxiliary knowledgesuch as derivatives, continuity, and so forth. Fourth, GA uses proba-bilistic transition rules, not deterministic rules. In other words, GAuses probabilistic transition rules. Probabilistic transition rules userandom choice in order to find the optimal solution in the searchspace. This means the evolution by random selection, not a simplerandom search method.
The reason GA is adapted to a variety of areas is that it has robust-ness presenting the balance between efficiency and efficacy for search-ing the solution. When the circumstance of the given problem vari-ables, this robustness decreases the necessity of redesign by the al-teration of control parameters of GA.1. Basic Operators
The reproduction operator, i.e., an artificial version of natural se-lection, selects elements from the parent generation by the rule namedthe survival of the fittest in order to reproduce new individuals. Repro-duction operation is processed by stochastic remainder selectionwithout replacement proposed by De Jong [19]. This means thatthe same number as the integer number of the expected value iscopied into the mating pool and the real number of the expectedvalue is processed by flip function with weight. In the case of usinga traditional selection rule, several elements with abnormal fitnessseverely affect one generation. This may bring about premature con-vergence. So, it is very important to adjust for the fitness of parentindividuals in this operator. For this reason, GA requires the fitnessscaling discriminating individuals with similar fitness. Even if linearscaling is generally used in most genetic algorithms, it has a troublethat scaled individuals with negative fitness value appear in the nextgeneration when the minimum number of inferior individuals ismuch smaller than that of average fitness of the generation. To over-come this trouble of linear scaling, the sigmoid scaling function shownin Eq. (7) was used in this work.
(7)f' = 2
1+ − λx( )exp-------------------------------
Fig. 8. The structure variables.
Fig. 10. Sigmoid scaling function used in fitness scaling.Fig. 9. The operation variables.

1524 M. Seo et al.
November, 2009
where f' means scaled fitness and λ represents the slope to deter-mine the maximum of scaled fitness. Also λ is presented in Eq. (8)
(8)
where f'max is generally selected in the range of 1.2 to 1.9. In thisstudy, 1.5 has been chosen as the value of f'max. In the sigmoid scaling,x shows the deviation fitness calculated by subtracting average fit-ness from fitness.
x=(f−favg) (9)
Therefore, scaled fitness can be converted into the expected valueof each individual, as setting the size of average scaled fitness to 1and changing λ in order to adjust the slope of scaled function. InGA, the meaning of the expected value for reproduction is the num-ber of selection of an individual to crossover. For example, if thefitness of an individual is 30 and the average fitness of that genera-tion is 20, then the expected value of the individual is 1.5, i.e. f/favg=1.5. Therefore, the individual is selected one time and crossovers toreproduce child individuals. Finally, its remaining selection proba-bility is 0.5. The advantage of this method is that we can use bothnegative fitness and a positive one. Like the conventional optimi-zation techniques, we can convert the maximization problems into aminimization one as changing the sign of objective function. Fig. 10presents the sigmoid scaling function used in the fitness scaling.
Crossover operator plays a role in exchanging parents’ geneticinformation partially in order to produce offspring superior to par-ent. To execute the crossover operator, two reproduced strings arechosen into the mating pool first, and then a crossing point is ran-domly selected into the string length. Finally, two offspring stringsare created as swapping genetic information crossing site of twoelements. Since the string structure used in this study was com-posed of binary numbers (0 and 1), we selected the simple cross-over operator rather than partial matched crossover (PMX) or orderedcrossover (OX) that are mainly used to crossover decimal numberstrings. Fig. 11 shows the simple crossover method used in this study.And a superior reinforcement strategy (SRS) method proposed byJung et al. [14] was utilized as the crossover method [14]. In a sim-ple crossover operation, two offspring are born by one crossoveroperation. In this case, one of both elements is inferior to its parentsand the other element is superior to them generally. In SRS method,one superior offspring is produced by one crossover operation in
order to compensate for that case.A mutation operator produces new individuals that do not exist
in the parent generation by changing randomly selected genetic in-formation of a reproduced string. In the case of binary coding, themutation operator is processed by using the concept of complement.In other words, mutation simply means changing a 0 to a 1 and a 1to a 0. Fig. 12 shows the mutation operation mentioned above.2. Advanced Operators
De Jong (1975) proposed various advanced operators such asthe elitist model, expected value model, elitist expected value model,crowding factor model to improve the performance of GA exceptoperators-reproduction, crossover and mutation mentioned above[19]. In GA, several control parameters such as the population size(N), the crossover probability (Pc), the mutation probability (Pm),the generation gap (G) are appropriately set to solve the given optimi-zation problem.
The population size (N) means the number of individuals to beproduced in a generation. Generally, as the population size increases,the performance of GA is improved but computational time is in-creased in proportion. Therefore, we must consider the tradeoff be-tween performance and computational time of GA to determinethe population size. Even if the population size varies according tocharacteristics of the given problem, it generally tends to show agood result when the population size increases in proportion to thecomplexity of the problem. The probability to crossover selectedindividuals in order to produce offspring is the crossover probability(Pc). Complement of the crossover probability (1-Pc) is the proba-bility to duplicate their parent individual. If the crossover probabilityequals to 0, then all offspring to be produced duplicate their parent.The mutation probability heavily affects the performance of GA.Mutation is an important driving force to evolve an organism in anature system. Generally, the mutation probability is much smallerthan 1.0 and in inverse proportion to the population size. Also, DeJong proposed that the result using the flexible mutation probabilitywas better than the result using the fixed Pm [19]. Generation gap(G) was introduced by De Jong to permit the overlapping popula-tion in multi-modal function [19]. Generation gap is the probability toreplace the current population by the reproduced offspring in order
λ = −
2 − f'max
f'max---------------⎝ ⎠⎛ ⎞log
xmax----------------------------
Fig. 11. Example of simple crossover.
Fig. 13. Best case (1).
Fig. 12. Example of mutation operator.
Optimal design of multi-nozzle etching process for shadow mask 1525
Korean J. Chem. Eng.(Vol. 26, No. 6)
to produce individuals of the next generation. Therefore, G has avalue between 0 and 1. If G is 1, then this means non-overlappingpopulation; if G is not 1, in means overlapping population. For mostoptimization problems, it was said that the non-overlapping popu-lation model was superior to the overlapping population model.3. Computational Results
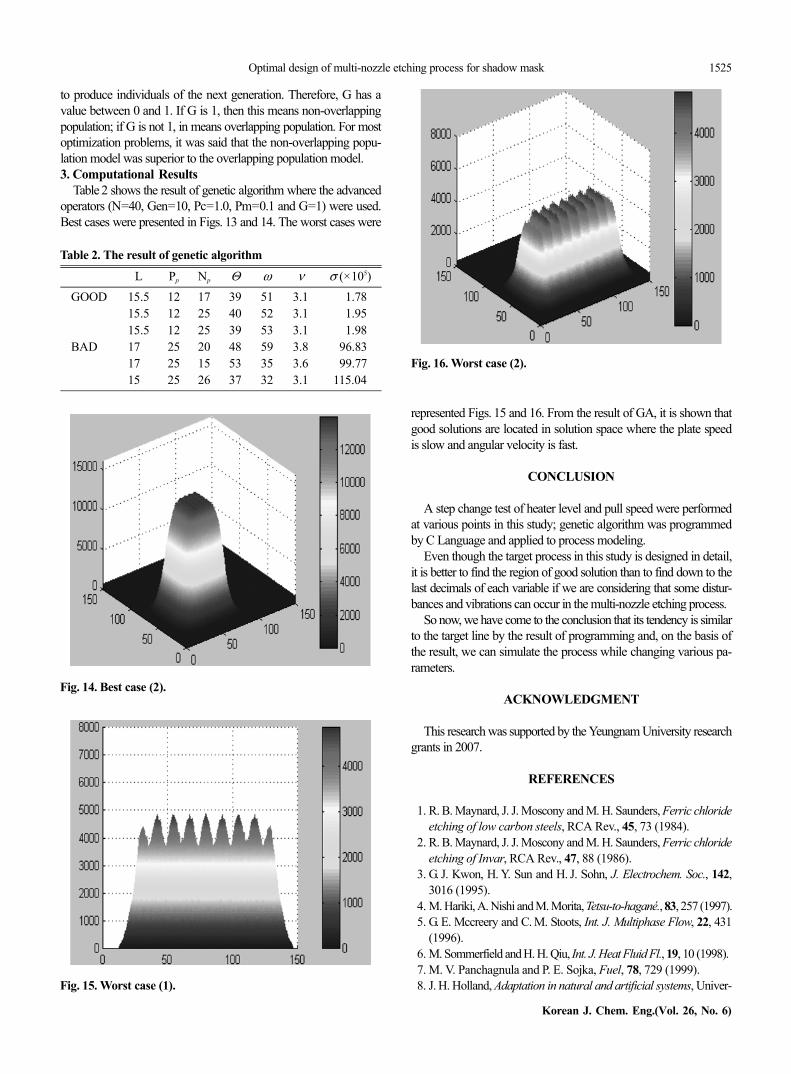
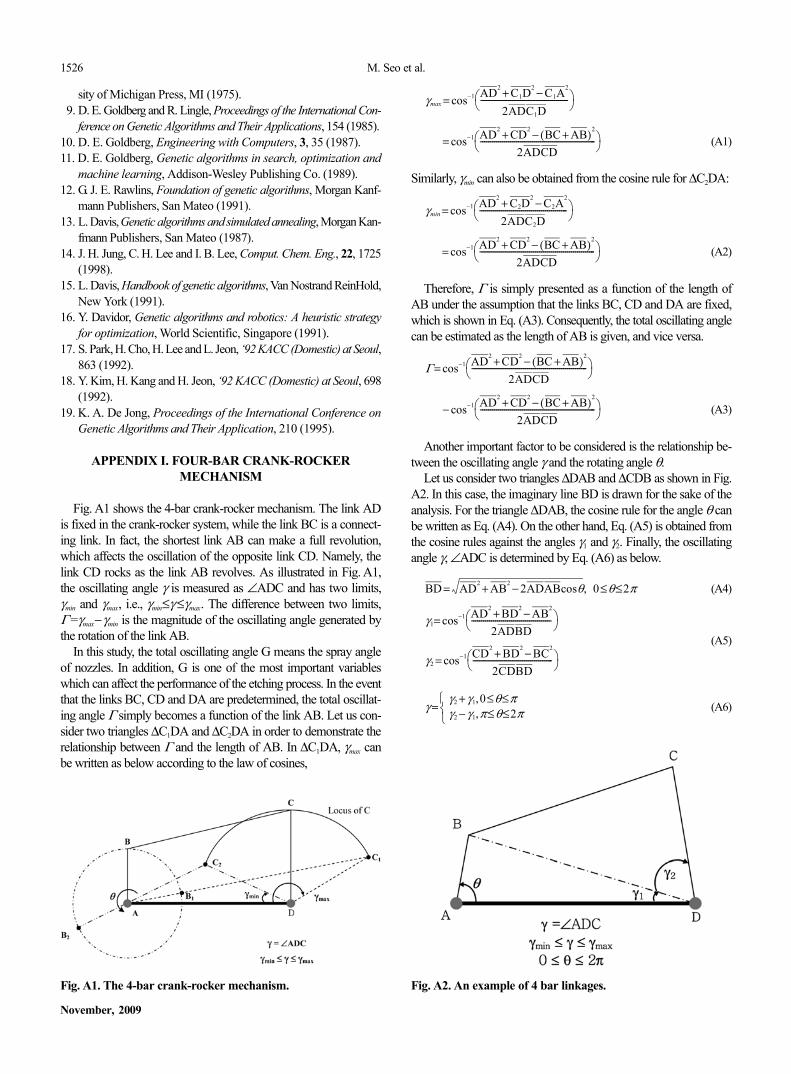
Table 2 shows the result of genetic algorithm where the advancedoperators (N=40, Gen=10, Pc=1.0, Pm=0.1 and G=1) were used.Best cases were presented in Figs. 13 and 14. The worst cases were
represented Figs. 15 and 16. From the result of GA, it is shown thatgood solutions are located in solution space where the plate speedis slow and angular velocity is fast.
CONCLUSION
A step change test of heater level and pull speed were performedat various points in this study; genetic algorithm was programmedby C Language and applied to process modeling.
Even though the target process in this study is designed in detail,it is better to find the region of good solution than to find down to thelast decimals of each variable if we are considering that some distur-bances and vibrations can occur in the multi-nozzle etching process.
So now, we have come to the conclusion that its tendency is similarto the target line by the result of programming and, on the basis ofthe result, we can simulate the process while changing various pa-rameters.
ACKNOWLEDGMENT
This research was supported by the Yeungnam University researchgrants in 2007.
REFERENCES
1. R. B. Maynard, J. J. Moscony and M. H. Saunders, Ferric chlorideetching of low carbon steels, RCA Rev., 45, 73 (1984).
2. R. B. Maynard, J. J. Moscony and M. H. Saunders, Ferric chlorideetching of Invar, RCA Rev., 47, 88 (1986).
3. G. J. Kwon, H. Y. Sun and H. J. Sohn, J. Electrochem. Soc., 142,3016 (1995).
4. M. Hariki, A. Nishi and M. Morita, Tetsu-to-hagané., 83, 257 (1997).5. G. E. Mccreery and C. M. Stoots, Int. J. Multiphase Flow, 22, 431
(1996).6. M. Sommerfield and H. H. Qiu, Int. J. Heat Fluid Fl., 19, 10 (1998).7. M. V. Panchagnula and P. E. Sojka, Fuel, 78, 729 (1999).8. J. H. Holland, Adaptation in natural and artificial systems, Univer-
Table 2. The result of genetic algorithm
L Pp Np Θ ω ν σ (×105)GOOD 15.5 12 17 39 51 3.1 001.78
15.5 12 25 40 52 3.1 001.9515.5 12 25 39 53 3.1 001.98
BAD 17.0 25 20 48 59 3.8 096.8317.0 25 15 53 35 3.6 099.7715.0 25 26 37 32 3.1 115.04
Fig. 14. Best case (2).
Fig. 16. Worst case (2).
Fig. 15. Worst case (1).
1526 M. Seo et al.
November, 2009
sity of Michigan Press, MI (1975).9. D. E. Goldberg and R. Lingle, Proceedings of the International Con-
ference on Genetic Algorithms and Their Applications, 154 (1985).10. D. E. Goldberg, Engineering with Computers, 3, 35 (1987).11. D. E. Goldberg, Genetic algorithms in search, optimization and
machine learning, Addison-Wesley Publishing Co. (1989).12. G. J. E. Rawlins, Foundation of genetic algorithms, Morgan Kanf-
mann Publishers, San Mateo (1991).13. L. Davis, Genetic algorithms and simulated annealing, Morgan Kan-
fmann Publishers, San Mateo (1987).14. J. H. Jung, C. H. Lee and I. B. Lee, Comput. Chem. Eng., 22, 1725
(1998).15. L. Davis, Handbook of genetic algorithms, Van Nostrand ReinHold,
New York (1991).16. Y. Davidor, Genetic algorithms and robotics: A heuristic strategy
for optimization, World Scientific, Singapore (1991).17. S. Park, H. Cho, H. Lee and L. Jeon, ‘92 KACC (Domestic) at Seoul,
863 (1992).18. Y. Kim, H. Kang and H. Jeon, ‘92 KACC (Domestic) at Seoul, 698
(1992).19. K. A. De Jong, Proceedings of the International Conference on
Genetic Algorithms and Their Application, 210 (1995).
APPENDIX I. FOUR-BAR CRANK-ROCKERMECHANISM
Fig. A1 shows the 4-bar crank-rocker mechanism. The link ADis fixed in the crank-rocker system, while the link BC is a connect-ing link. In fact, the shortest link AB can make a full revolution,which affects the oscillation of the opposite link CD. Namely, thelink CD rocks as the link AB revolves. As illustrated in Fig. A1,the oscillating angle γ is measured as ∠ADC and has two limits,γmin and γmax, i.e., γmin≤γ ≤γmax. The difference between two limits,Γ=γmax−γmin is the magnitude of the oscillating angle generated bythe rotation of the link AB.
In this study, the total oscillating angle G means the spray angleof nozzles. In addition, G is one of the most important variableswhich can affect the performance of the etching process. In the eventthat the links BC, CD and DA are predetermined, the total oscillat-ing angle Γ simply becomes a function of the link AB. Let us con-sider two triangles ∆C1DA and ∆C2DA in order to demonstrate therelationship between Γ and the length of AB. In ∆C1DA, γmax canbe written as below according to the law of cosines,
(A1)
Similarly, γmin can also be obtained from the cosine rule for ∆C2DA:
(A2)
Therefore, Γ is simply presented as a function of the length ofAB under the assumption that the links BC, CD and DA are fixed,which is shown in Eq. (A3). Consequently, the total oscillating anglecan be estimated as the length of AB is given, and vice versa.
(A3)
Another important factor to be considered is the relationship be-tween the oscillating angle γ and the rotating angle θ.
Let us consider two triangles ∆DAB and ∆CDB as shown in Fig.A2. In this case, the imaginary line BD is drawn for the sake of theanalysis. For the triangle ∆DAB, the cosine rule for the angle θ canbe written as Eq. (A4). On the other hand, Eq. (A5) is obtained fromthe cosine rules against the angles γ1 and γ2. Finally, the oscillatingangle γ, ∠ADC is determined by Eq. (A6) as below.
(A4)
(A5)
(A6)
γmax = cos−1 AD2 + C1D
2 − C1A
2
2ADC1D--------------------------------------------⎝ ⎠⎛ ⎞
= cos−1 AD2 + CD2
− BC + AB( )2
2ADCD----------------------------------------------------------⎝ ⎠⎛ ⎞
γmin = cos−1 AD2 + C2D
2 − C2A
2
2ADC2D--------------------------------------------⎝ ⎠⎛ ⎞
= cos−1 AD2 + CD2
− BC + AB( )2
2ADCD----------------------------------------------------------⎝ ⎠⎛ ⎞
Γ = cos−1 AD2 + CD2
− BC + AB( )2
2ADCD----------------------------------------------------------⎝ ⎠⎛ ⎞
− cos−1 AD2 + CD2
− BC + AB( )2
2ADCD----------------------------------------------------------⎝ ⎠⎛ ⎞
BD = AD2 + AB2
− 2ADABcosθ, 0 θ 2π≤ ≤
γ1= cos−1 AD2 + BD2
− AB2
2ADBD----------------------------------------⎝ ⎠⎛ ⎞
γ2 = cos−1 CD2 + BD2
− BC2
2CDBD----------------------------------------⎝ ⎠⎛ ⎞
γ =
γ2 + γ1 0 θ π≤ ≤,γ2 − γ1 π θ 2π≤ ≤,⎩
⎨⎧
Fig. A1. The 4-bar crank-rocker mechanism. Fig. A2. An example of 4 bar linkages.
Optimal design of multi-nozzle etching process for shadow mask 1527
Korean J. Chem. Eng.(Vol. 26, No. 6)
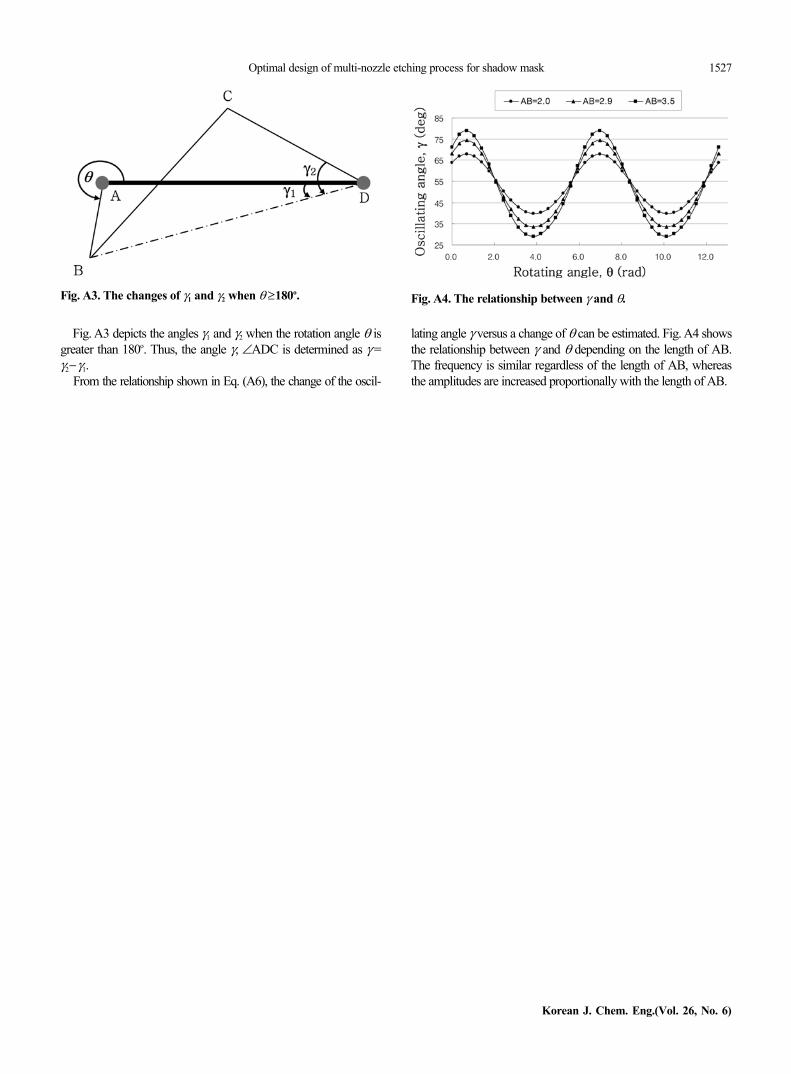
Fig. A3 depicts the angles γ1 and γ2 when the rotation angle θ isgreater than 180o. Thus, the angle γ, ∠ADC is determined as γ=γ2−γ1.
From the relationship shown in Eq. (A6), the change of the oscil-
lating angle γ versus a change of θ can be estimated. Fig. A4 showsthe relationship between γ and θ depending on the length of AB.The frequency is similar regardless of the length of AB, whereasthe amplitudes are increased proportionally with the length of AB.
Fig. A4. The relationship between γ and θ.Fig. A3. The changes of γ1 and γ2 when θ ≥180o.