Opportunity Day FS2018 JMART Group · Financial services Develop application and digital...
106
1 Opportunity Day FS2018 JMART Group
Transcript of Opportunity Day FS2018 JMART Group · Financial services Develop application and digital...

1
Opportunity Day FS2018 JMART Group

2
Disclaimers
The information contained herein is intended to represent the Company’s operating and financial position at a given point in time and may also contain forward looking information which only reflects expectations based on the prevailing geo-political, economic and non-controllable factors. Such information has been obtained from sources believed to be most reliable and the means in analyzing and preparation of such information for disclosure are based on approve practices and principles in the investment industry. The views are based on assumption subject to various risks and uncertainties and no assurance is made as to whether such future events will occur. No assurance is made as to the accuracy or completeness of information presented in this document.
2 Jaymart Public Company Limited

3
Jaymart Group Group of Companies
Debt Collection and Management
55.8%
Personal Loan Property Development
67.5%
Home and Commercial Appliance
24.9% Listed Listed Listed
Listed
95.6% 99.9%
Mobile Business
80.0%
Fintech & Start-up
99.9% 99.9%
9.8% 0.3%
60.0% 55.0%
18.9% 3.12%

4
Group Turnaround

5
03
AIS partnership and recover
business
Q1/2019
Expected to be positive in
Q1/2019 onward.
Fully amortized bad debt
portfolio significantly boost
up JMT earning
DDLP expect to
commercialize and
realized revenues Capital increase to
enhance C4C business
Jaymart Group JMART Earning Growth Path in 2019
Q2/2019
Q3/2019
Q4/2019
Newera Condominium
complete and transfer
Capital increase for new
business expansion
Continue positive and
partnership conclude
Highest cash collection with
significant fully amortized
portfolio
Highest season for
mobile phone business

6
Synergy Chapter IV

Customer data 5.2 million.
Data Warehouse
Premium sold to Jaymart Group amount 15.3
million baht
Insurance Services
JAS Asset acquired NPA for sell 17.2
million baht.
NPA
JMT provide collection service to J
Fintech 32 million baht and Singer
17 million baht
Collection Services
2018 Mobile Phone
Jmart–Singer 410 million baht
Jmart–ITJ 822 million baht
Jmart–JMT 5 million baht
Mobile Phone Sale
Jaymart Group Synergy Results

8
Jaymart Group Synergy in 2019
Collection Services Recruit new client for J Fintech and Mobile Phone + Insurance Services
Sell mobile phone and SIM
Sell mobile phone and SIM in ITJ Junction
Distribution and touch point for J Fintech, JP Insurance
Financial services
Develop application and digital transformation

9

10
J Fintech Loan Portfolio Size and Portfolio Type
Loan Portfolio Type Loan Portfolio Size (Outstanding Balance)
Unit: MB Unit: MB
As of Ending of 2018
633
2,209
3,258
4,028
2015 2016 2017 2018
3,592 , 89%
199 , 5%
237 , 6%
Revolving Loan
Term Loan
Factoring

11
J Fintech Revenues Performance
Total Revenues
Unit: MB
Revenues Composition
40
257
560
1,016
2015 2016 2017 2018
530, 95%
30, 5%
1, 0%
876, 86%
128, 13%
12, 1%
Interest Income
Fee and others
Bad Debt Recovery
2018
2017

12
J Fintech Bad Debt Recovery: Hidden Gem
Bad Debt Recovery Revenues
Unit: MB
Collection Rate (Normal + X Day)
0.58 0.57
1.44
3.23
6.57
Q4/2017 Q1/2018 Q2/2018 Q3/2018 Q4/2018
97.0%
96.4% 96.2%
96.3%
96.9%
97.7% 97.7%
Jul-18 Aug-18 Sep-18 Oct-18 Nov-18 Dec-18 Jan-19
Target Collection Rate > 97%

13
J Fintech 2019 Forward Looking
1. Quality Loan Portfolio
2. Collection Performance Improved
3. New Business
Key Initiatives
• Credit Center control credit quality. • Target new loan 1,500 million baht in 2019. Expect Loan Receivable reach to 5,000 million baht. • Better quality borrower reflect less provision in doubtful allowance.
• Target Normal to Xday Collection rate achieve at 97.7%.
• Bad debt recovery revenues target 60 million baht in 2019. Special team will be assigned to recover bad debt in write off portfolio.
• Factoring end AR 500 million Baht as ending of 2019
• Revenues from factoring growth as factoring portfolio expand
info
info

14
J Fintech 2019 Forward Looking
Portfolio Size Target (Principle Balance)
Unit: MB
Bad Debt Recovery Revenues Target
633
2,209
3,258
4,028
5,000
2015 2016 2017 2018 2019(Target)
Target Principle Balance in 2019
1
12
60
2017 2018 2019 (Target)
Target Bad Debt Recovery in 2019 = 60 million baht or average 5 million per month.
Revenues from interest income increase as portfolio expand
Unit: MB

15
J Fintech 2019 Profit Equation
2019 2018
Revenues
Opex
Provision
Interest Expenses
Net Profit
• Average yield for all product
• Opex average
• Provision expenses depends on Collection ratio performance. • Target of Collection Ratio Normal to X-day is more 97% each month.
Average Yield
24%
7%
8%
4%
Profit 5%
(percent to Loan AR)

16
J Fintech Source of Financing in 2019 and Next
2019 Internal Cash Flow (Self
Funding) and Partnership .
2021 Equity Funding
Debentures and Bank Facilities
. 2021
2018
2020
2019
2020 Initial Public Offering .

JMART Opportunity Day 2019

© J Ventures 2018
DIGITAL LENDING MARKET PLACE

© J Ventures 2018
ACQUISITION (Active & Passive)
Active mode is pre-define with partners and collecting others information even
when they don’t need a loan yet. Passive mode will be more effectively in the
long run for acquisition and data analytic. JFIN
Digital Lending Platform
TRIPLE CREDIT SCORING
Non-financial Information and spending behavior weight greater score nowadays which needs to combine with current financial
information.
TCL (Total Credit Limit)
Starting process to get spending behaviour on TCL we provide to them
on instant basis. Also integrating with their business
performance.
DISTRIBUTED LEDGER TECHNOLOGY (DLT)
Smart Contract and Decentralized will guide to more efficiency process.

LocationBank
Statement
Spending History
Financial data from partners
data from Jmart group
Purchasing power
Spending pattern
Extravagant Level
Personal Data
Salary Slip
Personal Financial
Application
Spending data from partners
Spending Behaviour
Facebook Post
Psychology Questions
Reputation Score
Lifestyle Score
APPROVE 80% CREDIT
Purchasing Power
Spending Behaviour
Social Behaviour
PARTNER’S INFORMATION BASED LENDING ACTIVE APPROACH

OUR CREDIT SCORING
Apply
Round 1 Round 2
Good borrower Increase TCL and credit score for the good behavior borrower
+Bad borrower Decrease TCL and credit score for the good behavior borrower
-
Apply

70 % Need
40K TCL
85 % Need
50K TCL
80 % Need
35K TCL
95 % Need
45K TCL
TRIPLE CREDIT SCORING

© J Ventures 2018
How ICO-JFIN COIN has impacted to JMART Group?
How J Ventures plan to deploy our JFIN for Thailand?

LOOK BACK 2018

© J Ventures 2018
>>
16-01-2018 1st Thailand ICO by Listed Companies Official Announcement JFIN,
30-01-2018 JFIN ICO Press Conference
14-02–2018 JFIN Token Pre-Sale was started
16-02–2018 JFIN Token Pre-Sale had been sold out within 55 hours
02-05–2018 1st Trading Day of JFIN on Coin Asset
2017 Idea started and blockchain technology started to adopt in Thailand
21 -06–2018 JVC and MFEC signed MOU to develop Payment Gateway Solution
21 -06–2018 JVC and FN signed MOU to use DLP in FN store
The Timeline
JFIN Coin = 4.19 THB

© J Ventures 2018
JFIN Coin = 3.22 THB
26-09-2018 JVC invested Pra-in Fintech to thrive Payment Gateway
18-10–2018 The 1st Crypto to redeem products in Thailand
JFIN Coin = 3.22 THB
16-10–2018 JVC + Microsoft Thailand+R3 signed MOU to develop JFIN DDLP
04-02-2019 JFIN Coin started trade on Satang Pro
13-11–2018 JFIN Coin Team presented DDLP in Singapore Fintech Expo 2018
07-11–2018 JFIN Coin Team got the popular vote from Fintech Challenge 2018
09-02-2019 1st Auction Crypto in Thailand Mobile Expo via VFIN app
JFIN Coin = 3.00 THB
JFIN Coin = 2.32 THB
01/2019
08/2018
17-10–2018 DLP ANNOUNCEMENT: www.ป�า.com + JFIN WALLET OFFICIAL LAUNCH
• Credit Scoring • E-KYC*, • E-Consent*, • Digital loan*

© J Ventures 2018
THE 1ST ICO BY LISTED COMPANY IN THAILAND

© J Ventures 2018
THE 1ST CRYPTO TO REDEEM PRODUCTS

© J Ventures 2018
THE 1ST CRYPTO AUCTION IN THAILAND

© J Ventures 2018
15Offline
ActivitiesMOU Signed
4Exchange / Portal
Listed
3

© J Ventures 2018
Digital Lending Platform
BLOCKCHAIN PLATFORM
LENDING PRODUCTS
Front End Customer Acquisition
JVC LOAN PLATFORM
CORPORATE LENDING PARTNERS CONSUMER LENDING PARTNERS
ACQUISITION ACTIVE
THIRD PARTY LOAN
CORE LENDING SYSTEM
Product Mgmt.
Contract Mgmt.
Cash out/ Payback Loan Aging
Customer Mgmt.
PRO0F OF STAKE 15/03/19
PASSIVE LOAN
LENDING KYC
CREDIT SCORING (J FINTECH & SOCIAL SCORING)
CONTRACT APPROVAL
JMONEY | 17/10/18 ONE TIME LOAN 18/12/17
REVOLVING LOAN 14/08/18
PAY ANYDAY | 01/04/19
LENDING PRODUCTSONE TIME LOAN SYNDICATED LOANREVOLVING LOAN
JMONEY 17/10/18
PAY ANYDAY 01/04/19
FASTLOAN 19/10/18
ONE TIME LOAN FOR DTAC PILOT #1 18/12/17
JFIN CLS | 01/10/19 Deep Spark | 01/06/19 JFIN DLP | 01/07/19
DIGITAL LENDING MARKETPLACE
80%
100%
100%
100% 100% 100%
38%
100%
60%
68%
100%
100%
72%
42%
DEBT CONSOL REFIN 01/06/19
67% 0%
FEATUREJ SCORING (JFT&SOCIAL)
15/06/19CUSTOMER PROFILE 01/04/19
E-WALLET 1/04/19
C-WALLET ITG 30/03/19
CHATBOT 17/10/18
PAYMENT GATEWAY 15/06/19
KYC 17/10/18 100% 90% 76%38% 0% 0%
LOAN SUGGESTION 15/06/19 0% 0%
REVOVLING LOAN FOR DTAC PILOT # 2 14/08/18
J LOAN 15/06/19
TERM LOAN
J P2P LOAN 15/09/19
76%

© J Ventures 2018
Users
10,000
10 M.Lending Capital

© J Ventures 2018
100 M.
MULTIPLE LENDING PRODUCTSรายได�ต�อเดอน Searchรปแบบการก� การผ�อนชำระ
ทางเลอกเพอการก�ยม
Nano FinancePersonal Loan Pico Finance Enhance Airtime
2019 Target Loan Amount

© J Ventures 2018
497 M.Deferred Income
JFIN Coin ICO
75%
20%
5%Others, Legal Fee ,
Regulation and Liabilities (24,893,965.56)
Management & Operation (99,575,862.27)
Platform Development (373,409,483.52)
PLATFORM DEVELOPMENT 23% System Development (114,512,241.61)
25% M&A (124,469,827.84)
17% MA (84,639,482.93)
5% Operation (24,893,965.56)
2.5% Marketing (12,446,982.78)
2.5% Miscellaneous (12,446,982.78)

© J Ventures 2018
Estimated P&L from ICO
2019 2020
DDLP REV RECOGNITION
DEVELOPMENT COST
82.98M. 165.96M.
41.70M. 69.84M.
* Illustration of our forecast numbers from ICO
2021
165.96M.
70.56M.
GROSS PROFIT 41.28M. 96.11M. 95.39M.
NET PROFIT/LOSS xx.xxM. xx.xxM. xx.xxM.
2022
82.96M.
52.56M.
30.39M.
xx.xxM.
497 M
234 M
263 M
* depends on M&A and Operations cost

© J Ventures 2018
How ICO-JFIN COIN has impacted to JMART Group?
How J Ventures plan to deploy our JFIN for Thailand?

2019 MOVE FORWARD

© J Ventures 2018
2019
>>
Q1 2019 Blockchain Network and Smart Contracts
Q4 / 2019 JFin P2P Lending Ecosystem* (subjected to BOT)
Q2 / 2019 E-Wallet and Crypto-Wallet
7 Mar 2019 JFIN Coin in Corda Day Singapore
19-21 Mar 2019 JFIN Coin in Money 20/20 Asia, Singapore
Q2 2019
Q3 2019
Q1/2020 Big Data Analysis & AI Machine Learning

© J Ventures 2018
TOKEN DEVELOPMENT
15/03/19EXCHANGE ITG.
15/05/19
DAPP STORE
UNIVERSAL POINT SYSTEM
1/05/19
VOTING SYSTEM
20/04/19
CIRCLE TRADING
7/02/19
PRO0F OF STAKE
15/03/19
28%
0%
90%
78% 0% 76%
TOKENOMICS

© J Ventures 2018
JFIN HYBRID BLOCKCHAIN PLATFORM Best of Breed JFIN Blockchain Technology
LENDING PLATFORM PAYMENT PLATFORM
SMART CONTRACT PLATFORM
ASSET OWNERSHIP PLATFORM

© J Ventures 2018
JFIN TOKENOMICS
JFIN WALLETUNIVERSAL
POINT SYSTEM
EXCHANGE
E-VOTING
DIGITAL ASSET CERTIFICATE
AUCTION and CYCLE TRADING
JFIN BLOCKCHAIN
Develop Technology and Tools for businesses and developers to create blockchain based apps
LENDING Platform

© J Ventures 2018
Debt Crowdfunding Platform
BORROWER
LENDER
ESCROW
PLATFORM
Registar
Securities Depository
Securities

© J Ventures 2018
Next Exchange listing
Bitkub APRIL 2019


17
Debt Collection and Management
JMT Network Services Public Company Limited
*Market Cap between 10,000 – 30,000 M.THB
SET Awards 2018 Best Company Performance Award Nomination 2018*

18
JMT Network Services Business at a glance
Debt Collection Business Debt Acquisition Business Insurance Business
Business and Clients
Market Positions
Strength
• No.1 in debt collection • No.1 in unsecured non-performing debt management
• Proven tracking record and experienced more than 20 years
• Data base system over 3 million account all nationwide
• Award Winning for Debt Collection Services
• IT and data base system • Well training staff
• Connect through synergy channel of Jaymart Group of Companies
• InsurTech / Synergy

19
JMT Q4/2018 Cash Collection and Revenues Performance
Q4/2018 Debt Acquisition Revenue Trend Q4/2018 Cash Collection
“All time high in Cash Collection in Q4/2018”
Unit: M.Baht Unit: M.Baht
483 514
548 608
730
Q4/2017 Q1/2018 Q2/2018 Q3/2018 Q4/2018
Cash Collection 51% growth yoy
289
341 351 369
420
Q4/2017 Q1/2018 Q2/2018 Q3/2018 Q4/2018
Debt acquisition revenue growth 45% yoy.

20
JMT Q4/2018 Revenues Performance
65
289
355
87
420
26
533
Debt collection Debt Acquisition Insurance Total
Q4/2017
Q4/2018
+50%
+45%
+45%
Q4/2018 Revenues growth 50% yoy

21
JMT 2018 Debt Collection Performance
Commission Rate and Success Rate Collection Services Portfolio Size
“Success Rate keep going higher, collection revenues increased”
2.9% 3.6% 4.8% 4.8%
7.7% 8.3% 9.3%
22.6%
15.8%
10.3%
6.9% 7.4%
10.3% 10.5%
2012 2013 2014 2015 2016 2017 2018
% Success rate
% Commission rate
13,707 13,950 15,954
25,367
18,291
22,353 20,133
2012 2013 2014 2015 2016 2017 2018
Unit: M.THB

22
JMT 2018 Debt Acquisition Milestones
6,429 13,542
22,017
31,679
63,223
88,683
108,283
124,554
145,557
2010 2011 2012 2013 2014 2015 2016 2017 2018
Secure Loan
Hire Purchase
Personal Loan
Total
Secure Loan “The Next S-Curve Growth”

23
JMT 2018 Cash Collection Performance
1 42 86 102 160 154 136 194 254 14 23 54 73
173 194 153 228
417 603
916
1,227
17 15 27 82
182 211 256
350
384 287
737
919
31 39 81 156
397 491 511
739
954 1,026
1,847
2,399
0
500
1000
1500
2000
2500
3000
Y2006 Y2007 Y2008 Y2009 Y2010 Y2011 Y2012 Y2013 Y2014 Y2015 Y2016 Y2017 Y2018
Revenue 100%
Revenue IRR
Amortization of investment
Cash collection
Best Record in Cash Collection with potential to grow revenues
MB

24
JMT 2018 Debt Acquisition: Portfolio and Investment
Collected as % of Investment
473% 245% 391% 489% 260% 268% 197%
Investment(MB) 39 16 49 74 122 384 399
1,031 166
1,041 1,745
2,446
7,114
8,474
2006 2007 2008 2009 2010 2011 2012
OS Balance
Collection
Investment

25
JMT 2018 Debt Acquisition: Portfolio and Investment
Collected as % of Investment
130% 115% 86% 103% 58% 10% 90%
Investment (MB) 439 1,613 1,319 906 1,598 2,583 9,541
145,557
Total
9,663
31,544
25,460
19,600 16,271
21,003
2013 2014 2015 2016 2017 2018
OS Balance
Collection
Investment

26
JMT 2018 Revenues Performance
242
1,110
-
1,356
289
1,480
96
1,867
Debt collection Debt Acquisition Insurance Total
2017
2018
+38%
+33%
+19%
2018 Revenues growth 38% yoy

27
JMT 2018 Gross Profit and SG&A
152
235 198 197
248 272 285 279
56% 62% 57%
55% 62% 60% 59%
52%
-100%
-80%
-60%
-40%
-20%
0%
20%
40%
60%
80%
-
50
100
150
200
250
300
Q1/17 Q2/17 Q3/17 Q4/17 Q1/18 Q2/18 Q3/18 Q4/18
Gross Margin % GP
2018 %SG&A to Revenues 2018 Gross Margin
Unit: M.Baht
62%
%GP Debt only
17.1%
15.1% 16.5%
13.9% 15.5%
18.6%
16.0% 14.9%
Q1/17 Q2/17 Q3/17 Q4/17 Q1/18 Q2/18 Q3/18 Q4/18

28
JMT 2018 Net Profit: Quarterly Base Line lifted up
73
125
99 99
116 120
138
161
Q1/2017 Q2/2017 Q3/2017 Q4/2017 Q1/2018 Q2/2018 Q3/2018 Q4/2018
2X Net Profit From Q1/2017 to Q4/2018

29
JMT Investment Highlights
Dividend Yield Net Profit (Debt Business)
IBD/Equity Ratio EPS
Unit: M. Baht
1.16 0.96
1.21 1.14
2015 2016 2017 2018
Unit: times
95
290
396
535
2015 2016 2017 2018
Unit: Baht (adjusted 0.50 par)
0.14
0.39
0.53 0.60
2015 2016 2017 2018
0.9%
5.4%
3.6%
4.8%
2558 2559 2560 2561
Unit: %
(adjusted 0.50 par)
Unit: Times

30
JMT Investment Highlights
ROA ROE
P/BV P/E
8.1
16.1 18.6 17.7
2015 2016 2017 2018
3.2
8.5
10.6 9.8
2015 2016 2017 2018
5.81
3.03 3.49
2016 2017 YTD
22.84 21.00
23.54
2016 2017 YTD
Unit: % Unit: %
Unit: Times Unit: Times

31
JMT 2019 Forward Looking
1. Debt Collection Business
2. Debt Acquisition Business
3. Insurance Business
Key initiatives
• Maintain portfolio at least 20,000 M.THB. • Target 30% growth in debt collection services revenues by improving collection
efficiency. • Synergy services to Jaymart Group of companies for collection services
• Target to acquire distress debt with budget 4,500 million baht in 2019. • Fully Amortized Revenues will significantly increase since 2019 onward. • Target to achieve cash collection more than 3,000 million baht in 2019 • Secure Loan Bad Debt is the next S-curve to JMT
Info
• Revenues target 300 million baht in 2019. Focus on net margin not sale revenues. • Diversify portfolio toward less loss ratio such as non-motor insurance by target 70%
motor insurance with less loss ration and 30% non-motor insurance. • InsurTech: Surewarp Application • Cost control

32
JMT Fully Amortized Portfolio
OS Balance of 100% Fully Amortized Number of Portfolio
40
79
43
99
Fully Amortized IRR
2017
2018
+39%
“The potential of 100% fully amortized revenue will significantly boost up earning in 2019 onward”
+3
17,600
106,954
24,529
121,038
30,000
115,038
Fully Amortized IRR
2017
2018
2019 (Estimated)
33
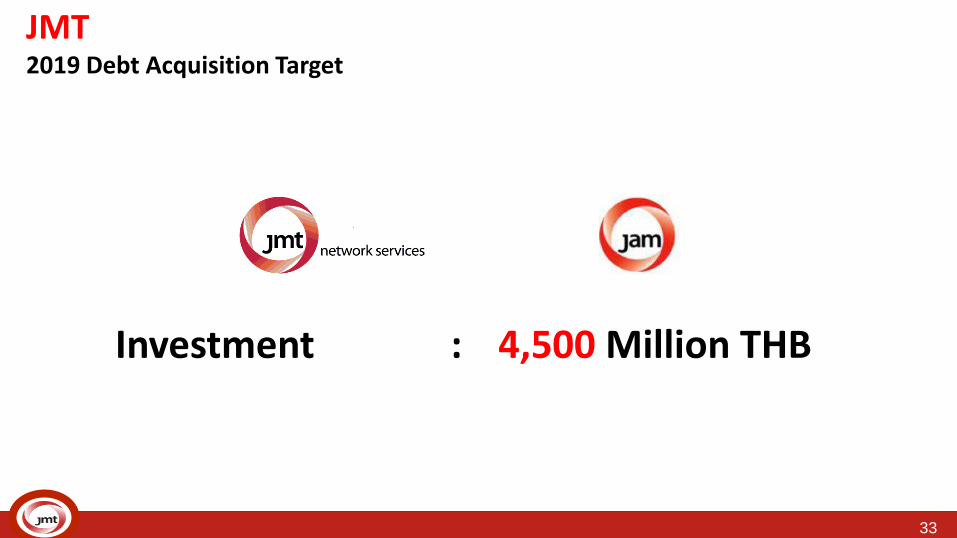
JMT 2019 Debt Acquisition Target
Investment : 4,500 Million THB

34
JMT 2018 Gross Profit and SG&A

JP Insurance PCL.2018 Performance#JPInsurTech#InsurTechAwakening#Goingforward!

www.jpinsurance.co.th
ภาพรวมดานการเงนและบญช
เปรยบเทยบเบยรบรวม ป 2560-2561 เปรยบเทยบเบยประกนภยรบ โดยแบงตามประเภทงาน

www.jpinsurance.co.th
คณภาพของกลมตวแทน/นายหนาพนธมตรของเจพ ประกนภย
สดสวนงาน Motor & Non-Motor
คดเปน 100%
Total: 226 ราย
คดเปน 57.14%
Active: 131 ราย
คดเปน 60%
L/R<65%: 137 ราย
Q3, 2018
คดเปน 100%
Total: 242 ราย
คดเปน 72.3%
Active: 175 ราย
คดเปน 65.7%
L/R<60%: 159 ราย
Q4, 2018
เพอการรบงานทมคณภาพมากขน JP จงปรบเกณฑการวดคณภาพกลมตวแทน/นายหนาจาก L/R = 65% เปน L/R = 60% ในไตรมาส 4
as at Q3, 2018 as at Q4, 2018
≤
L/R ≤ 65%
L/R ≤ 60%
as at Q3, 2018 as at Q4, 2018
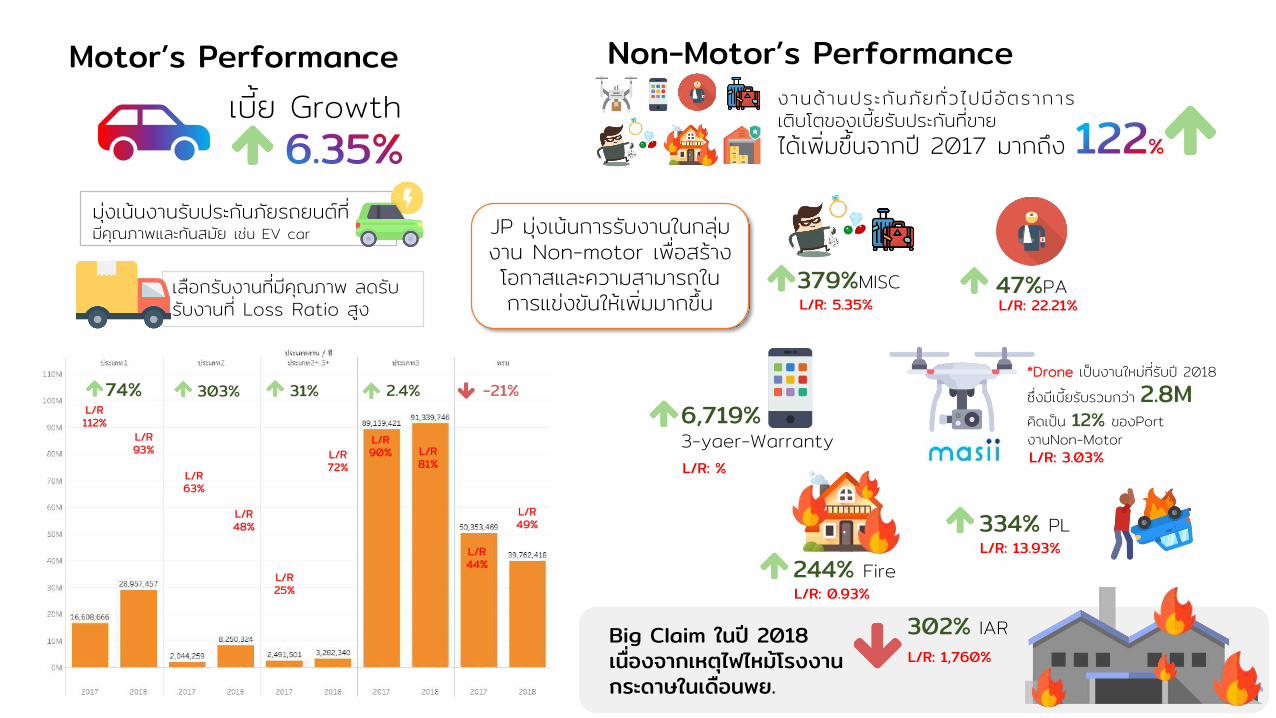
Motor’s Performance
เบย Growth
มงเนนงานรบประกนภยรถยนตทมคณภาพและทนสมย เชน EV car
เลอกรบงานทมคณภาพ ลดรบรบงานท Loss Ratio สง
L/R112%
L/R93%
L/R63%
L/R48%
L/R25%
L/R72%
L/R90% L/R
81%
L/R44%
L/R49%
74% 303% 2.4%31% -21%
Non-Motor’s Performance
งานดานประกนภยทวไปมอตราการเตบโตของเบยรบประกนทขาย
ไดเพมขนจากป 2017 มากถง
*Drone เปนงานใหมทรบป 2018
ซงมเบยรบรวมกวา 2.8Mคดเปน 12% ของPort
งานNon-Motor
47%PA379%MISC
6,719%3-yaer-Warranty
244% Fire L/R: 0.93%
L/R: %
L/R: 5.35% L/R: 22.21%
L/R: 3.03%
334% PL L/R: 13.93%
JP มงเนนการรบงานในกลมงาน Non-motor เพอสรางโอกาสและความสามารถในการแขงขนใหเพมมากขน
Big Claim ในป 2018 เนองจากเหตไฟไหมโรงงานกระดาษในเดอนพย.
302% IAR
L/R: 1,760%

Jaymart Public Company Limited 35
Mobile Business

Jaymart Public Company Limited 36
Mobile Business 2018 Mobile Update
No. of Mobile Unit Sold Mobile Business Sale Value
Unit: Million Unit: ‘000
1,132 1,217
1,070
2016 2017 2018
9,520 10,654
9,270
2016 2017 2018

Jaymart Public Company Limited 37
Mobile and Camera Business 2018 Revenues Breakdown
By Products: Mobile, Camera and Accessories By Distribution: Type: Retail VS Wholesale
79% 21%
Retial
Wholesale
94%
2%
3% 1%
Mobile
Camera
Accessories
Other

Jaymart Public Company Limited 38
Mobile and Camera Business Shop Type 2018
Jaymart 156
Smartphone 12
Jaycamera 10
Brand Shop 25
AIS 8
Total 211
Smartphone
Shops Breakdown Jaymart Brand Shop
AIS Shop
74%
5%
5%
12% 4%

Jaymart Public Company Limited 39
Mobile Business Brand Portfolio Mixed
2017 2018
44%
15%
37%
5%
47%
15%
32%
6% Samsung
iPhone
Chinese Brand
Other

Jaymart Public Company Limited 40
Mobile Business 2018 Gross Margin and ASP
Gross Margin Average Selling Price
Unit: Bath
17.0% 16.4%
13.6%
2016 2017 2018
7,871 8,162 8,223
2016 2017 2018
Unit: %

Jaymart Public Company Limited 41
Mobile Business Exclusive Partnership: SIM Subscriber
Boost up subscriber at Jaymart Shop and group of companies
Add Package
9,066
11,231
15,959
13,789 14,645
Oct-18 Nob-18 Dec-18 Jan-19 Feb-19
AIS Sim Subscriber Performance

Jaymart Public Company Limited 42
Mobile Business 2019 Forward Looking
1. Inventory Management
2. Revenues and Margin Focus
3. Cost Control
• Inventory level down from 2,000 million baht to 1,300 million baht as ending of 2018. • Target to reduce inventory less than 1,000 million baht.
• Revenues distribution channel will divert to less fixed cost channel such as direct sale or online to off line channel.
• AIS compensation revenues target 10 million per month on average. • Margin focus by target 15% margin
• Underperforming shop to be closed to reduce fixed cost. • Manpower cost control.

Jaymart Public Company Limited 43
Mobile Business Forward Looking
Synergy toward JMART Group

Jaymart Public Company Limited 44
Opportunity Day 2018

Jaymart Public Company Limited 45
JAS Asset Group of Business

Jaymart Public Company Limited 46
JAS Asset 2019 Forward Looking
1. Rental Space and Community Mall
2. Newera Condominium Project
3. F&B : Coffee Brand
• Expected to transfer half of unit for sale within Q4/2019. • Transfer complete in 2020. • Project value 520 million baht.
• Existing Project (ITJ, JAS and the Jas Urban) 1. Occupancy rate perform at a good level. 2. Expect to lift up rental per square meter 10-15% in 2019 • New Project (JAS Urban Amata Nakorn) Locate in a center of EEC and high density of population in Chonburi Light investment cost
Existing Branches 1. Same Store Sale Growth. 2. New Product added and Premium New Branches 1. Collaborate with Land Lord for new branches.
info
info
info

Jaymart Public Company Limited 47
48 Branches
Total Rental: 1,400 unit OCC Rate (Dec 2018): 87%

48
Occ rate : 94% (end of Dec 2018)
49
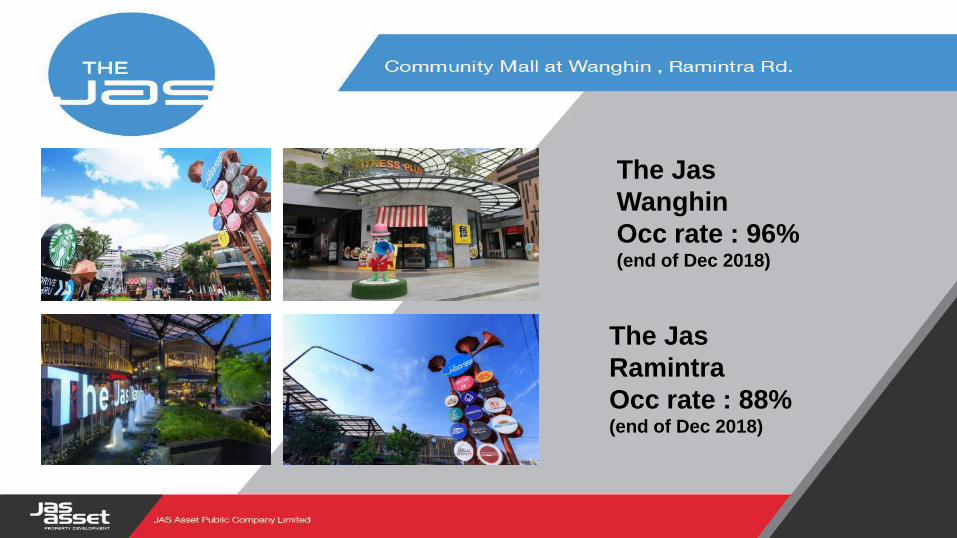
The Jas
Wanghin
Occ rate : 96% (end of Dec 2018)
The Jas
Ramintra
Occ rate : 88% (end of Dec 2018)

50
Community Mall Project
JAS Urban Amata Nakorn
Concept: Food and Fun Park Destination Total Area: 18 rai / 1 wah / 12 Ngarn Business Model: Light investment and high margin on the right location.

51
10 KM. Population 151,607 10 KM. Household 100,027
- Factory 1,127 - Labor 136,000
GPP at Current Market Price per capita 548,877

52

Jaymart Public Company Limited 53
Re-Grand Opening
Newera Condo Project Summary • Land Size : 1-3-88 Rai • Location: Ekamai-Ramintra
• Building : 1 Bldg. • Low Rise : 8 Floor • No. of Unit: 177 Unit • Expect to Complete: Late 2019
• Project Value: 520 million Baht
Ready to transfer in Q4/2019


6M
9M
14M 16M
Q1 Q2 Q3 Q4
Beans and Brown Revenue 2018
x Centralworld x XT Sansiri
x Spaces.
BRANCHES S
3 6 8 10

Revenue Projections
45
100
200
300
0
50
100
150
200
250
300
350
2018 2019 2020 2021
Revenue (in Millions)

REVENUE STREAM
COFFEE SHOPS
CASA LAPIN 15 BRANCHES
RABB COFFEE 6 BRANCHES
MERCHANDISES
CATERING SERVICE
BRAND COLLABORATION Casa Lapin x Pancake Café
Casa Lapin x Spaces

CASA LAPIN STORE MODEL
CLASSIC MODEL
ATTU SUVARNABHUMI CPN BANGNA
MAJOR RATCHAYOTHIN
BRIGHTON PATTAYA
RABBIT HOLE MONOCHROME XL COLLABORATION MODEL
SPACES CHAMCHURI
XT SANSIRI LADPRAO HILLS
SPACES EMPIRE
SPACES SUMMER HILL
X CENTRALWORLD
X MAJOR EKAMAI
X RATCHATHEWI
X 26
X BAD MOTEL
X ARI

Upcoming Projects
• Brighton Pattaya • Central Bangna • ATTU Suvarnabhumi • Major Ratchayothin

Model : Prime office
Coffee corner at Ladprao hills

CASA LAPIN MONOCHROME

CASA LAPIN XL SPECIALTY COFFEE & EATERY

Catering service
CLIENTS


Jaymart Public Company Limited 65
Revenues Breakdown
Unit: MB Unit: MB
Total Revenues
562
758
916
2016 2017 2018
629, 69%
250, 27%
37, 4%
Rental Income
Sale Income
Other Revenues

Jaymart Public Company Limited 66 66
Unit: MB
EBITDA Net Profit
5.7 6.4
-17
2016 2017 2018
Unit: MB
70
148 138
2016 2017 2018


Financial Highlights Y2018
Turn around :
Improving in revenue 22% from Y2017
and 25% YoY
Gross margin jumps 50% from Y2017 and
60% YoY
EBIT improves 351% from Y2017 and
121% YoY
Improving in provision for bad debts 4% YoY and no more restructuring AR
Improving in NPL from 12.6% in Q3 2018
to 10.5% in Q4 2018.
Growing in Total Asset from increasing AR
portfolio 49% from Y2017
Unit : MB
Statement of income Y2018 Y2017 Q4'2018 Q4'2017
Total revenue 2,888.0 2,363.4 712.4 569.9
Gross margin 742.8 494.3 160.7 100.4
Operating profit before provision 425.4 344.1 87.7 87.5
EBIT 58.2 12.9 40.8 12.7
Provision for Bad debts (446.2) (372.2) (80.7) (83.9)
Net Profit (Losses) (80.8) (9.8) 17.9 0.3
Financial Position YE'2018 YE'2017 Q4'2018 Q4'2017
Total Asset 5,092.5 3,500.5 5,092.5 3,500.5
Total Liability 3,568.8 1,922.8 3,568.8 1,922.8
Total Shareholder's Equity 1,523.7 1,577.7 1,523.7 1,577.7 -
Key financial Ratio YE'2018 YE'2017 Q4'2018 Q4'2017
EPS (0.30) (0.04) 0.07 0.0
ROA (2.0%) (0.3%) 0.4% 0.0%
ROE (5.4%) (0.6%) 1.2% 0.0%
D/E 2.34 1.22 2.34 1.22
Outstandting Credit Portfolio YE'2018 YE'2017 Q4'2018 Q4'2017
Hire Purchase 2,205.9 1,978.6 2,205.9 1,978.6
Other Lending 1,263.4 355.5 1,263.4 355.5
Total Lending Portfolio 3,469.3 2,334.1 3,469.3 2,334.1

SINGER Hire Purchase – Transformed Operation
SINGER Canvassing +
Mobile Application +
KYC (10 Regional Credit Centers)
Product Mixes
Gross Profit Margin

Outstanding Balance by Model (MB)
No. of Account Q4 2017 Q1 2018 Q2 2018 Q3 2018 Q4 2018
DC 14,543 10,457 7,837 6,256 4,543
DPS 172,034 143,033 115,849 84,774 58,509
Farmer - 7,197 31,474 55,217 71,851
Total 186,577 160,687 155,160 146,247 134,903
Q4 2017 Q4 2018
%GP 32.4% 37.3%
Significant Change in Product Mixes and %GP
% NPL
Farmer Model led to significant improve in product portfolio mix and overall product margin improvement
Blended NPL improves from 18.4% in Q3’18 down to 17.7% in Q4’18 and continue to improve as new accounts mixing in
SINGER Hire Purchase – Transformed Operation
Q4’17 Q1’18 Q2’18 Q3’18 Q4’18

Distribution Channel – Franchisee Expansion
• Y2018 SINGER Franchisees increased from 535 to 932 shops • SINGER Franchisees sales doubles as number of shops increased
0
50
100
150
Jan Feb Mar Apr May Jun Jul Aug Sep Oct Nov Dec
SINGER Franchisee Sales
2,000 shops in 2019

SINGER Credit Portfolio Diversification
Credit Portfolio
(Principal Balance (MB)
% NPL

Non-SINGER AR Portfolio Expansion
• 260% growth in C4C portfolio in one year
• 400% growth in captive finance portfolio in one year
Outstanding Portfolio (MB) C4C and Captive Finance
Collateral-backed AR Yield for C4C in 2019 onwards will follow new BOT regulations will positively improve interest earning

Jaymart Public Company Limited
Q&A