
OPPORTUNITIES FOR DISTRIBUTED GENERATION IN CANADA
56
OPPORTUNITIES FOR DISTRIBUTED GENERATION IN CANADA Ganesh Doluweera, Director of Research Webinar April 21, 2020 www.ceri.ca Choose one of the following for audio: • Mic & Speakers to use VoIP • Telephone and dial: • CANADA: 1-647-497-9385 • US: 1-213-929-4231 • ACCESS CODE: 246-506-339 Flagship Sponsor
Transcript of OPPORTUNITIES FOR DISTRIBUTED GENERATION IN CANADA

OPPORTUNITIES FOR DISTRIBUTED GENERATION IN CANADA
Ganesh Doluweera, Director of ResearchWebinarApril 21, 2020
www.ceri.ca
Choose one of the following for audio:• Mic & Speakers to use VoIP• Telephone and dial:
• CANADA: 1-647-497-9385• US: 1-213-929-4231• ACCESS CODE: 246-506-339
Flagship Sponsor

2
WEBINAR PARTICIPATION
2
AudioYour microphone has been muted for the duration of this presentation. To hear webinar audio: Choose Mic & Speakers to use VoIP Choose Telephone and dial using the
information provided: CANADA: 1-647-497-9385 US: 1-213-929-4231 ACCESS CODE: 246-506-339
Questions Please submit your text questions and
comments using the Questions panel. Questions will be answered during the Q&A
period following the presentation.
Note: A copy of this presentation can be downloaded by selecting the document in the Handouts panel.
Allan Fogwill

CANADIAN ENERGY RESEARCH INSTITUTE
OverviewFounded in 1975, the Canadian Energy Research Institute (CERI) is an independent, registered charitable organization specializing in the analysis of energy economics and related environmental policy issues in the energy production, transportation, and consumption sectors.
Our mission is to provide relevant, independent, and objective economic research of energy and environmental issues to benefit business, government, academia and the public.
CERI publications include:
• Market specific studies
• Geopolitical analyses
• Quarterly commodity reports (crude oil, electricity and natural gas)
In addition, CERI hosts a series of study overview events and an annual Petrochemicals Conference.
3
CORE FUNDERS
FUNDING SUPPORT
IVEY FOUNDATION
IN-KIND SUPPORTAlberta Energy Regulator | Bow Valley College | CEPA Foundation
JWN Energy | Northern Alberta Institute of Technology Petroleum Services Association of Canada
S.M. BLAIR FAMILY FOUNDATION

AGENDA
• Introduction
• Study Scope & Objectives
• Data and Methods
• Results (Preliminary)
• Observation
5

Introduction
• Rapid growth in the integration of distributed energy resources (DER) is one of themost significant and important trends in the electricity industry around the world
• DER encompasses electricity generation systems, storage systems, andcontrollable loads that are connected to the distribution system at or closer to finalconsumers of electricity
• Distributed generation (DG) is a major and one of the well understood DER
• Interest on DG is not new – has been there (at least) for the past few decades
• In Canada, DG technologies are being promoted as a complementary policy tool toachieve energy and environmental goals
• However, higher integration of decentralized generation systems will bringchallenges
• The trade-offs of DG need to be assessed and quantified.
6

Distributed Generation - Definition
1) Electricity generation at distribution system levels • Smaller nameplate capacity (between 1kW and 15MW ) • Backup generator for an airport is about 4MW and 5MW
2) The generating system is located near or at the point of consumption
3) The output (electricity generation) is used to meet all or at least a fraction of the electricity needs of a house or small business
4) Makes use of technologies that rely on locally extracted primary energy resources (wind, solar, hydro, biomass, or geothermal)
7

Perceived Benefits of DG
8

Study Scope and Objectives
9
Our study has three main objectives:
The study is currently in progress and this webinar will review some of the results

Review of DG Policies and Programs
10

Provincial DG Programs
• A common drivers:• Climate policies• Promotion of renewable energy• Supporting local economies • Enhanced electricity access
• Differs by:• Technology choice• Formal procurement programs (or lack thereof) • Compensation mechanism (e.g., Fixed feed in tariff, net energy
metering, net billing)
11

British Columbia
DG Policies
• Net Metering Program (2004)• Initial limit of 50kW – increased to 100kW in 2008
• Standing Offer Program – SOP (2008)• Systems with nameplate capacity between 100kW and 15MW• Participants are compensated through Electricity Purchase
Agreements
• Micro-SOP (2014)• Targeting First Nation’s communities (between 100kW and 1MW)• The First Nation community needs to keep at least 50% ownership• Compensated through Electricity Purchase Agreements
12

British Columbia
Results• As of 2019, more than 1800 customers in the Net Metering
Program• Installed capacity of about 13MW• 98% are using PV systems
• As of 2018, there were about 170MW contracted under the SOP and Micro-SOP programs
• The initial target for the SOP program was 100MW
• SOP and Micro-SOP have now been cancelled over concerns on the impacts on electricity rates
• BC Hydro applied to the BCUC to amend the Net Metering Program to limit the max capacity of DG
13

Alberta
DG Policies
• Microgeneration Regulation (2008)• Initially a max capacity of 1MW, increased in to 5MW in 2016• Compensation through net billing mechanism
• Renewable Electricity Act (2016)• Set a target of 30% of electricity to come from renewable sources by
2030
14

Alberta
Results
• As of Feb 2020, there were more than 5000 sites registered under the Micro-generation Regulation
• Total installed capacity of 68MW from micro-generators• About 94.5% using PV systems
• Renewable Electricity Act and the Micro-Generation Regulation remained unchanged
15

Ontario
DG Policies
• Renewable Energy Standard Offer Program - RESOP (2006)• Systems between 1kW and 10MW• Exclusive for systems connecting to the distribution system• Subject to 20 year contracts
• Feed-in Tariff (FIT) program (2009)• Large-FIT: Systems greater than 500kW (connected to Tx or Dx)• Small-FIT: Systems between 10kW and 500kW (Dx)• Micro-FIT: Systems less than 10kW (Dx)• Subject to long-term fixed-price contracts with IESO (20 years on
average)
16

Ontario
Results
• RESOP• 825MW of contracted capacity
• Large-FIT program cancelled in 2016• Currently has 896MW of contracted capacity (Dx)
• Small-FIT program cancelled in 2016• Currently has 573MW of contracted capacity
• Micro-FIT program cancelled in 2017• Currently has 261MW of contracted capacity
• 62% are solar PV system, 17% wind, 8% hydro, 4.5% CHP
17
Nova Scotia
DG Policies
• Community Feed-in Tariffs program (COMFIT) (2011)• Offered a long-term fixed price contract to participants• Originally for projects between 10kW and 5MW• In operation between 2011 and 2016
• Solar for Community Buildings Pilot Program (2016)• Systems with less than 75kW• Subject to 20 year PPA contracts
• Enhanced Net Metering Program (2016)• Systems with less than 1MW of capacity
• SolarHomes Program (2018)• Rebates + Net Metering mechanism
18

Nova Scotia
Results
• Community Feed-in Tariffs program (COMFIT)• Created 150MW of renewable capacity• Mostly small wind projects
• Solar for Community Buildings Pilot Program• Brought 1.5MW of solar capacity• Program is now closed
• Enhanced Net Metering Program• Uptake was relatively limited at the beginning (130 systems)
• SolarHomes + Net Metering Program (after 2018)• If all projects are completed, the small solar generation capacity
could reach up to 12.2MW
19

DG Technology Assessment
By Population Centers(Census of Population – 2016)
20

Solar PV Assessment – BC and Alberta
21
Most population centers
British Columbia: 90Alberta: 108
Why Solar PV?

Solar PV Assessment – Ontario & Nova Scotia
22
Most population centers
Ontario: 255Nova Scotia: 31

Electricity Production – Capacity Factor
23

Levelized cost of Electricity – Residential Solar PV
24
Capital cost = $2.5/WDC
13-16 cents/kWh 10-12 cents/kWh 16-17 cents/kWh 11-16 cents/kWh Retail electricity prices (Major cities)
Up to 10kW
If 50% of the detached houses in 108 population centers in Alberta installed solar PV (8kW/system), the annual energy production will be 4000 GWh/year (5% of provincial electricity demand)
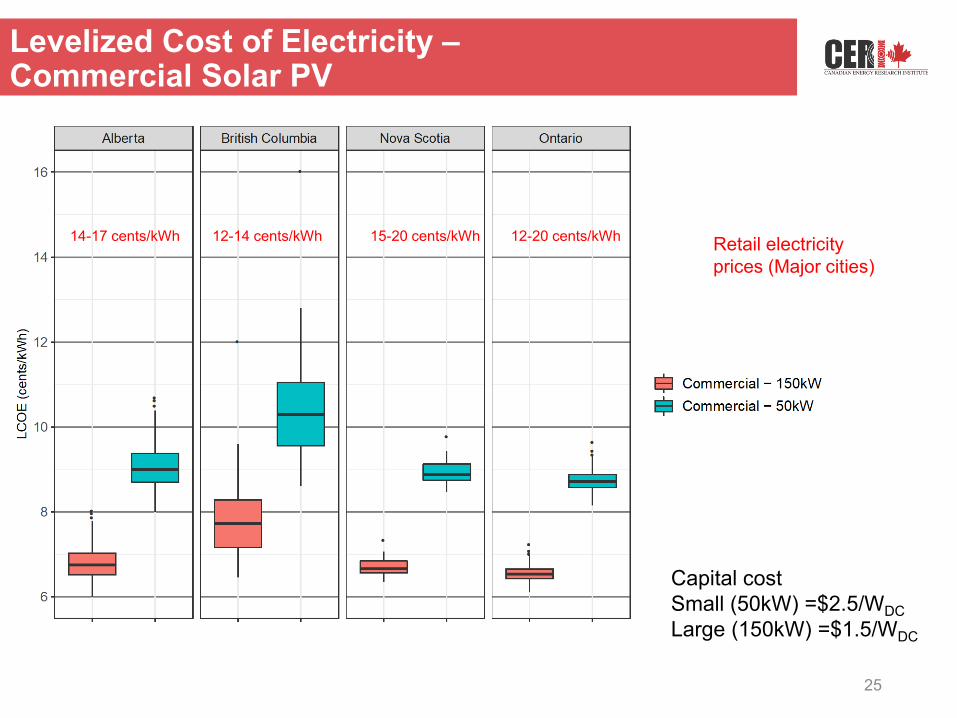
Levelized Cost of Electricity –Commercial Solar PV
25
Capital costSmall (50kW) =$2.5/WDCLarge (150kW) =$1.5/WDC
14-17 cents/kWh 12-14 cents/kWh 15-20 cents/kWh 12-20 cents/kWh Retail electricity prices (Major cities)

Biomass and MSW Assessment
• Assessed the potential and economics of DG with biomass and municipal solid waste (MSW) by population center
• Data availability is sparse and somewhat unreliable• Existing resources are matched with conversion technologies• Solid biomass
• Incineration with steam turbines (ST)• Gasification with internal combustion engines (ICE)
• MSW• Incineration with steam turbines (ST)• Anaerobic digestion with internal combustion engines (ICE)
• Resource availability varies significantly • Biomass/MSW based DG can provide on demand power
26

Biomass and MSW Assessment
27
Lethbridge (AB) Penticton (BC) London (ON)
Biomass
Supply (kt/year) 772 7 2683
Electricity potential (GWh/year) 800-1000 7-12 3000-4000
MSW
Supply (kt/year) 42 16 182
Electricity potential (GWh/year) 4-25 2-9 20-90

DG with Biomass
28

DG with MSW
29

Natural Gas CHP Assessment (Micro CHP)
30Sources: Renewableenergyhub, 2020, CIEEDAC (2016), Electropaedia (2018), Tan, K. (2018)
Type of Micro CHP systemsOverall
Efficiency(%)
ElectricalEnergy
Efficiency(%)
Heat to PowerRatio
ThermalEnergy
Qualities
Gas Turbines 70 – 85% 24 – 42% 1.3 – 2.0 HighReciprocating Engine 75 – 85% 33 – 53% 0.5 – 2.5 LowMicro Turbines 60 – 75% 15 – 33% 1.3 – 2.0 Medium to LowFuel Cells (PEMFC) 75 – 85% 25 – 60% 0.33 – 2.0 LowFuel Cells (SOFC) 75 – 85% 35 – 43% 1 – 2.5 High
CHP = Combined heat and power
Micro CHP: Electricity capacity of few kW

• Eligibility for NG CHP for DG programs varies by province• Alberta NG CHP is eligible• In Ontario, NG CHP is not eligible for DG programs
• ATCO has two units in service on dairy farms in Taber, Alberta, which have produced close to a 90% utilization of the m-CHP
• In 2017, Enbridge teamed up with ATCO for a residential-energy-emissions pilot project called the Alberta Hybrid House Project. the two companies retrofitted seven employee-owned homes in Calgary and Edmonton with micro-generation technologies—solar panels and a natural-gas-fired, micro-combined heat and power (m-CHP) unit
• Alberta government partnered with Alberta Milk and provided a one-time grant for ATCO Ltd. to install 24 Aisin 1.5 kW m-CHP units in dairy farms across the province that began in fall 2019
31
Natural Gas CHP Assessment (Micro CHP)

Micro CHP ( Apartment Building)
32
Micro CHP technology 100 kW Packaged ICEAnnual Operating Savings Compared to No CHP $79 kPayback (year) 10NPV $45 kIRR 8%
Facility Description Apartment High riseFacility size (sq. m) 13,824Floors 18Number of units /Occupancy 142Monthly Electricity consumption 150,320 Monthly Fuel consumption_MMBtu 1,301
electricity price 2019 ($/kWh) $0.1NG price 2019 ($/MMBtu) $6.0the efficiency of thermal equipment 80%the CHP equipment service life (Years) 20Incentives NoDiscount Rate 7%

Micro CHP (Hospital)
33
Micro CHP technlogy 550 kW Packaged ICEAnnual Operating Savings Compared to No CHP $181 kPayback (year) 9.5NPV $185 kIRR 9%
Facility Description Hospital/InpatientFacility size (sq. m) 18,725Floors 5Monthly Electrcity consumption (kWh) 384,936 Monthly Fuel consumption_MMBtu 2,616
electricity price 2019 ($/kWh) $0.1NG price 2019 ($/MMBtu) $2.6the efficiency of thermal equipment 80%the CHP equipment service life (Years) 20Incentives NoDiscount Rate 7%

Determining the Value of DG
34
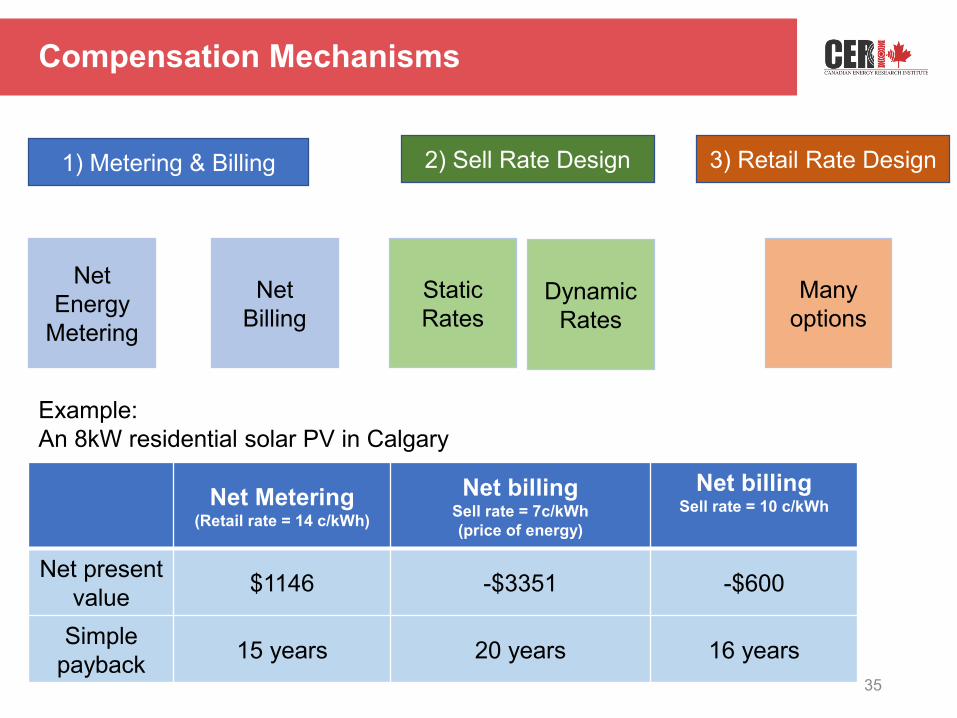
Compensation Mechanisms
35
1) Metering & Billing 2) Sell Rate Design
Net Energy
Metering
Net Billing
Static Rates
Dynamic Rates
Example:An 8kW residential solar PV in Calgary
Net Metering(Retail rate = 14 c/kWh)
Net billingSell rate = 7c/kWh(price of energy)
Net billingSell rate = 10 c/kWh
Net present value $1146 -$3351 -$600
Simple payback 15 years 20 years 16 years
3) Retail Rate Design
Many options
Observations & Unanswered Questions
• DG is being promoted in most of Canada• Going forward, Solar PV is likely one of the most widespread DG
technologies • Compensation mechanisms must be designed by balancing the
private and public costs and benefits of DG• Public benefits and costs of DG (e.g., savings due to differed
assets, demand reduction) are difficult to quantify • CERI study will quantify some of the public benefits and costs• Higher quality data is available for some DG resource
assessments• More work is needed with technologies such as biomass, MSW,
and systems level cost benefit analysis
36

37
Opportunities for Distributed Generation In Canada
• Final report• A comprehensive data portalExpected to be published by the end of May, 2020

QUESTIONS?
38
Please submit your text questions and comments using the Questions panel.
A recording of the presentation will be sent to you following the event.

UPCOMING EVENTS
39Register at www.ceri.ca/events

40
THANK YOUCanadian Energy Research Instituteceri_canada
Visit www.ceri.ca for the latest research

Appendix – Compensation Mechanisms
41

Net Energy Metering
42Figure Source: Zinaman, Owen, et al. "Grid-connected distributed generation: compensation mechanism basics." National Renewable Energy Laboratory: Golden, CO, USA (2017).

Net Billing
43Figure Source: Zinaman, Owen, et al. "Grid-connected distributed generation: compensation mechanism basics." National Renewable Energy Laboratory: Golden, CO, USA (2017).

Buy All, Sell All
44Figure Source: Zinaman, Owen, et al. "Grid-connected distributed generation: compensation mechanism basics." National Renewable Energy Laboratory: Golden, CO, USA (2017).

Appendix – DG policies & programs
45

Saskatchewan
DG Policies
• Small Power Producer Program (2007)• Limit of 100kW systems
• Power Generation Partner Program (2018)• Limit of 1MW for renewable technologies• Limit of 5MW for flair gas and waste heat generation
• Net-Metering Program (2018)• Replaces the Small Power Producer Program (capacity limit of
100kW)
46

Saskatchewan
Results
• Net-Metering program reached its 16MW cap two years in advance
• The second round is offering a less generous rate structure to subscribers
• Power Generation Partner Program has resulted in 20MW of capacity from waste heat generation
• A cap of 10MW per year of installed capacity for renewable sources• A cap of 25MW per year of installed capacity for flare gas and waste
heat recovery
• SaskPower is prepared to add between 70 and 105 MW of new installed capacity within the next 3 years
47

Manitoba
DG Policies
• In 2003, Manitoba Hydro published the Technical Requirements for Connecting Distributed Resources to the Distribution System
• Less than 200kW systems under net-billing mechanism• Greater than 200kW systems under PPA contracts with Manitoba
Hydro
• Solar Energy Pilot Program (2016)• Subject to net-billing mechanism• Only for PV systems• Generating limit size of 200kW
48

Manitoba
Results
• No data available for the Technical Requirements for Connecting Distributed Resources to the Distribution System
• Solar Energy Pilot Program resulted in 2.6MW of installed capacity
• Program was cancelled in May, 2018• The subsidies included in the program were deemed too costly (i.e.,
risk of rate increases)
• New government agency (Efficiency Manitoba) to take over some energy related initiatives
• No clear direction in terms of DG
49

Quebec
DG Policies
• Net-Metering Program (2016)• Less than 50kW systems
Results• No reports available• Quebec generates about one third of total Canadian generation• Well connected in every direction – net exporter of electricity• They have the lowest electricity bills for consumers in the country• The government is not keen about promoting DG
50

New Brunswick
DG Policies
• Locally Owned Renewable Energy Projects that are Small in Scale ~ LORESS (2015)
• NB Power directed to contract 80MW of renewable energy
• Net-Metering Program • Systems less than 100kW
• Embedded Generation Program • Systems between 100kW and 3MW• Cap of 20MW• Subject to FIT compensation (long-term fixed price)
• Community Energy Program• Targeting First Nations communities • Cap of 40MW
51
New Brunswick
Results
• Net Metering program is ongoing• No official reports on total installed capacity
• Embedded Generation Program – fully subscribed• 20MW of capacity
• No information available regarding the progress of the Community Energy Program
52
Prince Edward Island
DG Policies
• Renewable Energy Act (2005)• Mandated utilities to source at least 15% of electricity from
renewables
• Net-Metering Program (2005)• Official regulatory framework to promote DG• Systems with generating capacity less than 100kW
• Amendments to the Renewable Energy Act (2015)• Cancelled the mandate to source 15% of electricity from renewables
53

Prince Edward Island
Results
• No official results on the Net-Metering program
• The province is officially pursuing other policies to address the high costs of electricity
• Energy efficiency and conservation• Demand management• Promote utility-scale solar generation project
54

Newfoundland and Labrador
DG Policies
• Provincial Energy Plan: Focusing our Energy (2007)• Commitment to develop a regulatory framework to promote DG
• Net-Metering Policy Framework (2015)• Systems with generating capacity less than 100kW• Provincial cap of 5MW
• Biogas Electricity Generation Pilot Program (2015)• Systems with less than 2MW of capacity• Participants get compensated a variable rate (90% of the avoided
system marginal cost) • Provincial cap of 5MW
55

Newfoundland and Labrador
Results
• Net-Metering Policy Framework• As of 2019, there were 419.5kW of installed capacity • Newfoundland and Labrador Hydro has one customer under this rate
structure (18kW)
• Biogas Electricity Generation Pilot Program• No official reports
56