Opolis: An International Journal of Suburban and …cssd.ucr.edu/Activities/PDFs/Philadelphia s...
22
Opolis: An International Journal of Suburban and Metropolitan Studies Volume 1, Issue 1 2005 Article 4 Philadelphia’s Space In Between: Inner-Ring Suburb Evolution Nancey Green Leigh * Sugie Lee † * Georgia Institute of Technology, [email protected] † Georgia Institute of Technology, [email protected] Copyright c 2005 by the authors, unless otherwise noted. This article is part of the collected publications of Opolis: An International Journal of Suburban and Metropolitan Studies. Opolis: An International Journal of Suburban and Metropolitan Studies is produced by the eScholarship Repository and bepress.
Transcript of Opolis: An International Journal of Suburban and …cssd.ucr.edu/Activities/PDFs/Philadelphia s...

Opolis: An International Journal ofSuburban and Metropolitan StudiesVolume 1, Issue 1 2005 Article 4
Philadelphia’s Space In Between: Inner-RingSuburb Evolution
Nancey Green Leigh∗ Sugie Lee†
∗Georgia Institute of Technology, [email protected]†Georgia Institute of Technology, [email protected]
Copyright c©2005 by the authors, unless otherwise noted. This article is part of the collectedpublications of Opolis: An International Journal of Suburban and Metropolitan Studies. Opolis:An International Journal of Suburban and Metropolitan Studies is produced by the eScholarshipRepository and bepress.
Abstract
Metropolitan regions have evolved into highly diverse areas in their demographic, socioe-conomic, and housing patterns. The issue of declining inner-ring suburbs, however, has onlyrecently begun to receive significant attention from urban scholars and policy makers. Thefundamental concept of the inner-ring suburb rests on the notion of the space “in between” theinner city and outer-ring suburbs. In this article, we explore intra-metropolitan spatial differen-tiations and economic disparity between four sub-areas — the downtown, inner city, inner-ringsuburbs, and outer-ring suburbs—via a case study of the Philadelphia metropolitan region. Ouranalysis confirms that inner-ring suburbs are increasingly vulnerable to socioeconomic declineand exhibit symptoms of decline similar to those found in inner cities (white flight, populationloss, and increased poverty). Understanding the role and conditions of inner-ring suburbs isessential to creating effective metropolitan smart growth policies.
Acknowledgements: Nancey Green Leigh is a professor in the College of Architecture atthe Georgia Institute of Technology and the author of Economic Revitalization: Cases andStrategies for City and Suburb. Sugie Lee is a doctoral candidate in City and Regional Planningat Georgia Tech.
Keywords: Inner-Ring Suburbs, Suburban Decline, Suburban Differentiation
Suggested Citation:Nancey Green Leigh and Sugie Lee (2005) “Philadelphia’s Space In Between: Inner-RingSuburb Evolution”, Opolis: An International Journal of Suburban and Metropolitan Studies:Vol. 1: No. 1, Article 4.http://repositories.cdlib.org/cssd/opolis/vol1/iss1/art4

13Opolis� Vol. 1, No. 1: Winter 2005, pp.13-32© 2004. All Rights Reserved.
Philadelphia’s Space In Between:Inner-Ring Suburb Evolution
Nancey Green Leigh
Georgia Instiute of Technology
Sugie LeeGeorgia Instiute of Technology
Abstract
Metropol i tan regions have evolved into h ighly d iverse areas in theirdemographic, socioeconomic, and housing patterns. The issue of declininginner-ring suburbs, however, has only recently begun to receive significantattention from urban scholars and policy makers. The fundamental concept ofthe inner-ring suburb rests on the notion of the space “in between” the innercity and outer-ring suburbs. In this article, we explore intra-metropolitan spatialdifferentiations and economic disparity between four sub-areas—the downtown,inner city, inner-ring suburbs, and outer-ring suburbs—via a case study of thePhiladelphia metropolitan region. Our analysis confirms that inner-ring suburbsare increasingly vulnerable to socioeconomic decline and exhibit symptoms ofdecline similar to those found in inner cities (white flight, population loss, andincreased poverty). Understanding the role and conditions of inner-ring suburbsis essential to creating effective metropolitan smart growth policies.
Keywords: Inner-Ring Suburbs, Suburban Decline,Suburban Differentiation,
Philadelphia
Suburbanization and central-citydecline have been the focus of urbanscholars and policy makers for severaldecades. In contrast, inner-ringsuburbs’ deterioration, need forrevitalization, and role in evolvingmetropolitan structures has onlyrecently begun to receive significantattention (Lucy and Phillips 2000a;Orfield 1997, 2001; Puentes andOrfield 2002; Smith et al. 2001; Rusk1999). Yet inner-ring suburbs, with their
excellent access to centers andsubcenters in metropolitan areas andexisting economic, social, and physicalinfrastructure, present significantopportunities for a more efficientallocation of metropolitan resources atthe same time that they help to reducesuburban sprawl and preserve thenatural environment.
The research presented in this articleuses time of development and spatial
Introduction

14 Opolis | Volume 1, Number 1: Winter 2005
location characteristics to define theprecise boundaries of the inner-ringsuburbs and then applies themethodology to a case study ofPhiladelphia. Using GeographicInformation Systems (GIS) techniquesand statistical analyses, we compareand contrast inner-ring suburbs withthe downtown, inner city, and outer-ring suburbs of the Philadelphiametropolitan region. The primarysource of data for our analysis is thedecennial censuses of 1970, 1980,1990, and 2000.
The three objectives of our researchare to (1) illustrate a methodology fordefining and identifying the spatialpattern of inner-ring suburbs; (2)document demographic, socio-economic, and housing characteristicsfound in Philadelphia’s downtown,inner city, inner-ring suburbs, andouter-ring suburbs; and (3) explore theplanning and policy implicationsstemming from the current status ofinner-ring suburbs relative to thecentral city and outer-ring suburbswithin the metropolitan area.
Existing Literature Limitations and aNew Approach for Intra-MetropolitanAnalysis
Up until the mid-1980s, the issue ofsuburban decline was under-recognized while priority was given tothe revitalization of the central city andinner-city neighborhoods. Bollens(1988) and Jackson (1985) are amongthe few urban scholars who calledattention to the decline of inner-ringsuburbs that were showing socio-fiscalproblems similar to those found incentral cities.
Subsequently, Orfield (1997) provided
the most comprehensive exploration ofsuburban differentiation. He arguedthat inner-ring suburbs are decliningmore rapidly than central cities. Heoffered evidence of the process ofdecline spreading from the central cityto inner-ring suburbs through his casestudy of Minneapolis-Saint Paul,Minnesota.
Lucy and Phillips (2000a, 2000b, 2001)also provided evidence of the declineof inner-ring suburbs. They found thatan income decline in suburbs occurredas often in areas dominated by middle-age housing built between 1945 and1970 as in neighborhoods with olderhousing built before 1945 (Lucy andPhillips 2000b). Recently they alsoexplored growth and decline in termsof population change for the suburbsof the 35 largest metropolitan regionsbetween 1990 and 2000 (Lucy andPhillips 2001). They found thatdeclining suburbs were predominantlylocated in slow-growing metropolitanregions of the Midwest and Northeast.They also concluded that decliningsuburbs were found throughout themetropolitan region and were notnecessarily adjacent to central cities.
Kotkin (2001), however, provided adifferent perspective on inner-ringsuburbs. Examining selected oldersuburbs in the fast-growing regions ofthe South and West, he found manyinner-ring suburbs to be prosperingand evolving into ethnically diversecities. According to Kotkin, immigrantmovement into inner-ring suburbs is areflection of a renewal of middle-classaspirations, not a sign of neighborhooddecline. Hence, inner-ring suburbs arethe emerging melting pots that willgenerate new economies for the 21stcentury, just as central cities did for the
15Leigh and Lee: Philadelphia’s Space In Between
20th century (Kotkin 2000, 2001).
There is a limited body of research tohelp us understand the nature and roleof inner-ring suburbs withinmetropolitan regions, yet we cannothave a robust metro smart growthpolicy without a fuller understanding.The prevailing approach of examininga central city/suburbs dichotomy, alongwith aggregating data for analysis bythe “official” census definition of thecentral city and suburbs, is simplyinadequate for analyzing metropolitanstructure precisely because of theemergence of suburban rings and sub-centers. While Orfield (1997) andPersky and Wiewel (2000) haveconducted empirical studies thatattempt to account for suburbandifferentiation, their approaches rely oncounty and municipal dataaggregations that are too crude toidentify inner-ring suburbs.
A concrete definition of inner-ringsuburbs is essential for developingpolicy implications that address theneeds of these metro subareas.However, the literature contains aconfusing array of terms such as oldsuburbs, inner suburbs, first-ringsuburbs, and first suburbs.1 A morespecific approach has been takenrecently that defines inner-ring suburbsin terms of their specific time ofdevelopment. Seaver, Morris, andRapson (1998) defined the inner- orfirst-ring suburbs as “post-WWIIcommunities” constructed between1945 and 1965. Lucy and Phillips(2000b) defined inner-ring suburbs as“middle-aged neighborhoods” that
were built from 1945 to 1970. Whiletheir definitions differ slightly, webelieve these researchers’ foci on post-WWII suburbs and their decline bestcaptures the concerns that have beenexpressed in the literature, while alsooffering an operational definition foranalysis. A definition of inner-ringsuburbs as post-WWII-developedareas means the automobile was theprimary mode of transportation whilethey were forming. Recognizing thisdistinction from areas that developedearlier and more compactly asstreetcar suburbs is fundamental tocreating effective Smart Growthpolicies.
In the research presented here, wehave taken the age of the subareahousing stock as the measure foridentifying inner-ring suburbs. That is,the construction of the housing stockis a primary characteristic of an area’sdevelopment, and for inner-ringsuburbs in particular, there is aconcentration of housing stock builtbetween 1950 and 1969. Thus, inner-ring suburbs in this research are low-density, single-family, residentialsuburban areas built between 1950and 1969.
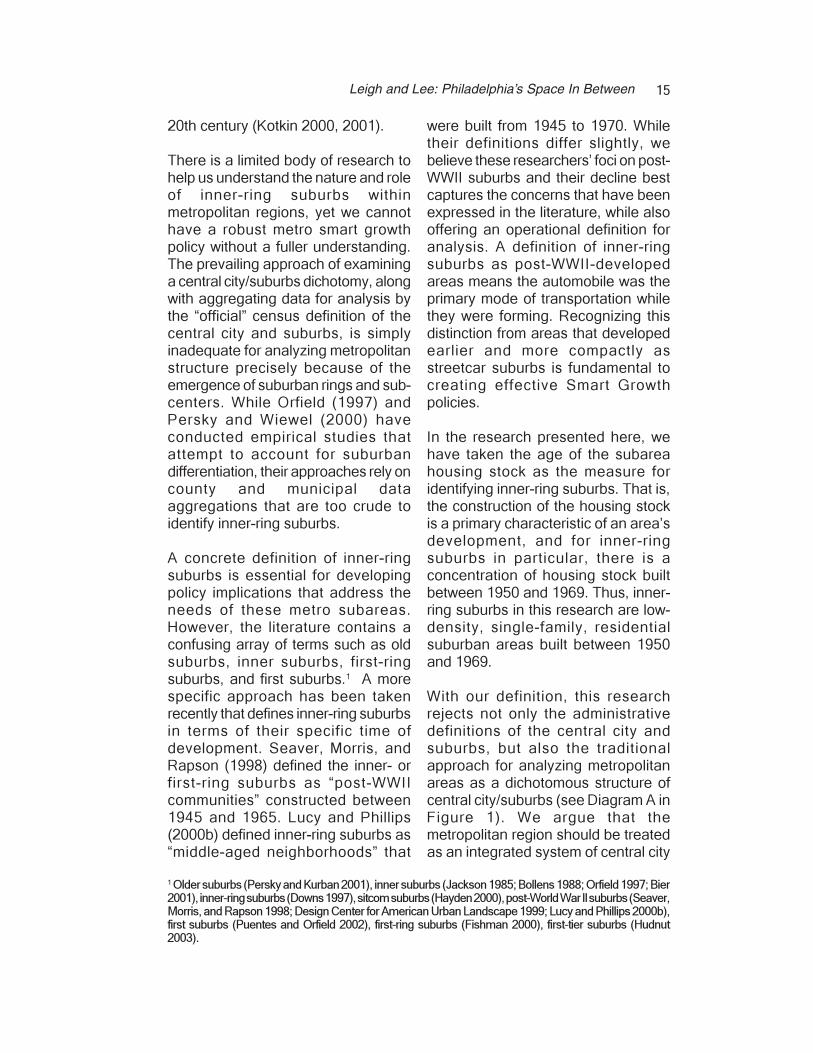
With our definition, this researchrejects not only the administrativedefinitions of the central city andsuburbs, but also the traditionalapproach for analyzing metropolitanareas as a dichotomous structure ofcentral city/suburbs (see Diagram A inFigure 1). We argue that themetropolitan region should be treatedas an integrated system of central city
1 Older suburbs (Persky and Kurban 2001), inner suburbs (Jackson 1985; Bollens 1988; Orfield 1997; Bier2001), inner-ring suburbs (Downs 1997), sitcom suburbs (Hayden 2000), post-World War II suburbs (Seaver,Morris, and Rapson 1998; Design Center for American Urban Landscape 1999; Lucy and Phillips 2000b),first suburbs (Puentes and Orfield 2002), first-ring suburbs (Fishman 2000), first-tier suburbs (Hudnut2003).
16 Opolis | Volume 1, Number 1: Winter 2005
(downtown and inner city), inner-ringsuburbs, outer-ring suburbs, sub-centers, and exurbs. The conceptualdiagram for this approach is presentedin Diagram B in Figure 1.
Inner-ring suburbs, therefore, shouldbe viewed as separate entities, as wellas within the context of the wholemetropolitan region. Our researchfocuses on the downtown, inner city,inner-ring suburbs, and outer-ringsuburbs to compare their dynamicsocioeconomic changes andcharacteristics, and de-emphasizesthe suburban subcenters and exurbs.
Methodology
Our study region covers eight counties,excluding Salem County, from thenine-county Pennsylvania-New JerseyPrimary Metropolitan Statistical Area(PA-NJ PMSA). Philadelphia County isthe central city, as well as the hub, ofthe PA-NJ PMSA. The Philadelphia
region was ranked as one of thenation’s slowest growing largemetropolitan areas.
The primary source of data for ouranalysis is the Neighborhood ChangeDatabase (NCDB) produced byGeoLytics.2 NCDB contains longitud-inal census Long and Short Form datafor 1970, 1980, 1990, and 2000. Thetract boundaries and data of 1970,1980, and 1990 have been normalizedto 2000, allowing us to compare dataover time.
We use GIS techniques to identifyspatial patterns of inner-ring suburbs.To test the research hypotheses, weuse descriptive analyses and Analysisof Variance (ANOVA) tests with STATA8.0. The unit of analysis for thisresearch is the census tract, as a proxyfor the neighborhood unit. Mostexisting research on inner-ring suburbsis based on analysis at the municipallevel—city and county. Our tract-based
Figure 1. A New Model of Metropolitan Spatial Structure
2 http://www.geolytics.com/USCensus,Neighborhood-Change-Database-1970-2000,Products.asp.
17Leigh and Lee: Philadelphia’s Space In Between
approach provides a more fine-grainedanalysis of the inner-ring suburbsrelative to the inner city and outer-ringsuburbs.
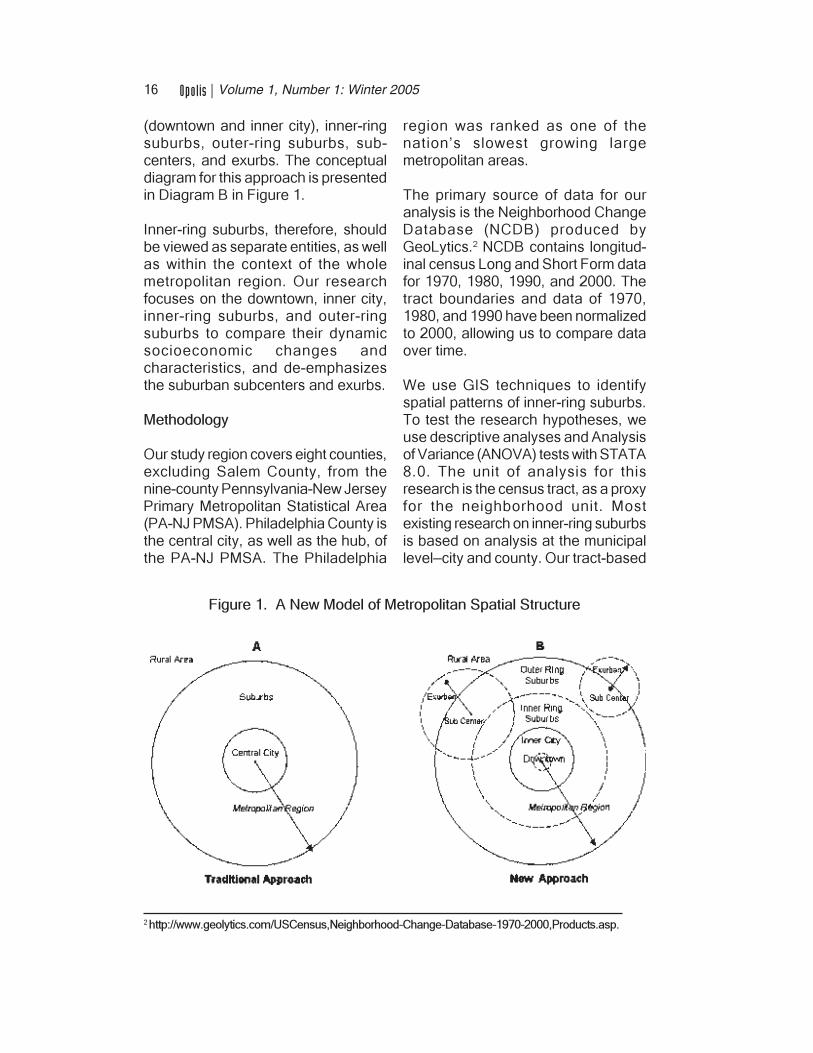
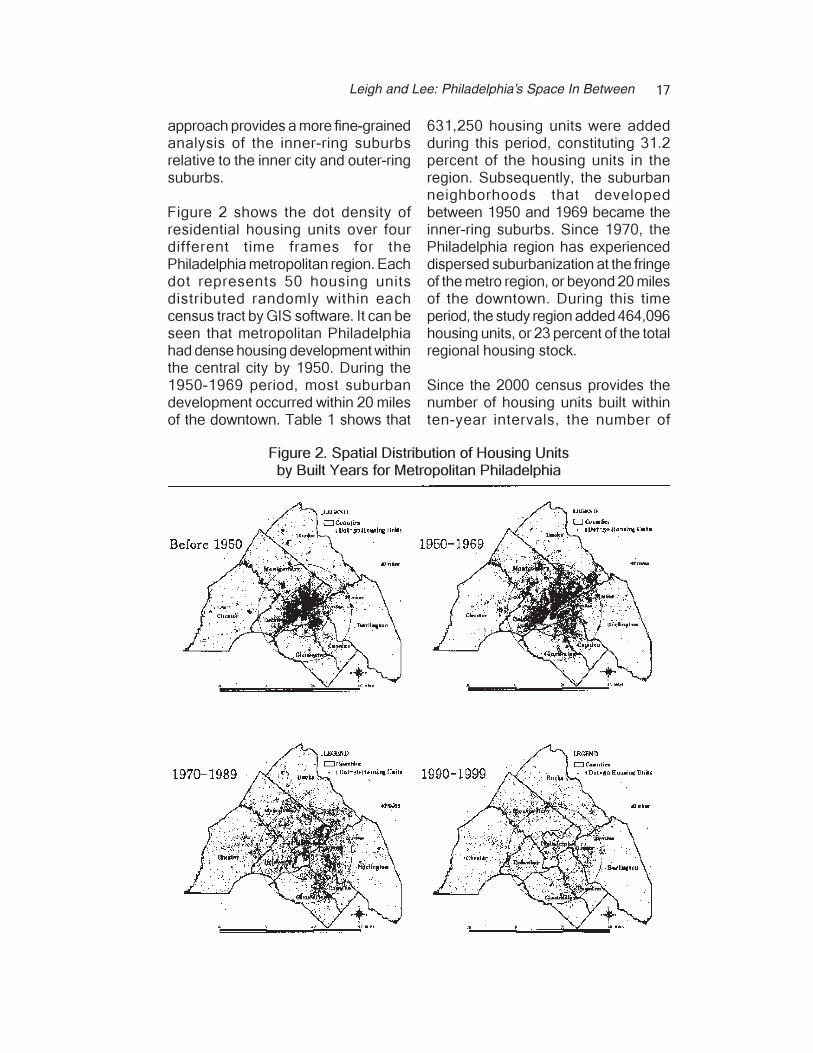
Figure 2 shows the dot density ofresidential housing units over fourdifferent time frames for thePhiladelphia metropolitan region. Eachdot represents 50 housing unitsdistributed randomly within eachcensus tract by GIS software. It can beseen that metropolitan Philadelphiahad dense housing development withinthe central city by 1950. During the1950-1969 period, most suburbandevelopment occurred within 20 milesof the downtown. Table 1 shows that
631,250 housing units were addedduring this period, constituting 31.2percent of the housing units in theregion. Subsequently, the suburbanneighborhoods that developedbetween 1950 and 1969 became theinner-ring suburbs. Since 1970, thePhiladelphia region has experienceddispersed suburbanization at the fringeof the metro region, or beyond 20 milesof the downtown. During this timeperiod, the study region added 464,096housing units, or 23 percent of the totalregional housing stock.
Since the 2000 census provides thenumber of housing units built withinten-year intervals, the number of
Figure 2. Spatial Distribution of Housing Unitsby Built Years for Metropolitan Philadelphia

18 Opolis | Volume 1, Number 1: Winter 2005
residential housing units in each tractcan be aggregated into four timeperiods: before 1950, 1950-1969,1970-1989, and 1990-1999. In thisresearch we define inner-ring suburbsas those with a “predominance level”(relatively higher percentage) of 1950-1969 housing stock at the census tractlevel. We also convert the aggregateresidential housing units built between1950 and 1969 to the density andcontour maps to help identify thecontinuity in form of the inner-ringsuburbs surrounding the inner city.3
The inner city is defined as the areathat has a concentration of housingstock built before 1950. Using thesame method applied to inner-ringsuburbs, we can obtain the boundaryof the inner city. For identifyingdowntown census tracts, we use tractspredefined as downtown tracts fromSohmer and Lang (2001). The authors’original source is downtown tractsmapped by the University ofPennsylvania for 24 U.S. central cities.
Figure 3 shows the identification ofeach subarea in Philadelphia:downtown, inner city, inner-ringsuburbs, and outer-ring suburbs.
Analysis and Findings
In this research we explore change inthe pattern of demographic, socio-economic, and housing characteristicsfor each subarea from 1970 to 2000 toaddress the issue of intra-metropolitanspatial differentiation and suburbandecline. We utilize descriptive analysesand ANOVA tests for meancomparisons of multiple sub-areas toexplore intra-metropolitan diff-erentiation.
We explore two research hypothesesfocusing on intra-metropolitan spatialdifferentiation and intra-metropolitaneconomic disparity and divergence. Inthe first hypothesis, we examinewhether there are significantdifferences in the demographic, socio-
Table 1. Housing Units by Built Year for Metropolitan Philadelphia Region
Built Year Housing Units Percentage
Pre-1939 511,763 25.30%
Before 1950 1940-1949 223,972 11.10%
Sub-total 735,735 36.40%
1950-1959 349,361 17.30%
1950-1969 1960-1969 281,889 13.90%
Sub-total 631,250 31.20%
1970-1979 261,301 12.90%
1970-1989 1980-1989 202,795 10.00%
Sub-total 464,096 23.00%
1990-1999 Sub-total 190,604 9.40%
Total 2,021,685 100.00%
3. Density calculation function of Spatial Analyst in ArcView 3.3: Cell size 100m, Radius 2 miles, Densitytype of Kernel, and Area units in square miles.

19Leigh and Lee: Philadelphia’s Space In Between
economic, and housing changes foundin downtown, inner city, inner-ringsuburbs, and outer-ring suburbs. In thesecond hypothesis, we investigatewhether intra-metropolitan disparityand divergence are increasingbetween the downtown, inner city,inner-ring, and outer-ring suburbs overtime.
Demographic Analysis
Population changes are an importantindicator of shifts in neighborhoodeconomic conditions. Simmons andLang (2001) emphasized theimportance of population growth toaddress a city’s economic performancebecause population gains usuallyinduce housing demands as well asother economic activities. As shown in
Table 2, the Philadelphia metro areagrew from 4.8 million in 1970 to 5.0million in 2000, representing a slowgrowth rate of only 4.6 percent over thepast 30 years.
Despite this overall slow growth rate,there were remarkable differences inpopulation growth patterns betweensubareas of the metro region. Theouter-ring suburbs experienced an 83percent increase in population,reflecting significant decentralizationtoward the metropolitan fringe. Incontrast, the downtown also lostpopulation between 1970 and 2000.However, the loss was concentrated inthe 1970s; the downtown gainedpopulation in the 1980s and 1990s.
Table 2 also includes data on
Figure 3. Philadelphia’s Downtown, Inner City,Inner-Ring Suburbs, and Outer-Ring Suburbs

20 Opolis | Volume 1, Number 1: Winter 2005
Table
2. P
opula
tion C
hange b
y Race fo
r Each
Sub-A
rea
P
op
ula
tion
Cha
nge R
ate
(%)
S
ub-A
rea
1970
198
0
1990
200
0
'70-
'80
'80-
'90
'90-
'00
'70-
'00
D
ow
nto
wn
6
2,3
75
5
9,4
56
6
0,0
92
61
,02
4
-4.7
1
.1
1.6
-2
.2
In
ne
r City
1
,46
0,1
74
1
,09
2,6
10
9
29
,84
27
64
,75
4
-25
.2
-14
.9
-17
.8
-47
.6
Wh
ite
Inn
er-R
ing
1
,46
9,1
36
1
,36
3,6
70
1
,27
6,5
34
1,1
79
,54
6
-7.2
-6
.4
-7.6
-1
9.7
O
ute
r-Rin
g
95
8,7
18
1
,19
6,7
58
1
,45
2,0
79
1,6
52
,87
4
24
.8
21
.3
13
.8
72
.4
T
ota
l 3
,95
0,4
03
3
,71
2,4
94
3
,71
8,5
47
3,6
58
,19
8
-6.0
0
.2
-1.6
-7
.4
D
ow
nto
wn
2
3,3
18
1
5,2
06
1
4,5
69
13
,67
0
-34
.8
-4.2
-6
.2
-41
.4
In
ne
r City
6
69
,28
2
65
5,6
61
6
58
,72
97
09
,03
1
-2.0
0
.5
7.6
5
.9
Bla
ck
In
ne
r-Rin
g
95
,64
1
13
7,2
63
1
60
,74
51
98
,63
0
43
.5
17
.1
23
.6
10
7.7
O
ute
r-Rin
g
54
,89
6
75
,20
4
95
,97
41
28
,87
4
37
.0
27
.6
34
.3
13
4.8
T
ota
l 8
43
,13
7
88
3,3
34
9
30
,01
71
,05
0,2
05
4
.8
5.3
1
2.9
2
4.6
D
ow
nto
wn
3
,57
3
2,5
78
2
,31
23
,40
2
-27
.8
-10
.3
47
.1
-4.8
In
ne
r City
5
0,8
07
7
7,7
12
1
06
,75
31
56
,20
8
53
.0
37
.4
46
.3
20
7.5
His
pa
nic
In
ne
r-Rin
g
16
,52
3
17
,21
5
26
,11
14
4,5
88
4
.2
51
.7
70
.8
16
9.9
O
ute
r-Rin
g
12
,49
9
19
,95
2
29
,42
64
9,9
53
5
9.6
4
7.5
6
9.8
2
99
.7
T
ota
l 8
3,4
02
1
17
,45
7
16
4,6
02
25
4,1
51
4
0.8
4
0.1
5
4.4
2
04
.7
D
ow
nto
wn
8
7,2
79
7
7,8
35
7
9,2
05
82
,75
9
-10
.8
1.8
4
.5
-5.2
In
ne
r City
2
,14
1,5
06
1
,82
0,0
23
1
,71
0,3
25
1,6
41
,24
7
-15
.0
-6.0
-4
.0
-23
.4
To
tal
Inn
er-R
ing
1
,57
0,8
78
1
,52
2,6
07
1
,47
7,0
55
1,4
49
,77
4
-3.1
-3
.0
-1.8
-7
.7
O
ute
r-Rin
g
1,0
17
,10
8
1,2
95
,21
6
1,5
90
,38
01
,86
2,8
66
2
7.3
2
2.8
1
7.1
8
3.2
T
ota
l 4
,81
6,7
71
4
,71
5,6
81
4
,85
6,9
65
5,0
36
,64
6
-2.1
3
.0
3.7
4
.6

21Leigh and Lee: Philadelphia’s Space In Between
population changes by race. Thegrowth pattern of the white populationis similar to the overall populationchange in the region: a significantincrease in the outer-ring suburbs, anda decrease in inner city and inner-ringsuburbs. The downtown experienceda decline in white population during the1970s that was reversed in thefollowing decades.
Overall, however, there was adecrease in white population from 3.9million in 1970 to 3.6 million in 2000,suggesting white flight from the region.This white flight was strongest in theinner city and inner-ring suburbs.Minority population growth
compensated for the loss of whitepopulation in the region. In the 1990s,the black population increased 12.9percent and the Hispanic populationincreased 54.4 percent. Although mostof the black population lives in the innercity, the growth rates of the blackpopulation have been substantial in theinner- and outer-ring suburbs.
Hispanics are Philadelphia’s fastestgrowing minority, increasing over 200percent between 1970 and 2000. Whilethe majority of the Hispanic population,like the black population, is in the innercity, all subareas (excluding thedowntown) experienced very highrates of population growth during the
Figure 4. Tracts with Population Losses
Figure 5. Changes in Young and Elderly
Population

22 Opolis | Volume 1, Number 1: Winter 2005
past decades.
Figure 4 depicts our analysis of thenumber of growing and decliningcensus tracts by population between1970 and 2000. Graph 1 within thefigure indicates that 51 percent ofcensus tracts in the inner city and 38percent in the inner-ring suburbs arelosing population. Graph 2 provides thepercentage of tracts losing populationin each subarea (outer-ring, inner-ring,inner city, and downtown) and theregion as a whole. In the region, 56percent of the total tracts lostpopulation during the past 30 years.The tracts losing population were mostlikely to be located in the inner city andinner-ring suburbs. Seventy percent ofinner-ring suburban tracts experiencedpopulation loss, compared to 87percent of the inner city.
We next conducted an age cohortanalysis to identify potential economicchanges and opportunities for sub-areas. A subarea that has a growingcohort of young workers and ashrinking cohort of retirees is regardedas one with strong economic potential(Metropolitan Philadelphia PolicyCenter 2001). Growth in the working-age cohort suggests increasedemployment, income, and demand forowner-occupied housing. While growthin the elderly cohort may suggesteconomic stagnation, an increasecould provide opportunities forstrategic economic development if thisgroup is composed of affluent retireeswith high demands for entertainment,recreation, and medical services.
Figure 5 illustrates change in theproportion of young workers andseniors for each subarea. DowntownPhiladelphia saw an increase of young
population and a decrease of elderlypopulation, while the reverse patternoccurred in the inner-ring suburbs. In1970, the inner-ring suburbs had thesmallest proportion of elderlypopulation (7.5 %), but by 2000, theyhad the largest (16.5%). Thus,Philadelphia’s inner-ring suburbanpopulation is aging.
We conducted ANOVA multiplecomparison tests to determine thesignificance of minority populationchange in each year and populationchange rate in each decade (seeAppendix Tables A and B). We foundthe mean differences in the proportionof minority population for “Inner Cityversus Downtown” and “Inner-Ringversus Outer-Ring” pairs becamestatistically significant over time. Thatis, the minority population increased inthe inner city compared to thedowntown and increased in the innerring compared to the outer ring.
The mean difference ANOVA test ofthe population change rate for eachdecade also shows that there existstatistically different growth rates inpopulation for “Inner City versusDowntown” and “Inner-Ring versusOuter-Ring” pairs, while the populationgrowth pattern is similar for “Inner Cityversus Inner-Ring” (see AppendixTable B). The population growth ratein the downtown has been higher thanthe inner city and inner-ring suburbssince 1980, and the differences arestatistically significant. The populationgrowth rate in the outer ring issignificantly higher than in the innerring, while the mean difference ofpopulation growth rate is insignificantbetween the inner city and inner-ringsuburbs.

23Leigh and Lee: Philadelphia’s Space In Between
Socioeconomic Analysis
Population change alone is not asufficient indicator for analyzing thegrowth and decline of inner-ringsuburbs. For example, the populationgains associated with the migration oflow-income households may be lesslikely to result in neighborhoodrevitalization. We therefore examine
changes in the status of underclasshouseholds within each of themetropolitan subareas by calculatingpoverty levels as well as the proportionof female-headed, minority householdswith children, and of householdsreceiving public assistance.Figure 6 illustrates the change inunderclass households for each sub-area. In both graphs it can be seen that
Figure 6. Change in Underclass Households
Figure 7. Changes in Poverty Rate for Downtown, Inner City, Inner Ring,Outer Ring, and Region
24 Opolis | Volume 1, Number 1: Winter 2005
the proportion of underclass groupshas declined in the downtown andincreased in the inner-ring suburbs.Furthermore, there is a widening gapin the proportion of underclasshouseholds not only between thedowntown and the inner city, but alsobetween the inner ring and outer ring.Although the proportion of underclasshouseholds in the inner city is stillrelatively high and increasing, theinner-ring suburbs also show asignificant increase in underclasspopulation over time.
As shown in Figure 7, the overallpoverty rate of persons in the metroPhiladelphia region increased from 9.8percent in 1970 to 11.2 percent in 2000(see Graph 2). Although the povertyrates for the downtown and inner cityare still significantly higher than theinner- and outer-ring suburbs for everydecade, the downtown shows acontinuous decline of poverty from 21.3percent in 1970 to 17.3 percent in2000. In contrast, poverty increased7.6 percent in the inner city and 1.7percent in the inner-ring suburbsbetween 1970 and 2000.
With the continual decline of thedowntown poverty rate, the povertygap between the downtown andsuburbs is narrowing. At the same time,the poverty gap between the downtownand inner city is widening. In addition,the poverty gap is widening betweenthe inner-ring suburbs and outer-ringsuburbs.
In Figure 7, the poverty level of personsby race shows that poverty is highlypervasive among the minoritypopulation residing in the downtownand inner city. Hispanics made up agrowing percentage of the poverty
population (from 2.9 percent in 1970to 14.2 percent in 2000), while thepercentage of whites and blacks inpoverty declined.
Metro Philadelphia’s 7.4 percentdecrease in white population between1970 and 2000, combined with anincreasing white poverty rate, suggeststhat white flight beyond the metroboundaries has occurred in the middle-and upper-income households. Incontrast, the steady increase of blackpopulation and dramatic growth ofHispanic population in the region,accompanied by a decline in poverty,suggests that Philadelphia is becominga home for more affluent blacks andHispanics.
Our analysis also examines socio-economic differentiation within thecontext of intra-metropolitan disparityand divergence. We analyze four sub-areas (downtown, inner city, inner ring,and outer ring) to obtain a betterunderstanding of intra-metropolitanchange.
We examine two income variables: theRelative Per Capita Income (RPCI) tothe regional average and the GINIcoefficient for RPCI. The Per CapitaIncome (PCI) was calculated asaggregated household income dividedby total population in each subarea.We calculated a GINI inequality indexusing RPCI in each subarea followingthe method proposed by Flückiger andSilber (1999).
In Table 3, it can be seen that the outer-ring suburbs experienced a constantincrease in the RPCI from 1970 to2000. The RPCI in the outer-ringsuburbs was 99.8 percent of theaverage of the metro region in 1970,

25Leigh and Lee: Philadelphia’s Space In Between
and increased to 120 percent in 2000.In contrast, the inner city and inner ringexperienced a continual decline in percapita income from 1970 to 2000. Thegap in the RPCI increased more than15 percent between the outer ring andinner ring in 2000.
The GINI inequality coefficient in themetro region increased significantlyfrom 0.175 in 1970 to 0.249 in 1990,and increased slightly during the1990s. Overall, the GINI index rose42.3 percent during the 30-year period(see Table 3). Income inequality isrelatively high in the downtown andinner city, compared to the inner- andouter-ring suburbs. In particular, thedynamic change of the GINI coefficientin the downtown and the inner city iscorrelated with the population changesin Table 2, and is suggestive ofgentrification. That is, gentrification byupper-class households moving intothe poor neighborhoods of thedowntown and inner city is most likelyincreasing the GINI inequalitycoefficient for these sub-areas.
The ANOVA multiple comparison
analysis for socioeconomic variablesalso confirms the intra-metropolitanspatial differentiation and increasedeconomic inequalities. The exploredsocioeconomic variables are two staticvariables (poverty rate and RPCI) foreach year and one dynamic variable(PCI change) for each decade.
The mean differences in poverty ratewere statistically significant for mostcomparison group pairs in each year.The mean difference in poverty rate of“Inner City versus Downtown” becameinsignificant over time only because thedowntown experienced dramaticdeclines in poverty for each decade.We also analyzed trends in incomedifferentiation between subareas overtime. In particular, the RPCI of theinner-ring suburbs was 10.7 percenthigher than the outer-ring suburbs in1970, but was 11.7 percent lower thanthe outer-ring suburbs in 2000 (seeAppendix Table A). That is, the inner-ring suburbs have experienced asignificant income decline relative tothe outer-ring suburbs. The meandifference of the average PCI changefor each decade supports significant
Table 3. Intra-Metropolitan Income Disparity and Divergence
Subarea 1970 1980 1990 2000 Change (70-00)
Downtown 140.80% 159.70% 163.10% 152.40% 11.60%
Inner City 92.00% 82.30% 75.10% 70.60% -
21.40%
Inner Ring 109.00% 111.20% 108.20% 104.60% -4.40%
Relative Per Capita Income
(RPCI) to Regional
Average Outer Ring 99.80% 108.20% 115.90% 120.00% 20.40%
Downtown 0.289 0.232 0.252 0.286 -0.003
Inner City 0 .226 0.251 0.300 0.311 0.085
Inner Ring 0.154 0.153 0.196 0.190 0.036
GINI Coefficient for the RPCI
Outer Ring 0.119 0.142 0.179 0.180 0.061
Region 0.175 0.194 0.241 0.249 0.075
26 Opolis | Volume 1, Number 1: Winter 2005
income growth in the outer-ringsuburbs relative to the inner-ringsuburbs. The difference of the PCIchange rate is statistically significantbetween the inner ring and outer ringfor all decades, while it has becomeinsignificant between the downtownand inner city over time (see AppendixTable B).Housing Analysis
The number of housing units in thePhiladelphia eight-county metro regionincreased from 1.5 million in 1970 to2.0 million in 2000. During the lastdecade, however, only the outer-ringsuburbs experienced a substantialincrease in total housing units, whilethe downtown and inner cityexperienced decreases in the absolutenumber of total housing units.
The decrease of total housing stock inthe downtown and inner city is due tothe demolition of vacant housing units.However, the significant decrease ofvacant housing stock in the downtownin the 1990s is correlated withincreasing demands for downtownhousing because the downtownexperienced increases in the numberof owner-occupied housing as well asrenter-occupied housing units in the1990s.
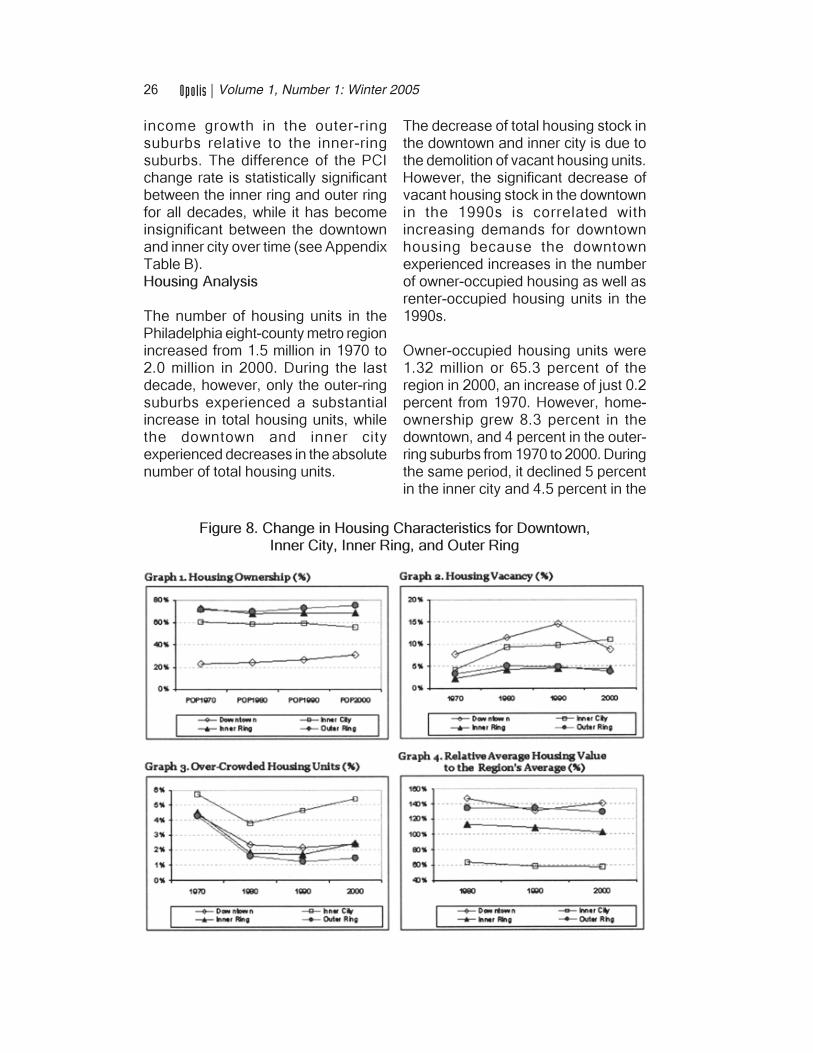
Owner-occupied housing units were1.32 million or 65.3 percent of theregion in 2000, an increase of just 0.2percent from 1970. However, home-ownership grew 8.3 percent in thedowntown, and 4 percent in the outer-ring suburbs from 1970 to 2000. Duringthe same period, it declined 5 percentin the inner city and 4.5 percent in the
Figure 8. Change in Housing Characteristics for Downtown,Inner City, Inner Ring, and Outer Ring

27Leigh and Lee: Philadelphia’s Space In Between
inner-ring suburbs. This may suggestthat the neighborhood structure of theinner city and the inner-ring suburbshas become less stable.
As shown in Graph 2 of Figure 8,vacant housing units decreased in thedowntown dramatically in the 1990s,after experiencing a steady increasebetween 1970 and 1990. Over thesame period, the inner city had a 6.7percent increase and the inner-ringsuburbs had a 2.1 percent increase inempty housing units.
Analyzing changes in housingdeficiencies as indicated by a lack ofcomplete kitchen facilities and over-crowded housing for the 30-yearperiod, we found increases in housingunits that lack complete kitchenfacilities and are over-crowded. Thissuggests a gradual deterioration inhousing stock in the inner city andinner-ring suburbs relative to thedowntown and outer-ring suburbs.While there was a significant drop inover-crowded housing units from 1970to 1980 in the inner city and inner-ring,this trend was reversed between 1980and 2000. In particular, there has beena dramatic increase in the problem ofover-crowded housing in the inner city(see Graph 3 in Figure 8).
Our analysis of housing stockdemonstrates significant intra-metropolitan spatial differentiation overtime in housing values trends. In Graph4 of Figure 8, we depict changes inaverage housing value relative to theregion’s average for each subarea. Itcan be seen that the outer-ring suburbshave relatively higher housing valuescompared to the inner-ring suburbs.While the average housing value in thedowntown rebounded in the 1990s, it
declined in the other three subareas.Particularly noteworthy is that theaverage housing value in the inner-ringsuburbs relative to that of the regiondropped 11 percent between 1980 and2000 (from 113 percent to 102percent).
We tested mean differences forhousing ownership and averagehousing value between subareas usingthe ANOVA analysis. As shown inAppendix Table A, the meandifferences of homeownership werestatistically significant for the“Downtown versus Inner City” and“Inner City versus Inner Ring” pairs foreach year. Although the housingownership rate was insignificant for the“Inner Ring versus Outer Ring” pairfrom 1970 and 1990, it becamesignificant in 2000. The averagehousing value as a percentage ofregional average also showssignificant differences betweensubareas.
Our ANOVA analysis for the housingvalue change in each decade indicatesthat there was a relatively lowerincrease in housing value for the inner-ring suburbs compared to the inner cityand the outer ring. In particular, theincrease of housing value in the innercity in the 1990s exceeded that of theinner-ring suburbs as well as the outer-ring suburbs (see Appendix Table B).
Conclusion and Policy Implications
While the revitalization of central citiesand inner cities has been a majorconcern to planners and policy makersfor several decades, the need torevitalize the inner-ring suburbs hasonly recently begun to receivesignificant recognition. In this article,

28 Opolis | Volume 1, Number 1: Winter 2005
we have examined earlier work thatseeks to explain suburbandifferentiation and decline, andprovided our own empirical insight intothe status of inner-ring suburbs throughan analysis of the metropolitanPhiladelphia region. The importantfindings are as follows:
First, we have demonstrated that thedichotomous approach of central cityversus the suburbs as a whole is notappropriate for intra-metropolitananalysis. Indeed, the different growthpatterns between the inner-ringsuburbs and outer-ring suburbs wehave identified in Philadelphia in termsof population composition, incomelevels, and housing stock illustrate thefallacy of treating suburbs as ahomogeneous area for analytical andplanning purposes. These suburbantypes are not alike. Therefore, researchand policy development at themetropolitan level should distinguishbetween suburban rings (inner andouter, for example) in addition to thewell-defined central city.
Second, our analysis has confirmedthat there is an increased intra-metropolitan economic disparity anddivergence between metropolitan sub-areas. The gap in economic prosperitybetween the inner- and outer-ringsuburbs is widening over time.Computation of the GINI inequalityindex also showed an increase inincome inequality for the region.
Third, we showed that Philadelphia’sinner-ring suburbs exhibit symptoms ofdecline typically associated with innercities such as white flight, decrease inpopulation, increase in minority andlow-income households, and risingpoverty levels. Although the total
population in the inner-ring suburbsexhibited slight growth, many tracts lostpopulation in the 1990s. In particular,the inner-ring suburbs showedsignificant white flight, while the centralcity gained white population in its core.Furthermore, the poverty rate of theinner-ring suburbs increased during the1990s.
Last, our research validates ourconcern that the inner-ring suburbs areincreasingly vulnerable to economicdecline in the Philadelphia metropolitanregion. The downtown showedsignificant increases in whitepopulation and decreases in povertypopulation, and the outer-ring suburbsattracted significant population andhousing development. In contrast, theinner-ring suburbs are decliningoverall. The early signs of blight inPhiladelphia’s inner-ring suburbs (thearea between its inner city and outer-ring suburbs) should be seen as apotential threat to long-termmetropolitan prosperity and smartgrowth efforts.
There is a need to stem thedeterioration of the inner-ring suburbs,documented in our case study ofPhiladelphia, as well as to stem furthersprawl-contributing greenfielddevelopment on the metropolitanfringe. This suggests that strategicpolicy approaches should favor therevitalization and enhancement ofexisting, inner-ring physicalinfrastructure over new infrastructurecreation in the outer-ring suburbs.
The research method and analysisoffered in this paper are intended toform the beginnings of a modelapproach for analyzing inner-ringsuburbs in other metropolitan areas.
29Leigh and Lee: Philadelphia’s Space In Between
We believe from our survey of the fieldthat the urban and regional planningresearch community is in need of ashared platform to analyze and plan forpreserving and strengthening inner-ring suburbs, the essential “in-betweenspace” of the metropolitan area.Attention to this space will strengthenthe logic and effectiveness of SmartGrowth policies.
Authors
Nancey Green Leigh is a professor inthe College of Architecture at theGeorgia Institute of Technology andthe author of Economic Revitalization:Cases and Strategies for City andSuburb . Sugie Lee is a doctoralcandidate in City and RegionalPlanning at Georgia Tech.
References
Bier, Thomas. 2001. Moving Up,Filtering Down: MetropolitanHousing Dynamics and PublicPolicy. Washington, DC: TheBrookings Institution.
Bollens, S. A. 1988. Municipal Declineand Inequality in AmericanSuburban Rings, 1960-1980.Regional Studies 22, 4:277-285.
Design Center for American UrbanLandscape. 1999. Reframing the1945-1965 Suburb: A NationalConference on ContemporaryPublic Policy, and Scholarship.Conference Proceedings,University of Minnesota, January21-23, 1999. Retrieved October 26,2001, from www1.umn.edu/dcaul.
Downs, Anthony. 1997. The Challengeof our Declining Big Cities.
Housing Policy Debate 8(2):359-408.
Fishman, Robert. 2000. The AmericanMetropolis at Century’s End: Pastand Future Influences. HousingPolicy Debate 11(1): 199-213.
Flückiger, Yves and Jacques Silber.1999. The Measurement ofSegregation in the Labor Force.New York: Physica-Verlag.
Hayden, Dolores. 2000. BuildingSuburbia: Green Fields and UrbanGrowth 1820-2000. New York:Pantheon Books.
Hudnut, William H. 2003. Halfway toEverywhere: A Portrait ofAmerica’s First-Tier Suburbs.Washington, DC: Urban LandInstitute.
Jackson, Kenneth T. 1985. CrabgrassFrontier: The Suburbanization ofthe United States. New York:Oxford University Press.
Kotkin, Joel. 2000. The NewGeography: How the DigitalRevolution is Reshaping theAmerican Landscape. New York:Random House.
Kotkin, Joel. 2001. Inner-ring Suburbs:Crabgrass Slums or New UrbanFrontier? Reason Public Policy
Institute, Policy Study 285.
Lucy, W., and D. Phillips. 2000a.Confronting Suburban Decline,Strategic Planning for MetropolitanRenewal. Washington, DC: IslandPress

30 Opolis | Volume 1, Number 1: Winter 2005
Lucy, W., and D. Phillips. 2000b.Suburban Decline: The Next UrbanCrisis, Issues in Science andTechnology, Fall.
Lucy, W., and D. Phillips. 2001.Suburbs and the Census: Patternsof Growth and Decline.Washington, DC: The BrookingsInstitution.
Metropolitan Philadelphia PolicyCenter. 2001. Flight? Or Fight!Metropolitan Philadelphia and ItsFuture. Regional Report 2001.
Orfield, Myron. 1997. Metropolitics: ARegional Agenda for CommunityStability. Washington, DC: TheBrookings Institution.
Orfield, Myron. 2001. AmericanMetropolitics: Social Segregationand Sprawl. Washington, DC: TheBrookings Institution.
Persky, Joseph and Wim Wiewel.2000. When Corporations LeaveTown: The Costs and Benefits ofMetropolitan Job Sprawl. Detroit:Wayne State University Press.
Persky, Joseph and Haydar Kurban.2001. Do Federal Funds BetterSupport Cites or Suburbs? ASpatial Analysis of FederalSpending in the ChicagoMetropolis. Washington, DC:Center on Urban and MetropolitanPolicy, The Brookings Institution.
Puentes, Robert and Myron Orfield.2002. Valuing America’s FirstSuburbs: A Policy Agenda for OlderSuburbs in the Midwest.Washington, DC: The BrookingsInstitution.
Rusk, David. 1999. Inside Game/Outside Game, Winning Strategiesfor Saving Urban America.Washington, DC: The BrookingsInstitution.
Seaver, Darcy, Bill Morris, and RipRapson. 1998. Old Suburbs in NewTimes: Repositioning Post-WWIISuburbia. The Commissioner,Summer.
Simmons, Patrick A. and Robert E.Lang. 2001. The UrbanTurnaround: A Decade-by-decadeReport Card on PostwarPopulation Change in OlderIndustrial Cities. Washington, DC:The Fannie Mae Foundation.
Smith, Neil, Paul Caris, and Elvin Wyly.2001. The “Camden syndrome”and the menace of suburbandecline: Residential disinvest-ments and its discounts in Camdencounty, New Jersey. Urban AffairsReview 35, 4: 497-531.
Sohmer, Rebecca R., and Robert E.Lang. 2001. Downtown Rebound.Washington, DC: The Fannie MaeFoundation and The BrookingsInstitution.

31Leigh and Lee: Philadelphia’s Space In Between
Table A. ANOVA Multiple Comparison Analysis for Mean Differences
ANOVA Multiple Mean Differences (%) Variables
Comparison Groups 1970 1980 1990 2000
Inner City – Downtown -2.9 9.7 14.9 20.9*
Inner Ring - Downtown -22.5** -14.2 -11.8 -8.5
Inner Ring - Inner City -19.6** -23.9** -26.8** -29.4**
Inner Ring - Outer Ring 1.8 4.2 5.9* 9.0**
Outer Ring - Inner City -21.4** -28.1** -32.7** -38.4**
Minority Population Rate
Outer Ring - Downtown -24.3** -18.3** -17.7* -17.5*
Inner City - Downtown -9.9** -1.4 -2.0 1.2
Inner Ring - Downtown -17.8** -13.2** -14.3** -12.3**
Inner Ring - Inner City -7.9** -11.9** -12.4** -13.5**
Inner Ring - Outer Ring -0.4 -0.8 -2.0 -2.3*
Outer Ring - Inner City -7.5** -12.7** -14.3** -15.8**
Poverty Rate
Outer Ring - Downtown -17.4** -14.1** -16.3** -14.6**
Inner City - Downtown -36.7** -54.0** -64.7** -66.5**
Inner Ring - Downtown -26.2** -32.0** -39.6** -40.0**
Inner Ring - Inner City 10.4** 22.0** 25.1** 26.5**
Inner Ring - Outer Ring 10.7** 3.2 -5.0 -11.7**
Outer Ring - Inner City -0.2 18.8** 30.1** 38.2**
Percentage of Average Per Capita Income to Region's Average
Outer Ring - Downtown -36.9** -35.2** -34.7* -28.2 *
Inner City - Downtown 32.1** 36.7** 34.9** 24.9**
Inner Ring - Downtown 44.2** 47.1** 45.1** 39.1**
Inner Ring - Inner City 12.2** 10.4** 10.3** 14.2**
Inner Ring - Outer Ring 1.6 -0.6 -2.6 -4.8**
Outer Ring - Inner City 10.6** 11.0** 12.8** 19.0**
Housing Ownership Rate
Outer Ring - Downtown 42.7** 47.7** 47.7** 43.9**
Inner City - Downtown - -92.7** -72.7** -68.0**
Inner Ring - Downtown - -49.4** -30.6 -33.0
Inner Ring - Inner City 11.4** 43.3** 42.1** 35.0**
Inner Ring – Outer Ring -3.6** -20.1** -23.8** -23.4**
Outer Ring – Inner City 15.0** 63.4** 65.9** 58.3**
Percentage of Average Housing Value
to Region's Average
Outer Ring - Downtown - -29.3 -6.8 -9.6
* p < .05; ** p < .01
Appendix

32 Opolis | Volume 1, Number 1: Winter 2005
Table
B. A
NO
VA
Multip
le C
om
paris
on A
naly
sis
for C
hange R
ate
s
AN
OV
A M
ultip
le
Ave
rage C
ha
nge
Ra
te D
iffere
nces (%
)
Va
riable
s
Co
mparis
on G
roup
s
1970 -
1980
1980 -
1990
1990 -
2000
Inn
er C
ity - D
ow
nto
wn
-2
0.7
-3
8.1
** -1
9.0
*
Inn
er R
ing
- Do
wn
tow
n
18
.6
-36
.2**
-19
.6*
Inn
er R
ing
- Inn
er C
ity
39
.3
1.9
-0
.6
Inn
er R
ing
- Ou
ter R
ing
-1
8.6
-3
2.1
** -2
1.6
**
Ou
ter R
ing
- Inn
er C
ity
57
.9**
34
.0**
21
.1**
Po
pu
latio
n
Ou
ter R
ing
- Do
wn
tow
n
37
.2
-4.1
2
.0
Inn
er C
ity – D
ow
nto
wn
-5
5.9
* -3
5.0
** -4
.9
Inn
er R
ing
- Do
wn
tow
n
-29
.9*
-21
.4**
-0.7
Inn
er R
ing
- Inn
er C
ity
26
.0**
13
.7
4.1
Inn
er R
ing
- Ou
ter R
ing
-1
6.4
** -1
5.1
** -8
.3**
Ou
ter R
ing
- Inn
er C
ity
42
.3**
38
.8
12
.4**
Pe
r Ca
pita
Inc
om
e
Ou
ter R
ing
- Do
wn
tow
n
-13
.5
-6.3
** 7
.5
Inn
er C
ity - D
ow
nto
wn
-
-36
.6**
7.7
Inn
er R
ing
- Do
wn
tow
n
- -2
1.1
-6
.6
Inn
er R
ing
- Inn
er C
ity
22
.6**
15
.5**
-14
.2**
Inn
er R
ing
- Ou
ter R
ing
-3
5.0
** -1
2.3
** -2
.5
Ou
ter R
ing
- Inn
er C
ity
57
.6**
27
.9**
-11
.7**
Av
era
ge
Ho
us
ing
Va
lue
Ou
ter R
ing
- Do
wn
tow
n
- -8
.7
-4.1
* p <
.05
; ** p <
.01