Operations Management Waiting Lines. 2 Ardavan Asef-Vaziri Dec-2010Operations Management: Waiting...
28
Operations Management Waiting Lines
-
date post
19-Dec-2015 -
Category
Documents
-
view
221 -
download
4
Transcript of Operations Management Waiting Lines. 2 Ardavan Asef-Vaziri Dec-2010Operations Management: Waiting...
Operations Management
Waiting Lines
2Ardavan Asef-Vaziri Dec-2010Operations Management: Waiting Lines1
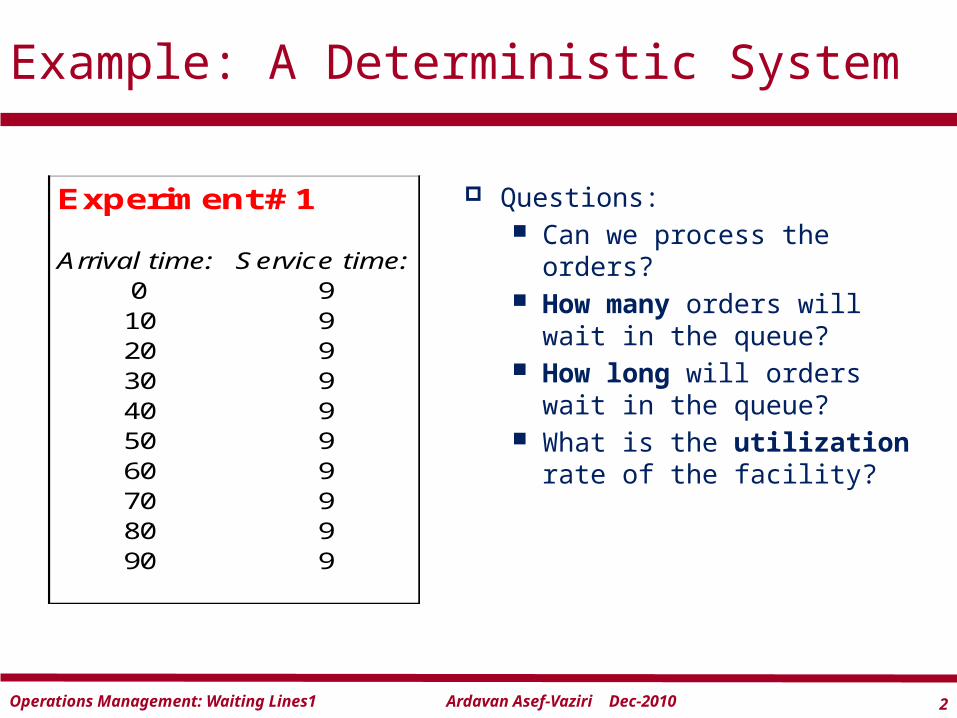
Questions: Can we process the orders? How many orders will wait
in the queue? How long will orders wait
in the queue? What is the utilization
rate of the facility?
Example: A Deterministic System
Experiment # 1
Arrival time: Service time:0 910 920 930 940 950 960 970 980 990 9

3Ardavan Asef-Vaziri Dec-2010Operations Management: Waiting Lines1
A Deterministic System: Example 1
Interarrival time Throughput TimeDeparture TimeWaiting Time in Queue9.0 9.0 0.0
10.0 9.0 19.0 0.010.0 9.0 29.0 0.010.0 9.0 39.0 0.010.0 9.0 49.0 0.010.0 9.0 59.0 0.010.0 9.0 69.0 0.010.0 9.0 79.0 0.010.0 9.0 89.0 0.010.0 9.0 99.0 0.0
4Ardavan Asef-Vaziri Dec-2010Operations Management: Waiting Lines1
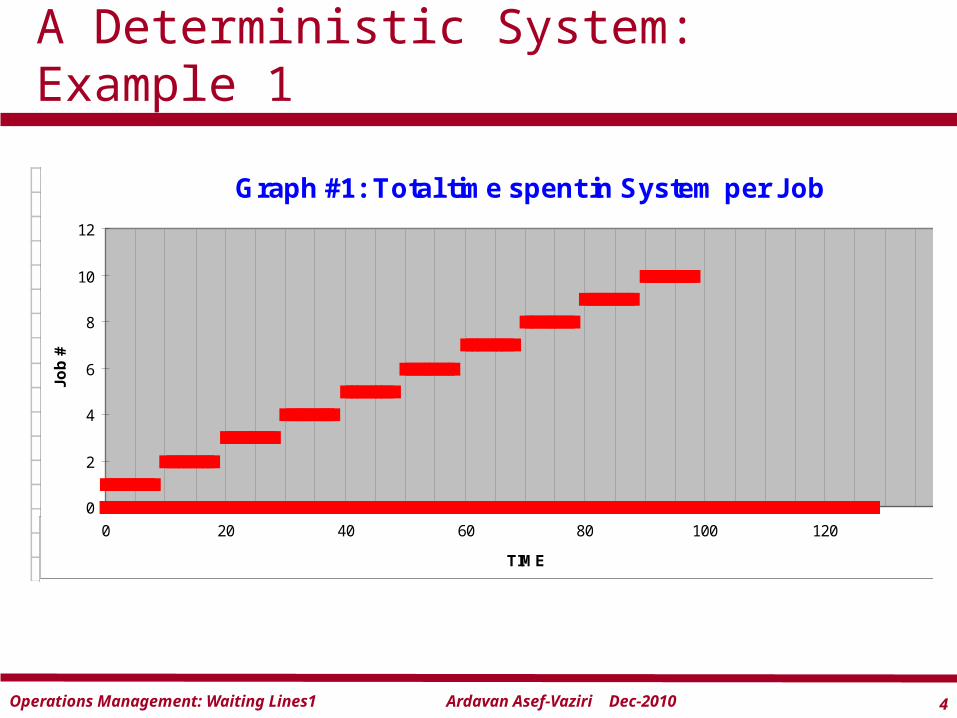
A Deterministic System: Example 1
789
10
Graph #2: Total #in system:
0
1
2
0 20 40 60 80 100 120
Graph #1: Total time spent in System per Job
0
2
4
6
8
10
12
0 20 40 60 80 100 120 140
TIME
Job
#
5Ardavan Asef-Vaziri Dec-2010Operations Management: Waiting Lines1
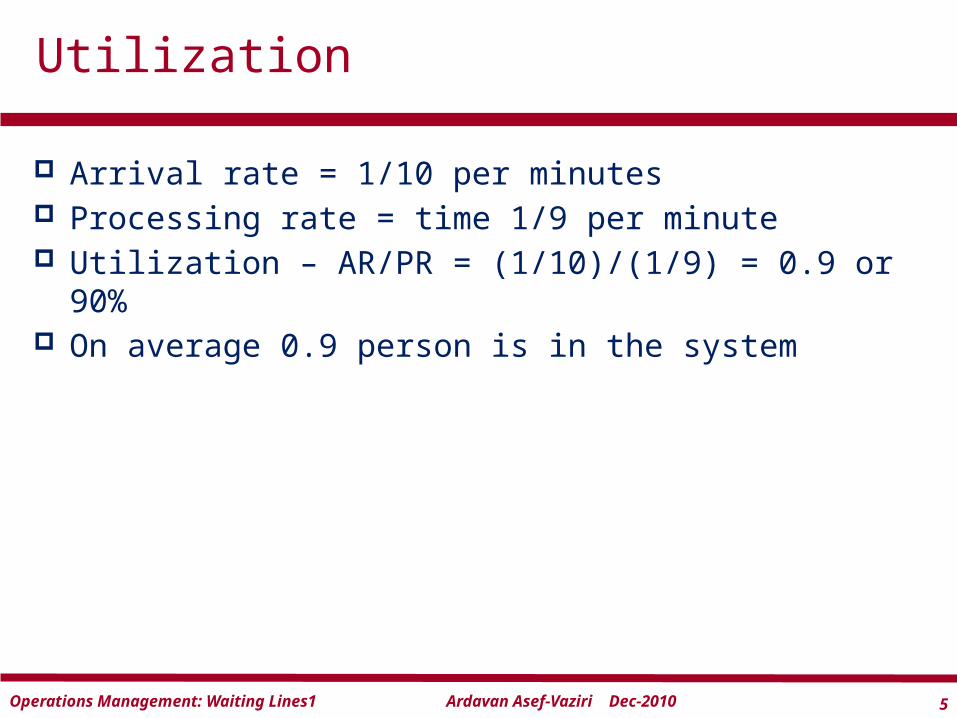
Arrival rate = 1/10 per minutes Processing rate = time 1/9 per minute Utilization – AR/PR = (1/10)/(1/9) = 0.9 or 90% On average 0.9 person is in the system
Utilization
6Ardavan Asef-Vaziri Dec-2010Operations Management: Waiting Lines1
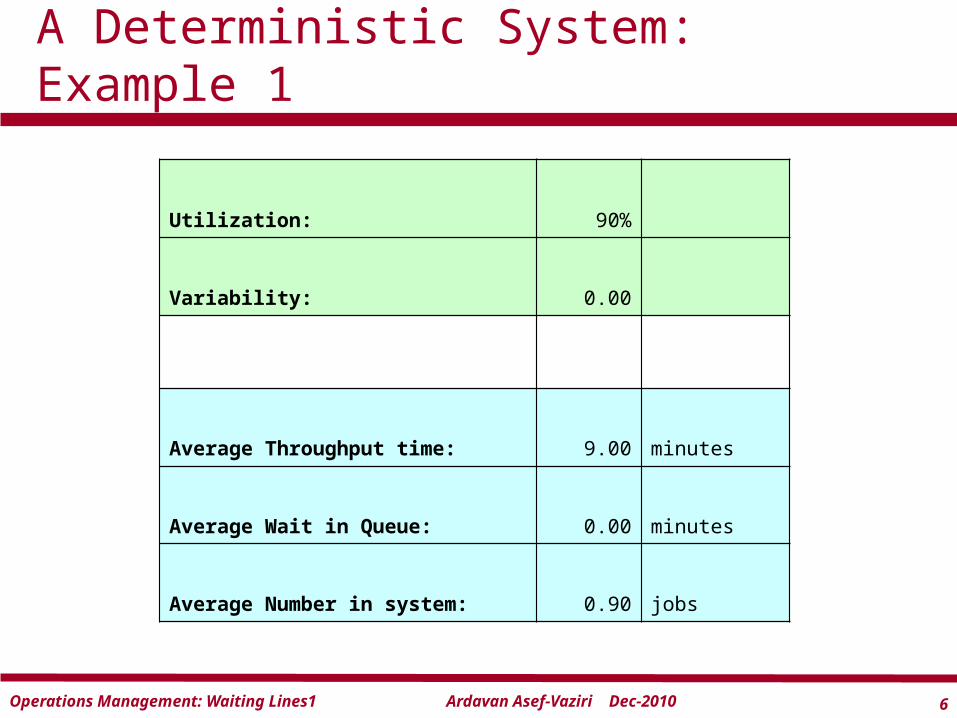
A Deterministic System: Example 1
Utilization: 90%
Variability: 0.00
Average Throughput time: 9.00 minutes
Average Wait in Queue: 0.00 minutes
Average Number in system: 0.90 jobs
7Ardavan Asef-Vaziri Dec-2010Operations Management: Waiting Lines1
What if arrivals are not exactly every 10 minutes? Let’s open the spreadsheet.
Known but Uneven Demand: Example 2
8Ardavan Asef-Vaziri Dec-2010Operations Management: Waiting Lines1
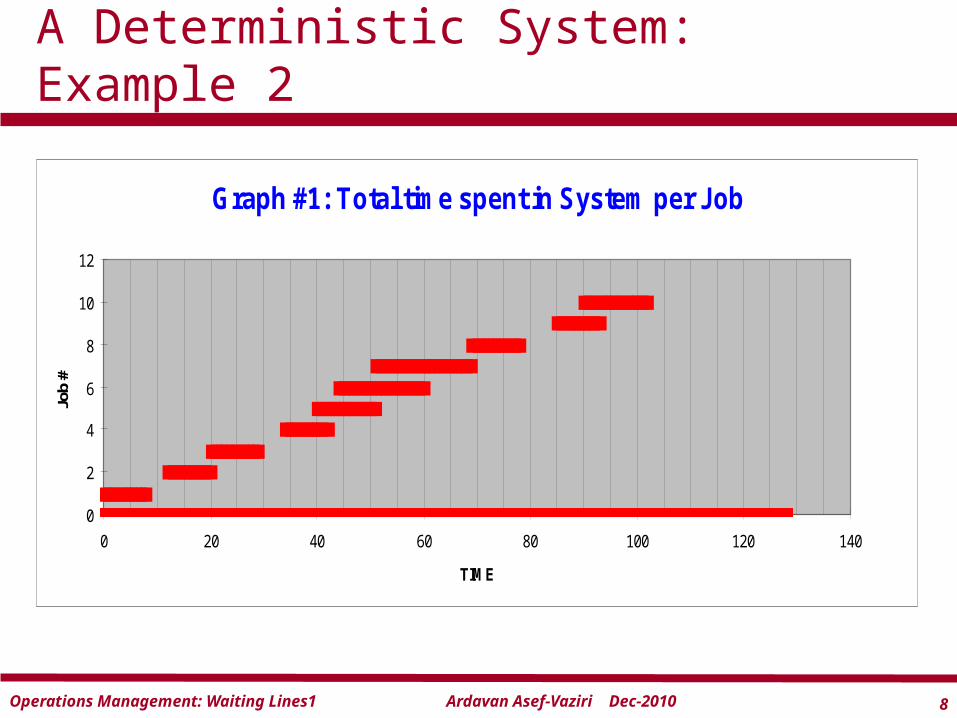
A Deterministic System: Example 2
Graph #1: Total time spent in System per Job
0
2
4
6
8
10
12
0 20 40 60 80 100 120 140
TIME
Job
#
9Ardavan Asef-Vaziri Dec-2010Operations Management: Waiting Lines1
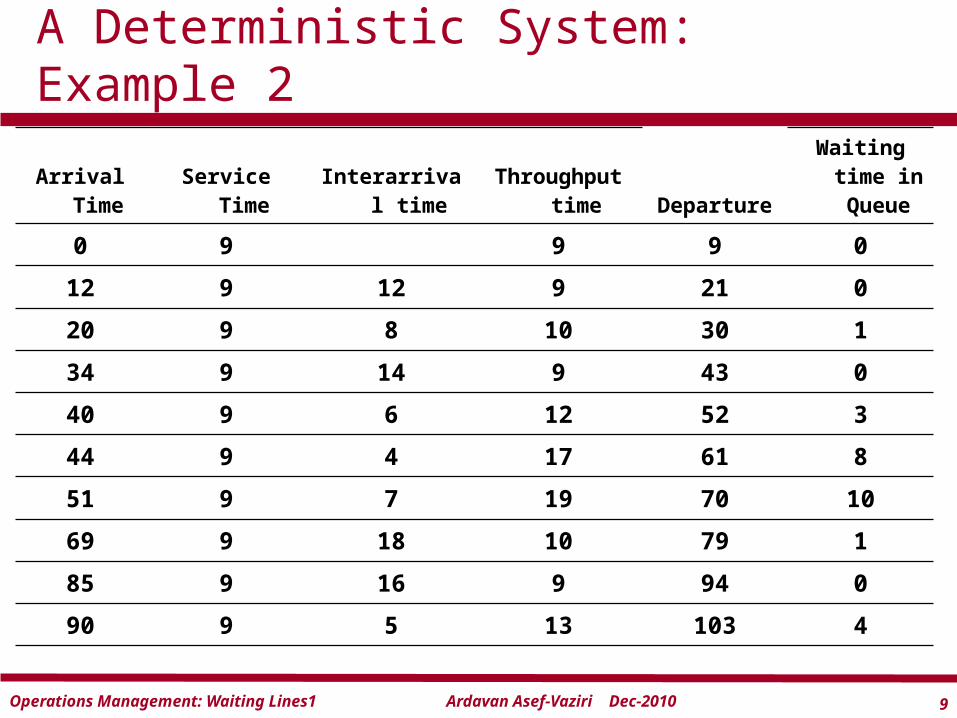
A Deterministic System: Example 2
Arrival Time
Service Time
Interarrival time
Throughput time Departure
Waiting time in Queue
0 9 9 9 0
12 9 12 9 21 0
20 9 8 10 30 1
34 9 14 9 43 0
40 9 6 12 52 3
44 9 4 17 61 8
51 9 7 19 70 10
69 9 18 10 79 1
85 9 16 9 94 0
90 9 5 13 103 4
10Ardavan Asef-Vaziri Dec-2010Operations Management: Waiting Lines1
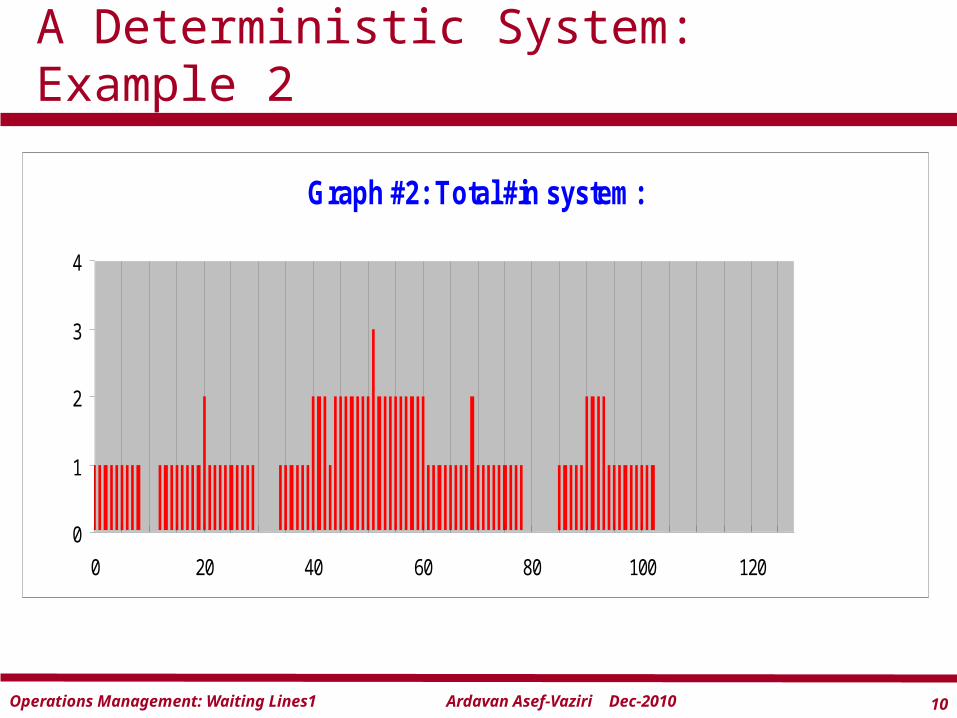
A Deterministic System: Example 2
Graph #2: Total #in system:
0
1
2
3
4
0 20 40 60 80 100 120
11Ardavan Asef-Vaziri Dec-2010Operations Management: Waiting Lines1
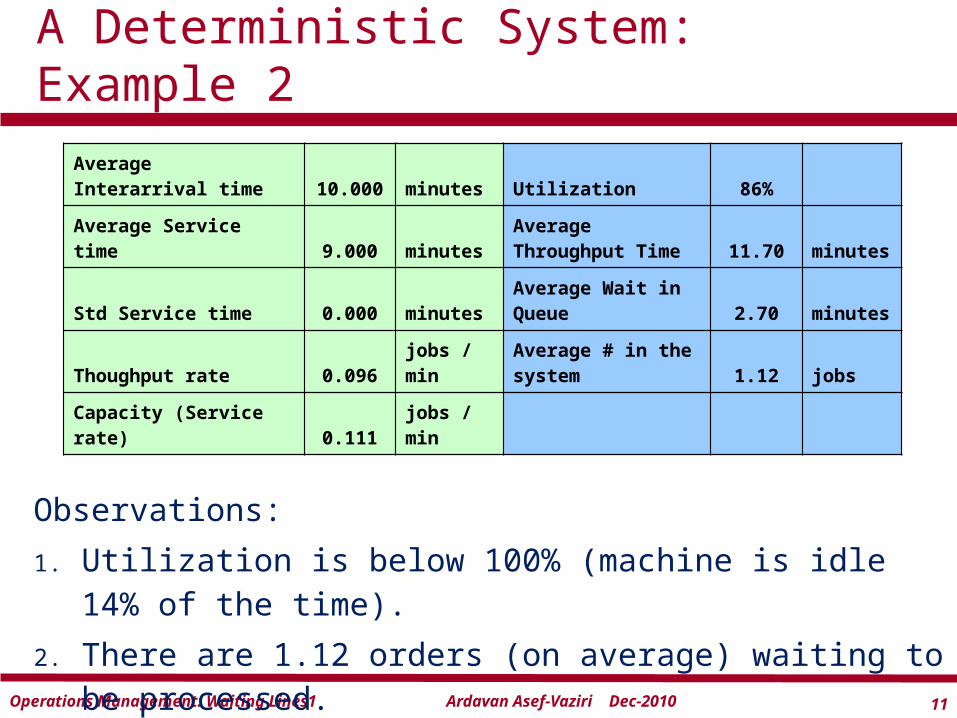
Observations:
1. Utilization is below 100% (machine is idle 14% of the time).
2. There are 1.12 orders (on average) waiting to be processed.
A Deterministic System: Example 2
Average Interarrival time 10.000 minutes Utilization 86%
Average Service time 9.000 minutes
Average Throughput Time 11.70
minutes
Std Service time 0.000 minutesAverage Wait in Queue 2.70
minutes
Thoughput rate 0.096jobs / min
Average # in the system 1.12 jobs
Capacity (Service rate) 0.111
jobs / min
12Ardavan Asef-Vaziri Dec-2010Operations Management: Waiting Lines1
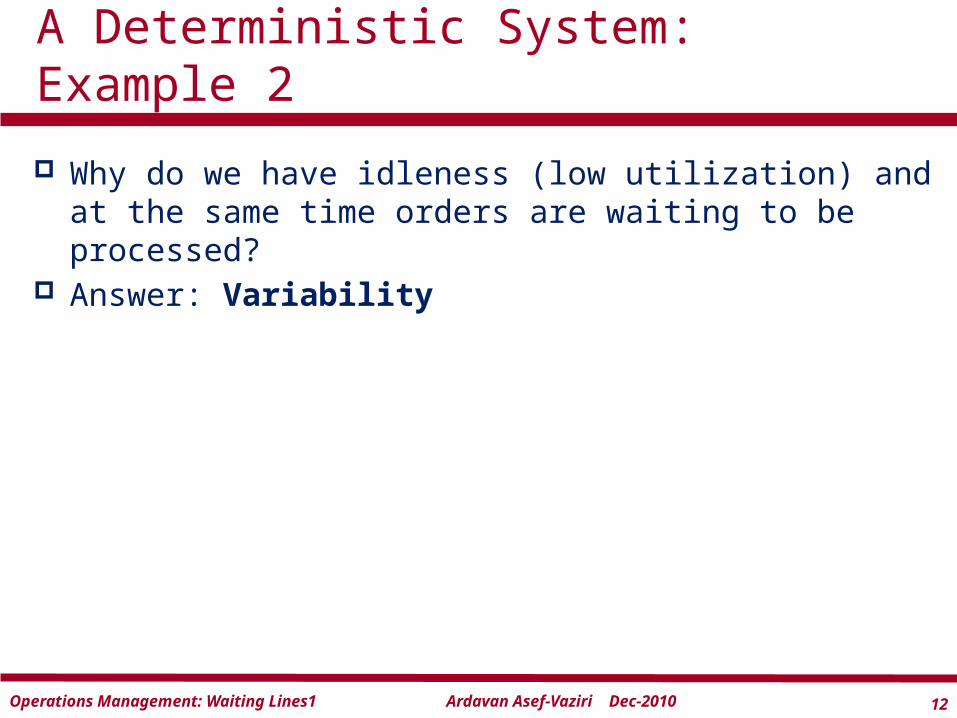
Why do we have idleness (low utilization) and at the same time orders are waiting to be processed?
Answer: Variability
A Deterministic System: Example 2
13Ardavan Asef-Vaziri Dec-2010Operations Management: Waiting Lines1
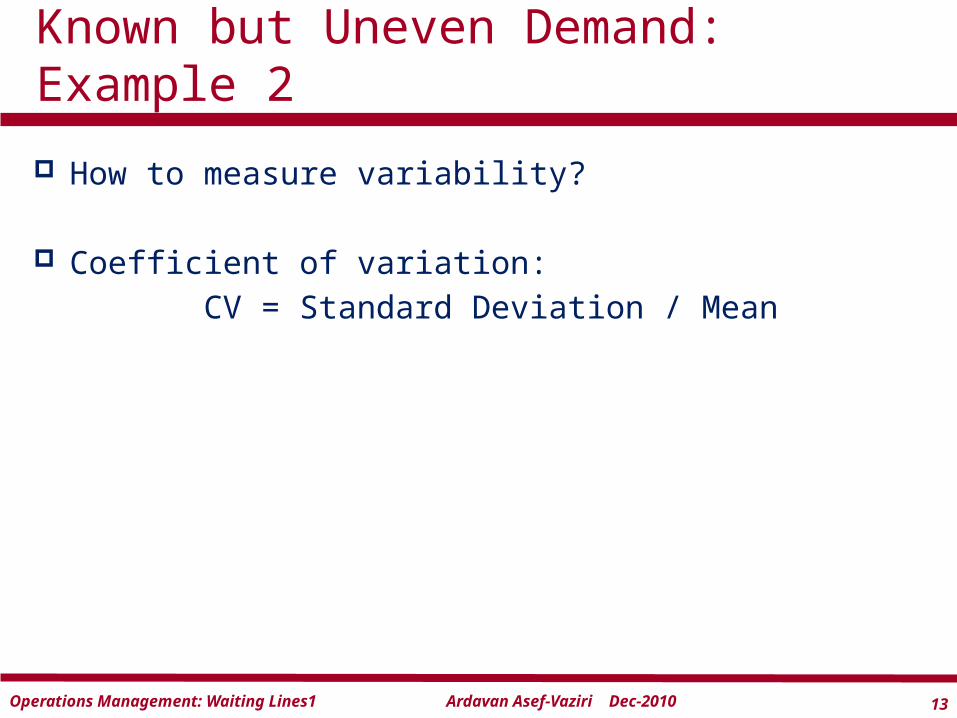
How to measure variability?
Coefficient of variation:CV = Standard Deviation / Mean
Known but Uneven Demand: Example 2
14Ardavan Asef-Vaziri Dec-2010Operations Management: Waiting Lines1
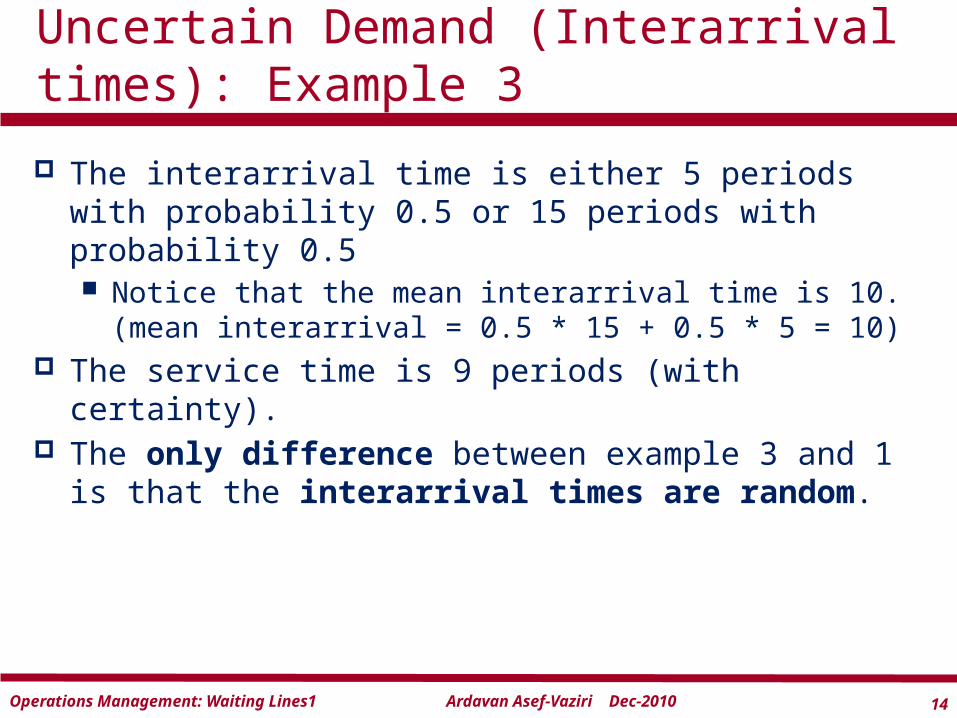
The interarrival time is either 5 periods with probability 0.5 or 15 periods with probability 0.5 Notice that the mean interarrival time is 10. (mean
interarrival = 0.5 * 15 + 0.5 * 5 = 10) The service time is 9 periods (with certainty). The only difference between example 3 and 1 is that
the interarrival times are random.
Uncertain Demand (Interarrival times): Example 3
15Ardavan Asef-Vaziri Dec-2010Operations Management: Waiting Lines1
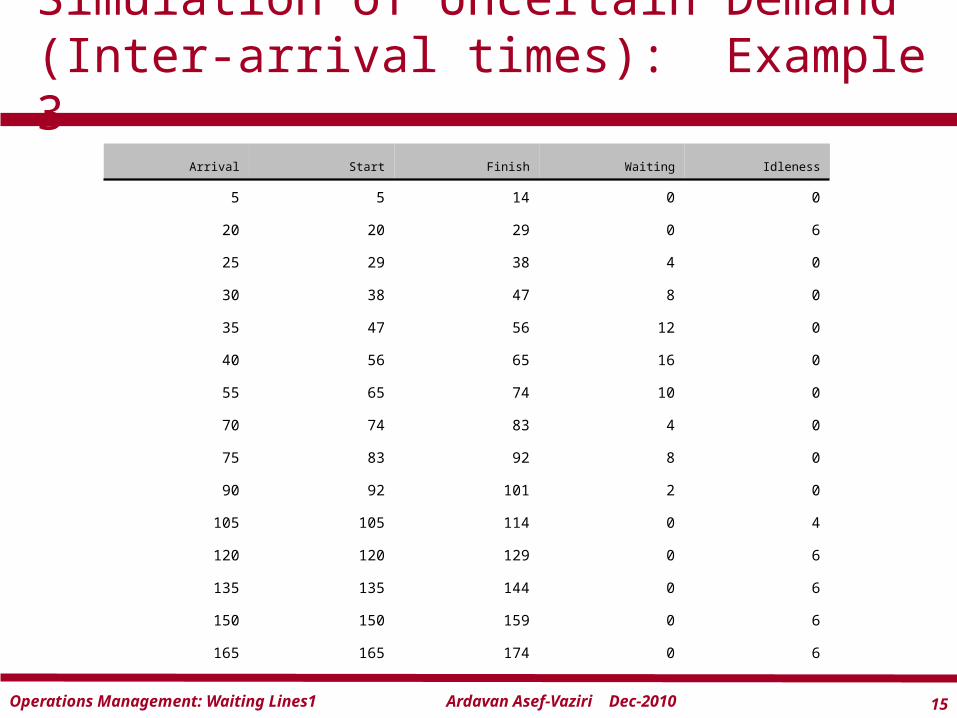
Simulation of Uncertain Demand (Inter-arrival times): Example 3
Arrival Start Finish Waiting Idleness
5 5 14 0 0
20 20 29 0 6
25 29 38 4 0
30 38 47 8 0
35 47 56 12 0
40 56 65 16 0
55 65 74 10 0
70 74 83 4 0
75 83 92 8 0
90 92 101 2 0
105 105 114 0 4
120 120 129 0 6
135 135 144 0 6
150 150 159 0 6
165 165 174 0 6
16Ardavan Asef-Vaziri Dec-2010Operations Management: Waiting Lines1
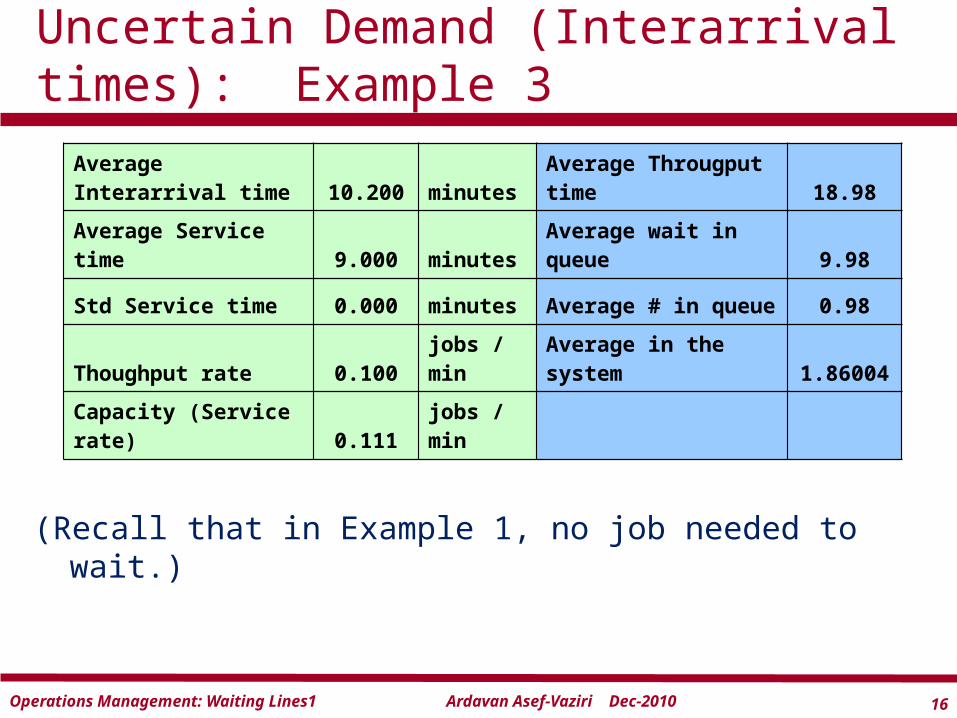
(Recall that in Example 1, no job needed to wait.)
Uncertain Demand (Interarrival times): Example 3
Average Interarrival time 10.200 minutes
Average Througput time 18.98
Average Service time 9.000 minutes
Average wait in queue 9.98
Std Service time 0.000 minutesAverage # in queue 0.98
Thoughput rate 0.100jobs / min
Average in the system
1.86004
Capacity (Service rate) 0.111
jobs / min
17Ardavan Asef-Vaziri Dec-2010Operations Management: Waiting Lines1
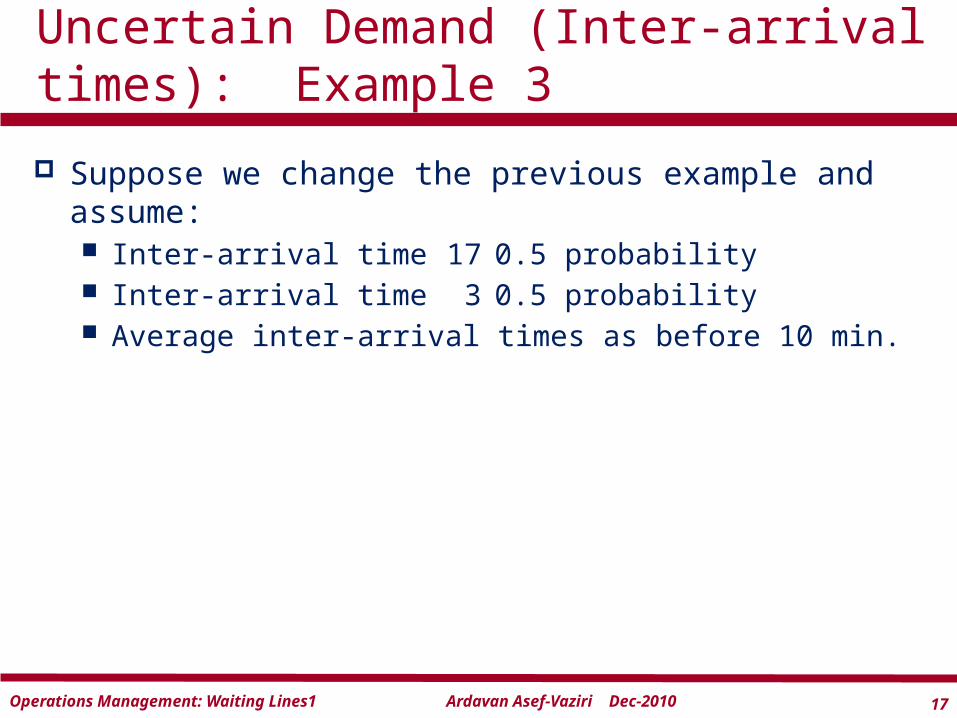
Suppose we change the previous example and assume: Inter-arrival time 17 0.5 probability Inter-arrival time 3 0.5 probability Average inter-arrival times as before 10 min.
Uncertain Demand (Inter-arrival times): Example 3
18Ardavan Asef-Vaziri Dec-2010Operations Management: Waiting Lines1
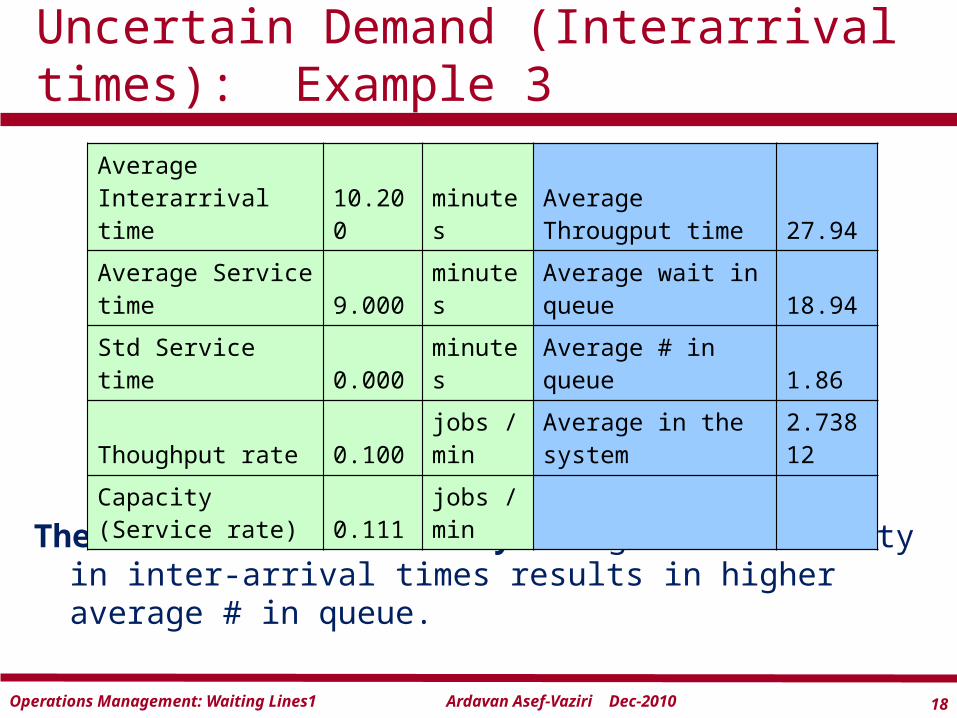
The effect of variability: higher variability in inter-arrival times results in higher average # in queue.
Uncertain Demand (Interarrival times): Example 3
Average Interarrival time
10.200
minutes
Average Througput time 27.94
Average Service time 9.000
minutes
Average wait in queue 18.94
Std Service time 0.000minutes
Average # in queue 1.86
Thoughput rate 0.100jobs / min
Average in the system
2.73812
Capacity (Service rate) 0.111
jobs / min
19Ardavan Asef-Vaziri Dec-2010Operations Management: Waiting Lines1
Can we manage demand?
What are other sources of variability/uncertainty?
Can we reduce demand variability/uncertainty?
20Ardavan Asef-Vaziri Dec-2010Operations Management: Waiting Lines1
Up to now, our service time is exactly 9 minutes. What will happen to waiting-line and waiting-time if
we have a short service time (i.e., we have a lower utilization rate)?
What will happen if our service time is longer than 10 minutes?
Uncertain Demand (Inter-arrival times)
21Ardavan Asef-Vaziri Dec-2010Operations Management: Waiting Lines1
The factors that determine the performance of the waiting lines: Variability Utilization rate Risk pooling effect
Key Concepts and Issues
22Ardavan Asef-Vaziri Dec-2010Operations Management: Waiting Lines1
In general, if the variability, or the uncertainty, of the demand (arrival) or service process is large, the queue length and the waiting time are also large.
Rule 1
23Ardavan Asef-Vaziri Dec-2010Operations Management: Waiting Lines1
As the utilization increases the waiting time and the number of orders in the queue increases exponentially.
Rule 2
24Ardavan Asef-Vaziri Dec-2010Operations Management: Waiting Lines1
In general, pooling the demand (customers) into one common line improves the performance of the system.
Rule 3
25Ardavan Asef-Vaziri Dec-2010Operations Management: Waiting Lines1
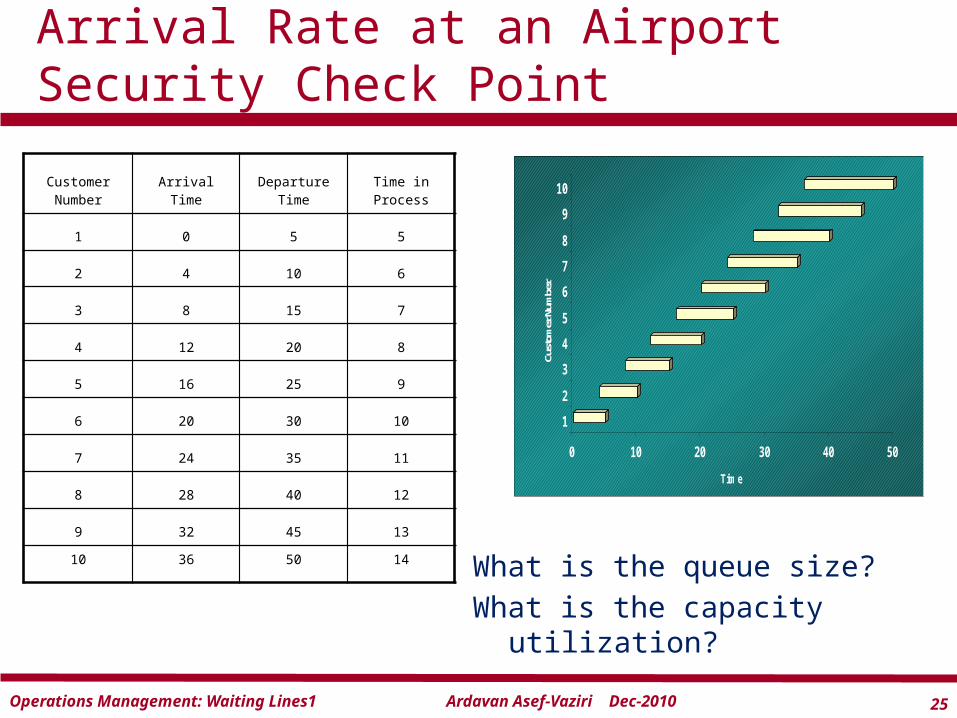
What is the queue size?What is the capacity utilization?
Arrival Rate at an Airport Security Check Point
Customer Number Arrival Time
Departure Time
Time in Process
1 0 5 5
2 4 10 6
3 8 15 7
4 12 20 8
5 16 25 9
6 20 30 10
7 24 35 11
8 28 40 12
9 32 45 13
10 36 50 14
0 10 20 30 40 50
Time
1
2
3
4
5
6
7
8
9
10
Cust
omer
Num
ber
26Ardavan Asef-Vaziri Dec-2010Operations Management: Waiting Lines1
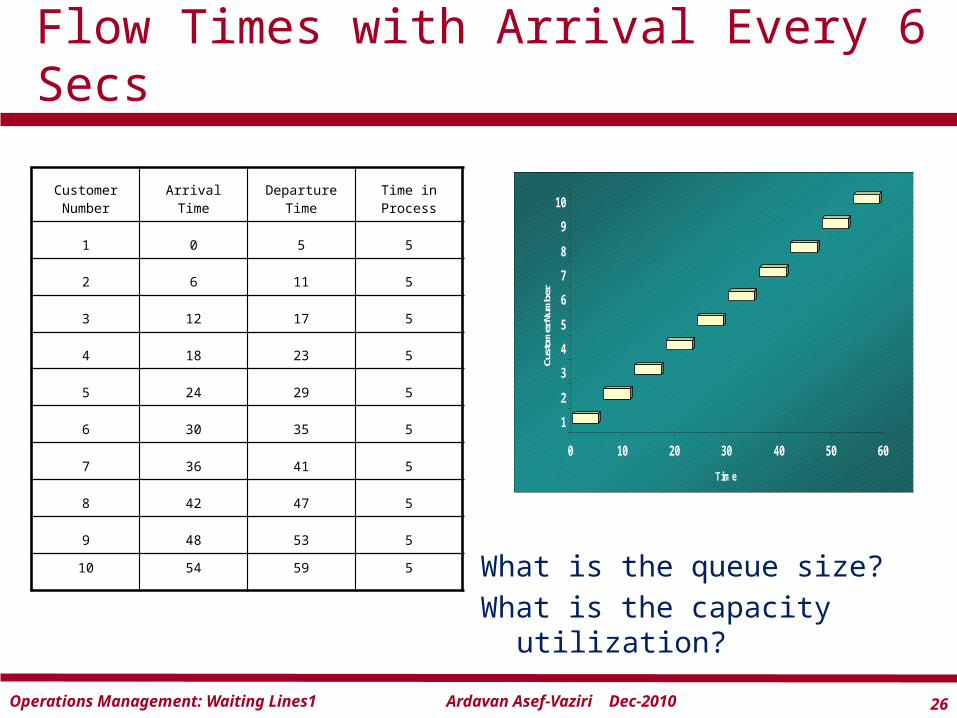
What is the queue size?What is the capacity utilization?
Flow Times with Arrival Every 6 Secs
Customer Number Arrival Time
Departure Time
Time in Process
1 0 5 5
2 6 11 5
3 12 17 5
4 18 23 5
5 24 29 5
6 30 35 5
7 36 41 5
8 42 47 5
9 48 53 5
10 54 59 5
0 10 20 30 40 50 60
Time
1
2
3
4
5
6
7
8
9
10
Cust
omer
Num
ber
27Ardavan Asef-Vaziri Dec-2010Operations Management: Waiting Lines1
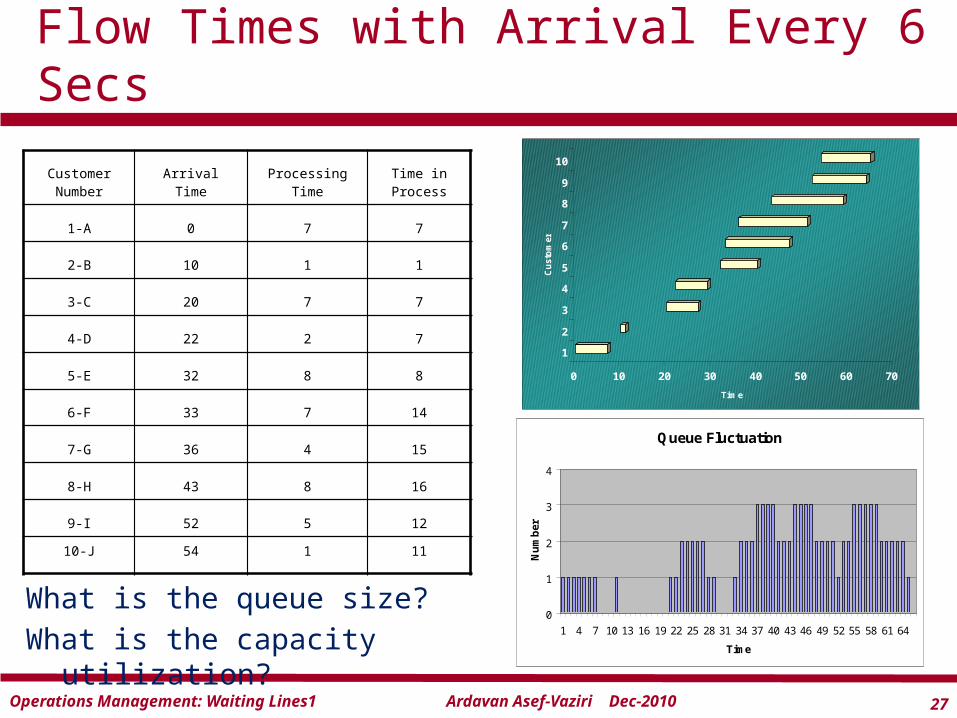
What is the queue size?What is the capacity utilization?
Flow Times with Arrival Every 6 Secs
Customer Number Arrival Time Processing Time
Time in Process
1-A 0 7 7
2-B 10 1 1
3-C 20 7 7
4-D 22 2 7
5-E 32 8 8
6-F 33 7 14
7-G 36 4 15
8-H 43 8 16
9-I 52 5 12
10-J 54 1 11
0 10 20 30 40 50 60 70
Time
1
2
3
4
5
6
7
8
9
10
Cu
sto
mer
Queue Fluctuation
0
1
2
3
4
1 4 7 10 13 16 19 22 25 28 31 34 37 40 43 46 49 52 55 58 61 64
Time
Nu
mb
er
28Ardavan Asef-Vaziri Dec-2010Operations Management: Waiting Lines1
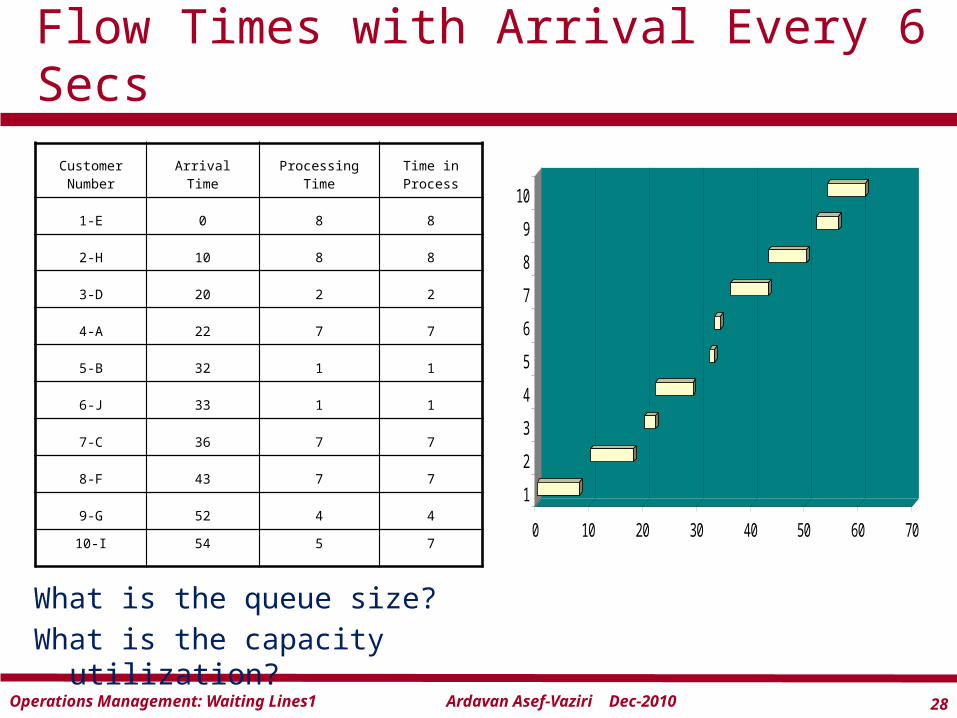
What is the queue size?What is the capacity utilization?
Flow Times with Arrival Every 6 Secs
Customer Number Arrival Time Processing Time
Time in Process
1-E 0 8 8
2-H 10 8 8
3-D 20 2 2
4-A 22 7 7
5-B 32 1 1
6-J 33 1 1
7-C 36 7 7
8-F 43 7 7
9-G 52 4 4
10-I 54 5 70 10 20 30 40 50 60 70
1
2
3
4
5
6
7
8
9
10