Open Cell Convection and Closed Cell Convection -...
40
Stageverslag Open Cell Convection and Closed Cell Convection S. Noteboom De Bilt, 2007
Transcript of Open Cell Convection and Closed Cell Convection -...

Stageverslag
Open Cell Convection and
Closed Cell Convection
S. Noteboom
De Bi l t , 2007

S tagevers lag
De B i l t , 2007 PO Box 201 3730 AE De B i l t Wi lhe lmina laan 10 De B i l t The Nether lands ht tp ://www.knmi .n l Te lephone +31(0)30-220 69 11 Te le fax +31(0)30-221 04 07 Auteur: Noteboom, Saskia (Wageningen Universiteit)
© KNMI, De Bilt. All rights reserved. No part of this publication may be reproduced, stored in retrieval systems, or transmitted, in any form or by any means, electronic, mechanical, photocopying, recording or otherwise, without prior permission in writing from the publisher.
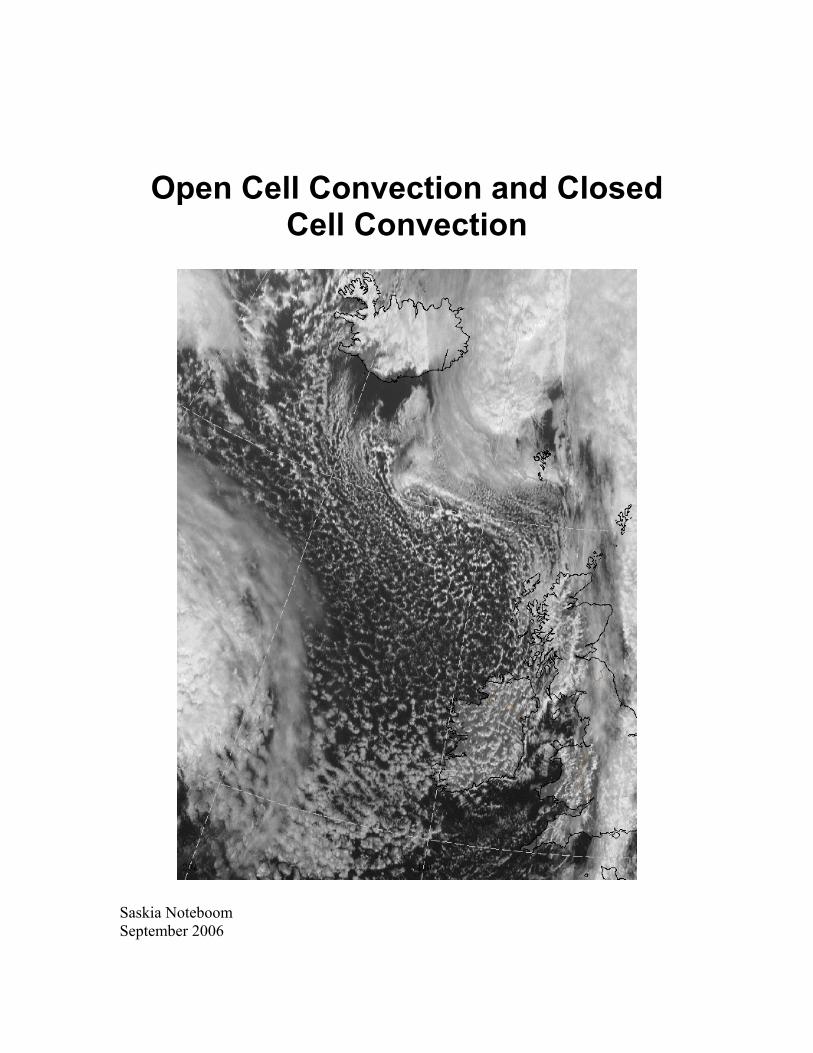
Open Cell Convection and Closed Cell Convection
Saskia Noteboom September 2006


Open Cell Convection and Closed Cell Convection
Saskia Noteboom

Abstract A new chapter for the SatManu describing Open Cell Convection (OCC) and Closed Cell Convection (CCC) has been developed. Information about SatRep and SatManu is provided, as is the newly developed chapter and some additional information about OCC and CCC. Also the development process of the new SatManu chapter is described shortly.

1
Index INDEX ........................................................................................................................................................... 1 1 INTRODUCTION ..................................................................................................................................... 2
1.1 BACKGROUND ...................................................................................................................................... 2 1.2 THE SATREP METHOD........................................................................................................................... 2 1.3 THE SATREP MANUAL.......................................................................................................................... 3 1.4 NEW CONCEPTUAL MODEL: OPEN CELL CONVECTION AND CLOSED CELL CONVECTION.................... 3
2 BACKGROUND OF MESOSCALE CELLULAR CONVECTION.................................................... 5 2.1 INTRODUCTION ..................................................................................................................................... 5
2.1.1 General characteristics................................................................................................................ 5 2.1.2 Frequency and occurrence........................................................................................................... 5 2.1.3 Mid-latitude cyclone variant ........................................................................................................ 5
2.2 OPEN CELL CONVECTION ...................................................................................................................... 7 2.2.1 General characteristics................................................................................................................ 7 2.2.2 Processes in open cell convection................................................................................................ 8
2.3 CLOSED CELL CONVECTION .................................................................................................................. 9 2.3.1 General characteristics................................................................................................................ 9 2.3.2 Processes in closed cell convection ........................................................................................... 10
3 SATMANU CHAPTER: OPEN CELL CONVECTION AND CLOSED CELL CONVECTION.. 11 3.1 CLOUD STRUCTURE IN SATELLITE IMAGES ........................................................................................ 11
3.1.1 Appearance in Meteosat images: ............................................................................................... 12 3.2 METEOROLOGICAL PHYSICAL BACKGROUND..................................................................................... 13
3.2.1 Introduction................................................................................................................................ 13 3.2.2 Rayleigh-Bénard cells (theory) .................................................................................................. 13 3.2.2 Rayleigh-Bénard cells (in the atmosphere) ................................................................................ 14 3.2.3 Synoptic Environment and Characteristics................................................................................ 15 3.2.4 From Open into Closed Cells..................................................................................................... 19
3.3 KEY PARAMETERS .............................................................................................................................. 20 3.4 TYPICAL APPEARANCE IN VERTICAL CROSS SECTIONS ...................................................................... 23 3.5 WEATHER EVENTS.............................................................................................................................. 26
4 ADDITIONAL INFORMATION........................................................................................................... 28 4.1 CELL CONVECTION VERSUS ROLL CONVECTION:................................................................................. 28 4.2 MESOSCALE CELLULAR CONVECTION IN SUBTROPICAL ANTICYCLONES ............................................ 28 4.3 MESOSCALE CELLULAR CONVECTION VERSUS OTHER COLD AIR CLOUDINESS ................................... 29
5 REFERENCES ........................................................................................................................................ 30 APPENDIX A - ABBREVIATIONS......................................................................................................... 32

2
1 Introduction
1.1 Background Conceptual Models are widely used in meteorology. Such a model is a simplified description of a certain type of weather system or weather phenomenon. This description consists of general features which different occurrences of a certain type of weather system all have in common. There are already numerous Conceptual Models available; however new Conceptual Models can always be developed when a lacuna in the array of Conceptual Models is considered. This was the case with Open and Closed Cell Convection. In the SatReps, Open and Closed Cells were called ‘Cold Air Cloudiness’ and ‘Enhanced Cold Air Cloudiness’ until July 2005, however these names were somewhat misleading so a name change was proposed, see [1]. And since these phenomena hadn’t been treated in the manual before, the name change was an opportunity to develop a new Conceptual Model for the SatRep Manual. This report presents ‘Open and Closed Cell Convection’. At first the SatRep method, the SatRep manual and the development of the Conceptual model will be discussed in Chapter 1. In Chapter 2, Open and Closed Cell Convection will be treated in a more extensive way. The new Conceptual model will be presented in Chapter 3, while in Chapter 4 some additional topics concerning will be discussed.
1.2 The SatRep method The SatRep method is a way of combining information from different sources to get a better picture of what’s going on in the atmosphere. These sources consist of images from weather satellites, output of numerical weather prediction models and weather observations (e.g. surface observations, weather radar and soundings). A forecaster can connect the combined actual weather information to a certain Conceptual Model. Conceptual Models give a better insight in the developments and characteristics of certain large-scale and smaller scale weather systems and the physics therein. By combining the knowledge from Conceptual Models with the actual weather situation the forecaster increases his insight in the actual weather situation and the (short term) developments of the weather phenomena. The combination of information from e.g. satellite images and numerical weather prediction models gives also a clue about the performance of the latest model runs. By comparing the model run with satellite images and weather observations the forecaster can get an indication of how well the actual situation is represented in the

3
model run. A badly initialized model run is less likely to be trusted by the forecaster than a well initialized run. The latest SatReps and an archive can be found at the SatRep website, see [2].
1.3 The SatRep Manual Detailed descriptions of the conceptual models used in the SatRep method are available in the SatRep Manual (‘Manual of Synoptic Satellite Meteorology’), which can be accessed online, see [3]. Conceptual Models are described by means of satellite images, model parameters and weather observations. An analysis of observed features, (background) physical processes and temporal evolution of the features and processes is provided in the Conceptual Model. Also some techniques used and some atmospheric processes are described in the manual. The manual is designed to be a learning tool for students and to serve as a reference/look-up tool for forecasters and meteorologists.
1.4 New Conceptual Model: Open Cell Convection and Closed Cell Convection Open and Closed Cell Convection (or grouped into: Mesoscale Cellular Convection) have been known since the first satellite images. They were already discovered on the first satellite images in the early sixties. The first descriptions date from as early as 1961 by Krueger and Fritz. They described cellular convection patterns observed in TIROS I satellite images (Krueger and Fritz, 1961). Open and Closed Cell Convection occur very frequently. Worldwide they are visible in satellite images on a daily basis. They are mostly observed over oceans. Open Cells occur most frequently in Cold Air Outbreaks, whilst Closed Cells most frequently are observed in subtropical anticyclones. The development of the new Conceptual Model started with looking into the SatRep archive to get an impression of the frequency of occurrence, the synoptical environments and the developments of Open Cell Convection (OCC) and Closed Cell Convection (CCC) in the region of interest for SatRep production (Europe and North Atlantic). A number of cases have been selected for further study. This further study incorporated the analysis of satellite images, model data and observations (e.g. soundings). A literature study has been performed to get a better (theoretical) insight in the features and processes of OCC and CCC. From these investigations a general picture of the features, processes and developments in OCC and CCC has been made. This general picture then had to be made into a Conceptual Model. This has been done by analysing satellite images, model data and observations and looking at them with a focus on the practical use in the forecast

4
office. A number of cases have been looked at in more detail in order to incorporate these cases as examples from the practice into the manual to support the model of Open Cell Convection and Closed Cell Convection. The new Conceptual Manual will be incorporated in the next update of the SatRep Manual and will then be accessible online.

5
2 Background of Mesoscale Cellular Convection
2.1 Introduction
2.1.1 General characteristics Satellite images frequently show large areas of mesoscale cellular convection. These areas are predominantly observed over water surfaces. This mesoscale cellular convection is characterized by honeycomb-like patterns of convective cloudiness, arranged in either ‘open’ or ‘closed’ cells. The former have cloudy borders and cloud free centres whereas the latter have cloud free borders and cloudy centres. These open and closed cells can be considered as atmospheric occurrences of Rayleigh-Bénard cells (see 3.2.2 and 3.2.3). Open and closed cells occur in different synoptical environments, generally two types can be discerned: (1) in cold air outbreaks in the rear flank of a mid-latitude cyclone at higher latitudes, (2) near a subtropical anticyclone at lower latitudes. Although the general principle is the same in both cases -Rayleigh-Bénard convection in the atmospheric boundary layer- the synoptical settings are different and that may also imply a difference in the processes responsible for driving the convection in the cells. In this report the focus will be on the mid-latitude cyclone variant, however the subtropical variant will also be addressed shortly (see 4.2).
2.1.2 Frequency and occurrence Seen on a global scale, mesoscale cellular convection occurs daily and mostly over oceans, in more or less equator ward flows. Regions which are prone to almost daily occurrence of mesoscale cellular convection are the subtropics and subpolar regions (especially in winterseason). Especially in the subtropics there are regions in which mesoscale cellular convection is very persistent. The occurrence of mesoscale cellular convection is a result of interplay between the synoptic-scale flow and local circumstances, for example the position of land and water masses. The most favourable locations for cellular convection are above warm ocean currents to the east of continents in the case of open cell convection and above cold ocean currents to the west of continents in the case of closed cell convection.
2.1.3 Mid-latitude cyclone variant Mesoscale cellular convection is essentially the result of processes involving air mass modification in cold air outbreaks. Cold, dry and stable air is advected from an icecap or a snow-covered land surface over a warmer water surface (an ocean, sea or lake).

6
Typically, the cold air is advected in the rear of a mid-latitude cyclone. The water body supplies heat and moisture to the air by means of heating and evaporation. Due to the heat and moisture supply in the lower layer the air mass becomes unstable and shallow convection occurs. When the cold air flows onto the water surface, first fog and stratus will develop due to heating and moistening of the air by the fluxes from the water surface. In the next stage lines of convective clouds (cloud streets) will occur, when wind shear induces a roll circulation in the mixed layer which arranges the convective clouds in bands. With increasing distance from the land or ice surface the roll circulation increases in diameter due to deepening of the mixed layer and the cloud streets gradually increase in height and in spacing from each other. When the mixed layer has deepened some more and the wind shear has decreased, cellular patterns will start to occur: open and closed cells. This whole process is essentially the transformation from an arctic (or continental polar) air mass to a maritime polar air mass due to input of heat and moisture from the water into the air. The difference between air temperature and water temperature decreases with increasing distance from the source area. Also, the average potential temperature of the mixed layer increases and heat, moisture and momentum are mixed over an increasingly deeper layer. This causes a gradually increasing depth of the mixed layer, due to convective processes. Sometimes areas of stratocumulus clouds occur in the flow, these indicating that there is a stronger inversion. In most cold air outbreaks the stratocumulus develops into open cell convection downstream (due to weakening of the inversion or due to increasing sea water temperatures).
Figure 1 Open Cell Convection near the Azores (NASA MODIS Aqua Satellite – 24 January 2006 15:35 UTC - resolution 1 km; Image courtesy of MODIS Rapid Response Project at NASA/GSFC, [4])

7
The layer in which the cellular convection occurs is characterized by an inversion in the vertical stratification. It is due to this inversion that the convection is limited to a shallow layer. This inversion stems from the period that the air resided in its source area. In the source area, a polar high-pressure area above a cold surface (ice or snow-covered land), large-scale subsidence of air from aloft causes a subsidence-inversion. Another important process is radiative cooling of the layer above the ice or snow-covered surface. Due to these processes a (very) cold layer of air underneath a strong inversion exists in a polar high-pressure area. When this air is advected out of this area over a warmer surface, the air is heated from below and convective mixing is initiated. This convective mixing will then tend to increase the depth of the boundary layer and weaken the inversion. However other processes can interfere with the convective mixing, especially subsidence of air from aloft can be an important factor in this matter. Subsidence occurs in an anticyclone, just behind a cold front, or due to (differential) cold air advection at higher levels in the troposphere.
2.2 Open cell convection
2.2.1 General characteristics On satellite images open cell convection looks like a honeycomb with cloudy borders and cloud free centres. The air rises at the borders (hence the occurrence of clouds there) and sinks at the centres. Generally open cell convection occurs when the difference between sea surface temperature and air temperature is large (heat and moisture fluxes are also large then). Heating from below is the key responsible process in open cell convection. Open cell convection occurs in cold air outbreaks at the rear flank of mid-latitude cyclones. The flow pattern in these cold air outbreaks is cyclonic, and synoptical or dynamic disturbances like upper level troughs can also occur in these cold air outbreaks. Open cell convection mostly occurs in the winter, when temperature differences between land and water masses and the areal extent of ice and cold, snow-covered land are largest. In the winter temperature differences between polar and subtropical regions are also largest, which invokes an increased cyclone activity in the mid-latitudes. However in the spring and in the summer open cell convection can also be observed over land, especially when cold air masses are advected over land masses which are heated by the sun. Due to increased surface friction over land, the cellular structure is less hexagonal in these cases. Also wind speed can have an influence on the cell structure, at higher wind speeds the hexagonal cells tend to break up and look more like circles or arches.
8
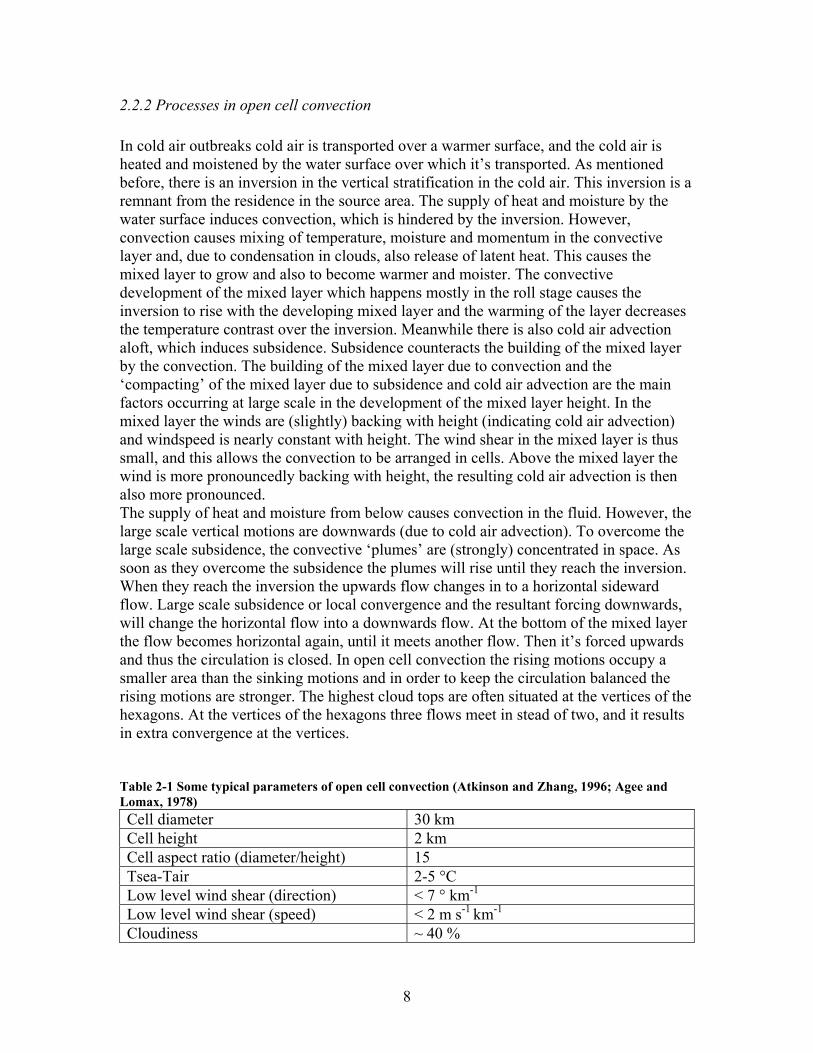
2.2.2 Processes in open cell convection In cold air outbreaks cold air is transported over a warmer surface, and the cold air is heated and moistened by the water surface over which it’s transported. As mentioned before, there is an inversion in the vertical stratification in the cold air. This inversion is a remnant from the residence in the source area. The supply of heat and moisture by the water surface induces convection, which is hindered by the inversion. However, convection causes mixing of temperature, moisture and momentum in the convective layer and, due to condensation in clouds, also release of latent heat. This causes the mixed layer to grow and also to become warmer and moister. The convective development of the mixed layer which happens mostly in the roll stage causes the inversion to rise with the developing mixed layer and the warming of the layer decreases the temperature contrast over the inversion. Meanwhile there is also cold air advection aloft, which induces subsidence. Subsidence counteracts the building of the mixed layer by the convection. The building of the mixed layer due to convection and the ‘compacting’ of the mixed layer due to subsidence and cold air advection are the main factors occurring at large scale in the development of the mixed layer height. In the mixed layer the winds are (slightly) backing with height (indicating cold air advection) and windspeed is nearly constant with height. The wind shear in the mixed layer is thus small, and this allows the convection to be arranged in cells. Above the mixed layer the wind is more pronouncedly backing with height, the resulting cold air advection is then also more pronounced. The supply of heat and moisture from below causes convection in the fluid. However, the large scale vertical motions are downwards (due to cold air advection). To overcome the large scale subsidence, the convective ‘plumes’ are (strongly) concentrated in space. As soon as they overcome the subsidence the plumes will rise until they reach the inversion. When they reach the inversion the upwards flow changes in to a horizontal sideward flow. Large scale subsidence or local convergence and the resultant forcing downwards, will change the horizontal flow into a downwards flow. At the bottom of the mixed layer the flow becomes horizontal again, until it meets another flow. Then it’s forced upwards and thus the circulation is closed. In open cell convection the rising motions occupy a smaller area than the sinking motions and in order to keep the circulation balanced the rising motions are stronger. The highest cloud tops are often situated at the vertices of the hexagons. At the vertices of the hexagons three flows meet in stead of two, and it results in extra convergence at the vertices. Table 2-1 Some typical parameters of open cell convection (Atkinson and Zhang, 1996; Agee and Lomax, 1978) Cell diameter 30 km Cell height 2 km Cell aspect ratio (diameter/height) 15 Tsea-Tair 2-5 °C Low level wind shear (direction) < 7 ° km-1 Low level wind shear (speed) < 2 m s-1 km-1 Cloudiness ~ 40 %

9
2.3 Closed cell convection
2.3.1 General characteristics Closed cells also look like a honeycomb on satellite images, but contrary to open cells the borders are cloud-free and the centres of the cells are cloudy. The air rises in the centres and sinks at the borders of the cells. For closed cell convection to occur, sea-air temperature differences don’t have to be large. Instead of heating from below by the water surface, radiative cooling of cloud tops is the key responsible process for closed cell convection. Because of this process closed cells can also occur when sea-air temperature differences are quite small, or even negative. Closed cell convection is often situated equator ward of the jet stream and in an anticyclonic flow pattern. The latter indicates that anticyclonic subsidence may well be of importance in closed cell convection. Closed cell convection is also associated with the breaking up of stratus and stratocumulus decks.
Figure 2 Closed Cell Convection near the Azores (NASA MODIS Terra Satellite – 12 April 2006 12:30 UTC - resolution 1 km; Image courtesy of MODIS Rapid Response Project at NASA/GSFC, [4])

10
In the mid-latitudes closed cell convection occurs often in the spring and in the (early) summer, when the water temperatures are at a minimum in their annual course. The (advected) air has been quite warmed already due to solar insolation which heats the source area. The temperature differences between the sea and the air are rather small then. This is a more favourable environment for closed cell convection rather than open cell convection.
2.3.2 Processes in closed cell convection Due to thorough mixing and the input of heat and moisture in previous stages (e.g. open cell convection), the boundary layer is well mixed (for temperature, moisture and momentum) and sea-air temperature differences are smaller in areas of closed cells. The key responsible process for closed cell convection is radiative cooling of the top of the cloud layer, causing instability in this layer and sinking motions. Entrainment of drier air from above the inversion and subsequent evaporative cooling also contributes to the aforementioned process. The drier the air above the inversion, the stronger is the contribution of evaporative cooling. In the mixed layer the winds are slightly veering with height and wind speed is nearly constant with height. The wind shear in the mixed layer is thus small, and this allows the convection to be arranged in cells. Above the mixed layer the wind is more pronouncedly veering with height and the resulting warm air advection is then also more pronounced. Radiative and evaporative cooling at the top of the cloud layer generate negative buoyancy in the layer. Air that has been cooled sufficiently will sink to the bottom of the layer. When the air reaches the bottom, the downwards flow changes in to a horizontal sideward flow. The air can then be forced upwards by either convergence of several flows, large-scale vertical motions, or generated positive buoyancy (by moistening and heating by the water surface). When the air rises and the moisture condenses, radiative and evaporative cooling will again be present as influential processes. In closed cell convection the sinking motions occupy a smaller area than the rising motions and in order to keep the circulation balanced the sinking motions are stronger. Table 2-2 Some typical parameters of closed cell convection (Atkinson and Zhang, 1996; Agee and Lomax, 1978) Cell diameter 24-53 km Cell height 1,3 - 2 km Cell aspect ratio (diameter/height) 3-28 Tsea-Tair 1.7-5 °C Low level wind shear (direction) < 7 ° km-1 Low level wind shear (speed) < 2 m s-1 km-1 Cloudiness ~ 90 %

11
3 SatManu chapter: Open Cell Convection and Closed Cell Convection
3.1 Cloud Structure In Satellite Images Satellite images frequently show large areas of mesoscale cellular convection. This type of convection is predominantly observed over water surfaces. In a period of one year it has been observed on 239 days over the North Atlantic and North Sea, and 59 distinct cases which spanned one or more days could be found. Open and Closed Cell Convection is characterized by honeycomb-like (hexagonal) patterns of shallow (generally 1-3 km deep) convective cloudiness, arranged in either 'open' or 'closed' cells. The former have cloudy borders and cloud free centres whereas the latter have cloud free borders and cloudy centres. Open and Closed Cells are part of a distinct lifecycle in Cold Air Outbreaks from continents or ice-surfaces over warmer sea surfaces. In this lifecycle cloudiness develops from Stratus/Sea-Fog via Cloud Streets (see Cloud Streets, [3]) into Open and Closed Cells. In the Meteosat-8 HRVIS image of 20 March 2006 this lifecycle is clearly visible: in the northernmost part of the image Cloud Streets (see Cloud Streets, [3]) are visible, more southerly (downstream) they change into Open Cells and over the North Sea Closed Cells can be observed.
Figure 3-1 20 March 2006/12.00 UTC - Meteosat HRVIS image
Figure 3-2 Scheme of observed cloud types in a cold air outbreak
Open and Closed Cells mostly occur over water surfaces, but Open Cells can also develop over land when cold air is advected over a land surface heated by solar insolation. Spring and summer are favourable periods for this. Open and Closed Cells can also be advected from sea onto land by the mean flow. Over land the cellular patterns are somewhat disturbed due to the increased surface friction over land. This change in the

12
pattern when the cells move over land is most easily seen in Open Cells. The clouds of Closed Cells are in general shallower in depth than those of Open Cells. The diameters of the cells generally increase with increasing distance downstream.
Figure 3-3 Scheme of the hexagonal pattern of Open and Closed Cells - view from above
3.1.1 Appearance in Meteosat images: The hexagonal patterns of Open and Closed Cellular Convection can easily be seen in Meteosat-8 VIS imagery. The cellular structure is even better visible in Meteosat-8 HRVIS images due to the higher resolution. The pattern of Open Cells is also easily to distinguish in Meteosat-8 IR imagery due to the temperature difference between the cloud tops at the borders and the surface in the cloud free centres. Closed Cells are not so easily to distinguish in IR imagery. This is due to the extensive cloud cover, which has a small temperature contrast at the cloud tops. Due to this small temperature contrast a region of Closed Cells looks rather 'smooth' in IR imagery, and the hexagonal cellular structure is not visible unless the cells start to break up and the cloud free zones between them grow wider. Closed Cells have the 'smooth' appearance in IR imagery in common with other low clouds, e.g. Stratus/Fog and Stratocumulus sheets. In Meteosat-8 WV Imagery Open and Closed cells are not really clearly visible, since Open and Closed cells are confined to a shallow layer in the lower troposphere. RBG imagery can be a useful tool in distinguishing Open and Closed Cells. During the day RGB's which combine information from visible and (near-)IR channels (for instance the 0.6 / 1.6 / 10.8µ RGB) can be of assistance in distinguishing high clouds from low clouds. This is useful to for instance distinguish Open Cell Convection from Enhanced Cumulus (see Enhanced Cumulus, [3]). The 0.6 / 0.8 / 10.8µ RGB is also useful to distinguish whether ice is present in cloud tops or not. At night-time IR-difference RGB's

13
can be of use to distinguish low clouds from high clouds. The WV RGB is useful in finding Cold Air Outbreaks and finding out the stream pattern (e.g. position of the jet stream) and the position of cold and warm air masses in the upper troposphere.
Figure 3-4 23 September 2005/12.00 UTC - Meteosat-8 HRVIS
Figure 3-5 23 September 2005/12.00 UTC - Meteosat-8 IR (10.8 µm)
3.2 Meteorological Physical Background 3.2.1 Introduction Open Cell Convection and Closed Cell Convection are the result of processes involving air mass modification. Cold, dry and stable air is advected from an ice cap or a snow-covered land surface over a warm water surface (an ocean, sea or lake). The cold air is usually advected in the rear flank of a mid-latitude cyclone. The water surface supplies heat and moisture to the air by means of heating and evaporation. Due to the supply of heat from below, the air mass becomes unstable and shallow convection occurs. The difference between air temperature and water temperature decreases with increasing distance from the source area. Also, the average potential temperature of the atmospheric mixed layer increases and heat, moisture and momentum are mixed over an increasingly deeper layer. This causes a gradually increasing depth of the mixed layer in the atmosphere, due to convective processes. The air mass in which the cellular convection occurs is characterized by quite a low inversion in the vertical stratification. That's why the convection is limited to a shallow layer. 3.2.2 Rayleigh-Bénard cells (theory)

14
The organisation of clouds into a hexagonal pattern can be regarded as an atmospheric manifestation of Rayleigh-Bénard cells. These cells can be formed in a fluid which is confined between an upper and a lower boundary and which is heated from below. The heating causes convection in the fluid, and rising motions (in the manifestation of 'updraft plumes') will occur. When the rising fluid meets the upper boundary it has to spread sideways. If this happens at a uniform speed, the boundary of the flow will have the shape of a circle. When there are more spots with rising fluids, the boundaries will grow towards each other and where two boundaries meet the converging fluid is forced to downward motion. At the bottom of the layer the fluid has to flow sideways again. In this way the circulation is closed. The hexagonal pattern as observed from above is caused by the convergence of the sideward motions originating from many 'updraft plumes'. When the updraft plumes are of uniform strength a regular hexagonal pattern will be visible. 3.2.2 Rayleigh-Bénard cells (in the atmosphere) In the case of Open and Closed Cellular Convection, the lower boundary is the sea or land surface and the upper boundary is an inversion (often a subsidence inversion). However, whereas in the case of the theoretical Rayleigh-Bénard cells the only forcing factor is the temperature difference, there are a number of extra factors and processes which influence the convective circulation in the atmosphere. These factors and processes interfere with each other and resulting effects can be enhanced or dampened. • Large-scale vertical motion
One of these factors and processes is the large scale vertical motion in the boundary layer imposed by synoptical systems. When cellular convection occurs, the large scale vertical flow has a marked influence on the orientation of the circulation in the cells. Open Cells will develop if the large-scale vertical motions in the fluid layer are downwards; Closed Cells will develop when the large-scale vertical motions are upwards. However the large-scale vertical motions are not strong enough to overcome the inversion at the top of the layer.
• Latent heat release Another important factor in the atmosphere is the release of latent heat due to condensation. Initially the convection is only thermally induced, but when condensation occurs latent heat release adds to the thermal forcing. In the development of a Cold Air Outbreak condensation becomes quickly a factor of importance when clouds develop such as sea-fog, stratus or convective clouds.
• Cloud cover processes Closed Cells have a larger cloud cover and therefore cloud cover processes such as cloud radiative processes and entrainment are also factors which influence the direction of the circulation in the cells.
• Horizontal flow (wind) Another difference between the classic Rayleigh-Bénard cells under laboratory conditions and Open and Closed Cells in the atmosphere is the absence of a mean horizontal flow in the former case. Open and Closed Cells are formed in conditions in

15
which wind is also present, cold air is advected over a warmer surface by the mean flow. However (vertical) windshear is not a big factor in Open and Closed Cells, in the preceding stage (Cloud Streets, see Cloud Streets, [3]) the wind is also mixed and vertical windshear is diminished.
3.2.3 Synoptic Environment and Characteristics In the following paragraphs the typical synoptic environment and other characteristics will be discussed. Open Cellular Convection: Open Cellular Convection is mostly seen in Cold Air Outbreaks, when cold and dry air from continents is transported over a relatively warm (water) surface. This flow often occurs behind a Cold Front (see Cold Front, [3]). The air mass is modified by the input of heat and moisture from the water surface. Near the water surface a mixed layer will be formed, which is capped by an inversion. The depth of the mixed layer will increase with increasing distance from the shore due to the continuing input of heat and moisture from the water surface. Clouds develop during the transformation of the air mass. At first Sea-fog or Stratus clouds will occur. Further downstream they will develop into Cloud Streets (see Cloud Streets, [3]) and eventually cellular convection will occur (Open and Closed Cells). The appearance of cellular convection can be considered as the mature stage of the air mass transformation. In this stage the mixed layer has reached its final depth and is not deepening anymore with increasing distance from the original source area. Cellular convection is confined to a shallow layer, and dynamical forcing is not a factor. However, when dynamical forcing (e.g. PVA near upper-troughs) occurs in a Cold Air Outbreak, the convection will be enhanced and EC (see Enhanced Cumulus, [3]) and Comma (see Comma, [3]) will form.
16
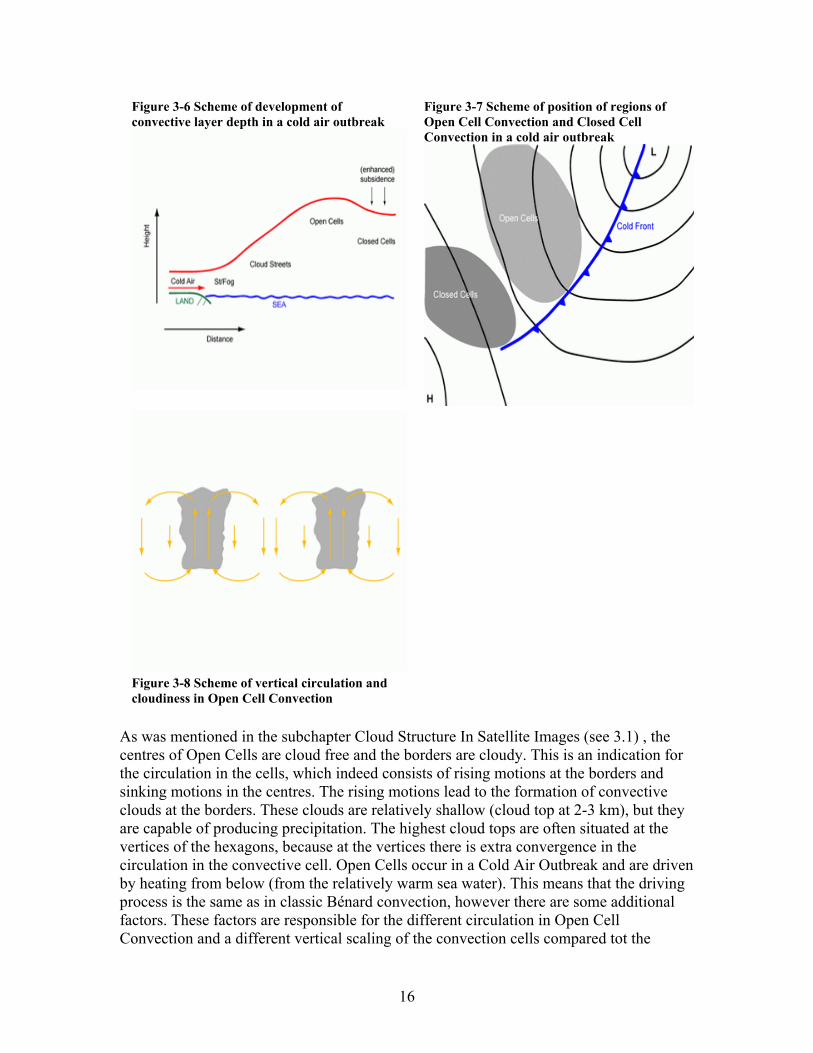
Figure 3-6 Scheme of development of convective layer depth in a cold air outbreak
Figure 3-7 Scheme of position of regions of Open Cell Convection and Closed Cell Convection in a cold air outbreak
Figure 3-8 Scheme of vertical circulation and cloudiness in Open Cell Convection
As was mentioned in the subchapter Cloud Structure In Satellite Images (see 3.1) , the centres of Open Cells are cloud free and the borders are cloudy. This is an indication for the circulation in the cells, which indeed consists of rising motions at the borders and sinking motions in the centres. The rising motions lead to the formation of convective clouds at the borders. These clouds are relatively shallow (cloud top at 2-3 km), but they are capable of producing precipitation. The highest cloud tops are often situated at the vertices of the hexagons, because at the vertices there is extra convergence in the circulation in the convective cell. Open Cells occur in a Cold Air Outbreak and are driven by heating from below (from the relatively warm sea water). This means that the driving process is the same as in classic Bénard convection, however there are some additional factors. These factors are responsible for the different circulation in Open Cell Convection and a different vertical scaling of the convection cells compared tot the

17
classical Bénard convection. The large scale vertical motion in Cold Air Outbreaks is generally downwards. As mentioned before, downward vertical motions lead to an open cell structure in a fluid heated from below.
Figure 3-9 11 March 2006/12.00 UTC - Meteosat-8 HRVIS image
Figure 3-10 11 March 2006/12.00 UTC - Tephigram Ekofisk
In the tephigram of Ekofisk (location indicated by the arrow on the satellite image) it can be seen that there is a thin layer with superadiabatic lapse rates just above the surface. Above this layer, extending from about 1000 to 925 hPa, a well mixed layer with neutral stratification of about 800 m thick exists. On top of this well mixed layer a slightly stable layer extending from 925 to 600 hPa is positioned, and above this layer stability increases. This vertical stratification is quite similar to that of a convective boundary layer. However there is an important difference: over water surfaces the heating and generation of thermals from below will continue during the night. In this particular case a capping inversion is absent. The stable layer isn't really a strong 'cap' in this case. The winds back with height in the unstable layer (this indicates cold air advection), and the windspeed decreases slightly with height until about 850 hPa in this case. Table 3-1 Windspeed and -direction in sounding of Figure 3-10 Height (hPa) Winddirection (Deg) Windspeed (kt) 1017 060 23 1000 055 22 925 065 19 850 060 16 700 050 27

18
Closed Cellular Convection: Closed Cellular Convection can occur in two different synoptical settings: in the above mentioned Cold Air Outbreaks and in a subtropical anticyclone. The first setting is a somewhat mature or final stage in the developments in a Cold Air Outbreak. Closed Cells are often situated very far downstream and immediately in the rear of a Cold Front (see Cold Front, [3]) or near an anticyclone to the west of the Cold Air Outbreak. The second setting is a typical marine stratocumulus situation, within a subtropical anticyclone and often also situated over relatively cool ocean currents. In both situations there is a well mixed and moist shallow boundary layer situated underneath quite a strong subsidence inversion. The subsidence inversion functions as a strong cap for convection by hindering the vertical growth of the clouds and forcing them to spread out horizontally.
Figure 3-11 Scheme of vertical circulation and cloudiness in Closed Cell Convection
The direction of the circulation in a Closed Cell is the opposite of that in an Open Cell: in Closed Cells the air rises in the centres and sinks at the borders. The rising motions in Closed Cells are less intense and cover a larger area than those in Open Cells. Hence the cloudiness in Closed Cells is vertically less developed while covering a larger horizontal extent. The clouds are shallower than those in Open Cell Convection, and due to their shallow depth and their relatively large area in the cells they look more like stratocumulus than like the convective clouds observed in Open Cellular Convection. The borders are cloud free. It is considered that radiative cooling of the cloud tops is the key responsible process in Closed Cellular Convection. This means that while the direction of circulation of the cells is essentially the same as in classical Bénard cells, the driving mechanism is different. The cooling of the cloud tops generates negative buoyancy in the top of the cloud layer. This generates instability and sinking motions in the cloud layer. Entrainment of dry air from above the inversion and subsequent evaporative cooling also contribute to the generation of negative buoyancy.

19
The tephigram of Valentia (location indicated by the arrow on the satellite image) shows the vertical stratification in a region of Closed Cell Convection. At about 800 hPa there is quite a strong inversion. Underneath this inversion, again a vertical stratification similar to that of a convective boundary layer is visible: a superadiabatic layer just above the surface, a well mixed (neutral) layer (extending from 1000 tot 950 hPa) on top of it, and from 950 tot 800 hPa a slightly stable layer. In the layer under the inversion the wind is veering slightly with height (this indicates warm air advection), while the windspeed is nearly constant. Above the inversion the wind is backing with height. The windspeed increases with height over the entire vertical profile.
Figure 3-12 18 July 2005/12.00 UTC - Meteosat-8 HRVIS image
Figure 3-13 18 July 2005/12.00 UTC - Tephigram Valentia
Table 3-2 Windspeed and –direction of sounding in Figure 3-13 Height (hPa) Winddirection (Deg) Windspeed (kt) 1006 280 14 1000 275 25 925 300 27 850 300 31 700 285 37
3.2.4 From Open into Closed Cells The change from Open Cell Convection into Closed Cell Convection is not clearly understood yet. There is a change in the direction of cellular circulation, but which processes are responsible for it is not clear yet. Factors which could possibly play a role are: the temperature difference between sea and air, the strength of the inversion, direction and strength of large-scale vertical motions in the boundary layer and forces and

20
processes governing them, and cloud cover processes (radiative cooling, entrainment). When the upward motions (either purely convective or induced by large scale vertical motions or forced by low level convergence) are not strong enough to overcome (or penetrate into) the inversion layer, the flow will spread horizontally just under the inversion. Accompanying cloudiness will then spread also and cloudiness will increase. Due to the increased cloudiness, which grows into a cover under the inversion, cloud cover processes will become more important. Eventually this can lead to a change in the driving mechanism of the cellular convection and hence the change from Open into Closed Cells. The driving mechanism changes from heating from below (by the warm seawater) into cooling from above (by cloud deck processes). Mostly the transition between cell types is quite abrupt, which infers that there is some kind of 'switch mechanism' in the forcings governing the direction of the circulation. In literature the position of the jet stream is mentioned as an indicator of the position of transition from Open Cells into Closed Cells. However, in practice there is not such a clear relationship between the positioning of the jet stream and the transition between Open and Closed Cells. And a point of criticism about this idea is that the jet stream is very high above the (shallow) layer in which Open and Closed Cells occur, and therefore a direct (causal) connection between the jet stream and the transition from Open into Closed Cells is not probable. However the position of the jet stream is linked to the positions of synoptical systems and the polar front.
3.3 Key Parameters Temperature Advection Open and Closed Cell convection often happen in Cold Air Outbreaks to the rear of a Cold Front. Obviously cold advection occurs in these Cold Air Outbreaks. Vertical Velocity In Cold Air Outbreaks the overall vertical motion is downward, due to the cold advection. The vertical motions of the individual cells are small scale and cannot be resolved by numerical weather prediction models. Relative Humidity 850/700 hPa There is often a marked difference between these two levels in the Relative Humidity due to the (capping) inversion. Beneath the inversion, where Open and Closed Cell convection occur, the Relative Humidity is quite high. Above the inversion the Relative Humidity is low, due to subsidence. The inversion is very often situated between 850 and

21
700 hPa, and the difference in Relative Humidity between these two layers is very clear. The inversion height can also be determined more exactly by using radiosonde data. The inversion is generally lower in Closed Cell Convection than in Open Cell Convection. Often the inversion height is around the 850 hPa level for Closed Cells and well above this level for Open Cells. Temperature advection
Figure 3-14 23 September 2005/06.00 UTC - Meteosat IR image; Temperature advection at 850 hPa; red solid: warm air advection, red dashed: cold air advection

22
Vertical velocity
Figure 3-15 23 September 2005/06.00 UTC - Meteosat IR image; Vertical motion (Omega) at 850 hPa; yellow solid: vertical motion (Omega) <0 , yellow dashed: vertical motion (Omega) >0
Relative Humidity
Figure 3-16 23 September 2005/06.00 UTC - Meteosat IR image; Relative Humidity at 850 hPa; blue solid: RH >=70 %, blue dashed: RH <70 %

23
Figure 3-17 23 September 2005/06.00 UTC - Meteosat IR image; Relative Humidity at 700 hPa; blue solid: RH >=70 %, blue dashed: RH <70 %
3.4 Typical Appearance in Vertical Cross Sections
Open and Closed Cells are mesoscale boundary layer phenomena. This means that unlike most of the other conceptual models, governing processes and dynamics of Open and Closed Cells are confined to the boundary layer. Synoptical processes are responsible for the large-scale setting in which Open and Closed Cells occur. The circulation of the cells in the boundary layer is governed by other factors. Vertical cross sections are in this case rather a means of identifying the synoptical environment than a means to have insight in the processes. Equivalent Potential Temperature (Theta-e) The typical instability can be easily detected in the isentropes. In the lowest levels the potential wet bulb temperature decreases with height, indicating unstable stratification. Around a mean level of 800 hPa, wet bulb potential temperature starts to rise again, indicating a change to a stable stratification or inversion. In Open Cell Convection this level is higher than in Closed Cell Convection. Temperature advection Open and Closed Cell Convection usually occur in an outbreak of cold air, behind cold fronts and therefore in areas of cold advection.

24
Vertical velocity Open and Closed Cell Convection usually occur in areas with large-scale downward vertical motions, due to cold air advection and NVA. However low level convergence (induced by geography/orography) and the resultant upward velocity in low levels may 'trigger' Closed Cell Convection. Relative Humidity In the vertical distribution of Relative Humidity the humid layers associated with cloudiness can be seen. An sharp decrease in Relative Humidity is seen above the cloud layers, this decrease is due to the inversion. The moist air is trapped underneath it and above the inversion the air is dry due to subsidence.
Figure 3-18 23 September 2005/06.00 UTC - Meteosat-8 IR image; position of vertical cross section indicated

25
Equivalent Potential Temperature (Theta-e)
Figure 3-19 23 September 2005/06.00 UTC - Vertical cross section
Vertical Velocity
Figure 3-20 23 September 2005/06.00 UTC - Vertical cross section

26
Relative Humidity
Figure 3-21 23 September 2005/06.00 UTC - Vertical cross section
3.5 Weather Events Parameter Description - Open Cells Description - Closed Cells
Precipitation
Light showers with rain and occasionally snow or (winter)hail, occasionally also some thunder. Due to the more intense upwards motions, showers will develop in Open Cell Convection. Showers in Open Cell Convection are mostly light, more intense showers will occur under dynamic forcing (for instance PVA near an upper through). Then there are more intense developments, and Open Cells usually develop into Enhanced Cumulus or Comma.
Generally no significant precipitation. Closed Cell Convection does not have intense updrafts and is often also less vertically developed ('flatter') as Open Cell Convection. If any precipitation occurs drizzle or granular snow is most likely to occur.
Temperature No significant change, however small fluctuations between in and outside showers can occur.
No significant change.

27
Wind (incl. gusts) Slight to moderate surface winds. Slight to moderate surface winds.
Other relevant information
Aviation: Icing hazard due to supercooled clouddroplets (especially in winterseason) and turbulence in/near convective clouds at the cell borders. Over the North Sea Open Cell Convection can induce 'seiches'.
Aviation: Icing hazard due to supercooled clouddroplets (especially in winterseason), and also turbulence can occur at the top of cloud deck (due to windshear).
Figure 3-22 17 November 2005/09.00 UTC - Meteosat 8 IR image; Surface Observations (Present Weather) superimposed
Figure 3-23 17 November 2005/09.00 UTC - Meteosat 8 IR image; Precipitation Radar superimposed

28
4 Additional information
4.1 Cell convection versus roll convection: In cold air outbreaks roll convection (cloud streets) occurs as a stage before cell convection. This indicates that there must be a transition between the two types of convection. However, the two types of convection have different background mechanisms. In roll convection windshear plays an important role, especially speed shear in the lower boundary layer. Other (possible) mechanisms playing a role are parallel instability and inflection point instability (see Weckwerth, 1997). During high-latitude cold-air outbreaks inflection point instability and Rayleigh-Bernard instability are most important (Liu et al., 2004). According to Khanna and Brasseur (1998), shear and buoyancy work together in moderately convective boundary layers to form roll convection: windshear induces ‘streaks’ of (relatively) higher and lower velocity of the horizontal wind. In the low velocity streaks (relatively) warmer air tends to accumulate, the accumulation of warmer air increases buoyancy forces and these will enhance the vertical extent of the streak. If the buoyancy forces are strong enough, streaks can (vertically) extend to the capping inversion. The inversion forces the flow to move horizontally (sideways) and to form the downward circulation of horizontal rolls. In this way a roll circulation is formed. (Khanna and Brasseur, 1998) The streaks at the bottom of the mixed layer can be seen when (steam) fog develops at the beginning of the outflow of the cold air outbreak over warmer water as shown in Young et al (2002). Roll convection is also responsible for its own demise: temperature, moisture and wind are well mixed throughout the mixed layer by the convective processes. If the wind is mixed well enough, then the wind shear will be diminished. In that case, the former mentioned ‘streaks’ will not be formed anymore and the convection pattern will depend jon buoyancy alone and then a cellular structure will form.
4.2 Mesoscale Cellular Convection in subtropical anticyclones In the subtropics are some very persistent regions of mesoscale cellular convection, mostly consisting of closed cells. These regions are often situated over cold sea currents, west of continents (e.g. just off the coasts of Western U.S.A (California), Peru or Namibia) and under a subtropical anticyclone. Besides that they are persistent in their locations, these situations are synoptically seen quite stable compared to the cold air outbreaks at higher latitudes. Due to the Hadley circulation the subtropical anticyclones

29
are persistent in their positions and therefore the weather is stable. Subsidence in the subtropical anticyclone generates a strong subsidence inversion, which ‘caps’ a shallow moist layer underneath. Due to the strong ‘cap’ the vertical growth of clouds is inhibited, and clouds will spread horizontally under the inversion. In these circumstances sheet like cloudiness (stratocumulus and closed cell convection) is formed. Occasionally patches of open cell convection and also actiniae form clouds (see Agee, 2006) can be observed in the areas with closed cell convection. These changes in cloudiness can be generated by differences in sea surface temperature or by precipitation processes (see Stevens et al, 2005). The capping inversion is quite low (sometimes even under 1 km height), which means that the clouds are also very low clouds.
4.3 Mesoscale Cellular Convection versus other cold air cloudiness There are some other kinds of cold air cloudiness which can be confused with open cell convection or closed cell convection. Especially on infrared imagery it can be hard to see the differences, due to lesser visual contrasts. Open cell convection and Enhanced Cumulus (EC) have some similarities in their appearances and they also occur in the same air mass (cold air outbreaks). However, the main difference between Enhanced Cumulus and open cell convection is that the former is enhanced by dynamical processes (e.g., PVA) and is more vertically developed. Enhanced Cumulus has colder cloud tops and larger cirrus shields. In satellite imagery Enhanced Cumulus is visible as larger and brighter (vertically ‘thicker’) convective cells in comparison with open cell convection. In infrared imagery Enhanced Cumulus is also brighter, due to colder cloud tops. The higher and colder cloud tops of Enhanced Cumulus are also better visible in water vapour imagery. Stratocumulus and closed cell convection do also often appear in the same air mass and they also have some similarities in their appearances. They are both sheet like cloudiness in visible and infrared imagery. And whereas there are structures in the clouds discernible in visible imagery, in infrared imagery the cloud deck looks very smooth, due to a quite uniform temperature at the cloud tops. In visible imagery it is not so very hard to discern between stratocumulus sheets and closed cell convection, in the latter the individual elements which make up the cloud structure are of larger size and better discernible due to enhanced ‘clearances’ between the elements. However the clearances between Closed Cells are often not well visible in infrared imagery, only when the clear spaces between the cells are really wide they are discernible in infrared imagery.

30
5 References Literature Agee, E.M, and F. Lomax, 1978, Structure of the mixed layer and inversion layer associated with patterns of mesoscale cellular convection during AMTEX 75, J. Atmos. Sci., 35, 2281–2301. Agee, E.M, 2006, An explanation of actiniae cloud patterns (extended abstract), 14th Conference on Interaction of the Sea and Atmosphere, Atlanta, GA, Amer. Meteor. Soc., Atkinson, B.W. & Zhang, J.W., 1996, Mesoscale shallow convection in the atmosphere, Reviews of Geophysics, 34, 403-431. Van Delden, A., 1998, On the flow-pattern of shallow atmospheric convection, Beitr.Phys.Atmos., 61, 169-186 de Jong, M. P. C., and J. A. Battjes, 2004, Low-frequency sea waves generated by atmospheric convection cells, J. Geophys. Res., 109, C01011 Helfand, H. M., and E. Kalnay, 1983, A model to determine open or closed cellular convection., J. Atmos. Sci., 40, 631–650. Kristovich, D.A.R., N.F. Laird, M.R. Hjelmfelt, R.G. Derickson, and K. Cooper, 1999, Transitions in boundary layer meso-γ convective structures: An observational case study, Mon. Wea. Rev., 127, 2895-1909. Khanna, S., Brasseur, J.G., 1998, Three-Dimensional Buoyancy- and Shear-Induced Local Structure of the Atmospheric Boundary Layer, J. Atmos. Sci, 55, 710-743. Krishnamurti, R., 1975: On Cellular Cloud Patterns. Part 1: Mathematical Model, J. Atmos. Sci, 32, 1353-1363 Krishnamurti, R., 1975: On Cellular Cloud Patterns. Part 2: Laboratory Model, J. Atmos. Sci, 32, 1364-1372 Krishnamurti, R., 1975: On Cellular Cloud Patterns. Part 3: Applicability of the Mathematical and Laboratory Models, J. Atmos. Sci, 32, 1373-1383 Krueger, A. F. and Fritz, S., 1961, Cellular cloud patterns revealed by TIROS I,. Tellus, 13, 1–7.
31
Kruspe, G., and Bakan, S., 1990, The atmospheric structure during episodes of open cellular convection observed in KonTur 1981, J. Geophys. Res., 95, D2, 1973-1984 Liu. A. Q., G. W. K. Moore, K. Tsuboki and I. A. Renfrew, 2004, A high-resolution simulation of convective roll clouds during a cold-air outbreak, Geophysical Research Letters, 31, L03101. Shao, Q., and D. A. Randall, 1996: Closed Mesoscale Cellular Convection Driven by Cloud-Top Cooling. Journal of the Atmospheric Sciences, 53, 2144-2165 Stevens B. et al. , 2005, Pockets of open cells (POCS) and drizzle in marine stratocumulus, Bull. Amer. Metor. Soc., 86, 51-57 Weckwerth, T. M., J. W. Wilson, R. M. Wakimoto, and N. A. Crook, 1997: Horizontal convective rolls: Determining the environmental conditions supporting their existence and characteristics, Mon. Wea. Rev., 125, 505–526. Internet [1] Name change of CAC and ECAC: http://www.knmi.nl/satrep/cac.html [2] SatRep homepage: http://www.knmi.nl/satrep/ [3] SatRep Manual: http://www.zamg.ac.at/docu/Manual/start.htm [4] NASA MODIS Terra and Aqua Satellite Images: http://modis.gsfc.nasa.gov/

32
Appendix A - Abbreviations CAA – Cold Air Advection EC – Enhanced Cumulus (see SatManu) NVA – Negative Vorticity Advection PVA – Positive Vorticity Advection WAA – Warm Air Advection


![The Continental Drift Convection Cell · 1 [Geophysics Research Letters] Supporting Information for The Continental Drift Convection Cell J. A. Whitehead1 Mark D. Behn2 1 Department](https://static.fdocuments.net/doc/165x107/5b87e69f7f8b9a435b8c88f4/the-continental-drift-convection-cell-1-geophysics-research-letters-supporting.jpg)