Online Publication Date: 15th July 2012 Publisher: Asian ... pp.1103-1122.pdf · Products in...
21
Online Publication Date: 15 th July 2012 Publisher: Asian Economic and Social Society Analysis of Consumption and Demand Elasticities for Food Products in Balochistan Samina Khalil (Senior Research Economist), (Applied Economics Research Centre, University of Karachi) Hazrat Yousaf (Candidate, Department of Economics, Pakistan Institute of Development Economics, Islamabad) Citation: Samina Khalil, Hazrat Yousaf (2012) “Analysis of Consumption and Demand Elasticities for Food Products in Balochistan”, International Journal of Asian Social Science Vol. 2, No. 7, pp. 1103-1122.
Transcript of Online Publication Date: 15th July 2012 Publisher: Asian ... pp.1103-1122.pdf · Products in...

Online Publication Date: 15th
July 2012
Publisher: Asian Economic and Social Society
Analysis of Consumption and Demand Elasticities for Food
Products in Balochistan
Samina Khalil (Senior Research Economist), (Applied Economics
Research Centre, University of Karachi)
Hazrat Yousaf (Candidate, Department of Economics, Pakistan
Institute of Development Economics, Islamabad)
Citation: Samina Khalil, Hazrat Yousaf (2012) “Analysis of Consumption and Demand Elasticities
for Food Products in Balochistan”, International Journal of Asian Social Science Vol. 2, No. 7, pp.
1103-1122.

International Journal of Asian Social Science, 2(7), pp. 1103-1122.
1103
Author(s)
Samina Khalil
Senior Research Economist, Applied
Economics Research Centre
University of Karachi.
E-mail :samina.. [email protected]
Hazrat Yousaf Ph.D Candidate, Department of
Economics Pakistan Institute of
Development Economics Islamabad
E-mail - [email protected]
Analysis of Consumption and Demand Elasticities for Food
Products in Balochistan
Abstract
This study analyzes the households’ consumption patterns and
demand elasticities of Balochistan in both the urban and rural
areas. We make use of the Household Integrated Expenditure
Survey (HIES) of Pakistan for the year 2005-6. The linear-log
models are applied for the analysis of households’ consumption
patterns. The LA/AIDS model is used in order to estimate the
demand elasticities. The study shows that the households’
expenditure on food items is increasing at decreasing rate. All the
food items are considered as necessity except in the case of
vegetable ghee for urban and rural Balochistan. The high expenditure elasticities of several food items e.g. wheat, milk,
beef and vegetable ghee call for food support programs, different
agriculture policies like subsidies on electricity for water
irrigation, pesticides, etc. The major share of total expenditure is
devoted to wheat consumption than other food items.
Introduction
Demand theory has been widely applied to
determine individual or household
consumption behavior. There is hardly any
economic theory / research that do not include information of household consumption
patterns. Recently, investigators / researchers
are in struggle to provide an appropriate
answer to some fundamental questions
regarding consumer demand analysis, for
example, how should a demand function be
specified? What are arguments for changing
consumer demand pattern? etc. The
significance of any household income and
expenditure statistics for a country like
Pakistan is quite pronounced and well recognized. The need to analyze changes in the
standard of living of masses across a country is
mostly based on structured and comprehensive
surveys like HIES. It provides guideline to
policy makers in framing socio-economic
developmental policies and in instigating
public investments and financial measures to
improve economic conditions of the people.
The availability of information at different
points in time are helpful in evaluating the
changes which occur, as a result of economic development, in the consumption pattern,
incidence of poverty, trend in the saving
propensities and preferences of different
groups of population. Balochistan is the least
developed province of Pakistan as compared to
other three provinces. Its economic growth has
stagnated in the past decade because of limited
investment and capital accumulation. The last drought (1997–2002) decimated the livestock
population, and rural incomes have been hit
the hardest. This province basically lacks a
coordinated economic policy and a viable
strategy for economic development. It has seen
no significant investment in productive
streams (such as minerals, agribusiness, and
fisheries) and human resource development.
This paper is an attempt to undertake analysis
of households’ consumption patterns and demand elasticities of under-developed urban
and rural Balochistan1. Household Integrated
Expenditure Survey (HIES) of Pakistan
1 The Balochistan province of Pakistan has the largest
area. It accounts 24 per cent (347,100 km2) of the total
area of Pakistan. Neighboring regions are Iranian
Balochistan to the west, Afghanistan and the Federal
Administered Tribal Area (FATA) to the north and Punjab
and Sindh province to the east. To the south is the Arabian
sea. Animal husbandry is the important and trading
bazaars through out the province due to its tribal lifestyle.

Analysis of Consumption and Demand Elasticities…..
1104
provides annual data of household income and
consumption in Pakistan.
Objective
The objective of this study is to estimate demand elasticities and households’
consumption patterns in the urban and rural
Balochistan province. The study applies the
AIDS model introduced by Deaton and
Muellabauer (1980a). In Pakistan, the
magnitude of efforts in this area turns out to be
too thin with data for the year 2005-06. It will
provide biasness if ignored altogether. The rest
of the study is organized as follows: Literature
review is presented in the following section 2.
Next section that is 3, deals with the data set
and methodology. Section 4 shows data – descriptive statistics, results and discussion.
Finally, section 5 consists of conclusion and
policy implication.
Review of Literature
There is an extensive empirical literature on
consumer demand analysis and non-income
characteristics in developed and under-
developed countries. Numerous studies in
Pakistan utilize different models and data composition to estimate households’
consumption patterns. These include:Mukhtar.
H.,(1985), Iqbal.R., and Jamal.H.,(1992),
Eatzaz and Arshad(2007), Malik. S., and Aziz.
B., (2006), Burney and Khan (1991), Siddiqu
R.,(1982), Akhter and Burney (1990), Ahmed,
Ludlow and Stern (1988), Sohail and Sarwar
(1993), Alderman (1988), Malik (1982) etc.
Sohail and Sarwar (1993) use HIES data of the
year 1987-88 to analyze existence or absence
of similarity in expenditure pattern relative to with or without remittances for Pakistan. A
linear relationship between per capita
expenditure and per capita total expenditure
whereas domestic and foreign remittances are
used as dummy variables. The six linear
functional forms are estimated for three
expenditure groups i.e. consumption
expenditure, durable expenditure and total
expenditure (consumption expenditure and
durable expenditure).
Siddiqui,R., (1982) examines consumption
pattern. She tests the stability of consumer
behavior by using the HIES data of the year
1971-72 with pooled data for the years 1968-
69 and 1971-72. She also specifies linear and
log linear relationship between expenditure on various commodities, household size and
income. Five commodity groups and seven
food items are taken for aggregated and
disaggregated analysis respectively.
Burney and Khan (1991) analyze the
consumption pattern in rural and urban sectors
of Pakistan by using the HIES data of the year
1984-85 with linear and double log forms.
They make groups and divide commodities
into twelve major categories namely food and
drinks, clothing and foot wear, fuel and
lighting, housing, transport and communication, house effects, personal
effects, health care, education, entertainment,
durables and miscellaneous.
Jamal and Iqbal (1992) attempt to determine
regional differences in consumption behavior
by using HIES data for the year 1986-88 using
ELES (Extended Linear Expenditure System)
model in their study.
Eatzaz and Arshad (2007) use a quadratic
expenditure system to estimate the household
budget analysis for rural and urban sectors of Pakistan. Out of twenty two group categories,
ten are defined as food categories and the rests
are included in non-food categories. The data
is obtained from HIES for the year 2000-01.
Mukhtar, H., (1985) uses ELES in order to
estimate the consumer demand for rural-urban
Pakistan. The data is taken from HIES for the
years 1963, 1964, 1966 (urban sample only),
1968-69, 1970-71, 1971-72 and 1979
(published in 1982). The household monthly
expenditures are divided into seven major
categories. The comprehensive sub-division of each category is also mentioned.
Alderman (1988) estimates income and price
elasticities on consumer demand by using
AIDS and expenditure survey for the year
1979 along with urban survey conducted in
1982. Malik, S., and Aziz, B., (2006) follow
the time series approach for the analysis of
consumer demand and structural changes in

International Journal of Asian Social Science, 2(7), pp. 1103-1122.
1105
Pakistan. They use LA/AIDS model with time
period from 1950-51 to 2003-04.
These comprehensive studies address various
issues relating to household consumption
pattern in rural-urban households of Pakistan. None of them have analyzed consumption and
demand elasticities of food products for
Balochistan by applying LA/AIDS and 2005-
06 household data tape.
Data and Methodology
The estimations of demand elasticities and
households’ consumption pattern are based on
the Household Income and Expenditure
Survey (HIES). This survey was conducted by
the Federal Bureau of Statistics on annual basis2. We use the survey for 2005-06. The
data tapes were being the latest available at the
start of this study. The universe of HIES
survey consists of all urban and rural areas.
The raising factors given in the survey are
used to give household weights3 to correct for
over sampling of some provinces or locations.
The current study area is the biggest province
of Pakistan that is Balochistan. The net sample
consists of over 2037 households. The portion
of Balochistan households is 13.3 percent in the total samples of Pakistan4. The
compositions of urban and rural households
are respectively 728 and 1309 households.
At the first stage we obtain the monthly
quantities consumed (for thirty seven food
2 The survey is spread over a year that commences in the
first quarter from July and completes by next June. In
order to obtain the better quality of data from the female
respondents, the relevant parts of consumption
expenditure of food and non-food items (fortnightly and
monthly) have been included in the female part whereas,
information which is considered to be answered better by
the male household respondents are included in the male
part of the questionnaire.
3 The weights assigned from lowest 13.75 to the largest
8707.44.
4 The gross sample consists of over 15453 households and
excluded 139 households (139*100/15453=0.89 per cent)
from the given recorded sample due to insufficient
information regarding their consumption The net sample
consists of 15314 households.
commodities)5 and their respective
consumption expenditures. The food
expenditures include the sum value of paid and
consumed, wages and salaries in kind, own
produced and consumed receipts from
assistance, gift, dowry etc.
In the second stage we construct adult
equivalent household size. The demographic
categories of households with respect to their
age and gender compositions are arranged for
this. The demographic categories of
households are as follows. The categories of
children are between the age of 0 and 05, and
the age of 05 and 10. The categories of male
adult are between the age of 10 and 15, the age
of 15 and 25, the age of 25 and 65 and the age
of greater than 65. The categories of female adult are between the age of 10 and 15, the age
of 15 and 25, the age of 25 and 40 and the age
greater than 40.
The adult equivalent household age and gender
size, prices6 and budget shares of each food
item are also reported.
Methodology
In order to attain the central objective of the study, three stages are described here. The first
includes the construction of equivalence
scales; the second consists of the households’
consumption for food commodity groups, per
adult equivalent. The final stage applies the
Almost Ideal Demand System (AIDS) to
estimate a complete demand system for
elasticities. The construction of equivalence
scales depends on the use of nutritional
requirements of different age and gender
groups as “we assign the average calorie
requirements to household composition of age and gender as mentioned in the data set. The
reference calorie requirement is taken to be
2550 calories for a male adult between the age
5 Food quantities consumption cover milk ,butter, beef,
mutton, chicken ,egg ,fish, banana, apple, grape, mango,
ofruit,potato,tomato,cabbge,karela,wsugar,confect,barfee,g
lucose,bervgs,squash,wheat,rice,otcerl,gram,dalcha,mash,
moong,masoor,dghee,bghee,cookoil,ttea,buisct,bread,naan 6 prices of each item are obtained by dividing households’
food expenditure on its quantity consumed. The final data
set consist of monthly expenditure and food quantities
consumed.

Analysis of Consumption and Demand Elasticities…..
1106
of 25 and 65. The value corresponding to a
chosen reference male adult between the age
of 25 and 65 is set equal to unity. The values of
adult equivalent that correspond to other
households of age and gender categories types
are then expressed relative to this base”.
Estimates of adult equivalents for some
households is understated because we have no
direct information on adult females which
would allow us to incorporate the additional
calorie requirements for pregnancy and
lactation.
Table 1 depicts the calorie requirements and
adult equivalent scales with respect to age and
gender compositions. The calorie intakes are
respectively 1754 and 1835 units for both
gender compositions of the age between 0 and
5 and between 5 and 10. The calorie intakes
for male of the age between 10 and 15, 15 and
25, 25 and 65 and greater than 65 are 2300,
2750, 2550 and 2170 units respectively. The
calorie intakes for female of the age between 10 and 15, 15 and 25, 25 and 40 and greater
than 40 are 2250, 2130, 2160 and 1905 units
respectively. The reference calorie
requirement is taken to be 2550 calories for a
male adult between the age of 25 and 65. The
value corresponding to a chosen reference
male adult between the age of 25 and 65 is set
equal to unity as adult equivalent scale. The
values of other adult equivalent scales of age
and gender compositions are less than unity
except in the case of male with age between 15
and 25.
Table 1: Daily calorie requirements and adult equivalent scales by age and gender
Calorie Requirements Adult Equivalent Scales
Age Both Male Female Both Male Female
0 - 5 1754 1754/2550=0.68
5 – 10 1835 1835/2550=0.71
10 - 15 2300 2250 2300/2550=0.90 2250/2550=0.88
15 – 25 2750 2130 2750/2550=1.07 2130/2550=0.83
25 – 65 2550 2550/2550=1
> 65 2170 2170/2550=0.85
25 - 40 2160 2160/2550=0.84
> 40 1906 1906/2550=0.74
Source: Nutritional compositions of demographic compositions are taken from tables published by
the Planning Division (1985) as well as Ercelawn, A., discussion paper (May, 1991).
In the next step we compute the adult
equivalent household size on the basis of
mentioned adult equivalent scales.
nad=0.68nc0-5+0.71nc5-10+0.91nm10-
15+1.07nm15-25+nm25-65+0.85nmg65+0.88nf10-
15+0.83nf15-25 +0.85nf25-40 +0.74nfg40.
Where
nad = Adult Equivalent Household size.
nc0-5 = Children between the age of 0 and 5.
nc5-10 = Children between the age of 5 and
10.
nm10-15 = Male between the age of 10 and 15.
nm15-25 = Male between the age of 15 and 25.
nm25-65 = Male between the age of 25 and 65.
nmg65 = Male the age greater than 65.
nf10-15 = Female between the age of 10 and
15.
nf15-25 = Female between the age of 15 and
25.
nf25-40 = Female between the age of 25 and
40.
nfg40 = Female the age greater than 40.
International Journal of Asian Social Science, 2(7), pp. 1103-1122.
1107
The food-expenditure relationship is
estimated as:
Food = ƒ (lntexp) ---------- (A)
The dependent variable food and
independent variable lntexp are logarithm of
monthly food and total consumption
expenditure per adult equivalent
respectively. The AIDS model is usually
specified by Deaton and Muellabauer
(1980a, 1980b) as:
wi = αi + Σ γij Pj + βi ln (x/p) ---------- (1)
Where wi is the share of ith good in the
household’s budget; x is total expenditure, Pj is the price of jth good, and P is a properly
defined price aggregator.
The price aggregator (index) is given by:
ln P = Σ αi ln (pi) + 1/2 Σ Σ γij ln (pi) ln (pj)
----------(2)
To avoid the non-linear estimation due to
equation (2), we follow the procedure of
Stone (1953) and Ray (1979) with some
modification in the form which includes the Demographic compositions of households.
The Stone price index (P*):
ln P* = Σ wj ln (pi) -----------(3)
The resulting model is called the “Linear
Approximate AIDS” (LA/AIDS):
wi = αi + Σ γij Pj + βi ln (x/p*) + Σ φi zk---- (4)
In equation (4), x is per adult equivalent
expenditure of household. zk is adult
equivalent age and gender demographic
groups of household7
The following formulae are obtained (see the study by Ahmed, U.A. and Shams,Y., (1994)
for derivation) for expenditure Єi and
uncompensated own and cross price
elasticity eij.
Єi = 1+ (βi / Wi ) ---------(5)
7 age and gender demographic groups are z1= children
between the age of 0 and 15, z2= male the age greater
than 14 and z3= female the age greater than 14
respectively
eij = (γij -βiwj) /wi – σij ------------(6)
The values of eij are 1 and zero in the case of
own price and cross price elasticity
respectively. The compensated own and
cross price elasticities can be computed by
using the Slutsky equation in elasticity form: eij = eH
ij - wj Єi --------------(7)
where eHij is the compensated (Hicksian)
price elasticity.
Data – Descriptive Statistics, Results and
Discussion
In this section we include data-descriptive
statistics with respect to Balochistan and its
both urban and rural areas.
Table 2 reports average members of
households. The average members of adult equivalent household size for total area of
Baluchistan that is both urban and rural areas
are 6.67, 7.11 and 6.42 respectively. The
total households are respectively 2037, 728
and 1309.
Average monthly food and total expenditure
per adult equivalent are reported in Table 3.
Average monthly food consumption
expenditures are Rs.146.47, Rs.181.96 and
Rs.126.74 respectively. The average total
monthly expenditures are Rs.407.97,
Rs.538.37 and Rs.310.42. The average
monthly food and total expenditure of urban
areas are larger than rural areas of
Balochistan.
The average monthly budget shares of
different items in percentage are reported in
Table 4. The percentage budget share of
wheat is larger than others. The average
monthly wheat budget shares are 11.61, 8.84
and 13.15 percent. The total monthly budget
shares of selected food items are 35.57,
29.83 and 38.78 per cent respectively. The
share of rural households is larger than other.

Analysis of Consumption and Demand Elasticities…..
1108
Table -2 Household size and Adult Equivalent (A.E) household size, 2005-06
Area Households A.E household size
Balochistan 2037 6.67
Urban Balochistan 728 7.11
Rural Balochistan 1309 6.42
Source: Computed by authors based on HIES data of Pakistan for the year 2005-06.
Table-3 Average monthly food and total expenditure per adult equivalent
Area Food (Rs.) Total Exp.(Rs.) Households
Balochistan 146.47 407.97 2037
Urban Balochistan 181.96 538.37 728
Rural Balochistan 126.74 310.42 1309
Source: Computed by authors based on HIES data of Pakistan for the year 2005-06.
Table- 4 Average monthly budget share of different food items8 (in %)
Area
Food Series Balochistan Urban Balochistan Rural Balochistan
Milk 5.55 4.958319 5.875921
Beef 2.18 2.150046 2.202874
Mutton 2.11 1.868382 2.243211
Chicken 2.05 1.731965 2.229165
Wheat 11.61 8.846313 13.15205
Rice 1.75 1.619273 1.819424
Sugar
4.06
3.500503
4.37236
Banaspati Ghee 4.54 3.678358 5.025664
Tea 1.72 1.477122 1.86275
Total 35.57 29.83028 38.78342
Source: Computed by authors based on HIES data of Pakistan for the year 2005- 8 we report the average monthly budget share of selected food items only
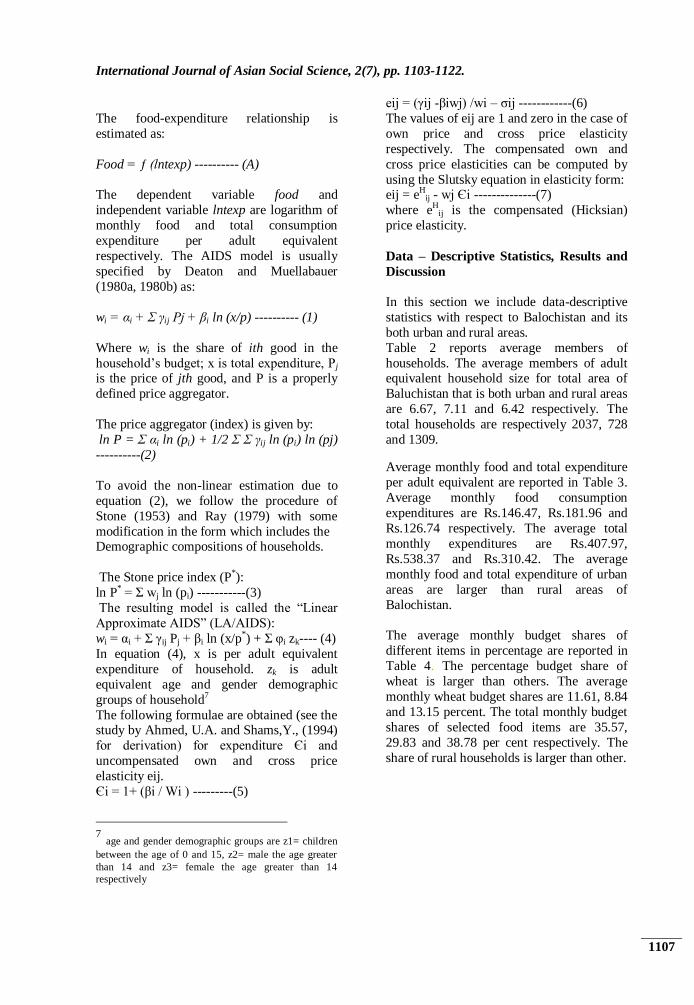
The Food-expenditure relationship
The food-expenditure relationship is presented
in Figures 1 to 3. Figure 1 shows the food-
expenditure relationship for overall households
of Balochistan. Figures 1 and 2 depict the
food-expenditure relationship for the urban
and rural households respectively.
The households’ food consumption
expenditure is increasing at decreasing rate.
This implies that when total expenditure
(income) is increasing, households’ food consumption expenditure is also increasing
with less proportion.
Figure 1 indicates that 85% households of
Balochistan per adult equivalent expenditure
(income) in the range Rs. 0-2000, while the
correspondence expenditure on food is in the
range Rs. 0-400.
International Journal of Asian Social Science, 2(7), pp. 1103-1122.
1109
8000.006000.004000.002000.000.00
Total monthly exp.per adult equivalent
1000.00
800.00
600.00
400.00
200.00
0.00
Total monthly exp.on food items per adult equivalent
Logarithmic
Observed
Figure 1 Food-expenditure relationship: Balochistan (2005-06)
Figures 2 and 3 indicate that per adult equivalent expenditure (Income) of 88% urban and rural
households are Rs.0-1500 and Rs.0-1000 per month and expenditure on food are Rs.0-450 and
Rs.0-250 per month.
5000.004000.003000.002000.001000.000.00
Total monthly exp.per adult equivalent
1000.00
800.00
600.00
400.00
200.00
0.00
Total monthly exp.on food items per adult equivalent
Logarithmic
Observed
Figure 2 Food-expenditure relationship: Urban Balochistan (2005-06)

Analysis of Consumption and Demand Elasticities…..
1110
8000.006000.004000.002000.000.00
Total monthly exp.per adult equivalent
600.00
400.00
200.00
0.00
Total monthly exp.on food items per adult equivalent
Logarithmic
Observed
Figure 3 Food-expenditure relationship: Rural Balochistan (2005-06)
Analytical tools of central importance are the price elasticity, expenditure elasticities and
cross price elasticity of demand. The price
elasticity of demand is a quantitative measure
of the responsiveness of purchase decisions to
variations in price. The price elasticities of
demand for different items and regions often
differ substantially.
Income (expenditure) may be interpreted as
the percentage change in quantity demand
when income (expenditure) changes roughly
by one percent. It indicates the nature of different commodity items. Similarly, the
cross price elasticity indicates the causal
relationship of different commodity items. The
quantity of a commodity purchased in the
market depends not only on its price and
household’s income but also on the price of
related commodities. Cross elasticity of
demand by definition is the percentage change
in the quantity demanded of one commodity
caused by one percent change in the price of
other items. The cross price elasticity may be positive or negative. In the case of
complement goods cross price elasticity is
negative and is positive for substitute goods.
In the following section we examine the estimates of uncompensated and compensated
own-price elasticities and income
(expenditure) elasticities of different food
items.
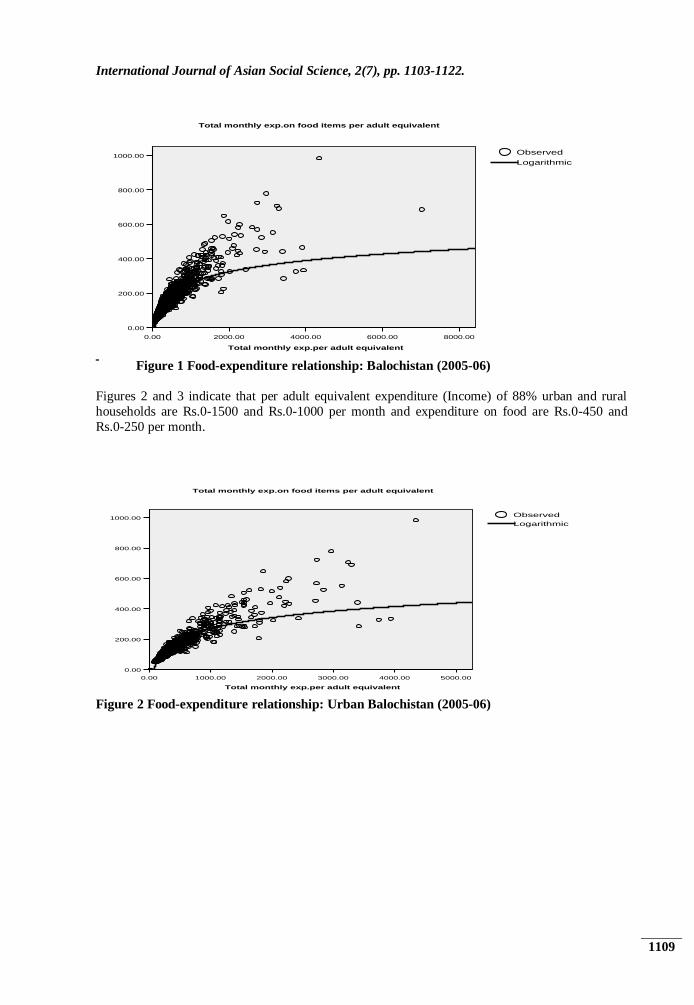
From Table 5, it is clear that signs of own
price elasticities satisfy the economic criteria.
The low uncompensated price elasticity for
gram, masoor, potato, tomato and mash
probably reflect the fact that households in this
market have much larger than average income.
This implies that the income effects of price variations are likely to be small. The larger
values of different food items like glucose,
butter, and biscuit imply that there exist many
close substitutes for them than other food
items. Low expenditure elasticities reflect that
households have to spend on these items
irrespective of the level of their income
(expenditure). All the food items are
considered as necessities in the case of
Balochistan. This implies that the expenditure
on these items does not vary greatly with households’ total expenditure.
International Journal of Asian Social Science, 2(7), pp. 1103-1122.
1111
Table 5: Own price and expenditure elasticities of selected food items: Balochistan (2005-06)
Source: Computed by authors based on HIES data of Pakistan for the year 2005-06.
Table 6 provides a detailed report on own
price compensated and uncompensated
expenditure elasticities for the urban region of
Balochistan. The estimates suggest that urban households are quite responsive to change in
prices in adjusting their food items
consumption. The absolute value of wheat and
rice for example is small indicating that there
exist less close substitutes for them than other
food items. The estimated own-price
elasticities indicate if, for example, the wheat
price fall by 10 per cent then demand for
wheat would increase by 6.6 per cent. Of this
total increase in demand, only 5.8 per cent is
purely due to price effect (i.e, the substitution effect) as the compensated elasticity suggests.
The income effect is relatively large in wheat
demand because wheat has a largest share in
household budget. The demand for rice would
increase by 13.2 per cent (i.e., 6.6 + 6.6) if per
adult equivalent income increases by 10 per
cent.
Own Price Elasticities
Expenditure
Elasticities Commodity Uncompensated Compensated
Milk -0.68242 -0.63747 0.81
Butter -7.82787 -7.82688 0.71
Sugar -0.69852 -0.66726 0.77
Glucose -19.6169 -19.6167 0.73
Tea -1.24412 -1.23105 0.76
Biscuit -2.18031 -2.17842 0.90
Beef -0.6317 -0.6162 0.71
Mutton -0.50421 -0.48924 0.71
Chicken -0.59607 -0.58171 0.70
Potato -0.42472 -0.41337 0.70
Tomato -0.4875 -0.4832 0.68
Karela -0.54375 -0.53763 0.67
Gram -0.2379 -0.2368 0.52
Dalchana -0.52651 -0.52423 0.69
Mash -0.45281 -0.45065 0.68
Masoor -0.32298 -0.32201 0.54
Vegetable Ghee -0.81567 -0.7825 0.73
Wheat -0.666 -0.58935 0.66
Rice -0.63814 -0.01579 0.88
Other cereal -11.2879 -11.2878 0.60
Moong -0.56326 -0.56068 0.72
Analysis of Consumption and Demand Elasticities…..
1112
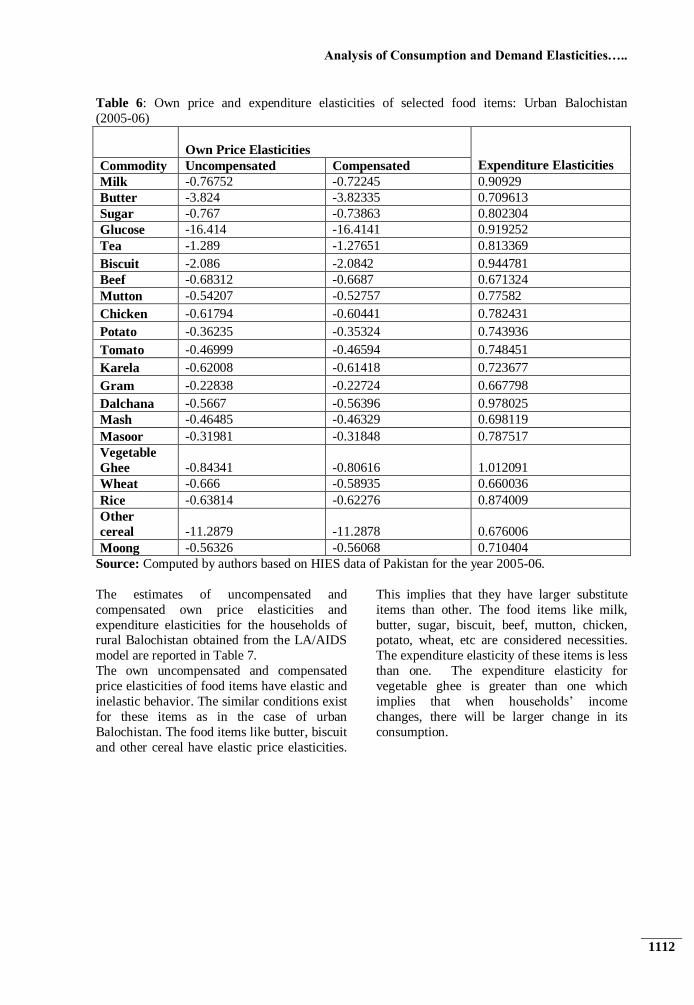
Table 6: Own price and expenditure elasticities of selected food items: Urban Balochistan
(2005-06)
Own Price Elasticities
Expenditure Elasticities Commodity Uncompensated Compensated
Milk -0.76752 -0.72245 0.90929
Butter -3.824 -3.82335 0.709613
Sugar -0.767 -0.73863 0.802304
Glucose -16.414 -16.4141 0.919252
Tea -1.289 -1.27651 0.813369
Biscuit -2.086 -2.0842 0.944781
Beef -0.68312 -0.6687 0.671324
Mutton -0.54207 -0.52757 0.77582
Chicken -0.61794 -0.60441 0.782431
Potato -0.36235 -0.35324 0.743936
Tomato -0.46999 -0.46594 0.748451
Karela -0.62008 -0.61418 0.723677
Gram -0.22838 -0.22724 0.667798
Dalchana -0.5667 -0.56396 0.978025
Mash -0.46485 -0.46329 0.698119
Masoor -0.31981 -0.31848 0.787517
Vegetable
Ghee -0.84341 -0.80616 1.012091
Wheat -0.666 -0.58935 0.660036
Rice -0.63814 -0.62276 0.874009
Other
cereal -11.2879 -11.2878 0.676006
Moong -0.56326 -0.56068 0.710404
Source: Computed by authors based on HIES data of Pakistan for the year 2005-06.
The estimates of uncompensated and
compensated own price elasticities and
expenditure elasticities for the households of rural Balochistan obtained from the LA/AIDS
model are reported in Table 7.
The own uncompensated and compensated
price elasticities of food items have elastic and
inelastic behavior. The similar conditions exist
for these items as in the case of urban
Balochistan. The food items like butter, biscuit
and other cereal have elastic price elasticities.
This implies that they have larger substitute
items than other. The food items like milk,
butter, sugar, biscuit, beef, mutton, chicken, potato, wheat, etc are considered necessities.
The expenditure elasticity of these items is less
than one. The expenditure elasticity for
vegetable ghee is greater than one which
implies that when households’ income
changes, there will be larger change in its
consumption.

International Journal of Asian Social Science, 2(7), pp. 1103-1122.
1113
Table 7: Own price and expenditure elasticities of selected. food items: Rural Balochistan (2005-
06)
Own Price Elasticities
Expenditure Elasticities Commodity Uncompensated Compensated
Milk -0.63862 -0.59099 0.9
Butter -7.82787 -7.82688 0.71
Sugar -0.69852 -0.66726 0.8
Glucose -19.6169 -19.6167 0.91
Tea -1.24412 -1.23105 0.81
Biscuit -2.18031 -2.17842 0.94
Beef -0.60863 -0.59301 0.67
Mutton -0.53278 -0.48924 0.77
Chicken -0.62796 -0.58171 0.78
Potato -0.49223 -0.41337 0.74
Tomato -0.52994 -0.4832 0.75
Karela -0.56993 -0.53763 0.72
Gram -0.32668 -0.2368 0.67
Dalchana -0.56505 -0.52423 0.98
Mash -0.51723 -0.45065 0.69
Masoor -0.38688 -0.32201 0.78
Vegetable
Ghee -0.83239 -0.7825 1.012
Wheat -0.51789 -0.4311 0.66
Rice -0.63814 -0.62276 0.87
Other
cereal -11.2879 -11.2878 0.67
Moong -0.56326 -0.56068 0.71
Source: Computed by authors based on HIES data of Pakistan for the year 2005-06.
Cross-price elasticities
Tables 8 to 24 provide the entire
uncompensated and compensated price
elasticities matrices for Balochistan and its
both sectors. We arrange the food items into
three separate groups. The first group includes milk, butter, sugar, glucose, tea and biscuit
respectively. The second includes beef,
mutton, chicken, potato, tomato, karela, gram,
dal chana, dal mash, masoor, and vegetable
ghee; the last one includes wheat, rice, other
cereal, mash, masoor, dal chana, moong,
vegetable ghee. The groups are formed here in
order to check the nature of items with respect
to substitutes and complements. We estimate
the LA/AIDS model for each groups
separately.
In each case we estimate three separate
LA/AIDS models. In the case of
uncompensated cross price elasticities, the
gross effects include both the substitution and
income effects. The pure price effects are presented in the form of compensated cross
price elasticities. In the case of Balochistan,
milk and sugar have complementary
relationship either with respect to price of milk
or with respect to price of sugar. The behavior
of sugar and tea is gross substitutes with each
other (Table 8). A ten per cent increase in milk
price would result in a 0.5 per cent decreased
demand for sugar.
The cross price elasticity between beef and
mutton is negative with each other (Table 9)

Analysis of Consumption and Demand Elasticities…..
1114
which implies that they have complementary
relationships. The economic theory suggests
that these goods should be substitutes.
However ,in our study, they have
complementary behavior. With respect to
price of chicken the cross price elasticity between chicken and mutton is positive. This
implies that they have the substitute
relationships with each other. A 10 per cent
increase in chicken price would result in 0.04
per cent increased demand for mutton. The
cross price elasticity between wheat and rice is
positive (Table 10) which implies that they are
substitutes with respect to price of wheat. But
with respect to price of rice they have
complement relationships. The same condition
exists in the case of most food items like milk
and butter, mutton and chicken, wheat and other cereal, etc.
The compensated cross price elasticity
between milk and sugar is negative (Table 11)
implying that they have net complementary
relationship with each other. In case of beef
and mutton the cross price elasticity is also
negative (Table 12) showing that there exists a net complementary relationship. The
compensated cross price elasticity between
wheat and rice includes the same relationship
with each other.
Some cross-price elasticities change signs
between their uncompensated and
compensated forms. In the case of milk and
tea, they are gross complements (Table 8).
However, in the case of compensated cross
price elasticity they have net substitute
relationships (Table 11).
Table 8: Uncompensated own and cross price elasticities of food products: Balochistan (2005-06)
Demand for
Price of Milk Butter Sugar Glucose Tea Biscuits
Milk -0.682 0.263109 -0.05126 0.065651 -0.00845186 -0.019762
Butter -0.204 -7.82787 -0.00015 0.1569224 0.03630835 0.0087516
Sugar -0.13 0.138562 -0.69852 -0.3412145 0.02134265 0.1998588
Glucose 0.0947 0.079691 -0.00273 -19.6169 -0.00012381 0.1864429
Tea 0.1492 0.292009 0.04862 0.1521537 -1.244118 0.0544421
Biscuits -0.029 -0.13797 0.04236 0.0496187 -0.00939043 -2.1803
Source: Computed by authors based on HIES data of Pakistan for the year 2005-06.
Table 9: Uncompensated own and cross price elasticities of food products: Balochistan (2005-06)
Demand for
Price of Beef Mutton Chicken Potato Tomato Karela Gram Dalcha Mash Masoor Bghee
Beef -
0.6317
-
0.0423 -0.0301
-
0.0254 -0.0055
-
0.0252 0.0034
-
0.0194
-
0.0207 0.0007 0.0092
Mutton
-
0.0356 -
0.5042 -0.0145
-
0.0014 -0.0023
-
0.0307 -0.0084
-
0.0218 0.0017 -0.0208 -0.0092
Chicken -0.0495 0.0044 -0.5961 0.0246 0.0283
-0.0610 -0.0092
-0.0163
-0.0031 -0.0098 -0.0020
Potato
-
0.0170
-
0.5031 -0.1636 -
0.4247 -0.0453
-
0.1536 -0.0519
-
0.0754
-
0.0081 -0.1592 -0.0246
Tomato 0.0084
-
0.0498 0.0044 0.0570 -0.4875
-
0.0776 -0.0205
-
0.0996 0.0110 -0.0667 -0.0142
Karela
-
0.0335
-
0.0268 0.0055
-
0.0566 -0.0089 -
0.5438 0.0320 0.0070 0.0214 0.0049 0.0099
Gram
-
0.0039
-
0.0092 -0.0135 0.0096 0.0336 0.0157 -0.2379
-
0.0084
-
0.0507 -0.0131 0.0012

International Journal of Asian Social Science, 2(7), pp. 1103-1122.
1115
Dacha
-
0.0196 0.0033 -0.0041
-
0.0031 -0.0119
-
0.0779 -0.0052 -
0.5265
-
0.0642 -0.0394 -0.0163
Mash 0.0153 0.0577 0.0063 0.0005 0.0211
-
0.0865 0.0082
-
0.0300 -
0.4528 -0.0114 0.0131
Masoor 0.0120
-
0.0137 -0.0027
-
0.0221 0.0133
-
0.0002 -0.0289
-
0.0515
-
0.0558 -0.3230 -0.0104
Bghee 0.0022
-
0.0194 -0.0018
-
0.0260 -0.0125 0.0179 -0.0276
-
0.0032 0.0059 -0.0288 -0.8157
Source: Computed by authors based on HIES data of Pakistan for the year 2005-06.
Table 10:Uncompensated own and cross price elasticities of food products: Balochistan (2005-06)
Source: Computed by authors based on HIES data of Pakistan for the year 2005-06.
Table-11: Compensated own and cross price elasticities of food products: Balochistan (2005-06)
Source: Computed by authors based on HIES data of Pakistan for the year 2005-06.
Demand for
Price of Wheat Rice Otcereal Dalcha Mash Moong Masoor Bghee
Wheat -0.666 0.22856 -0.365048 0.09424 0.1647748 0.13055 -0.006057 -0.0178951
Rice -0.06194 -0.63814 0.183393 -0.082753 -0.038839 -0.09171 -0.065308 0.01009427
Otcereal 0.02535 0.133795 -11.28788 0.021993 0.0068952 0.02277 0.003776 0.00665067
Dalcha -0.01781 0.007395 -0.079922 -0.53408 -0.066048 -0.05007 -0.049712 -0.0210149
Mash 0.01764 -0.15685 0.121769 -0.034632 -0.45136 -0.02914 -0.018919 0.01148761
Moong 0.00648 -0.00552 0.151358 -0.078427 -0.089905 -0.5633 -0.039163 -0.0078842
Masoor -0.00727 -0.06562 -0.070671 -0.051662 -0.05349 -0.02702 -0.322731 -0.0119401
Bghee -0.0025 -0.02793 0.040453 0.000354 0.0054154 -0.01458 -0.029765 -0.8115251
Demand for
Price of Milk Butter Sugar Glucose Tea Biscuits
Milk -0.637466 0.3025138 -0.0085266 0.106166037 0.033728142 0.030188434
Butter -0.2030425 -7.82687 0.00093038 0.157944379 0.037372354 0.010011619
Sugar -0.0973238 0.1673878 -0.667262 -0.31157651 0.052198654 0.236398812
Glucose 0.09499288 0.0799043 -0.002496 -19.616695 0.000104191 0.186712879
Tea 0.16309845 0.3042212 0.06186446 0.16470973 -1.23104664 0.069922118
Biscuits -0.0276911 -0.136475 0.04397877 0.051151685 -0.00779443 -2.17841822

Analysis of Consumption and Demand Elasticities…..
1116
Table 12: Compensated own and cross price elasticities of food products: Balochistan (2005-06)
Source: Computed by authors based on HIES data of Pakistan for the year 2005-0
Table 13: Compensated own and cross price elasticities of food products: Balochistan (2005-06)
Demand for
Price of Wheat Rice Otcereal Dalcha Mash Moong Masoor Bghee
Wheat -0.5893 -0.27284 -0.295368 0.1743709 0.2437448 0.21416 0.0566546 0.066882
Rice -0.0504 -0.0157 0.1938799 -0.0706922 -0.0269536 -0.079121 -0.055869 0.022854
Otcereal 0.02544 0.01693 -11.2878 0.0220854 0.0069865 0.022863 0.0038482 0.006749
Dalcha -0.0156 0.0103 -0.077938 -0.531799 -0.0637994 -0.04769 -0.047927 -0.0186
Mash 0.01974 -0.15406 0.1236742 -0.0324412 -0.449200 -0.026851 -0.017205 0.013806
Moong 0.00885 -0.00236 0.1535106 -0.0759515 -0.0874659 -0.56067 -0.037226 -0.00527
Masoor -0.0058 -0.0637 -0.069367 -0.0501625 -0.0520125 -0.02546 -0.321558 -0.01035
Bghee 0.02749 0.01205 0.0677182 0.0317087 0.0363156 0.018141 -0.005227 -0.77835
Source: Computed by authors based on HIES data of Pakistan for the year 2005-06.
Demand for
Price of Beef Mutton Chicken Potato Tomato Karela Gram Dalcha Mash Masoor Bghee
Beef -0.616
-
0.0268 -0.015 -0.010 0.0094 -0.0105 0.0147
-
0.0044 -0.006 0.0105 0.0251
Mutton
-
0.0206 -
0.4892 0.0003 0.01336 0.012 -0.0166 0.0025
-
0.0073 0.016
-
0.0113 0.0062
Chicken
-
0.0349 0.0189 -0.5817 0.03895 0.0422 -0.0473 0.0015
-
0.0021 0.0109
-
0.0006 0.013
Potato
-
0.0055
-
0.4916 -0.1522 -0.4134 -0.034 -0.1427 -0.044 -0.065 0.0029
-
0.1519 -0.013
Tomato 0.0129
-
0.0453 0.0089 0.06143 -0.483 -0.0734 -0.0172
-
0.0953 0.0153
-
0.0638 -0.01
Karela -0.027
-
0.0203 0.0119 -0.0502 -0.003 -0.5376 0.0367 0.0133 0.0276 0.009 0.0166
Gram
-
0.0024
-
0.0077 -0.012 0.01111 0.035 0.01711 -0.2368
-
0.0069 -0.049
-
0.0121 0.0027
Dacha
-
0.0173 0.0057 -0.0018 -0.0008 -0.01 -0.0757 -0.0035 -
0.5242 -0.062
-
0.0379 -0.014
Mash 0.0175 0.0599 0.0085 0.00275 0.0232 -0.0844 0.0098
-
0.0278 -0.451
-
0.0099 0.0154
Masoor 0.0136 -0.0122 -0.0012 -0.0206 0.0148 0.00127 -0.0277 -0.05 -0.054 -0.322 -0.009
Bghee 0.0344 0.0129 0.03 0.00581 0.0184 0.04831 -0.004 0.0281 0.0368
-
0.0083 -0.783

International Journal of Asian Social Science, 2(7), pp. 1103-1122.
1117
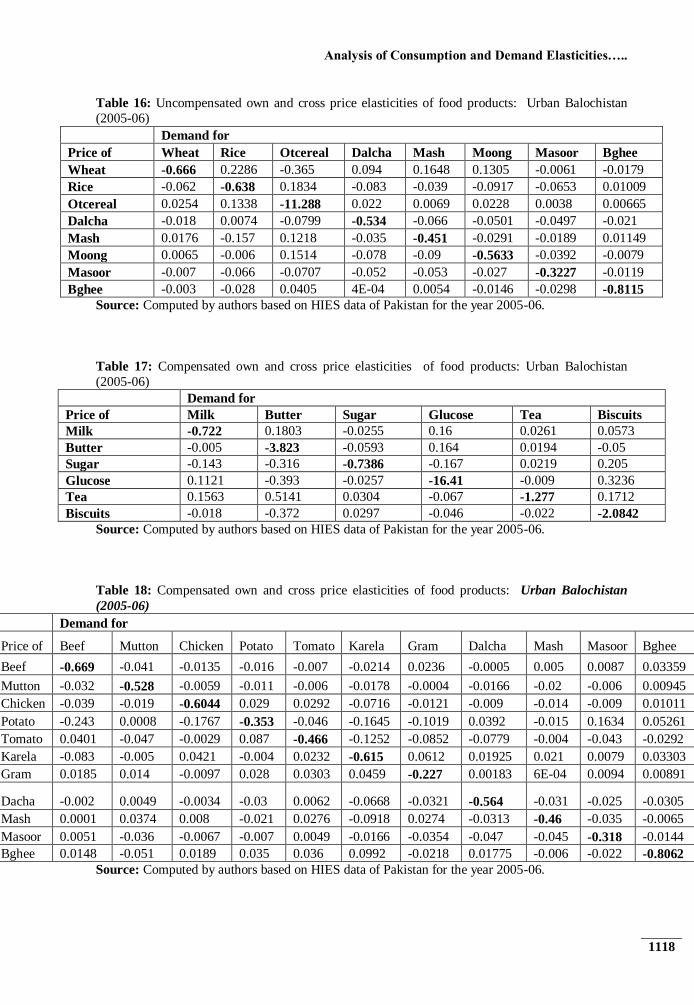
Tables 14-19 show the uncompensated and
compensated own and cross price elasticities
of food items for urban Balochistan. The cross
price elasticity between milk and butter is
positive with respect to price of milk. This
implies that they have the gross substitute relationship. A 10 per cent increase in the
price of milk responses a 1.45 per cent
increase in the demand of butter. With respect
to price of sugar, the uncompensated elasticity
between sugar and tea is negative, while it is
positive with respect to price of tea (Table 14).
Beef and mutton have complementary
relationships with each other (Table 15). A 10
per cent fall in beef price would result in 0.58
per cent increased demand for mutton. The
cross elasticity indicates the effect of change
in beef price on mutton demand in our
explanation. Wheat and rice indicate the
mixed trend for each other (Table 16). The
uncompensated cross price elasticity between wheat and rice are positive with respect to
price of wheat. It is negative with respect to
price of rice. The same condition exists for
most of the food items. However, in the case
of negative cross price elasticity, the food
items are gross substitutes and gross
complements in the case of negative
uncompensated cross price elasticity.
Table 14: Uncompensated own and cross price elasticities of food products Urban Balochistan
(2005-06)
Demand for
Price of Milk Butter Sugar Glucose Tea Biscuits
Milk -0.7675239 0.145 -0.065 0.115 -0.014 0.010
Butter -0.0055089 -3.824 -0.060 0.164 0.019 -0.051
Sugar -0.1744043 -0.341 -0.767 -0.200 -0.006 0.172
Glucose 0.11187325 -0.393 -0.026 -16.414 -0.010 0.323
Tea 0.14285467 0.504 0.019 -0.080 -1.289 0.157
Biscuits -0.0196585 -0.373 0.028 -0.048 -0.024 -2.086
Source: Computed by authors based on HIES data of Pakistan for the year 2005-06.
Table 15: Uncompensated own and cross price elasticities of food products: Urban Balochistan
(2005-06)
Demand for
Price of Beef Mutton Chicken Potato Tomato Karela Gram Dalcha Mash Masoor Bghee
Beef -0.683 -0.058 -0.0303 -0.032 -0.023 -0.0369 0.0092 -0.0215 -0.009 -0.008 0.01183
Mutton -0.045 -0.542 -0.0205 -0.025 -0.02 -0.0313 -0.0129 -0.0349 -0.033 -0.021 -0.0095
Chicken -0.051 -0.032 -0.6179 0.016 0.0163 -0.0841 -0.0237 -0.0259 -0.026 -0.022 -0.0074
Potato -0.252 -0.009 -0.1864 -0.362 -0.055 -0.1734 -0.1101 0.02717 -0.023 0.1538 0.04017
Tomato 0.0363 -0.051 -0.0071 0.083 -0.47 -0.1291 -0.0888 -0.0832 -0.008 -0.047 -0.0347
Karela -0.088 -0.011 0.0357 -0.01 0.0171 -0.620 0.0557 0.01123 0.015 0.0015 0.02473
Gram 0.0173 0.0127 -0.0111 0.027 0.029 0.0446 -0.229 0.00016 -6E-04 0.0081 0.00719
Dacha -0.004 0.0028 -0.0056 -0.032 0.0041 -0.0688 -0.034 -0.5667 -0.033 -0.027 -0.0333
Mash -0.002 0.0356 0.0062 -0.022 0.0259 -0.0935 0.0259 -0.0336 -0.465 -0.037 -0.0088
Masoor 0.0039 -0.038 -0.008 -0.008 0.0036 -0.0179 -0.0366 -0.0486 -0.046 -0.32 -0.0161
Bghee -0.011 -0.08 -0.0099 0.008 0.0084 0.0727 -0.0465 -0.0182 -0.031 -0.051 -0.8434
Analysis of Consumption and Demand Elasticities…..
1118
Table 16: Uncompensated own and cross price elasticities of food products: Urban Balochistan
(2005-06)
Demand for
Price of Wheat Rice Otcereal Dalcha Mash Moong Masoor Bghee
Wheat -0.666 0.2286 -0.365 0.094 0.1648 0.1305 -0.0061 -0.0179
Rice -0.062 -0.638 0.1834 -0.083 -0.039 -0.0917 -0.0653 0.01009
Otcereal 0.0254 0.1338 -11.288 0.022 0.0069 0.0228 0.0038 0.00665
Dalcha -0.018 0.0074 -0.0799 -0.534 -0.066 -0.0501 -0.0497 -0.021
Mash 0.0176 -0.157 0.1218 -0.035 -0.451 -0.0291 -0.0189 0.01149
Moong 0.0065 -0.006 0.1514 -0.078 -0.09 -0.5633 -0.0392 -0.0079
Masoor -0.007 -0.066 -0.0707 -0.052 -0.053 -0.027 -0.3227 -0.0119
Bghee -0.003 -0.028 0.0405 4E-04 0.0054 -0.0146 -0.0298 -0.8115
Source: Computed by authors based on HIES data of Pakistan for the year 2005-06.
Table 17: Compensated own and cross price elasticities of food products: Urban Balochistan
(2005-06)
Demand for
Price of Milk Butter Sugar Glucose Tea Biscuits
Milk -0.722 0.1803 -0.0255 0.16 0.0261 0.0573
Butter -0.005 -3.823 -0.0593 0.164 0.0194 -0.05
Sugar -0.143 -0.316 -0.7386 -0.167 0.0219 0.205
Glucose 0.1121 -0.393 -0.0257 -16.41 -0.009 0.3236
Tea 0.1563 0.5141 0.0304 -0.067 -1.277 0.1712
Biscuits -0.018 -0.372 0.0297 -0.046 -0.022 -2.0842
Source: Computed by authors based on HIES data of Pakistan for the year 2005-06.
Table 18: Compensated own and cross price elasticities of food products: Urban Balochistan
(2005-06)
Demand for
Price of Beef Mutton Chicken Potato Tomato Karela Gram Dalcha Mash Masoor Bghee
Beef -0.669 -0.041 -0.0135 -0.016 -0.007 -0.0214 0.0236 -0.0005 0.005 0.0087 0.03359
Mutton -0.032 -0.528 -0.0059 -0.011 -0.006 -0.0178 -0.0004 -0.0166 -0.02 -0.006 0.00945
Chicken -0.039 -0.019 -0.6044 0.029 0.0292 -0.0716 -0.0121 -0.009 -0.014 -0.009 0.01011
Potato -0.243 0.0008 -0.1767 -0.353 -0.046 -0.1645 -0.1019 0.0392 -0.015 0.1634 0.05261
Tomato 0.0401 -0.047 -0.0029 0.087 -0.466 -0.1252 -0.0852 -0.0779 -0.004 -0.043 -0.0292
Karela -0.083 -0.005 0.0421 -0.004 0.0232 -0.615 0.0612 0.01925 0.021 0.0079 0.03303
Gram 0.0185 0.014 -0.0097 0.028 0.0303 0.0459 -0.227 0.00183 6E-04 0.0094 0.00891
Dacha -0.002 0.0049 -0.0034 -0.03 0.0062 -0.0668 -0.0321 -0.564 -0.031 -0.025 -0.0305
Mash 0.0001 0.0374 0.008 -0.021 0.0276 -0.0918 0.0274 -0.0313 -0.46 -0.035 -0.0065
Masoor 0.0051 -0.036 -0.0067 -0.007 0.0049 -0.0166 -0.0354 -0.047 -0.045 -0.318 -0.0144
Bghee 0.0148 -0.051 0.0189 0.035 0.036 0.0992 -0.0218 0.01775 -0.006 -0.022 -0.8062
Source: Computed by authors based on HIES data of Pakistan for the year 2005-06.

International Journal of Asian Social Science, 2(7), pp. 1103-1122.
1119
Table 19: Compensated own and cross price elasticities of food products: Urban Balochistan
(2005-06)
Demand for
Price of Wheat Rice Otcereal Dalcha Mash Moong Masoor Bghee
Wheat -0.589 0.3308 -0.2954 0.174 0.2437 0.2142 0.0567 0.06688
Rice -0.05 -0.623 0.1939 -0.071 -0.027 -0.0791 -0.0559 0.02285
Otcereal 0.0254 0.1339 -11.288 0.022 0.007 0.0229 0.0038 0.00675
Dalcha -0.016 0.0103 -0.0779 -0.532 -0.064 -0.0477 -0.0479 -0.0186
Mash 0.0197 -0.154 0.1237 -0.032 -0.449 -0.0269 -0.0172 0.01381
Moong 0.0088 -0.002 0.1535 -0.076 -0.087 -0.5607 -0.0372 -0.0053
Masoor -0.006 -0.064 -0.0694 -0.05 -0.052 -0.0255 -0.3216 -0.0104
Bghee 0.0275 0.0121 0.0677 0.032 0.0363 0.0181 -0.0052 -0.7784
Source: Computed by authors based on HIES data of Pakistan for the year 2005-06.
Table 20-25 present the uncompensated and
compensated own and cross price elasticities
in the case of rural Balochistan.
Uncompensated price elasticity between sugar
and tea is positive. This implies that they have
substitute relationship with each other
(Table20). A 10 per cent increase in the price
of sugar will increase 0.2 per cent in the
demand of tea. The relationship between beef and mutton, beef and chicken, mutton and
chicken, etc. are gross complements with each
other. A rise in the price of beef will reduce
not only the
quantity demand of beef, but also, because
beef and mutton are complements the demand
for mutton. From the Table 25, it is clear that
with respect to price of wheat the cross price
elasticities are substitutes in the case of rice,
dalchana, mash, moong, masoor, and
vegetable ghee, respectively. A rise in the
price of wheat will increase the demand for
them. There exists approximately similar condition as in the case of rural Balochistan
and urban Balochistan with reference to
compensated own and cross-price elasticities.
Table 20: Uncompensated own and cross price elasticities of food products: Rural Balochistan
(2005-06)
Demand for
Price of Milk Butter Sugar Glucose Tea Biscuits
Milk -0.6386 0.2631 -0.0513 0.06565 -0.00845 -0.01976
Butter -0.2414 -7.8279 -0.0001 0.15692 0.03631 0.00875
Sugar -0.1325 0.1386 -0.6985 -0.34121 0.02134 0.19986
Glucose 0.05606 0.0797 -0.0027 -19.6169 -0.00012 0.18644
Tea 0.15787 0.292 0.04862 0.15215 -1.24412 0.05444
Biscuits -0.0314 -0.138 0.04236 0.04962 -0.00939 -2.18031
Source: Computed by authors based on HIES data of Pakistan for the year 2005-06.

Analysis of Consumption and Demand Elasticities…..
1120
Table 21: Uncompensated own and cross price elasticities of food products: Rural Balochistan
(2005-06)
Demand for
Price of Beef Mutton Chicken Potato Tomato Karela Gram Dalcha Mash Masoor Bghee
Beef -0.6086 -0.0397 -0.0276 -0.02232 -0.005 -0.0237 0.003 -0.0178 -0.0182 0.0007 0.00832
Mutton -0.0312 -0.5328 -0.013 -0.00088 -0.00179 -0.0286 -0.0071 -0.0197 0.0019 -0.0185 -0.008
Chicken -0.0471 0.0046 -0.628 0.02217 0.02636 -0.057 -0.0076 -0.0145 -0.0021 -0.0084 -0.0014
Potato 0.05855 -0.4731 -0.1499 -0.4922 -0.04102 -0.1442 -0.0452 -0.0687 -0.0065 -0.1435 -0.0218
Tomato -0.023 -0.0467 0.00422 0.05041 -0.5299 -0.073 -0.018 -0.0913 0.0099 -0.0602 -0.0127
Karela -0.0162 -0.0251 0.00521 -0.04971 -0.00801 -0.569 0.0284 0.0066 0.019 0.0046 0.00908
Gram -0.0175 -0.0086 -0.0123 0.00856 0.03085 0.0149 -0.326 -0.0076 -0.0446 -0.0118 0.00113
Dacha -0.0222 0.0032 -0.0037 -0.00263 -0.01086 -0.0733 -0.0045 -0.565 -0.0565 -0.0356 -0.0147
Mash 0.02867 0.0544 0.00592 0.00058 0.01943 -0.0814 0.0073 -0.0275 -0.517 -0.0102 0.01192
Masoor 0.01532 -0.0129 -0.0024 -0.01945 0.01225 -0.0001 -0.0254 -0.0473 -0.0492 -0.3869 -0.0093
Bghee -0.0382 -0.0105 -0.0223 -0.0691 0.00572 -0.0758 -0.0875 -0.0597 -0.0612 -0.0662 -0.0447
Source: Computed by authors based on HIES data of Pakistan for the year 2005-06.
Table 22: Uncompensated own and cross price elasticities of food products: Rural Balochistan
(2005-06)
Demand for
Price of Wheat Rice Otcereal Dalcha Mash Moong Masoor Bghee
Wheat -0.5179 0.2286 -0.365 0.09424 0.16477 0.1305 -0.0061 -0.0179
Rice -0.0715 -0.6381 0.18339 -0.08275 -0.03884 -0.0917 -0.0653 0.0101
Otcereal 0.01218 0.1338 -11.288 0.02199 0.0069 0.0228 0.0038 0.0067
Dalcha -0.0193 0.0074 -0.0799 -0.53408 -0.06605 -0.0501 -0.0497 -0.021
Mash 0.01927 -0.1568 0.12177 -0.03463 -0.45136 -0.0291 -0.0189 0.0115
Moong 0.00843 -0.0055 0.15136 -0.07843 -0.08991 -0.5633 -0.0392 -0.0079
Masoor -0.0096 -0.0656 -0.0707 -0.05166 -0.05349 -0.027 -0.3227 -0.0119
Bghee -0.0007 -0.0279 0.04045 0.00035 0.00542 -0.0146 -0.0298 -0.8115
Source: Computed by authors based on HIES data of Pakistan for the year 2005-06.
Table 23: Compensated own and cross price elasticities of food products: Rural Balochistan
(2005-06)
Demand for
Price of Milk Butter Sugar Glucose Tea Biscuits
Milk -0.59099 0.302514 -0.00853 0.106166 0.033728 0.030188
Butter -0.23991 -7.82688 0.00093 0.157944 0.037372 0.010012
Sugar -0.09712 0.167388 -0.66726 -0.31158 0.052199 0.236399
Glucose 0.056299 0.079904 -0.0025 -19.6167 0.000104 0.186713
Tea 0.172932 0.304221 0.061864 0.16471 -1.23105 0.069922
Biscuits -0.02968 -0.13647 0.043979 0.051152 -0.00779 -2.17842
Source: Computed by authors based on HIES data of Pakistan for the year 2005-06.

International Journal of Asian Social Science, 2(7), pp. 1103-1122.
1121
Table 24: Compensated own and cross price elasticities of food products: Rural Balochistan
(2005-06)
Demand for
Price of Beef Mutton Chicken Potato Tomato Karela Gram Dalcha Mash Masoor Bghee
Beef -0.593 -0.027 -0.0148 -0.0101 0.0094 -0.011 0.0147 -0.0044 -0.0058 0.01054 0.0251
Mutton -0.0153 -0.489 0.00028 0.01336 0.012 -0.017 0.0025 -0.0073 0.016 -0.0113 0.0062
Chicken -0.0313 0.0189 -0.5817 0.03895 0.0422 -0.047 0.0015 -0.0021 0.01087 -0.0006 0.013
Potato 0.07161 -0.492 -0.1522 -0.4134 -0.034 -0.143 -0.0434 -0.0642 0.00292 -0.1519 -0.013
Tomato -0.0181 -0.045 0.00886 0.06143 -0.483 -0.073 -0.0172 -0.0953 0.01528 -0.0638 -0.01
Karela -0.0093 -0.02 0.0119 -0.0502 -0.003 -0.538 0.0367 0.01331 0.02759 0.00898 0.0166
Gram -0.0158 -0.008 -0.012 0.01111 0.035 0.0171 -0.236 -0.0069 -0.0492 -0.0121 0.0027
Dacha -0.0196 0.0057 -0.0018 -0.0008 -0.01 -0.076 -0.0035 -0.5242 -0.0619 -0.0379 -0.014
Mash 0.03122 0.0599 0.00854 0.00275 0.0232 -0.084 0.0098 -0.0278 -0.4507 -0.0099 0.0154
Masoor 0.01703 -0.012 -0.0012 -0.0206 0.0148 0.0013 -0.0277 -0.05 -0.0544 -0.322 -0.009
Bghee 0.0457 0.0129 0.03002 0.00581 0.0184 0.0483 -0.004 0.02813 0.0368 -0.0083 -0.783
Source: Computed by authors based on HIES data of Pakistan for the year 2005-06.
Table 25: Compensated own and cross price elasticities of food products: Rural Balochistan
(2005-06)
Demand for
Price of Wheat Rice Otcereal Dalcha Mash Moong Masoor Bghee
Wheat -0.4311 0.3308 -0.2954 0.17437 0.2437 0.2142 0.0567 0.06688
Rice -0.0594 -0.623 0.19388 -0.0707 -0.027 -0.079 -0.0559 0.02285
Otcereal 0.01225 0.1339 -11.288 0.02209 0.007 0.0229 0.0038 0.00675
Dalcha -0.017 0.0103 -0.0779 -0.5318 -0.064 -0.048 -0.0479 -0.0186
Mash 0.02164 -0.154 0.12367 -0.0324 -0.449 -0.027 -0.0172 0.01381
Moong 0.01107 -0.002 0.15351 -0.076 -0.087 -0.561 -0.0372 -0.0053
Masoor -0.008 -0.064 -0.0694 -0.0502 -0.052 -0.025 -0.3216 -0.0104
Bghee 0.03252 0.0121 0.06772 0.03171 0.0363 0.0181 -0.0052 -0.7784
Source: Computed by authors based on HIES data of Pakistan for the year 2005-06.
Conclusions and Policy Implications
This study attempts to estimate and report
households consumption and demand
elasticities in detail. This is one of the first
studies in developing countries particularly in
Pakistan to take into account adult equivalent scales in households’ consumption patterns.
The study is based upon household data
related to Household Integrated Expenditure
Survey (HIES) for the year 2005-06. The cross
sectional data especially in their disaggregated
form are far richer than time series data. The
cross sectional survey, by definition, collect
data from households. The households have
different income or total expenditure and
demographic information. The important
contribution of this study is that it covers the
least developed province of Pakistan that is
Balochistan and both its urban and rural
regions. The study has constructed adult
equivalent scale at first stage. The SPSS
package has been used in order to arrange the
data. The significance of adult equivalent
scales are supported by the estimated Engel
Curve of food items particularly. The
graphical representations have been obtained
in the case of consumption-expenditure
relationships. The consumption-expenditure
relationships show that per adult equivalent households food consumption is increasing at
a decreasing rate. According to the findings of
the current study, all food items are treated as
necessities except vegetable ghee in the case
of urban and rural Balochistan. It is treated as
luxury. The estimated food items demand

Analysis of Consumption and Demand Elasticities…..
1122
elasticities with respect to price and
expenditure may be used by government
policy makers of Balochistan, WFP (World
Food Programme) and other local and
international NGOs for household food
programs. The province of Balochistan is the most poorly-developed and a food-insecure
region in Pakistan. All socio-economic indices
like literacy, health, and unemployment are
below national averages. The expenditure
elasticities of food items suggest that the
nutritional requirements will get improved
with the easy availability of food items. It can
be done through the food support programs
like food program of WFP and Benazir
Income Support Program. The policy makers
can get further assistance from the findings of
this study while targeting households’ decisions.
References
Ahmad, Ludlow and Stern (1988) “Demand
response in Pakistan: A modification of the
Linear Expenditure System for 1976” Pakistan
Development Review Vol. XXVII, No.3,
pp.293-10.
Ahmed, U.A. and Shams,Y., (1994)
“Demand elasticities in rural Bangladesh: An application of the AIDS model” Bangladesh
Development Studies Vol. XXII, No.1, pp 1-
25.
Akhtar and Burney (1990) “Fuel demand
elasticities in Pakistan: An Analysis of
households’ expenditure on fuel using micro
data” Pakistan Development Review Vol. 29,
No.2, pp.155-174.
Alderman (1988) “Estimates of consumer
price response in Pakistan using market prices
data” Pakistan Development Review Vol.
XXVII, No.2, pp.89-107. Burney and Khan (1991) “Household
consumption patterns in Pakistan: An urban-
rural consumption using micro data” Pakistan
Development Review Vol.30, No.2, pp.145-
171.
Deaton & Muelbauer (1980a) “An almost
Ideal Demand System” American Economic
Review Vol.70, No.3, pp.312-326.
Deaton & Muelbauer (1980) “Economics and
consumer behavior” Cambridge University
Press: Cambridge.
Eatzaz and Arshad (2007) “Household
budget analysis for Pakistan under varying the
parameter approach” PIDE working paper
2007: 41.
Ercelawn, A.(1991) “Undernourishment as
poverty in Pakistan: Are there regional differences in the risk of hunger” Applied
Economics Research Centre, University of
Karachi. Discussion paper, No.148.
Haroon and Iqbal (1992) “Regional
differences in consumption behavior in
Pakistan” Pakistan Economic & Social Review
Vol. XXX, pp. 95- 108.
Iqbal, R. and Jamal, H., (1992) “Regional
differences in consumption behavior in
Pakistan” Pakistan Economic & Social Review
Vol. XXX, No. 2, pp.95-108.
Malik and Sawar (1993) “Some tests for differences in consumption patterns: The
impact of remittances using household income
and expenditure survey data of Pakistan 1987-
88” Pakistan Development Review Vol. 32,
No.4, pp.699-711.
Malik,S.,(1982) “The analysis of consumption
pattern in Pakistan” Pakistan Economic &
Social Review Vol. 20, No.2, pp.1108-122.
Malik, S. and Aziz, B., (2006) “Surmising
consumer demand system and structural
changes using time series data for Pakistan” The Pakistan Economic & Social Review
Vol.XLIV, No.1, pp. 117 -136.
Mukhtar. H., (1985) “Essays in consumer
behavior: Evidence from Pakistan data”
Unpublished Phd thesis of Boston University
Graduate School (1998). Also available in the
AERC, University of Karachi’s Library.
Nutritional compositions of demographic
compositions table published by the Planning
Division (1985).
Ray, R., (1980) “An analysis of a time series
of household expenditure survey for India” Review of Economics and Statistics Vol.60,
No.4, pp.595-602.
Siddiqui, R. (1982) “An analysis of
consumption pattern in Pakistan” Pakistan
Development Review Vol.21, No.4, pp.232-
296.
Stone J.N.R., (1953) “The measurement of
consumers’ expenditure and behavior in the
United Kingdom, 1920-1938” Cambridge:
Cambridge University Press.