
Online Nation: Five Years of Growth in Online Learning · Online Nation Five Years of Growth in...
31
Online Nation I. Elaine Allen and Jeff Seaman Five Years of Growth in Online Learning
Transcript of Online Nation: Five Years of Growth in Online Learning · Online Nation Five Years of Growth in...

Online Nation I. Elaine Allen and Jeff Seaman
Five Years of Growth in Online Learning
Online Nation Five Years of Growth in Online Learning
I. Elaine Allen, Ph.D. Associate Professor of Statistics & Entrepreneurship
Co-Director, Babson Survey Research Group Babson College
Jeff Seaman, Ph.D. Chief Information Officer, Survey Director
The Sloan Consortium Olin and Babson Colleges
Co-Director, Babson Survey Research Group Babson College
October 2007

Neither this book nor any part maybe reproduced or transmitted in any form or by any means, electronic or mechanical, including photocopying, microfilming, and recording, or by any information storage or retrieval system, without prior permission in writing from the publisher. The consent of the Sloan Consortium (Sloan-C) does not extend to copying for general distribution, for promotion, for creating new works, or for resale. Specific permission must be obtained in writing from Sloan-C for such copying. Direct all inquiries to Sloan-C, at Olin Way, Needham, MA 02492-1200, or to [email protected].
Printed in the United States of America 9 8 7 6 5 4 3 2 1
Copyright ©2007 by Sloan-C™ All rights reserved. Published 2007

Contents
Executive Summary ......................................................................................................................... 1
How Many Students are Learning Online? ................................................................................... 1
Where has the Growth in Online Learning Occurred? ................................................................... 1
Why do Institutions Provide Online Offerings? ............................................................................. 2
What are the Prospects for Future Online Enrollment Growth? ...................................................... 2
What are the Barriers to Widespread Adoption of Online Education? ............................................ 3
What is Online Learning? ................................................................................................................. 4
Detailed Survey Findings ................................................................................................................. 5
How Many Students are Learning Online? ....................................................................................5
Online Enrollment Growth – The Big Picture ................................................................................ 6
Online Enrollments – The Details ................................................................................................ 7
The Online Learning Landscape: Online Learning Framework ...................................................... 8
Online Learning Framework Compared to Previous Results ......................................................... 11
Patterns of Enrollment Growth ................................................................................................. 12
Future Online Enrollment Growth .............................................................................................. 15
In for the Long term? ................................................................................................................ 16
Why Online? ............................................................................................................................ 17
Barriers to Widespread Adoption of Online Learning ................................................................. 18
Survey Methodology ..................................................................................................................... 22
Appendix – Additional Tables and Charts ........................................................................................ 23
Partner Organizations ................................................................................................................... 25

1
Executive Summary
Online Nation: Five Years of Growth in Online Learning represents the fifth annual report on the state of online learning in U.S. higher education. This year’s study, like those for the previous four years, is aimed at answering some of the fundamental questions about the nature and extent of online education. Supported by the Alfred P. Sloan Foundation and based on responses from more than 2,500 colleges and universities, the study addresses the following key questions:
How Many Students are Learning Online?
Background: For the past several years, online enrollments have been growing substantially faster than overall higher education enrollments. The expectation of academic leaders has been that these enrollments would continue their substantial growth for at least another year. Do the measured enrollments match these lofty expectations?
The evidence: Online enrollments have continued to grow at rates far in excess of the total higher education student population, albeit at slower rates than for previous years.
• Almost 3.5 million students were taking at least one online course during the fall 2006 term; a nearly 10 percent increase over the number reported the previous year.
• The 9.7 percent growth rate for online enrollments far exceeds the 1.5 percent growth of the overall higher education student population.
• Nearly twenty percent of all U.S. higher education students were taking at least one online course in the fall of 2006.
Where has the Growth in Online Learning Occurred?
Background: Earlier studies in this series have demonstrated that not all institutions of higher education are equally enthusiastic about online education. It can be expected, therefore, that the long-term growth rates for online enrollments will differ by type of institution.
The evidence: Virtually all types of institutions of higher education have shown substantial growth, but with some clear leaders.
• Two-year associate’s institutions have the highest growth rates and account for over one-half of all online enrollments for the last five years.
• Baccalaureate institutions began the period with the fewest online enrollments and have had the lowest rates of growth.
2
Why do Institutions Provide Online Offerings?
Background: The growth of online enrollments has been abundantly clear. Less clear, however, is why colleges and universities are moving to online. What specific objectives do they hope to achieve through their online courses and programs?
The evidence: Improving student access is the most often cited objective for online courses and programs. Cost reduction is not seen as important.
• All types of institutions cite improved student access as their top reason for offering online courses and programs.
• Institutions that are the most engaged in online education cite increasing the rate of degree completion as a very important objective; this is not as important for institutions that are not as engaged in online learning.
• Online is not seen as a way to lower costs; reduced or contained costs are among the least-cited objectives for online education.
• The appeal of online instruction to non-traditional students is indicated by the high number of institutions which cite growth in continuing and/or professional education as an objective for their online offerings.
What are the Prospects for Future Online Enrollment Growth?
Background: Compound annual enrollment growth rates of over twenty percent are not sustainable. The demand for online among potential students is finite, as is the ability of institutions to grow existing offerings or add new ones. Where can we expect the additional growth to occur?
The evidence: Approximately one-third of higher education institutions account for three-quarters of all online enrolments. Future growth will come predominately from these and similar institutions as they add new programs and grow existing ones.
• Much of the past growth in online enrollments has been fueled by new institutions entering the online learning arena. This transition is now nearing its end; most institutions that plan to offer online education are already doing so.
• A large majority (69 percent) of academic leaders believe that student demand for online learning is still growing.
• Virtually all (83 percent) institutions with online offerings expect their online enrollments to increase over the coming year.
• Future growth in online enrollments will most likely come from those institutions that are currently the most engaged; they enroll the most online learning students and have the highest expectations for growth.

3
What are the Barriers to Widespread Adoption of Online
Education?
Background: Previous studies in this series have shown that academic leaders have consistently commented that their faculty often do not accept the value of online learning and that it takes more time and effort to teach an online course. To what extent do these leaders see these and other issues as critical barriers to the widespread adoption of online learning?
The evidence: Identification of the most important barriers differs widely between those with online offerings and those who do not offer any. Current results replicate our previous studies in identifying faculty acceptance and the need for more discipline on the part of students as the most common concerns.
• Academic leaders cite the need for more discipline on the part of online students as the most critical barrier, matching the results of last year’s survey.
• Faculty acceptance of online instruction remains a key issue. Those institutions most engaged in online do not believe it is a concern for their own campus, but do see it as a barrier to more wide-spread adoption of online education.
• Higher costs for online development and delivery are seen as barriers among those who are planning online offerings, but not among those who have online offerings.
• Academic leaders do not believe that there is a lack of acceptance of online degrees by potential employers.

4
What is Online Learning?
The focus of this report is online education. To maintain consistency with previous work, we have applied the same definitions used in our four prior annual reports. These definitions were presented to the respondents at the beginning of the survey, and then repeated in the body of individual questions where appropriate.
Online courses, the primary focus of this report, are those in which at least 80 percent of the course content is delivered online. Face-to-face instruction includes those courses in which zero to 29 percent of the content is delivered online; this category includes both traditional and Web facilitated courses. The remaining alternative, blended (sometimes called hybrid) instruction is defined as having between 30 percent and 80 percent of the course content delivered online. While the survey asked respondents for information on all types of courses, the current report is devoted to online learning only.
While there is a great deal of diversity among course delivery methods used by individual instructors, the following is presented to illustrate the prototypical course classifications used in this study.
Proportion of Content
Delivered Online Type of Course Typical Description
0% Traditional Course with no online technology used —
content is delivered in writing or orally.
1 to 29% Web Facilitated
Course that uses web-based technology to facilitate what is essentially a face-to-face
course. Uses a course management system (CMS) or web pages to post the syllabus and
assignments, for example.
30 to 79% Blended/Hybrid
Course that blends online and face-to-face delivery. Substantial proportion of the content
is delivered online, typically uses online discussions, and typically has some face-to-
face meetings.
80+% Online A course where most or all of the content is
delivered online. Typically have no face-to-face meetings.
Schools may offer online learning in a variety of ways. The survey asked respondents to characterize their face-to-face, blended, and online learning by the level of the course (undergraduate, graduate, non-credit, etc.). Likewise, respondents were asked to characterize their face-to-face, blended, and online program offerings.

5
Detailed Survey Findings
How Many Students are Learning Online?
The number of students taking at least one online course continues to expand at a rate far in excess of the growth of overall higher education enrollments. The most recent estimate, for fall 2006, places this number at 3.48 million online students, an increase of 9.7 percent over the previous year. The number of online students has more than doubled in the four years since the first Sloan survey on online learning. The growth from 1.6 million students taking at least one online course in fall 2002 to the 3.48 million for fall 2006 represents a compound annual growth rate of 21.5 percent. The size of the entire higher education student body has grown at an annual rate of around 1.5 percent during this same period (from 16.6 million in fall 2002 to 17.6 million for fall 2006 - Projections of Education Statistics to 2015, National Center for Education Statistics). As the following table illustrates, students taking at least one online course now represent almost 20 percent of total enrollments in higher education.
More than two-thirds of all higher education institutions now have some form of online offerings, with the majority of these providing programs that are fully online. The distribution of institutions offering online programs and courses or only courses has not changed significantly over the past year. The percentage of institutions offering fully online programs grew from 31 percent to 35 percent, those with no online offerings dropped from 37 percent to 34 percent, while those offering online courses but no online programs remained constant at 31 percent. The number of new institutions entering the online learning arena had definitely slowed; most institutions that plan to offer online education are now doing so.
Total and Online Enrollment in Degree-granting Postsecondary Institutions – Fall 2002
through Fall 2006
Total Enrollment
Annual Growth Rate
Total Enrollment
Students Taking at Least One Online
Course
Annual Growth Rate Online Enrollment
Online Enrollment as a Percent of Total
Enrollment
Fall 2002 16,611,710 NA 1,602,970 NA 9.7%
Fall 2003 16,900,479 1.7% 1,971,397 23.0% 11.7%
Fall 2004 17,272,043 2.2% 2,329,783 18.2% 13.5%
Fall 2005 17,428,500 0.9% 3,180,050 36.5% 18.2%
Fall 2006 17,647,720 1.3% 3,488,381 9.7% 19.8%
Online Programs
Online Courses Only
No Online Offerings
0%
5%
10%
15%
20%
25%
30%
35%
40%
45%
50%
2005 2006
Online Course and Program Offerings -
Fall 2005 and Fall 2006

6
Online Enrollment Growth – The Big Picture
Over the five year period of the survey, the number of students taking at least one online course has more than doubled. Where has this growth occurred? Are all types of institutions equally represented among those with growing online enrollments, or are the gains concentrated in a few types of institutions?
Our previous reports have consistently shown that the largest institutions command the greatest numbers of online enrollments. Beginning in fall 2002, where nearly 600,000 of the 1.6 million online students were at the largest (over 15,000 total enrollment)
colleges and universities, the pattern has been repeated each year. The most recent data shows no exception; the largest institutions now have nearly 1.4 million online students, representing a compound annual growth rate of 24.1 percent for the four-year period. Interestingly, however, this growth rate is matched by the smaller schools; they began the period with smaller numbers, but grew at the same overall rate as the largest institutions. Only the mid-sized schools (3000 to 7499 total enrollments) have lagged in growth compared to the largest institutions, and even these institutions have posted substantial compound annual growth rates.
We do not observe the same consistently high growth rates when we examine the results by type of institution. Two-year associate’s institutions provide the largest share of online enrollments, with more online students at these institutions than all other types
combined. This pattern has remained consistent over the entire four year period. Growth rates for these associate’s institutions have exceeded those of all the other institution types, and they now command over 54 percent of all online enrollments in U.S. higher education. Baccalaureate institutions, on the other hand, present a very different picture. In 2002 they included only a small portion (8 percent) of online enrollments and have grown at the slowest rate. These institutions now enroll less than five percent of the online student population. All other institution types have displayed growth rates that are only
Four-year Growth in Students Taking at Least One Online Course –
Fall Term
Online
Enrollment Fall 2002
Online Enrollment Fall 2006
Increase Fall 2002 to
Fall 2006
Compound Annual
Growth Rate
Under 1500 100,984 217,445 116,461 21.1%
1500 to 2999 135,715 332,840 197,125 25.1%
3000 to 7499 385,812 742,415 356,602 17.8%
7500 to 14999 394,337 807,700 413,363 19.6%
15000+ 586,122 1,387,982 801,860 24.1%
Four-year Growth in Students Taking at Least One Online Course –
Fall Term
Online
Enrollment Fall 2002
Online Enrollment Fall 2006
Increase Fall 2002 to
Fall 2006
Compound Annual
Growth Rate
Doctoral/Research 258,489 566,725 308,236 21.7%
Master’s 335,703 686,337 350,634 19.6%
Baccalaureate 130,677 170,754 40,077 6.9%
Associate’s 806,391 1,904,296 1,097,905 24.0%
Specialized 71,710 160,268 88,558 22.3%

7
slightly below those of the associate’s institutions, maintaining a relatively steady proportion of online enrollments.
Public institutions have consistently led the way in online enrollments for every survey year. Each public institution with online offerings teaches, on average, close to 1,400 online students — a number which far outpaces that for private, for-profit and private, nonprofit institutions. For-profit institutions with online offerings have begun to close this gap, increasing nearly five-fold in the average number of students enrolled at each institution over the four years. Among all institutions with online offerings, however, the average online enrollment at a public institution is still nearly three times that of a for-profit online enrollment.
Online Enrollments – The Details
Our survey indicates that more than 86 percent of those studying online are undergraduates, which exactly matches the proportion of undergraduates in the overall
higher education student body (Digest of Education Statistics: 2006, National Center for Education Statistics). Over 62 percent of these undergraduates are taking courses at associate’s institutions, who teach close to 55 percent of online students at all levels (both numbers are well above the 37 percent of the overall higher education enrollment that these institutions represent — Digest of Education Statistics: 2006, National Center for Education Statistics). Traditional baccalaureate institutions contribute a very small proportion to the online undergraduate population.
The largest institutions teach the greatest number of online students, as they have consistently for each survey year. This is due not only to their size, but also because these institutions were early adopters of online education and have continued to expand over a longer period of time.
Students Taking at Least One Online Course – Fall 2006
Under 1500
1500–2999
3000–7499
7500–14999
15000+
Undergraduate 177,567 281,671 656,203 729,695 1,161,817
Graduate 24,051 32,738 71,936 76,368 206,803
Other For-Credit 15,827 18,430 14,275 1,637 19,362
Mean Number of Students Taking
at Least One Online Course – Fall
2002 and Fall 2006
Fall 2002 Fall 2006
Public 861 1,371
Private, nonprofit 179 267
Private, for-profit 108 472
Students Taking at Least One Online
Course – Fall 2006
Doctoral/Research 566,725
Master’s 686,337
Baccalaureate 170,754
Associate’s 1,904,296
Specialized 160,268

8
When online enrollments are examined by student type and institutional size, it is clear that undergraduate students at large institutions are by far the most numerous group. Each of the largest institutions teaches, on average, considerably more online students than institutions of any other size. The average number of online students per institution shows the expected very strong positive correlation to the size of the institution. While the pattern is true for both undergraduate and graduate-level online enrollments, the slope of the lines in the accompanying figure demonstrates that the relationship is much stronger among the undergraduate population.
The Online Learning Landscape: Online Learning Framework
The survey reports in this series have provided ample evidence that not all institutions see online education in the same way. Some believe it to be critical for their long-term survival, others see it as a short-term means of boosting current enrollments, and still others as something that goes against the very nature of what they are trying to achieve at their institution. Examining the patterns over time of opinions, practice, and enrollments by the control (public/private) of the school, the size of the institution, and the Carnegie classification has allowed us to obtain a better understanding of the macro-level trends.
This approach still misses many of the important determinants of the variability in institutional approaches towards online education. We see, for example, that some small schools are very positive towards online learning while many others are not. Public schools continue to be in the lead among those embracing online education, but not all public institutions are equally positive. In an effort to probe these issues, this year we have classified all higher education institutions into a five-category online learning framework based on their adoption of, and strategic view towards, online education.
Under 1500 1500 – 2999 3000 – 7499 7500 – 14999 15000 +0
500
1,000
1,500
2,000
2,500
3,000
Undergraduate
Graduate
Other For-Credit
Mean Online Enrollment by Size of Institution - Fall 2006

9
The online learning framework categories are:
• Not Interested. Institutions which do not have any online offerings and do not believe that online is important to their long-term strategy. As a group they have the most negative view towards online.
• Non-Strategic Online. Institutions which have some online offerings, but do not believe that online education is an important part of their long-term strategy. Their online offerings tend to be outside of core areas (e.g., a few courses in their continuing education program).
• Not Yet Engaged. Institutions which do not yet have any online offerings but cite online as a critical long-term strategy for their institution. It can be expected from their view of online that they intend to provide some form of online offering in the future.
• Engaged. Institutions which currently have online offerings and believe that online is critical to the long-term strategy of their organization. These institutions, however, have not yet included online education in their formal strategic plan.
• Fully Engaged. Institutions which have online offerings that they state are strategic for their institution and which have fully incorporated online education into their formal long-term plan.
Institutions in each of these categories have very different attitudes towards online learning, utilize different approaches to the possible provision of online offerings, and can be expected to provide very different components of the future growth in online enrollments. By tracking the behavior and attitudes of institutions in each of these groups, and marking transitions as institutions move from one online framework category to another, we hope to get a better idea about the future directions for online learning in U.S. higher education.
Examining each of the categories in turn:
Not Interested. These institutions represent about 18 percent of all U.S. degree-granting postsecondary institutions (800), but are mostly smaller institutions, providing only 5.5 percent of all higher education enrollments. They do not have any online offerings and do not believe that online learning is important to their long-term strategy. As a group, they have the most negative view towards online instruction, with only 3.7 percent saying that their faculty accept the value and legitimacy of online education and 44 percent disagreeing with the statement that online degrees have the same level of respect as face-to-face degrees.
Non-Strategic Online. About 1,000 institutions (or 23 percent of all higher educational institutions) have online offerings but do not believe that online education is important to their long-term strategy. They enroll slightly more than 5 million total students (27 percent of higher education enrollments). In contrast, their online enrollments of 350,000 represent only 10 percent of all online students for fall 2006.
Non-Strategic online institutions are less likely to have a fully online program (32 percent compared to 54 percent for all institutions with online offerings), and they are also more likely to report negative faculty attitudes. Only 8 percent report that their faculty accept the value and legitimacy of online education compared to a rate of 27 percent for all of higher education and 39 percent among those with any online offerings. About one-half of

10
these institutions expect their online enrollment to grow in the coming year (compared to three-quarters of all those with online), and they are the only group containing any members who expect their online enrollments to decrease (9 percent, compared to virtually none among other institutions with online offerings). They are also the least likely to believe that overall online demand is growing (44 percent versus 70 percent among all schools and 77 percent among those with any online offerings).
Not Yet Engaged. This is a small group of institutions (5 percent, or around 250 total institutions) which do not yet have any online offerings, but cite online as a critical long-term strategy for their institution. Most of these institutions are small and their total enrollments account for only slightly more than one percent of all higher education enrollments. These institutions are twice as likely to be concerned about the costs of online as other institutions with 31 percent citing costs to develop online and 42 percent citing cost to deliver online as barriers. Concern with online retention is also much higher in this group than in any other group of institutions. They are, however, much more likely to believe that their faculty accept online education (44 percent) than either those with no online or those with non-strategic online.
Engaged. A sizable set of institutions (around 800, or 18 percent of all higher education institutions) currently have online offerings and believe that online is critical to the long-term strategy of their organization. However, these institutions have not yet included online education in their formal strategic plan. They represent about 23 percent of all higher education enrollments (about 4.5 million students) with 17 percent of online enrollments for fall 2006. These institutions hold opinions towards online that mirror those of the overall higher education universe on such aspects as faculty acceptance (33 percent agreeing for both this group and all institutions) and equal level of respect for online versus face-to-face degrees (27 percent agreement for both this group and all institutions). Nearly one-half (46 percent) of these institutions have at least one fully online program, 89 percent believe that overall demand for online is growing, and 86 percent believe that their own online enrollments will grow over the next year.
Fully Engaged. Slightly more than one-third (35 percent) of all higher education institutions (around 1,500 total) are fully engaged in online education. They believe that their online offerings are strategic for their institution and they have fully incorporated online into their formal long-term plan. Not surprisingly, they also have the most extensive online offerings. Fully 69 percent have at least one completely online program. These schools enroll 43 percent of all higher education students but represent nearly three-quarters (73 percent) of all online students in fall 2006. As a group, these institutions are the most positive towards online, with far more favorable opinions on such topics as faculty acceptance of the value and legitimacy of online education (62 percent agreement compared to 33 percent nationally), equivalent level of respect for online versus face-to-face degrees (53 percent compared to 27 percent nationally) and belief in the growth of student demand for online learning (94 percent compared to 70 percent nationally). They also have the highest expectations of their own online enrollment growth, with 87 percent expecting their online enrollment to increase over the coming year. As a group, these institutions are larger, have positive opinions of online, provide extensive online offerings, and have very high expectations for growth in their online enrollments.
11
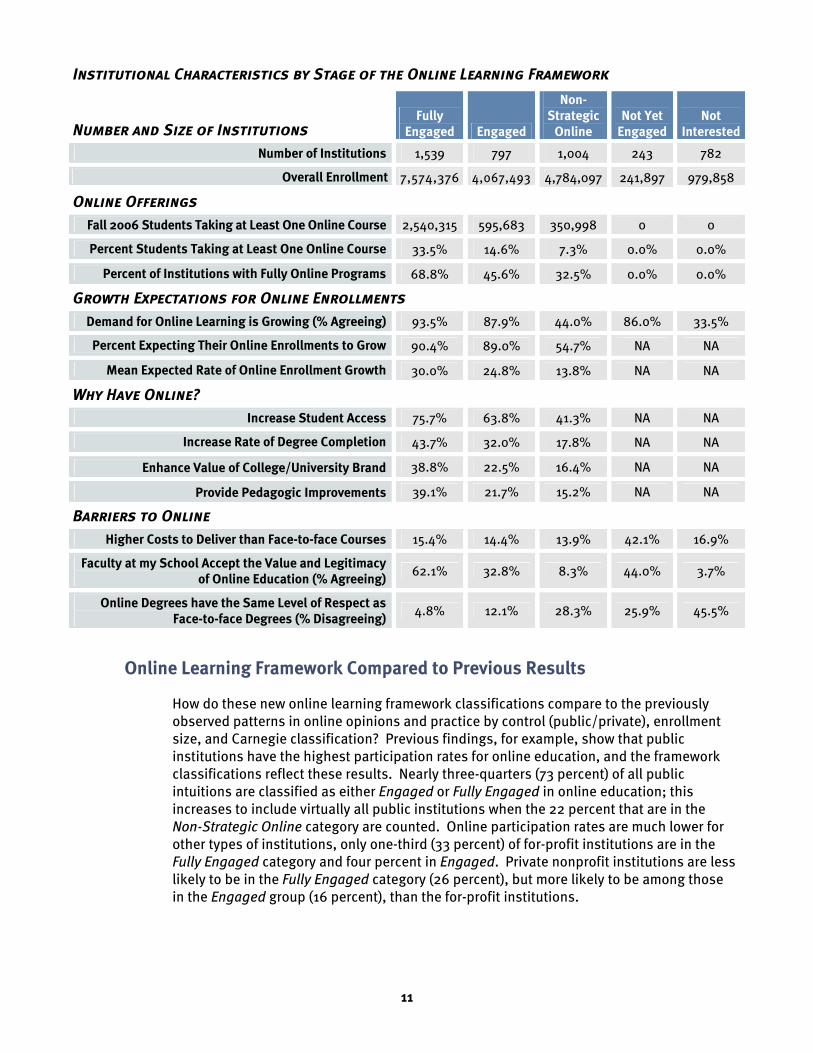
Institutional Characteristics by Stage of the Online Learning Framework
Number and Size of Institutions
Fully Engaged Engaged
Non-Strategic
Online Not Yet
EngagedNot
Interested
Number of Institutions 1,539 797 1,004 243 782
Overall Enrollment 7,574,376 4,067,493 4,784,097 241,897 979,858
Online Offerings
Fall 2006 Students Taking at Least One Online Course 2,540,315 595,683 350,998 0 0
Percent Students Taking at Least One Online Course 33.5% 14.6% 7.3% 0.0% 0.0%
Percent of Institutions with Fully Online Programs 68.8% 45.6% 32.5% 0.0% 0.0%
Growth Expectations for Online Enrollments
Demand for Online Learning is Growing (% Agreeing) 93.5% 87.9% 44.0% 86.0% 33.5%
Percent Expecting Their Online Enrollments to Grow 90.4% 89.0% 54.7% NA NA
Mean Expected Rate of Online Enrollment Growth 30.0% 24.8% 13.8% NA NA
Why Have Online?
Increase Student Access 75.7% 63.8% 41.3% NA NA
Increase Rate of Degree Completion 43.7% 32.0% 17.8% NA NA
Enhance Value of College/University Brand 38.8% 22.5% 16.4% NA NA
Provide Pedagogic Improvements 39.1% 21.7% 15.2% NA NA
Barriers to Online
Higher Costs to Deliver than Face-to-face Courses 15.4% 14.4% 13.9% 42.1% 16.9%
Faculty at my School Accept the Value and Legitimacy of Online Education (% Agreeing)
62.1% 32.8% 8.3% 44.0% 3.7%
Online Degrees have the Same Level of Respect as Face-to-face Degrees (% Disagreeing)
4.8% 12.1% 28.3% 25.9% 45.5%
Online Learning Framework Compared to Previous Results
How do these new online learning framework classifications compare to the previously observed patterns in online opinions and practice by control (public/private), enrollment size, and Carnegie classification? Previous findings, for example, show that public institutions have the highest participation rates for online education, and the framework classifications reflect these results. Nearly three-quarters (73 percent) of all public intuitions are classified as either Engaged or Fully Engaged in online education; this increases to include virtually all public institutions when the 22 percent that are in the Non-Strategic Online category are counted. Online participation rates are much lower for other types of institutions, only one-third (33 percent) of for-profit institutions are in the Fully Engaged category and four percent in Engaged. Private nonprofit institutions are less likely to be in the Fully Engaged category (26 percent), but more likely to be among those in the Engaged group (16 percent), than the for-profit institutions.

12
As might be expected from earlier findings, the proportion of associate’s schools that are in the Fully Engaged online learning framework category is the highest of all Carnegie classifications (42 percent) and the proportion in either of the engaged classifications is highest as well (62 percent). Master’s or doctoral/research institutions have lower rates of being Engaged or Fully Engaged, and are much more likely to be involved non-strategically with online education. As expected, baccalaureate institutions are the least represented among those that are Engaged or Fully Engaged in online education.
Previous patterns showing that it is the largest institutions that have the most extensive online offerings are replicated here as well. Among institutions in the three largest size classifications (those with overall enrollments of greater than 3,000), two-thirds are classified in one of the two engaged categories. Over 90 percent of all institutions with greater than 3,000 total enrollments are classified into one of the three online framework categories that provide online instruction, with nearly all (99 percent) of the very largest (over 15,000 enrollment) so classified. The smallest institutions are the least likely to be in one of the classifications with online offerings (58 percent) or one of the two engaged classifications (38 percent).
Patterns of Enrollment Growth
This year’s survey addressed the perceptions of academic leaders for future growth in online enrollments through two different sets of questions. In one, academic leaders were asked if they believed that student demand for online learning was growing. The question was addressed to all academic leaders and solicited their opinion as to the overall online demand, not the demand at their specific institution. A second question, addressed only to those with online offerings, queried academic leaders on their expectation for the potential growth of their own institution’s online enrollments over the coming year.
Part of the reason for an expectation of continued growth in online education is the perception by chief academic officers that there is considerable and growing student demand for online courses and programs. About 70 percent of these academic leaders (including those at schools with no online offerings) believe that student demand is growing, and only 8 percent disagree with this statement. For any given institutional type (public/private designation, Carnegie class, or school size), a majority of all chief academic officers agree that student demand is growing. This is true even at baccalaureate institutions (56 percent agreement), which have been the least positive towards online learning.
Student Demand for Online
Learning is Growing
Agree 69.9%
Neutral 22.0%
Disagree 8.1%
Student Demand for Online Learning is Growing – Fall 2006
Public Private
nonprofit Private for-
profit
Percent Agreeing 80.1% 60.9% 67.1%
Doctoral/ Research Master’s Baccalaureate Associate’s Specialized
Percent Agreeing 67.1% 72.7% 55.7% 77.9% 58.9%
Under 1500 1500–2999 3000–7499 7500–14999 15000+
Percent Agreeing 65.5% 63.7% 77.5% 77.3% 80.4%
13
When examined by the online learning framework, some important differences between institutions become evident. The level of agreement with the notion of growing student demand is much higher for institutions where online education is part of their strategic mission and for institutions that plan to offer online courses or programs in the future. However, the majority of schools in all categories are in agreement or neutral – and the perception is pervasive that the overall demand for online instruction is growing.
Student Demand for Online Learning is Growing – Fall 2006
Fully Engaged Engaged
Non-Strategic
Online Not Yet
Engaged Not
Interested
Agree 93.5% 87.9% 44.0% 86.0% 33.5%
Neutral 5.4% 12.1% 35.8% 14.0% 49.1%
Disagree 1.0% 0.0% 20.2% 0.0% 17.4%
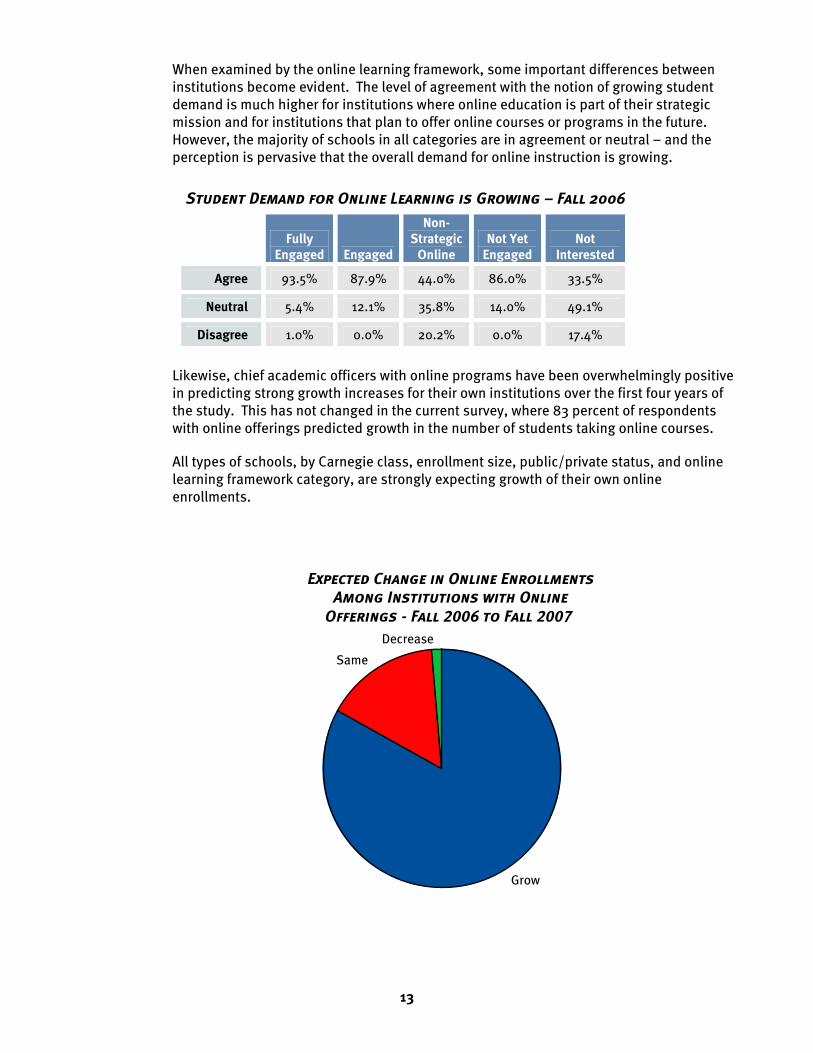
Likewise, chief academic officers with online programs have been overwhelmingly positive in predicting strong growth increases for their own institutions over the first four years of the study. This has not changed in the current survey, where 83 percent of respondents with online offerings predicted growth in the number of students taking online courses.
All types of schools, by Carnegie class, enrollment size, public/private status, and online learning framework category, are strongly expecting growth of their own online enrollments.
Grow
Same
Decrease
Expected Change in Online Enrollments
Among Institutions with Online
Offerings - Fall 2006 to Fall 2007

14
Institutions with Online Offerings Expecting Their Online Enrollments to
Increase – Fall 2006
Public Private
nonprofit Private for-
profit
Expecting Increase 87.8% 76.7% 85.7%
Doctoral/ Research Master’s Baccalaureate Associate’s Specialized
Expecting Increase 87.5% 84.0% 75.6% 87.8% 75.3%
Under 1500 1500–2999 3000–7499 7500–14999 15000+
Expecting Increase 77.4% 82.2% 87.7% 90.4% 91.0%
Fully Engaged Engaged Non-Strategic
Online
Expecting Increase 90.4% 89.0% 54.7%
Those institutions predicting the strongest growth are identical to those that have already produced the greatest growth over the last four years: public institutions, associate’s institutions, large institutions, and schools that are already fully engaged in online education with a strategic mission and long-term plan that includes online education. Even for schools with no identified strategic mission for online education, more than half (55 percent) believe that their number of online students will grow over the next year.
Predictions of online enrollment growth have not changed greatly over time, with all types of Carnegie classes predicting growth almost uniformly from 2002 through 2006. Given that the predictions are for continued growth, it appears that the rate of growth may have slowed but online enrollment has not yet reached a plateau.
B
B
B
B
B
J
JJ
J
J
HH
H
H
H
FF
F F
F
33
3
3
3
Fall 2002 Fall 2003 Fall 2004 Fall 2005 Fall 20060%
10%
20%
30%
40%
50%
60%
70%
80%
90%
100%
B Doctoral/Research
J Master’s
H Baccalaureate
F Associate’s
3 Specialized
Institutions with Online Offerings Expecting Their
Online Enrollments to Increase - Fall 2002 to Fall 2006

15
Future Online Enrollment Growth
Online enrollments have grown at an unprecedented rate over the five-year period examined by the Sloan online learning reports. The number of students taking at least one online course has more than doubled during the study period. Such a high level of growth will not be sustainable forever. The number of potential online students is finite, and at some point the ability of colleges and universities to add and expand online courses and programs will be reached. At what point will this growth begin to abate?
The extraordinary growth in online enrollments has been fueled by two factors:
• New institutions entering the field by introducing their first online offerings;
• Institutions with existing online offerings introducing new online courses and programs and growing their existing online courses and programs.
Examining these factors in turn, the results for the past year show that the number of institutions providing online offerings has remained relatively stable. There has been a small increase in the proportion of institutions with online offerings, but this growth is quite modest. The rapid increase in the number of institutions entering the field is nearing the end of its natural progression. Less than one-quarter of all higher education institutions did not have some form of online offering for fall 2006. Of these roughly 1,000 institutions, three-quarters say that they do not believe online is a critical to their long-term strategy. These institutions, in general, have a negative opinion of online education, so we can expect that few of them will decide to add online offerings in the near future.
The remaining one-quarter of the institutions without online offerings claim that online is a part of their long-term strategy, so we can expect them to be much more likely to enter the realm of those with online offerings. These Not Yet Engaged institutions, however, can be expected to add little to the overall online enrollment numbers. As a group they are very small, representing only one percent of all higher education enrollments. They are also the most likely to see substantial barriers to the growth of online education. These two factors suggest that not all of these schools will move quickly to provide online offerings, and even if they do, the total number of new online students will remain very small. In short, while the number of institutions that provide online offerings can be expected to continue to grow, the number of new online students these represent will be a small fraction of the overall online enrollment.
The majority of the recent growth in online enrollments has come from the schools that are the most engaged in online education as they add new courses and programs and grow their existing offerings. Fully Engaged and Engaged institutions are larger and more established, so they are in a better position to 'scale up' their online offerings and contribute a larger proportion to overall growth, whereas Non-Strategic Online institutions are more likely to start small if they do change their strategic approach, thus they will contribute a smaller proportion to overall growth. Also, past survey results indicate that the proportion of institutions that see online education as critical to their long-term strategy has increased by only a few percentage points per year. If this trend were to continue, we would expect only a small number of institutions switching from Non-Strategic Online to Engaged in the next year. Since this would represent only a few percent of the current number of institutions already engaged in online learning, their contribution to enrollment growth is likely to be relatively small. Online enrollments will reach a steady state when the proportion of courses and programs at institutions that believe that online is already part of their long-term strategy reaches its limit.

16
In for the Long Term?
The proportion of academic leaders reporting online as part of their long-term strategy continued its small but steady increase. For online education to continue its rapid growth, it must be perceived as important by the chief academic officers who are planning tomorrow’s educational offerings. For the fifth year, chief academic officers were asked to rate their level of agreement with the statement that online education is critical to the long-term strategy of their school. The response trend shows a slow but continual increase in the proportion of chief academic officers who agree with this statement, growing a few percentage points a year from 48.8 percent the first year to 59.1 percent this year.
Online Education is Critical to the Long-term Strategy
of my Institution – Fall 2002 to Fall 2006
Fall 2002 Fall 2003 Fall 2004 Fall 2005 Fall 2006
Agree 48.8% 53.5% 56.0% 58.4% 59.1%
Neutral 38.1% 33.7% 30.9% 27.4% 27.4%
Disagree 13.1% 12.9% 13.1% 14.2% 13.5%
Almost all types and sizes of institutions show a steady increase in the importance of online education to their long-term strategy. The level of agreement is highest among associate’s schools (69 percent) and lowest for baccalaureate institutions (39 percent); a pattern that has been consistent for all five survey years. Public institutions have always been in the lead in adopting online education, with nearly three-quarters (74 percent) of them reporting that online education is critical for their long-term strategy. Private nonprofit institutions have lagged behind, but even among this group nearly one-half (49 percent) now report online as critical.
B B
BB
B
JJ
JJ J
H
H
H
H
H
Fall 2002 Fall 2003 Fall 2004 Fall 2005 Fall 20060%
10%
20%
30%
40%
50%
60%
70%
80%
90%
100%
B Public
J Private not-for-profit
H Private for-profit
Online Education is Critical to the Long-term Strategy of
my Institution (Percent Agreeing) - Fall 2002 to Fall 2006

17
Why Online?
Student access issues lead the reasons why institutions offer online courses and programs. Those institutions with online offerings, either courses or fully online programs, were asked to rate the importance of various factors in their decision to provide online offerings. Increasing student access was by far the most frequently cited reason for offering online courses, with 63 percent of institutions saying this was Very Important and an additional 30 percent rating it as Important. Another access-related issue, attracting students from outside the institution’s traditional service area, was the second most cited reason. More than one-half (53 percent) of all institutions said this was Very Important to their decision and 28 percent said it was Important. Several other factors were cited as Very Important or Important by at least two-thirds of respondents, including growth in continuing/professional education, increasing degree completion rates, enhancing the institution’s brand value, and providing pedagogic improvements.
Strategic partnerships with other institutions, reduction of costs, and enhancing alumni and donor outreach were the least-cited of the potential reasons for engaging in online education.
Enhance Alumni and Donor Outreach
Reduce or Contain Costs
Increase Strategic Partnerships with Other Institutions
Improve Enrollment Management Responsiveness
Optimize Physical Plant Utilization
Increase the Diversity of Student Body
Strengthen Academic Continuity in Case of Disaster
Improve Student Retention
Provide Pedagogic Improvements
Enhance Value of College/University Brand
Increase Rate of Degree Completion
Grow Continuing and/or Professional Education
Attract Students from Outside Traditional Service Area
Increase Student Access
0% 20% 40% 60% 80% 100%
Not Important Somewhat Important Important Very Important
Online Education is Strategically Important for my Institution - Fall 2006

18
Online Education is Strategically Important for my Institution (Percent
responding Very Important) – Fall 2006
Fully
Engaged Engaged
Non-Strategic
Online
Increase Student Access 75.7% 63.8% 41.3%
Attract Students from Outside Traditional Service Area 62.6% 57.3% 33.7%
Grow Continuing and/or Professional Education 47.1% 34.1% 34.0%
Increase Rate of Degree Completion 43.7% 32.0% 17.8%
Enhance Value of College/University Brand 38.8% 22.5% 16.4%
Provide Pedagogic Improvements 39.1% 21.7% 15.2%
Improve Student Retention 35.6% 23.0% 12.5%
Strengthen Academic Continuity in Case of Disaster 30.7% 19.3% 17.8%
Increase the Diversity of Student Body 30.0% 22.7% 14.2%
Optimize Physical Plant Utilization 26.8% 20.4% 15.6%
Improve Enrollment Management Responsiveness 27.4% 21.3% 9.9%
Increase Strategic Partnerships with Other Institutions 28.4% 15.4% 10.1%
Reduce or Contain Costs 23.9% 16.1% 10.8%
Enhance Alumni and Donor Outreach 16.7% 10.5% 5.1%
The more engaged an institution is with online learning, the more likely it was to cite access issues as Very Important to its decision and the more likely it was to rate multiple factors as Very Important. Over three-quarters of the Fully Engaged institutions listed increased student access as Very Important to their decision. This is about 12 percent higher than the engaged institutions and well above the result for those with non-strategic online offerings (41 percent).
Barriers to Widespread Adoption of Online Learning
The online learning reports in this series track the opinions of chief academic officers, knowing that they have the primary responsibility for the conduct and planning of each school’s academic offerings. Many of these academic leaders are very positive about a number of aspects of online education, including a belief that students are at least as satisfied with online instruction as they are with face-to-face classes, evaluating the quality of online instruction is no more difficult than for face-to-face, and an increasing majority view the quality of online education as the same or better than face-to-face instruction. These positive responses have been coupled with a number of concerns as well, including concerns that teaching online takes more time and effort than teaching face-to-face courses, that students need more discipline to succeed in online courses, and that many of their faculty have yet to accept the value of online instruction.
Faculty acceptance of online education has been consistently cited as an important issue for academic leaders since the first survey. Results from this year show no significant changes to this trend. Only one-in-three academic leaders (33 percent) currently believe their faculty “accept the value and legitimacy of online education.” There has been little

19
change in acceptance over the course of the research (28 percent in 2002, 31 percent in 2004, and 28 percent in 2005).
Faculty at My School Accept the Value and Legitimacy
of Online Education – Fall 2002 to Fall 2006
Fall 2002 Fall 2004 Fall 2005 Fall 2006
Agree 27.6% 30.4% 27.6% 32.9%
Neutral 65.1% 59.3% 57.8% 56.1%
Disagree 27.6% 10.3% 14.7% 11.0%
The real differences in the view by chief academic officers of their faculty’s acceptance of online are evident when we examine the response by category of online learning framework. There is a great degree of acceptance (62 percent) among those institutions that are already fully engaged in online education. It is unclear from this data whether the institution’s status as Fully Engaged is the result of the more positive attitudes of their faculty members, or if it is the experience with online that convinces the faculty of its worth over time. Fewer than four percent of institutions classified as Not Interested towards online learning report that their faculty accept online; they also have the largest proportion (36 percent) who disagree with this statement.
Faculty at My School Accept the Value and Legitimacy of
Online Education – Fall 2006
Fully Engaged Engaged
Non-Strategic
Online Not Yet
Engaged Not
Interested
Agree 62.1% 32.8% 8.3% 44.0% 3.7%
Neutral 37.9% 62.1% 77.9% 47.7% 60.2%
Disagree 0.0% 5.1% 13.9% 8.2% 36.1%
The very low level of agreement (8 percent) among those institutions with non-strategic online may be an important reason why these institutions do not see online as an important long-term strategy. Conversely, the Not Yet Engaged institutions which say online is strategic, but have not yet implemented online courses or programs, are even more positive on this dimension (44 percent agreement) than institutions in the Engaged category. The lack of faculty acceptance of online education does not appear to be the reason why these institutions have not yet implemented online courses or programs.
A question often asked of online educators is whether online degrees are as good as those granted by face-to-face programs. Overall, only about one-in-five institutions disagrees with the statement that “online degrees have the same level of respect as face-to-face degrees.” About one-half are neutral, and the remaining portion (27 percent) agree with the statement. The expected pattern by institutional type is seen for this factor: Baccalaureate institutions are the most negative about the quality of the online degree and associate’s institutions are the most positive.

20
Online Degrees have the Same Level of Respect as Face-to-face Degrees –
Fall 2006
Doctoral/ Research
Master’s Baccalaureate Associate’s Specialized
Agree 22.0% 21.9% 14.9% 34.4% 28.1%
Neutral 55.7% 56.0% 42.2% 53.6% 53.2%
Disagree 22.4% 22.1% 42.9% 12.0% 18.7%
The greater an institution’s experience with online education, the more positive its attitude is towards the quality of an online degree. Those institutions that are Fully Engaged in online are very supportive of this idea, with fewer than 5 percent disagreeing, while those with no online offerings are the most negative.
Online Degrees have the Same Level of Respect as Face-to-
face Degrees – Fall 2006
Fully Engaged Engaged
Non-Strategic
Online Not Yet
Engaged Not
Interested
Agree 53.5% 26.8% 13.7% 5.0% 1.0%
Neutral 41.7% 61.1% 58.0% 69.0% 53.5%
Disagree 4.8% 12.1% 28.3% 25.9% 45.5%
Beginning with last year’s survey, respondents have been asked to rate the importance of possible barriers to the widespread adoption of online learning. The choices included issues identified by previous survey respondents, as well as questions about the potential
Lack of Acceptance of Online Degrees by Employers
Higher Costs to Deliver Online Courses
Higher Costs to Develop Online Courses
Lower Retention Rates in Online Courses
Lack of Acceptance of Online Instruction by Faculty
Students Need More Discipline in Online Courses
0% 20% 40% 60% 80% 100%
Not Important Somewhat Important Important Very Important
Barriers to Widespread Adoption of Online Learning - Fall 2006

21
demand and acceptance of online instruction. Last year, academic leaders of every institutional size and type cited “Students need more discipline to succeed in online courses” as the most important barrier to the widespread adoption of online learning. No other factor was close, with the next-most cited issue mentioned by fewer than half as many chief academic officers.
This year’s results confirm last year’s findings. “Students need more discipline to succeed in online courses” was cited as an Important or a Very Important barrier by over 80 percent of all academic leaders. The lack of acceptance by faculty was also cited as a potential barrier more frequently than other factors such as cost, retention, and acceptance by potential employers.
Barriers to Widespread Adoption of Online Learning (Percent responding Very Important) –
Fall 2006
Fully Engaged Engaged
Non-Strategic
Online Not Yet
Engaged Not
Interested
Students Need More Discipline in Online Courses 45.5% 37.5% 31.2% 53.3% 29.5%
Lack of Acceptance of Online Instruction by Faculty 23.3% 23.8% 24.1% 28.0% 25.2%
Lower Retention Rates in Online Courses 21.7% 21.2% 16.2% 32.1% 21.9%
Higher Costs to Develop Online Courses 17.6% 15.3% 19.7% 31.3% 19.0%
Higher Costs to Deliver Online Courses 15.4% 14.4% 13.9% 42.1% 16.9%
Lack of Acceptance of Online Degrees by Employers 14.5% 11.1% 6.9% 15.6% 12.1%
The level of concern with a number of potential barriers is greatest among those institutions that are classified as Not Yet Engaged on the online learning framework. These institutions report that online is an important part of their long-term strategy, but do not yet have any online offerings. As a group, they have the highest level of concern with every potential barrier; cost (both cost to develop online courses and the costs to deliver them), lower retention rates for online, acceptance of online degrees, that students need more discipline to succeed in online courses, and the level of acceptance of online instruction by faculty. It is not clear whether these are long-standing or more recent concerns, but survey responses suggest that these concerns are likely factors that have kept them from introducing any online offerings.

22
Survey Methodology
The sample for this analysis is composed of all active, degree-granting institutions of higher education in the United States that are open to the public.
The Babson Survey Research Group has entered into a data collection partnership with the College Board. The College Board now includes questions for this study of online learning as part of its extensive data collection effort for its Annual Survey of Colleges. Babson Survey Research Group and the College Board coordinate survey instruments and sample outreach; each respondent institution receives identically-worded questions, and those that have responded to one survey are not asked to respond to the same questions on the other.
All sample schools were sent an invitation email and multiple reminders, inviting their participation and assuring them that no individual responses would be released. All survey respondents were promised that they would be notified when the report was released and would receive a free copy.
The sample universe contains 4,491 institutions; a total of 2,535 responses were received, representing a 56.4 percent overall response rate. Of these, 2,504 responded to a sufficient number of questions to be included in this analysis (55.8 percent). These responses were merged with the data from the previous survey years (994 responses in 2003, 1,170 in 2004, 1,025 in 2005, and 2,251 in 2006) for examination of changes over time.
Institutional descriptive data come from the College Board Annual Survey of Colleges and from the Nation Center for Educational Statistics’ IPEDS database (http://nces.ed.gov/ipeds/). After the data were compiled and linked to the College Board Annual College Survey and to the IPEDS database, the responders and nonresponders were compared to create weights, if necessary, to ensure that the survey results reflected the characteristics of the entire population of schools. The responses are compared for 35 unique categories based on the 2005 Carnegie Classification of Institutions of Higher Education (http://www.carnegiefoundation.org/classifications/). These weights provided a small adjustment to the results allowing for inferences to be made about the entire population of active, degree-granting institutions of higher education in the United States.
23
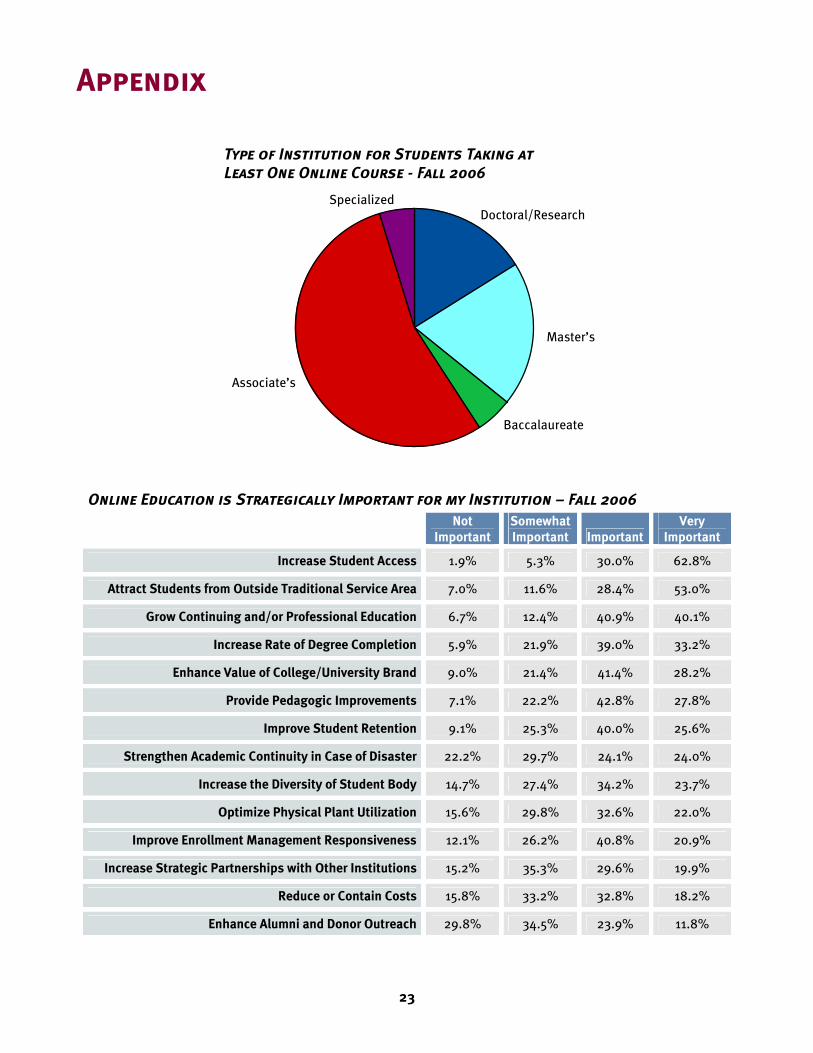
Appendix
Online Education is Strategically Important for my Institution – Fall 2006
Not
Important Somewhat Important Important
Very Important
Increase Student Access 1.9% 5.3% 30.0% 62.8%
Attract Students from Outside Traditional Service Area 7.0% 11.6% 28.4% 53.0%
Grow Continuing and/or Professional Education 6.7% 12.4% 40.9% 40.1%
Increase Rate of Degree Completion 5.9% 21.9% 39.0% 33.2%
Enhance Value of College/University Brand 9.0% 21.4% 41.4% 28.2%
Provide Pedagogic Improvements 7.1% 22.2% 42.8% 27.8%
Improve Student Retention 9.1% 25.3% 40.0% 25.6%
Strengthen Academic Continuity in Case of Disaster 22.2% 29.7% 24.1% 24.0%
Increase the Diversity of Student Body 14.7% 27.4% 34.2% 23.7%
Optimize Physical Plant Utilization 15.6% 29.8% 32.6% 22.0%
Improve Enrollment Management Responsiveness 12.1% 26.2% 40.8% 20.9%
Increase Strategic Partnerships with Other Institutions 15.2% 35.3% 29.6% 19.9%
Reduce or Contain Costs 15.8% 33.2% 32.8% 18.2%
Enhance Alumni and Donor Outreach 29.8% 34.5% 23.9% 11.8%
Doctoral/Research
Master’s
Baccalaureate
Associate’s
Specialized
Type of Institution for Students Taking at
Least One Online Course - Fall 2006

24
Online Education is Critical to the Long-
term Strategy of my Institution (Percent
Agreeing) – Fall 2002 to Fall 2006
Public Private
nonprofit Private for-
profit
Fall 2002 66.1% 34.0% 34.6%
Fall 2003 65.4% 36.6% 62.1%
Fall 2004 74.7% 43.8% 48.6%
Fall 2005 71.7% 46.9% 54.9%
Fall 2006 74.1% 48.6% 49.5%
Barriers to Widespread Adoption of Online Learning – Fall 2006
Not
Important Somewhat Important Important
Very Important
Students Need More Discipline in Online Courses 4.1% 15.4% 42.2% 38.3%
Lack of Acceptance of Online Instruction by Faculty 8.8% 30.2% 36.9% 24.2%
Lower Retention Rates in Online Courses 14.7% 29.2% 35.1% 21.0%
Higher Costs to Develop Online Courses 14.7% 29.4% 37.2% 18.7%
Higher Costs to Deliver Online Courses 18.3% 31.8% 33.3% 16.6%
Lack of Acceptance of Online Degrees by Employers 23.8% 36.6% 27.8% 11.7%
Under 1500
1500 – 2999
3000 – 7499
7500 – 14999
15000 +
0%
10%
20%
30%
40%
50%
60%
70%
80%
90%
100%
Online ProgramCourses Only
Online Offerings by Size of Institution - Fall 2006

25
Partner Organizations
Alfred P. Sloan Foundation The Alfred P. Sloan Foundation makes grants in science, technology and the quality of American life. It's Anytime, Anyplace Learning program seeks to make high quality learning, education and training available anytime and anywhere for those motivated to seek it. The program has paved the way for nearly 3.5 million learners nationwide to take online courses today. www.sloan.org
The College Board The College Board is a not-for-profit membership association whose mission is to connect students to college success and opportunity. Founded in 1900, the association is composed of more than 5,000 schools, colleges, universities, and other educational organizations. www.collegeboard.com
Southern Regional Education Board SREB, a nonprofit and nonpartisan organization based in Atlanta, Georgia, advises state education leaders on ways to improve education. SREB was created in 1948 by Southern governors and legislatures to help leaders in education and government work cooperatively to advance education and improve the social and economic life of the region. www.sreb.org
Midwestern Higher Education Compact Established in 1991 as an interstate compact agency, the Midwestern Higher Education Compact (MHEC) is charged with promoting interstate cooperation and resource sharing in higher education accomplishing this through three core functions: cost savings programs, student access and policy research. www.mhec.org
American Distance Education Consortium ADEC is a nonprofit distance education consortium composed of approximately 65 state universities and land-grant colleges. The consortium was conceived and developed to promote the creation and provision of high quality, economical distance education programs and services to diverse audiences through the most appropriate information technologies available. www.adec.edu
The Sloan Consortium The Sloan Consortium is the nation’s largest association of institutions and organizations committed to quality online education and administered through Babson College and Franklin W. Olin College of Engineering. www.sloan-c.org
Babson Survey Research Group The Babson Survey Research Group in the Arthur M. Blank Center for Entrepreneurial Research at Babson College conducts regional, national, and international research projects, including survey design, sampling methodology, data integrity, statistical analyses and reporting.

Data collection for this report was made possible by a grant from the Alfred P. Sloan Foundation. The Sloan Consortium (Sloan-C) acts as the publisher. In order to ensure objectivity, Sloan-C does not have editorial control over the survey design, data capture, data analysis, or presentation of the findings. The authors wish to thank the Sloan-C Publications Director, Kathryn M. Fife, for her efforts in improving the report, John Sener for his considerable editorial assistance and Sloan-C itself for its publication and distribution efforts. The cover design is by Mark Favazza (www.favazza.com), utilizing a graphic of North American city-to-city internet connections by Chris Harrison, Human-Computer Interaction Institute, Carnegie Mellon University (www.chrisharrison.net). The Sloan Consortium (Sloan-C) has its administrative home at Olin and Babson Colleges. For more information about Sloan-C, visit www.sloan-c.org. For more information about Olin and Babson Colleges, visit www.olin.edu and www.babson.edu.

Copyright ©2007 by Sloan-C TM
All rights reserved. Published 2007 US $29.95
Online Nation: Five Years of Growth in Online Learning represents the fifth annual report on the state of online learning in U.S. higher education. This year’s study, like those for the previous four years, is aimed at answering some of the fundamental questions about the nature and extent of online education. Supported by the Alfred P. Sloan Foundation and based on responses from over 2,500 colleges and universities, the study addresses the following key questions:
• How Many Students are Learning Online?
• Where has the Growth in Online Learning Been?
• Why do Institutions Provide Online Offerings?
• What are the Prospects for Future Online Enrollment Growth?
• What are the Barriers to Widespread Adoption of Online Education?
The survey analysis is based on a comprehensive nationwide sample of active, degree-granting institutions of higher education in the United States that are open to the public.
978-0-9766714-2-8


