Online Appendix - American Economic Association Appendix for Martin, Ralf, ... F Appendix References...
42
Online Appendix for Martin, Ralf, Mirabelle Mu ˆ uls, Laure B. de Preux and Ulrich J. Wagner. 2013. “Industry Compensation Under Relocation Risk: A Firm-level Analysis of the EU Emissions Trading Scheme” The American Economic Review, forthcoming. Contents A Background on the management interviews ii A.1 Interview practice .......................... ii A.2 Sample characteristics ........................ iii B Robustness of vulnerability score iv B.1 External consistency: Energy price regressions ........... iv B.2 Reliability of the vulnerability score: a regression discontinuity design xii C Computational appendix xviii C.1 Firm level allocation ......................... xviii C.2 Sector level allocation ........................ xx C.3 Further details on computation .................... xxi C.4 Dynamic programming using cake.ado ................ xxii D Output-based updating xxiv E Additional Tables and Figures xxviii F Appendix References xxx G Questionnaire xxxii i
Transcript of Online Appendix - American Economic Association Appendix for Martin, Ralf, ... F Appendix References...

Online Appendixfor Martin, Ralf, Mirabelle Muuls, Laure B. de Preux and Ulrich J. Wagner.2013. “Industry Compensation Under Relocation Risk: A Firm-level Analysis ofthe EU Emissions Trading Scheme” The American Economic Review, forthcoming.
Contents
A Background on the management interviews iiA.1 Interview practice . . . . . . . . . . . . . . . . . . . . . . . . . . iiA.2 Sample characteristics . . . . . . . . . . . . . . . . . . . . . . . . iii
B Robustness of vulnerability score ivB.1 External consistency: Energy price regressions . . . . . . . . . . . ivB.2 Reliability of the vulnerability score: a regression discontinuity design xii
C Computational appendix xviiiC.1 Firm level allocation . . . . . . . . . . . . . . . . . . . . . . . . . xviiiC.2 Sector level allocation . . . . . . . . . . . . . . . . . . . . . . . . xxC.3 Further details on computation . . . . . . . . . . . . . . . . . . . . xxiC.4 Dynamic programming using cake.ado . . . . . . . . . . . . . . . . xxii
D Output-based updating xxiv
E Additional Tables and Figures xxviii
F Appendix References xxx
G Questionnaire xxxii
i

A Background on the management interviews
A.1 Interview practiceInterviews were carried out by graduate and postgraduate students after they hadbeen trained. The interviewers were paid according to the number of interviewsconducted, encouraging them to do more interviews and discouraging any firmbackground research, thus preserving the double-blind nature of the survey. In-terviewers made “cold calls” to production facilities (not head offices), gave theirname and affiliation and then asked to be put through to the production or environ-mental manager. In the case of EU ETS firms, interviewers requested to speak tothe person responsible for the EU ETS. At this stage, the terms “survey” and “re-search” were avoided as both are associated with commercial market research andsome switchboard operators have instructions to reject such calls. Instead, we toldthem that we were doing “a piece of work” on climate change policies and their im-pact on competitiveness in the business sector and would like to have a conversationwith the manager best informed.
Once the manager was on the phone, the interviewer asked whether s/he wouldbe willing to have a conversation of about 40-45 minutes about these issues. De-pending on the manager’s willingness and availability to do so, an interview wasscheduled. If the manager refused, s/he was asked to provide the interviewer withanother knowledgeable contact at the firm who might be willing to comment. Man-agers who agreed to give an interview were sent an email with a letter in PDF formatto confirm the date and time of the interview and to provide background informa-tion and assure them of confidentiality. A similar letter was sent to managers whorequested additional information before scheduling an interview.
All interviewers worked on computers with an internet connection and usedVOIP software to conduct the interviews. They accessed a central interview databasevia a custom-built, secure web interface which included a scheduling tool and theinterview application which displayed the questions along with the scoring grid.The interview screen contained hyperlinks to a manual with background informa-tion on each question. Interviewers scored answers during the interview. For all in-terviews, the scheduling history as well as the exact time and date, duration, identityof interviewer, etc. were recorded. All interviews were conducted in the languageof the interviewee’s residence.
The interview format follows the design pioneered by Bloom and van Reenen(2007). This approach seeks to minimize cognitive bias by asking open-ended ques-tions and by delegating the task of scoring the answers to the interviewer. In addi-tion, a large sample size and interviewer rotation is exploited to control for possiblebias on the part of the interviewers by including interviewer fixed effects in regres-
ii

Table A.1: Interview response rates by country
Refused
Belgium 134 131 85 46 178 47 0.74France 141 140 92 48 238 98 0.59Germany 139 138 95 43 337 199 0.41Hungary 69 69 37 32 90 21 0.77Poland 78 78 57 21 140 62 0.56UK 209 205 63 142 468 264 0.44Total 770 761 429 332 1451 691 0.52
# of Interviews
# of Firms Interviewed
# of ETS Firms
Interviewed
# of Non ETS Firms
Interviewed
Total Firms Contacted
Response Rate
Notes: There are more interviews than interviewed firms as we conducted several interviews with different partners in a smallnumber of firms.
sion analyses. For further details, see Bloom and van Reenen (2010).
A.2 Sample characteristicsTable A.1 provides an overview of the number of interviews and the response ratesbroken down by country and by EU ETS participation status.1 The last columnshows the response rate i.e. the fraction of firms that were contacted and with whomwe successfully conducted an interview. These vary somewhat between differentcountries. For example, it is particularly low in Germany (38%) and the UK (40%),whereas in Belgium or Hungary, firms were more willing to participate (74% and78%, respectively). Generally, these figures are very high compared to responserates achieved in postal or online surveys.
It is important for the validity of our analysis to rule out possible selection biasin our sample. EU ETS firms are different from non-ETS firms, but within these twocategories, interviewed firms are not significantly different from non-interviewedfirms in regards to the most common characteristics available in ORBIS. This isshown in Panel A of Table A.2 where each of the principal firm characteristics avail-able from the ORBIS database (turnover, employment and capital) is regressed ona dummy variable indicating that a firm is part of the EU ETS, a dummy indicatingthat a firm was contacted, and a full set of sector and year dummies, with the resultthat the estimated coefficients are small and statistically insignificant. For the set offirms that either conceded or refused an interview, we ran analogous regressions to
1All analysts would first conduct interviews in the UK and only then go on to conduct interviewsin another country allowing a common reference, hence the larger number of interviews for thiscountry. This allows us to control for interviewer bias as discussed below and also for UK responsesto be used as a benchmark.
iii

Table A.2: Sample representativeness
(1) (2) (3)
TurnoverA. All firms Firm contacted -0.0322 -0.0794 0.172
(0.0786) (0.0611) (0.108) EU ETS firm 2.031*** 1.452*** 2.530***
(0.095) (0.080) (0.145) Number of observations 118,874 107,830 113,771 Number of firms 12,322 12,921 118,874 R-squared 0.511 0.364 12322B. Contacted firms Firm granted interview -0.0983 -0.0373 0.0443
(0.118) (0.0957) (0.150) EU ETS firm 2.044*** 1.547*** 2.540***
(0.124) (0.107) (0.160) Number of observations 26,114 23,933 25,815 Number of firms 1,373 1,420 1,297 R-squared 0.659 0.589 0.618
Employment Capital
Notes: Regressions in panel A are based on the set of manufacturing firms with more than 50 employees contained in ORBIS for the six countries covered by the survey. Each column shows the results from a regression of the ORBIS variable given in the column head on a dummy variable indicating whether a firm was contacted or not and a dummy variable indicating whether a firm was taking part in the EU ETS at the time of the interviewing. Panel B shows analogous regressions for the set of contacted companies and with an indicator for whether an interview was granted. All regressions are by OLS and include country dummies, year dummies and 3-digit sector dummies. Standard errors are clustered at the firm level and are robust to heteroskedasticity and autocorrelation of unknown form.* significant at 10%; ** significant at 5%; *** significant at 1%.
estimate an intercept specific to firms that granted us an interview. The results inPanel B of Table A.2 show that none of these intercepts is statistically significant.We thus conclude that our sample is representative of the underlying population ofmedium-sized manufacturing firms in the six European countries covered by ourstudy.
B Robustness of vulnerability score
B.1 External consistency: Energy price regressionsWe compile data on firm-level employment, wages and energy prices in Europeanand OECD countries for the years from 1999 until 2007. Table B.1 summarizes thedata.
iv

Figure A.1: Distribution of vulnerability score by country and industry
0 20 40 60 80 100
UK(194)
Poland(74)
Hungary(68)
Germany(131)
France(136)
Belgium(122)
0 .2 .4 .6 .8 1
Wood & Paper(88)Wholesale(5)Vehicles(47)
Textile & Leather(20)TV Communication(11)
Publishing(19)Other Minerals(8)
Other Business Services(3)Other Basic Metals(9)
Machinery & Optics(68)Iron & Steel(39)
Glass(29)Furniture & NEC(17)
Fuels(14)Food & Tobacco(106)Fabricated Metals(45)
Construction(3)Chemical & Plastic(118)
Ceramics(13)Cement(63)
1 2 3 4 5
Notes: Bar charts show the distribution of the vulnerability score by country (left) and by 3-digit NACE sector (right). Thescore ranges from 1 (no impact) to 5 (complete relocation). A score of 3 is given if at least 10% of production or employmentwould be outsourced in response to future carbon pricing. The number of observations in each country and industry is givenin parenthesis. NEC: Not elsewhere classified.
v

Table A.3: Firm characteristics by ETS participation status
ETS Firms non ETS FirmsMean Mean
Firm Age (years) * 40 37 409 33 37 327 Turnover (EUR million) ** 725.73 3,611.50 398 146.42 767.93 298 Number of employees ** 1,418 5,092 394 469 857 305 EBIT (EUR million) ** 26.12 100.54 391 5.22 23.47 292 Number of shareholders 2 5 429 3 5 332 Number of subsidiaries 6 32 429 2 5 332Firm's Global Ultimate Owner Turnover (USD million) 31,695 67,080 142 12,464 21,980 99 Number of employees 50,012 71,864 131 42,381 73,834 95
Std. Dev. Obs. Std. Dev. Obs.
Notes: Based on 2007 data. Stars next to a variable name indicate that the respective means for ETS and non ETS firms aresignificantly different at the 10% (*), 5% (**), and 1% (***) levels.
Employment Our sample covers all firms contained in the ORBIS database whichhave 10 or more employees in at least one year during the sample period. In addi-tion to employment, this source also provides industry codes at the 3-digit NACElevel. The EU sample includes Austria, Belgium, Czech Republic, Finland, France,Germany, Hungary, Italy, Netherlands, Poland, Portugal, Romania, Slovakia, Spain,Sweden and the United Kingdom. In addition to those countries, the OECD sampleincludes Canada, Mexico, Japan, Switzerland, and the United States of America,but not Romania.
Energy prices Price data for electricity, gas, liquid and solid fuels comes from the‘Energy Prices and Taxes database’ maintained by the International Energy Agency(2009). To ensure comparability of prices across fuels, we adjust for net calorificvalue using prices in US$ per ton of oil equivalent (TOE). For each country c andyear t, we compute the energy price in sector s as
EPDcst =
(∑e
ωes ln(pe
ct)
)(B.1)
where pect is the price of fuel e ∈{electricity, gas, liquid fuel, solid fuel} and ωe
s isthe expenditure share of fuel e in sector s. Since expenditure shares are not availablefor all countries in the sample, we impute them using UK data at the 3-digit NACEcode taken from the Quarterly Fuels Inquiry data maintained by the UK Officefor National Statistics (2004). We hold these shares fixed at their 2004 values –
vi

Table A.4: Descriptive statistics of the vulnerability score
Mean Min P25 Median P75 Max FirmsOverall vulnerability score 1.87 1.29 1 1 1 3 5 725A. by countryBelgium 1.69 1.13 1 1 1 3 5 122France 2.07 1.34 1 1 1 3 5 136Germany 2.12 1.58 1 1 1 3 5 131Hungary 1.50 0.95 1 1 1 2 4 68Poland 2.03 1.40 1 1 1 3 5 74UK 1.75 1.12 1 1 1 3 5 194B. by 3-digit sectorCement 2.33 1.52 1 1 1 4 5 63Ceramics 2.15 1.46 1 1 1 3 5 13Chemical & Plastic 1.86 1.26 1 1 1 3 5 118Construction 1.00 0.00 1 1 1 1 1 3Fabricated Metals 1.67 0.93 1 1 1 3 4 45Food & Tobacco 1.56 1.01 1 1 1 2 5 106Fuels 2.71 1.59 1 1 3 4 5 14Furniture & NEC 1.47 0.87 1 1 1 2 4 17Glass 2.76 1.57 1 1 3 4 5 29Iron & Steel 2.69 1.56 1 1 3 4 5 39Machinery & Optics 1.26 0.68 1 1 1 1 4 68Other Basic Metals 1.78 1.39 1 1 1 2 5 9Other Business Services 2.67 0.58 2 2 3 3 3 3Other Minerals 3.38 1.69 1 2 4 5 5 8Publishing 1.58 1.02 1 1 1 2 4 19TV Communication 1.91 1.45 1 1 1 3 5 11Textile & Leather 1.90 1.33 1 1 1 3 5 20Vehicles 1.62 0.99 1 1 1 2 4 47Wholesale 1.40 0.89 1 1 1 1 3 5Wood & Paper 1.85 1.36 1 1 1 3 5 88
Standard deviation
Notes: Summary statistics of the overall vulnerability score (first row), by country (panel A) and by 3-digit NACE sector(panel B). The score ranges from 1 (no impact) to 5 (complete relocation). A score of 3 is given if at least 10% of productionof employment would be outsourced in response to future carbon pricing. NEC: Not elsewhere classified.
vii

Table A.5: Differences in vulnerability score by sector and country
(1) (2)
Deviations from the overall meanA. CountriesBelgium -0.034 0.054France 0.361 ** 0.322 *Germany 0.032 0.021Hungary -0.402 * -0.378Poland 0.311 0.013United Kingdom -0.269 -0.0323-digit Sector controls no yes
B. SectorsCeramics -0.011 -0.010Cement 0.379 ** 0.382 ** Chemical & Plastic -0.168 -0.171Fabricated Metals -0.268 * -0.272 * Food & Tobacco -0.474 *** -0.474 ***Fuels 0.563 0.566Furniture & NEC -0.584 *** -0.583 ***Glass 0.752 *** 0.752 ***Iron & Steel 0.703 *** 0.697 ***Machinery & Optics -0.731 *** -0.733 ***Other Basic Metals -0.284 ** -0.287Other Minerals 1.278 ** 1.285 ** Publishing -0.415 * -0.413 * Textile & Leather -0.130 -0.125TV & Communication -0.028 -0.025Vehicles -0.434 *** -0.447 ***Wood & Paper -0.149 -0.147Employment control no yesObservations 725 725
Notes: Reported coefficients represent the deviation of a country/sector’s intercept from the overall mean vulnerability score.Panel A is based on a regression of the vulnerability score on country dummies with additional controls for interview noiseand 3-digit sector (column 2). Panel B is based on a regression of the vulnerability score on broadly defined sector dummieswith additional controls for interview noise and employment (column 2). The asterisks indicate statistical significance ofa t-test of equality of the country/sector’s intercept and the overall mean (* p<0.1, ** p<0.05, *** p<0.01). NEC: Notelsewhere classified.
viii

Table B.1: Descriptive statistics: Employment, energy prices and wages
Mean Min P25 Median P75 Max A. OECDEmployment 120 542 1 20 39 93 86,607log(employment) 3.87 1.14 0.00 3.00 3.66 4.53 11.37Δlog(employment) 0.01 0.23 -1.99 -0.05 0.00 0.06 2.00
6.28 0.47 4.87 5.92 6.27 6.64 7.846.15 0.31 5.17 5.93 6.15 6.38 7.100.13 0.36 -0.73 -0.16 -0.01 0.50 1.05
ΔRelative energy price 0.00 0.08 -0.30 -0.06 -0.01 0.05 0.490.00 0.08 -0.50 -0.05 0.00 0.04 5.190.03 0.14 -0.28 -0.06 0.04 0.10 0.68
-0.03 0.14 -0.81 -0.05 -0.02 0.03 5.36ΔRelative wage -0.02 0.13 -4.69 -0.04 -0.02 0.00 0.72Firms: 113,680 (Observations: 464,272)
B. EuropeEmployment 117 546 1 19 37 86 86,607log(employment) 3.81 1.15 0.00 2.94 3.61 4.45 11.37Δlog(employment) 0.01 0.24 -1.99 -0.05 0.00 0.07 2.00
6.23 0.47 4.87 5.89 6.17 6.52 7.846.14 0.31 5.17 5.92 6.14 6.37 7.100.09 0.36 -0.73 -0.17 -0.04 0.41 1.05
ΔRelative energy price 0.02 0.08 -0.30 -0.04 0.00 0.07 0.490.00 0.09 -0.65 -0.05 0.00 0.05 5.190.03 0.15 -0.27 -0.06 0.04 0.10 0.68
-0.03 0.15 -0.81 -0.04 -0.02 0.03 5.36ΔRelative wage -0.01 0.14 -4.69 -0.03 -0.02 0.00 0.72Firms: 94,398 (Observations: 396,182)
Standard deviation
Domestic EP index [EPD]Foreign EP index [EPF]Relative energy price [EPD-EPF]
Domestic wage index [WD]Foreign wage index [WF]Relative wage [WageD-WageF]
Domestic EP index [EPD]Foreign EP index [EPF]Relative energy price [EPD-EPF]
Domestic wage index [WD]Foreign wage index [WF]Relative wage [WageD-WageF]
Notes: The sectoral energy price (EPD) is the average of the logarithmic prices of different fuel categories, weighted bythe sector’s expenditure shares for each category in the UK in 2004. The domestic wage index is the logarithmic changein the wage against its level in 2004. Foreign EP and wage indices are the averages of all foreign EP and wage variables,respectively, inversely weighted by the geographical distance to the foreign country. ∆ stands for the first time difference(t-(t-1)) of a variable.
the latest year for which we have this information – in order to avoid the issue ofendogenous changes in fuel expenditures.
In order to account for energy price variation in the other countries, we calculatea sectoral index of foreign energy prices as the average of the energy price indices(EPD) in all countries j other than c, inversely weighted by their geographical dis-tance dc j to country c:
EPFcst = ∑
j 6=cEPD
jst
(d−1
c j
∑k 6=c d−1ck
)(B.2)
Finally, we define the energy price differential between home and foreign countries
ix

asEPcst ≡ EPD
cst−EPFcst (B.3)
Wages Wages at the 2-digit industry level, Wcst , are taken from the LABORSTAdatabase maintained by the International Labor Organization (1997-2008). Notethat wage data are reported on different scales (e.g. monthly, hourly) by the differentsectors. This is however not an issue as we take the logarithmic measure of wagesand control for sectoral trends in the regressions. We construct an index of foreignwages for each country c and sector s in year t as
W Fcst = ∑
j 6=clnWjst
(d−1
c j
∑k 6=c d−1ck
)(B.4)
and define the difference between local and foreign wages as
Wcst ≡W Dcst−W F
cst . (B.5)
Vulnerable sectors We want to assess the ability of the VS measure to identifyfirms that are at risk of relocation. Since we do not have firm-level VS for the entireORBIS sample, we compute the employment-weighted average VS for each (3-digitlevel) sector in the interview sample. We examine the relationship between VS andthe price elasticities of employment using 3 types of interactions. Firstly, we inter-act the price variables (energy and wages) with an above-median indicator variable(I{V Ss > q(50)}). This group is referred to as “High VS”. Secondly, we interactthe price variables with the deviation from the mean VS (V Ss−V S). Finally, we re-estimate the first specification but interact the price variables also with indicators ofthe second and fourth quartiles of the VS distribution, i.e. I{q(25)<V Ss < q(50)}and I{q(75)<V Ss}. The coefficients on these variables tell us if price elasticitiesof employment vary significantly between the quartiles on either side of the median.
Estimation We estimate equations of the form
lisct = βllisct−1 +βPEPsct−1 +βWWsct−1
+∑X∈XXs
(βXPEPsct−1 +βXWWsct−1
)+αct +αstt +αi + εit
(B.6)
x

Table B.2: Dynamic Panel Regressions of (log) employment
(1) (2) (3) (4) (5) (6)
EmploymentOECD European Union
0.966*** 0.966*** 0.966*** 0.950*** 0.949*** 0.950***(0.006) (0.006) (0.006) (0.007) (0.007) (0.006)
0.046*** 0.038** 0.040** 0.089*** 0.072*** 0.080***(0.018) (0.018) (0.017) (0.016) (0.016) (0.016)
-0.019*** -0.017*** -0.026*** -0.025***(0.004) (0.005) (0.004) (0.005)
-0.007*** -0.009***(0.002) (0.002)
-0.008 -0.006(0.006) (0.006)-0.006 -0.002(0.005) (0.005)
-0.022*** -0.022*** -0.021*** -0.012** -0.012** -0.012**(0.006) (0.006) (0.006) (0.006) (0.006) (0.006)
-0.001** 0.001 0.003 0.009***(0.000) (0.001) (0.002) (0.003)
-0.001*** -0.001(0.000) (0.001)
-0.001 -0.003(0.001) (0.003)
-0.003*** -0.012***(0.001) (0.002)
yes yes yes yes yes yesyes yes yes yes yes yes
Firms 113,680 113,680 113,680 94,398 94,398 94,398Observations 464,272 464,272 464,272 396,182 396,182 396,182
Employmentt-1
Relative energy price [EPD-EPF]
× High VS [3rd & 4th VS quartiles]
× VS-mean(VS)
× 2nd VS quartile
× 4th VS quartile
Relative wage (WD-WF)
× High VS [3rd & 4th VS quartiles]
× (VS-mean(VS))
× 2nd VS quartile
× 4th VS quartile
Country-by-year effectsSector trends
Notes: The dependent variable is the firm employment measured on a logarithmic scale. The vulnerability score (VS) isthe sectoral employment-weighted vulnerability score, and the quartiles are defined on the panel sample. All regressions areimplemented with the System GMM by Blundell and Bond which includes a level and a differenced equation with laggeddifferences and twice-lagged levels of the endogenous variables as instruments. Robust standard errors, clustered at the firmlevel, are in parentheses. Asterisks indicate statistical significance at the 10%(*), 5%(**) and 1%(***) level.
xi

where l is the logarithmic employment, X contains different sets of variables de-rived from the sectoral VS,2 αct is a country-by-year effect, αst captures a sectorspecific trend and αi is a firm fixed effect. Following Blundell and Bond (1998), weestimate a system of equation (B.6) in levels and first differences with differencesof the explanatory variables and lagged levels, respectively, as instruments. Thesystem GMM estimator is necessary in our case as its less restrictive alternative,the Arellano-Bond estimator, is susceptible to a severe weak instrument bias giventhe high auto-correlation coefficient βl that we find below. In Table B.3 we alsoreport OLS estimates of equation (B.6) (i.e. abstracting from firm fixed effects)which leaves our key qualitative results on energy prices intact.
In addition to the energy price elasticities reported in Table 2 in the main text,Table B.2 reports the coefficients on wages as well as an additional specification incolumns 3 and 6 where we interact the price coefficients with four VS quartile bandindicators. The effects of energy prices in the second and fourth quartiles are notstatistically significant, which supports the more parsimonious specification withthe High VS dummy that we report in main text.
In all specifications, employment responds negatively to an increase in relativewages, which is in line with expectations. There is some evidence of negative inter-actions with the VS measures, yet the pattern is less robust than the one found forenergy prices. For the EU sample, for instance, we find a non-monotone relation-ship in column 6 where the third quartile is less responsive than the fourth quartile.Of course there is no reason why we should expect a particular pattern for wagesin terms of VS. Finally, the OLS estimates of energy prices elasticities reported inTable B.3 lead to comparable results, although the coefficients on the endogenouswage variable naturally look less plausible.
B.2 Reliability of the vulnerability score: a regression disconti-nuity design
This section performs an additional test of the reliability of the vulnerability score(VS). The score is based on the interviewees’ assessment of their reaction to car-bon pricing policies until 2020, when assuming that they would not receive anypermits for free. This is a counterfactual scenario because the manufacturing firmswe interviewed could expect to receive part of their emission permits for free underthe benchmarking rule, or receive even more permits for free if they were consid-ered to be at risk of carbon leakage. The criteria and thresholds for determining
2In the first specification, X = {I{q(50)<V Ss}} = High V S, in the second specifica-tion X = {V S−mean(V S}} , and in the last specification X = {I{q(50)<V Ss < q(100)} ,I{q(25)<V Ss < q(50)}, I{q(75)<V Ss}}.
xii

Table B.3: OLS Regressions of (log) employment
(1) (2) (3) (4) (5) (6)
EmploymentOECD European Union
0.973*** 0.973*** 0.973*** 0.970*** 0.970*** 0.970***(0.000) (0.000) (0.000) (0.000) (0.000) (0.000)
0.017*** 0.009* 0.015*** 0.008 0.000 0.007(0.005) (0.005) (0.005) (0.006) (0.006) (0.006)
-0.010*** -0.006** -0.011*** -0.008***(0.002) (0.003) (0.002) (0.003)
-0.004*** -0.005***(0.001) (0.001)
0.010** 0.007*(0.004) (0.004)-0.005 -0.005(0.003) (0.003)
0.000 0.000 0.001 0.006** 0.006** 0.007**(0.002) (0.002) (0.002) (0.003) (0.003) (0.003)
-0.001*** -0.000 -0.000 -0.001**(0.000) (0.000) (0.001) (0.001)
-0.001*** -0.000(0.000) (0.000)
-0.002*** -0.002***(0.000) (0.001)
-0.002*** 0.000(0.000) (0.001)
yes yes yes yes yes yesyes yes yes yes yes yes
Firms 113,680 113,680 113,680 94,398 94,398 94,398Observations 464,272 464,272 464,272 396,182 396,182 396,182
Employmentt-1
Relative energy price [EPD-EPF]
× High VS [3rd & 4th VS quartiles]
× VS-mean(VS)
× 2nd VS quartile
× 4th VS quartile
Relative wage (WD-WF)
× High VS [3rd & 4th VS quartiles]
× (VS-mean(VS))
× 2nd VS quartile
× 4th VS quartile
Country-by-year effectsSector trends
Notes: The dependent variable is the firm employment measured on a logarithmic scale. The vulnerability score (VS) isthe sectoral employment-weighted vulnerability score, and the quartiles are defined on the panel sample. All regressionsare estimated by OLS. Robust standard errors, clustered at the firm level, are in parentheses. Asterisks indicate statisticalsignificance at the 10%(*), 5%(**) and 1%(***) level.
xiii

carbon leakage risk were set out in Directive 2009/29/EC, published four monthsbefore we started the interviews. Therefore, we cannot rule out the possibility thatsome respondents correctly anticipated that they would receive free permits. Herewe employ a regression discontinuity design (RDD) to test whether anticipationof free permit allocation influenced interview responses in spite of our request toconsider the case of no free permits. As discussed in the main text, the criteriafor free allocation were defined in terms of a number of thresholds for the sector’strade and carbon intensity. If the criteria were in fact known by the respondentsand affected their reported VS, we should observe discrete jumps in VS around therelevant threshold values.
This test only has power if the sharp discontinuity in free permit allocation atthe thresholds translated into a sharp discontinuity in managers’ expectations. Thedata requirements for computing sector averages are not trivial (Juergens, Barreiro-Hurle and Vasa, 2013; EU Commission, 2009), and the first official list of sectors atrisk was not published until after the interview process was completed (cf. Decision2010/2/EU of 24 December 2009). If managers did hold expectations about freepermit allocation but failed to predict on which side of the thresholds their sectorwas going to be, then the RDD based test proposed here might fail to reject for thewrong reason.
To guard against this possibility, we also test for discrete jumps in the scorerelating to the expected stringency (ES) of phase III of the EU ETS. This score,which is based on questions 9b)-9e) of the interview script reproduced in AppendixG, measures stringency not only in terms of the overall cap – which determinesthe permit price – but also in terms of how difficult it will be for the firm to keepemissions in check with the free permit allocation it expects to receive in the fu-ture. Since this latter aspect of stringency varies with free permit allocation, it alsodepends on the thresholds for carbon leakage sectors. Finding threshold effects forES would thus strengthen the power of the RDD based test performed on the VS.
To begin, consider the four thresholds depicted by the bold line in panel (a) ofFigure B.1. CI thresholds are at 30% (segment 1) and at 5% (segment 3), whilstthresholds for TI are at 10% (segment 2) and at 30% (segment 4). Most of thefirms in our sample are concentrated in segments 3 and 4. A traditional RDD canbe employed to estimate the threshold effect in a narrow band around the threshold.For example, panel (a) of Figure B.1 depicts 10% bands on either side of segments 3and 4. Figure B.2 plots fitted regression lines and confidence bands on either side ofthe thresholds, for either of the two segments. Panels (a) and (c) of the figure focuson the 5% threshold for CI, and panels (b) and (d) on the 30% threshold for TI. Inpanels (c) and (d) of Figure B.2, the regression lines are restricted to have the sameslope above and below the threshold. In neither case can we detect a significantdiscontinuity at the threshold. The point estimates of these threshold effects are
xiv
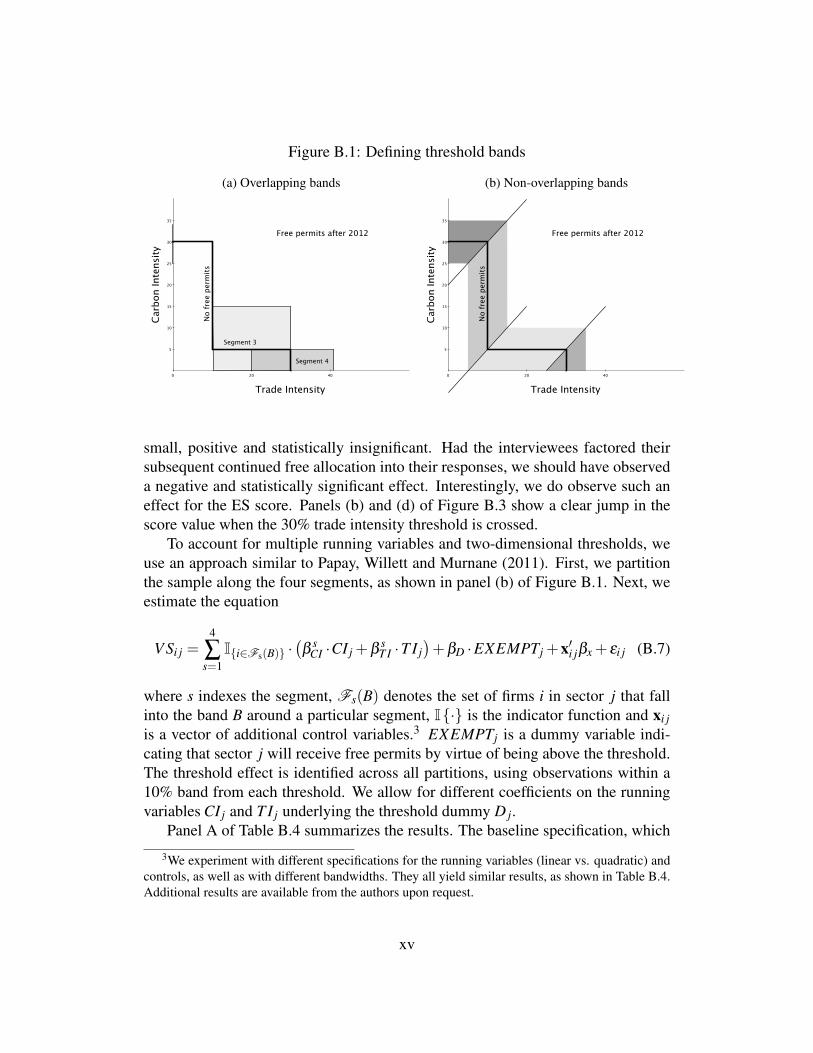
Figure B.1: Defining threshold bands
(a) Overlapping bands
0 20 40
5
10
15
20
25
30
35
Trade Intensity
Carb
on In
tens
ity
Free permits after 2012
No
free
per
mits
Segment 3
Segment 4
(b) Non-overlapping bands
0 20 40
5
10
15
20
25
30
35
Trade Intensity
Carb
on In
tens
ity
Free permits after 2012
No
free
per
mits
small, positive and statistically insignificant. Had the interviewees factored theirsubsequent continued free allocation into their responses, we should have observeda negative and statistically significant effect. Interestingly, we do observe such aneffect for the ES score. Panels (b) and (d) of Figure B.3 show a clear jump in thescore value when the 30% trade intensity threshold is crossed.
To account for multiple running variables and two-dimensional thresholds, weuse an approach similar to Papay, Willett and Murnane (2011). First, we partitionthe sample along the four segments, as shown in panel (b) of Figure B.1. Next, weestimate the equation
V Si j =4
∑s=1
I{i∈Fs(B)} ·(β
sCI ·CI j +β
sT I ·T I j
)+βD ·EXEMPTj +x′i jβx + εi j (B.7)
where s indexes the segment, Fs(B) denotes the set of firms i in sector j that fallinto the band B around a particular segment, I{·} is the indicator function and xi jis a vector of additional control variables.3 EXEMPTj is a dummy variable indi-cating that sector j will receive free permits by virtue of being above the threshold.The threshold effect is identified across all partitions, using observations within a10% band from each threshold. We allow for different coefficients on the runningvariables CI j and T I j underlying the threshold dummy D j.
Panel A of Table B.4 summarizes the results. The baseline specification, which
3We experiment with different specifications for the running variables (linear vs. quadratic) andcontrols, as well as with different bandwidths. They all yield similar results, as shown in Table B.4.Additional results are available from the authors upon request.
xv

Figure B.2: Effect of exemption thresholds on VS? Graphical analysis
(a) 5% CI Threshold - 10% Bands
12
34
5Sc
ore
0 5 10 15CO2 intensity
Impact Score
(b) 30% TI threshold - 10% Bands
01
23
45
Scor
e
20 25 30 35 40Trade intensity
Impact Score
(c) 5% CI threshold - 10% Bands - equal slopes
12
34
5Sc
ore
0 5 10 15CO2 intensity
Impact Score
(d) 30% TI threshold - 10% Bands - equal slopes
01
23
45
Scor
e
20 25 30 35 40Trade intensity
Impact Score
xvi

Figure B.3: Effect of exemption thresholds on expected stringency? Graphical anal-ysis
(a) 5% CI Threshold - 10% Bands
12
34
5Sc
ore
0 5 10 15CO2 intensity
Anticip
(b) 30% TI threshold - 10% Bands
12
34
5Sc
ore
20 25 30 35 40Trade intensity
Anticip
(c) 5% CI threshold - 10% Bands - equal slopes
12
34
5Sc
ore
0 5 10 15CO2 intensity
Anticip
(d) 30% TI threshold - 10% Bands - equal slopes
12
34
5Sc
ore
20 25 30 35 40Trade intensity
Anticip
xvii

is linear in the running variables and lacks further controls, yields a statistically in-significant coefficient of 0.21 (in column 1). This means that firms just above thethreshold for free permit allocation have a VS that is 0.21 points (about one tenth ofthe standard deviation in this sample) higher on average than the VS for firms justbelow the threshold. The specification in column 2 includes firm-level CO2 emis-sions and employment as control variables, in addition to interview noise controls(i.e. interviewer dummies as well as interview and interviewee characteristics). Thepoint estimate for the threshold effect becomes negative but remains insignificantand small in magnitude. Choosing narrower bands (5% on either side of the thresh-old) changes the threshold estimate very little, as reported in column 3. If anything,the point estimate is closer to 0. Columns 4 through 6 report the results when eq.(B.7) is estimated with 15% and 20% bands, or with a second-order polynomial inthe running variables. Neither specification gives rise to a statistically significantthreshold effect.
Panel B of Table B.4 reports results based on the same specifications, but usingES as the dependent variable. We find a significant negative threshold effect for allspecifications, suggesting that a considerable number of firms had correct expecta-tions about their future permit allocation situation. Since we do not find thresholdeffects on VS in spite of this, we conclude that managers understood correctly thattheir response to the question underlying the VS was conditional on not receivingfree permits.
C Computational appendix
C.1 Firm level allocationWe implement the dynamic programming algorithm to solve programs (4) and (6)in a STATA ado file using MATA language. The structure of these programs is akinto a dynamic ‘cake eating problem’ (see e.g. Adda and Cooper, 2003), with thedifference that the ‘cake’ is not distributed over time but across firms. This approachcan be applied to a broad class of specifications for the relocation probability andobjective functions. Importantly, it allows us to solve the dual problem (6) as well.
Primal program: Minimize risk subject to fixed permit allocation Firm i’scontribution to aggregate relocation risk is given by
ri(qi) =di
1+ exp(β0i +β1iqi)(C.1)
xviii

Table B.4: Effect of exemption thresholds on VS and ES? RDD estimates
(1) (2) (3) (4) (5) (6)
A. Dependent Variable: Vulnerability Score (VS)
EXEMPT 0.21 -0.23 -0.17 -0.22 -0.52 -0.37(0.256) (0.314) (0.376) (0.331) (0.515) (0.479)
Log(employment) -0.07 -0.08 -0.08 -0.09 -0.09(0.073) (0.072) (0.073) (0.071) (0.070)
0.191** 0.199*** 0.199** 0.206** 0.192**(0.078) (0.076) (0.078) (0.079) (0.077)
Multinational dummy -0.23 -0.16 -0.23 -0.19 -0.17(0.176) (0.181) (0.173) (0.178) (0.174)
B. Dependent Variable: Expected Stringency (ES)
EXEMPT -0.356* -0.461** -0.417* -0.466** -0.513** -0.967***(0.191) (0.191) (0.221) (0.189) (0.226) (0.284)
Log(employment) -0.001 0.007 -0.001 0.010 0.009(0.038) (0.038) (0.038) (0.037) (0.042)
0.148*** 0.152*** 0.146*** 0.142*** 0.133***(0.049) (0.046) (0.048) (0.049) (0.048)
Multinational dummy 0.293** 0.279** 0.293** 0.313** 0.317**(0.134) (0.128) (0.134) (0.135) (0.128)
Noise controls no yes yes yes yes yes
Observations 310 310 310 310 310 310above thresholds in band 106 106 34 109 146 106
below thresholds in band 137 137 102 137 137 137
Bands 10% 10% 5% 15% 20% 10%
Running variables Linear Linear Linear Linear Linear Quadratic
Log(CO2 emissions)
Log(CO2 emissions)
xix

where di is the damage caused by relocation of firm i. This is substituted into theBellman equation
Vi (si) = min0≤qi≤si
ri(qi)+Vi+1 (si−qi) (C.2)
We evaluate eq. (C.1) for each firm on a grid ranging from 0 to Q. This matrix ispassed on to the program cake.ado which evaluates and solves (C.7).
Dual Program: Minimize free permit allocation subject to fixed risk. SinceFi (−πi(·)) is strictly monotonic in qi we can invert eq. (C.1) to get
qi = π−1i
[−F−1
i
(ri
αli +(1−α)ei
)]and rewrite the dual program (6) as
min{ri≥0}
n
∑i=1
π−1i
[−F−1
i
(ri
αli +(1−α)ei
)]s. t.
(∑
iri ≤ R
). (C.3)
That is, rather than allocating the pieces of a fixed pie of free permits so as toreduce total risk, we now allocate the pieces of a fixed pie of relocation risk so asto minimize total permits. For all firms with β1i > 0 we invert function (C.1) overthe positive range to obtain
qi(ri) =
{1
β1ilog(
diri−1)− β0i
β1iri <
di1+exp(β0i)
0 otherwise(C.4)
The corresponding Bellman equation is given by
Wi (si) = min0≤ri≤si
qi (ri)+Wi+1 (si− ri) (C.5)
Again this function can be written as a vector on a grid and passed on to cake.adowhich computes the minimum allocation.
C.2 Sector level allocationIn the sector-level allocation scenario, it is assumed that the regulator assigns freepermits to the sector as a whole but refrains from redistributing emission permitsamongst the firms in this sector. Denote by θi j (0≤ θi j ≤ 1) firm i’s share in the totalamount of permits Q j allocated to sector j. We assume that firms receive emission
xx

permits in proportion to their historical emissions ei, i.e. θi j =ei
∑k∈ j ek.
Primal program Sector j’s contribution to aggregate risk of relocation is givenby
R j(Q j) = ∑i∈ j
di
1+ exp(β0i +β1iθi jQ j
) . (C.6)
These can be vectorized and passed on to the cake.ado program to solve the Bellmanequation
Vj(S j)= min
0≤Q j≤S jR j(Q j)+Vj+1
(S j−Q j
). (C.7)
The program returns the optimal quantities of free permits for each sector, andthanks to the shares θi j these map directly into firm level allocations.
Dual Program In order to use cake and the assumption of proportional permitallocation within sectors, one would have to invert the sector risk function (C.6).Since there is no closed-form solution for the inverse, we do not compute the permitminimizing sector-level allocation.
C.3 Further details on computationCharacteristics of the relocation probability The probability of exiting is a de-clining function of free permits qi bounded between 0 and 1 (cf. Figure C.1). Themarginal impact on firm exit of an additional unit of free permits for firm i is givenby
dFi [−πi(qi)]
dqi= β1i
−exp(β0i +β1iqi)
[1+ exp(β0i +β1iqi)]2 (C.8)
which is strictly negative for β1i > 0. This is the case if allocating more permitsfor free strictly reduces the relocation probability, i.e. Fi(0) > Fi(0.8ei). Sincethe marginal impact of free permits on the relocation probability is declining inabsolute value, the government should allocate free permits first to firms with thehighest absolute impact of the first free permit, β1i exp(β0i)
[1+exp(β0i)]2 .
xxi

Figure C.1: The shape of the exit probability function
Sample Out of 770 interviewed firms, there are 429 EU ETS firms. Of thesewe dropped firms with missing information on the survey questions, on the OR-BIS variables, and on the phase III benchmark allocation. This leaves us with 344observations across the six countries for the simulations.
Variables Employment li and turnover are calculated as pre-sample averages ofthe number of employees from ORBIS over the years from 2005 to 2008. CO2emissions, ei, are calculated as the average of surrendered permits from CITL inyears 2007 and 2008. Carbon intensity and trade intensity are computed for eachsector as documented in Section I.
Permit allocations in the reference scenarios are calculated as follows. Thegrandfathering allocation corresponds to the average CO2 emissions, as calculatedabove. The benchmarking allocation is the mean allocation from 2013 until 2020,taken from the official NIMs for the six countries. The overall cap Q is calculatedas the sum of the reference allocations across all firms in the sample.
C.4 Dynamic programming using cake.ado
The ado file cake.ado uses dynamic programming to solve a minimization programof the type
minxi
N
∑i=1
fi(xi) s.t.N
∑i=1
xi ≤ x.
Before calling cake.ado we need to
xxii

1. Discretize the vector x on a finite support. For simplicitly, suppose that wehave discrete support 1,2, . . . , x−1, x.
2. Evaluate, for each firm i, the risk at each point of the support:
f =
fi(0)fi(1)
...fi(x−1)
fi(x)
The vector f is an input to the STATA program cake.ado. The program does thefollowing:
1. Set the continuation value for the last firm to vN(x) = fN(x) and iterate back-wards. The continuation value for the penultimate firm is given by vN−1(x) =minc fN−1(c) + vN(x− c). To do this numerically, vN−1must be evaluatedfor each x and c. This is done by building a matrix with values vN−1(x,c) =fN−1(c)+ vN(x− c) where x shifts along the rows and c along the columns.The components of this matrix are:
VN(x) =
vN(0) B B BvN(1) vN(0) B B
...... . . . B
vN(x) vN(x−1) . . . vN(0)
and
FN−1(c) =
fN−1(0) B B BfN−1(0) fN−1(1) B B
. . . ... . . . BfN−1(0) fN−1(1) . . . fN−1(x)
where B is a large number. The vector vN−1(x) is obtained by adding the twomatrices and picking the minimum in each row. The policy function aN−1(x)is obtained in a similar fashion, as the argminof each row of the matrix.
2. This step is repeated recursively for all firms. The result is a vector v1(x)which gives the minimal risk for every possible initial allocation of permits,and a policy matrix A which results from concatenating all the a vectors.
3. To obtain the optimal allocation, one can start with allocation x and consultthe policy function for the first firm (in the first column of A). For example, if
xxiii

Figure C.2: Function plots: damage=100, β0 = 1, β1 = .5,
(a) Risk function (b) Inverse risk function (allocation)
a1(x) = k≤ x we know that the row minimum was in column k which meansthat the first firm should receive k− 1 free permits. Then move on to thesecond column of A and evaluate at x = x− k to get the allocation for firm 2,and so on.
Figure C.2 shows the shape of the risk function (in panel a) and of the inverserisk function (in panel b). Since negative allocations are not possible, we need totruncate the function at the root and assign 0 permits to all risk allocations largerthan the root. Moreover, firms that do not respond to free permit allocation at all(β1 = 0) are allocated 0 permits in a separate step prior to optimization.
D Output-based updatingIn Section III the firm’s response to free permits is modeled in terms of the probabil-ity of exit from the EU for different allocation levels. In line with the institutionalframework of capacity-based updating, there is no intensive margin-response onemployment or output. This section shows that a similar reduced-form responseof home (EU) employment (or output) can be obtained when allowing for outputadjustments in a more flexible framework.
Suppose that a firm’s final output Q is produced by means of a Leontief produc-tion function
Q = minν∈[ε,1]
{vν}
using a continuum of intermediate input varieties vν . Production of a variety canbe in home or foreign. Varieties are produced with labor and energy leading to CO2
xxiv

emissions. Home has lower effective wages (e.g. because of higher productivity),foreign has lower energy costs.
Varieties differ in the amount of energy required to produce them. The technol-ogy for producing varieties is Leontief
vν = min{
Lν ,1
γνEν
}where Eν is the amount of energy and Lν labour. Energy intensity of production ishighest for variety ν = 1 and lowest for variety ν = ε . The parameter γ scales theoverall energy intensity of a firm. The cost of producing one unit of a variety ν isgiven by
cν =WL + γνWE
For simplicity we normalize the energy cost in foreign and the wage cost inhome to 0. If the wage in foreign is equal to w and the energy cost in home is equalto τ we can find the marginal variety s by equalizing the costs in home and foreign:
τγs = w (D.1)
The optimal offshoring decision
s =
ε if w
γτ< ε
wγτ
if ε ≤ wγτ
< 1
1 if wγτ≥ 1
implies that higher energy costs at home lead to a larger number of varieties beingproduced abroad. Moreover, firms whose energy intensity increases faster acrossvarieties (high γ) produce a larger share of intermediates abroad.
The unit and marginal costs of producing a unit of final output will be equal to
c(s) =ˆ s
ε
τγνdν +
ˆ 1
swdν =
12
τγ(s2− ε
2)+w(1− s)
Since∂c(s)∂ s = τγs−w, the heuristic derivation of the marginal variety in (D.1)
gives rise to the same interior solution as the unit cost minimization program.
Free allocation Free allocation in Phase III of the EU ETS consists of a lumpsum allocation A which is based on historical output and sector specific benchmarksfor the emissions intensity of output. When a firm outsources a substantive share ofproduction by shifting the production of certain varieties to foreign, the allocation is
xxv

adjusted downwards. As discussed above, this practice likens free permit allocationto a step function in output. In the main text, we considered a simplified version ofthis step function which had only a single step (all or nothing). Here we consider theopposite extreme and assume that the number of permits that the firm can retain, Ai,is directly proportional to output if output is smaller than historical domestic outputH = sQ
A =
{sQH A if sQ
H < 1A otherwise
(D.2)
Profit maximization To complete the description of the firm’s problem we haveto make an assumption about demand. Suppose we have monopolistic competitionwith linear demand
P = a−bQ
Profits are given by
Π(Q,s, A
)= aQ−Q2b−Qc(s)+
sQH
A
and the profit maximization problem becomes
maxQ,s
Π(Q,s, A
)The first order conditions are given by
[Q] a−2Qb− c(s)+sAH≥ 0 ∧ (D.3)
[s]QAH−Q(τγs−w) ≥ 0 (D.4)
For an interior solution condition (D.3) implies
Q(s) =a− c(s)+ sA
H2b
From (D.4) we can solve for the optimal relocation threshold s∗:
s∗ =
ε if 1
γτ
(w+ A
H
)< ε
1γτ
(w+ A
H
)if ε ≤ 1
γτ
(w+ A
H
)< 1
1 otherwise
(D.5)
xxvi

From (D.3) and (D.5) it is straightforward to calculate total output Q∗, domesticoutput s∗Q∗ and domestic employment
L∗ =
{(s∗− ε)Q∗ if (s∗− ε)Q∗ < HH otherwise
(D.6)
where the two cases follow from the allocation rule in equation (D.2).Figure D.1 plots employment in home as a function of freely allocated permits A
for different parameter values. In the baseline case, employment initially increaseswith A. The increase is more than proportional when s < 1, as the firm respondsto free permits both by increasing the share of varieties produced at home and byincreasing final output Q. Once all varieties have been repatriated, further increasesin A linearly increase home employment until the firm reaches its historical outputlevel.
Upon comparing the different cases shown in Figure D.1, we see that the re-sponse to free permits is slower when the firm is more energy intensive (γ high)because a stronger incentive is required to repatriate the more energy intensive vari-eties. The employment response is also slower whenthe demand elasticity is lowerthan in the baseline case (b high). This is because the firm has more market powerand chooses lower levels of output irrespective of the share of intermediates pro-duced at home.4 Finally, firms with a higher historical output (H high) continueto increase employment at higher levels of A than in the baseline case. The initialmarginal impact in this case is smaller than in the baseline case because the actualamount of permits received, A, is inversely proportional to the (larger) referenceoutput.
In sum, this appendix has illustrated that the S-shaped function we have used inthe main text to approximate the response of output and employment to free per-mit allocation provides a reasonable approximation even under the (counterfactual)assumption that free permit allocation is directly proportional to output.
4Hence the marginal impact of repatriating a variety and in turn the marginal impact of additionalfree allocations is lower.
xxvii

Figure D.1: Home employment as a function of free permits
E Additional Tables and Figures
Table E.1: Sector classification
Sector NACE Sectors CITL 2008 sectors
Food & Tobacco 15, 16Textile & Leather 17, 18, 19Wood & Paper 20,21 9Publishing 22Fuels 23 2,3Chemical & Plastic 24, 25Glass 261 7Ceramics 262 8Cement 264, 265,266 6Other Minerals 267, 268Iron & Steel 271, 272, 273, 275 5Other Basic Metals 274Fabricated Metals 28Machinery & Optics 29, 30, 31,33TV & Communication 32Vehicles 34,35Furniture & NEC 36
Notes: NACE sectors codes are based on NACE 1.1. NEC: Not elsewhere classified.
xxviii

Figure E.1: Impact of free allocation on the vulnerability score
Notes: The chart shows the conditional distribution of the reduction in the vulnerability score when firms receive free permitsfor 80% of their direct carbon emissions. The conditioning variable is the vulnerability score in the absence of free permits.For example, the fifth bar represents firms that responded that future carbon pricing would likely force them to close down orrelocate. One fifth of these firms reported that receiving free permits would have no impact on this decision whereas anotherfifth reported that this would neutralize any negative impact on domestic production.
Figure E.2: Relative size of exemption groups in different samples
(a) All matched EU ETS firms
(b) Matched EU ETS firms in 6 interview countries (c) Interviewed EU ETS firms only
Notes: The charts display the relative size of each category of sectors in the EU ETS defined by the exemption criteria. Thefirst bar indicates the category’s share of firms, the second bar its share in employment, and the third bar its share in CO2emissions, based on figures from the CITL-ORBIS match. The sample underlying figure (a) includes all manufacturing firmsin the EU ETS which we could match to ORBIS. Figure (b) is based on all such firms located in the six countries under study.Figure (c) is based only on EU ETS firms that we interviewed.
xxix

Figure E.3: Distribution of the vulnerability score
(a) Shares in number of firms (b) Shares in employment (c) Shares in CO2 emissions
Notes: The graphs show the distribution of the vulnerability score for interviewed firms included in the EU ETS and part ofeach group of sectors defined in Section I.B. Panel a reports the shares of firms, panel b employment shares, and panel c CO2emission shares, based on average permits surrendered in 2007 and 2008.
F Appendix ReferencesAdda, Jerome, and Russell Cooper. 2003. Dynamic Economics: Quantitative
Methods and Applications. MIT Press.
Bloom, Nicholas, and John van Reenen. 2007. “Measuring and Explaining Man-agement Practices across Firms and Countries.” Quarterly Journal of Economics,CXXII(4): 1351–1406.
Bloom, Nicholas, and John van Reenen. 2010. “New Approaches to SurveyingOrganizations.” American Economic Review, 100(2): 105–09.
Blundell, Richard, and Stephen Bond. 1998. “Initial Conditions and Moment Re-strictions in Dynamic Panel Data Models.” Journal of Econometrics, 87(1): 115–143.
Bureau van Dijk. 1999-2008. “ORBIS data base.” http://www.bvdinfo.com. (ac-cessed July, 2009).
EU Commission. 2005-2008. “Community Independent Transaction Log (CITL).”http://ec.europa.eu/environment/ets. (accessed July, 2009).
EU Commission. 2009. “Impact Assessment accompanying the Commission Deci-sion determining a list of sectors and subsectors which are deemed to be exposed
xxx

to a significant risk of carbon leakage pursuant to Article 10a (13) of Directive2003/87/EC.”
EUROSTAT. 2010a. “International Trade.” http://epp.eurostat.ec.europa.eu. (ac-cessed January, 2010).
EUROSTAT. 2010b. “Prodcom/Comext.” http://epp.eurostat.ec.europa.eu. (ac-cessed January, 2010).
EUROSTAT. 2010c. “Structural Business Statistics.”http://epp.eurostat.ec.europa.eu. (accessed January, 2010).
International Energy Agency. 2009. “Energy Prices and Taxes Database.”http://www.iea.org/statistics/topics/pricesandtaxes. (accessed December 2009).
International Labour Organization. 1997-2008. “LABORSTA Labour StatisticsDatabase.” http://laborsta.ilo.org. (accessed January, 2013).
Juergens, Ingmar, Jesus Barreiro-Hurle, and Alexander Vasa. 2013. “Identify-ing Carbon Leakage Sectors in the EU ETS and Implications of Results.” ClimatePolicy, 13(1): 89–109.
Office for National Statistics. 2004. “Quarterly Fuels Inquiry.”http://www.esds.ac.uk/. (accessed December 2009).
Papay, John P., John B. Willett, and Richard J. Murnane. 2011. “Extending theRegression-Discontinuity Approach to Multiple Assignment Variables.” Journalof Econometrics, 161(2): 203–207.
xxxi

G Questionnaire
xxxii

Questionnaire
Questions Values Coding description
I. Introduction
1. A bit about your business
(a) Is your firm a multinational? If yes, where is the
headquarters?
(b) On how many production sites do you operate (globally)?
(c) How many of these sites are situated in the EU?
(d) How many of these sites are situated in the UK/B/FR/...?
no, list of countries, dk, rf “No”, if not a multinational; country where headquarters is located if a
multinational
number, dk, rf
number, dk, rf
Number of sites globally (approximate if unsure)
Number of sites in the EU
number, dk, rf Number of sites in current country
2. A bit about you
(a) Job title text
(b) Tenure in company number, rf
(c) Tenure in current post number, rf
(d) Managerial background commercial, technical, law, other
3. EU ETS involvement
As you might know, the European Union Emissions Trading
System (referred to as EU ETS, hereafter) is at the heart of
European climate change policy.
(a) Is your company (or parts thereof) regulated under the EU
ETS?
(b) Since when?
(c) How many of your European business sites are covered by
the EU ETS?
no, list of years 2005-2009, yes dk
year, dk, rf
number, dk, rf
4. Site location
For single plant firms and interviewees based at a production
site:
Could you tell me the postcode of the business site where you
text Records the postcode
Questions Values Coding description
are based?
For multi-plant firms where the interviewee is located at a non-
production site:
Some of the questions I am going to ask you next are specific to
a production site within your firm. Please choose a particular
production site and answer my questions for the particular site
throughout the interview. The site should be the one you know
best, the largest one, or the one nearest to you. If you are in
the EU ETS, please pick a site covered by the EU ETS. Could you
tell me the postcode of the chosen site?
II. Impact of EU ETS
5. EU ETS stringency (If not an EU ETS firm, continue with question 9)
(a) How tough is the emissions cap/quota currently imposed by
the EU ETS on your production site?
(b) Can you describe some of the measures you put in place to
comply with the cap?
1-5, dk, rf, na Low Cap is at business as usual.
Mid Some adjustments seem to have taken place, however nothing which
led to fundamental changes in practices; e.g. insulation, etc.
High Measures which led to fundamental changes in production
processes; e.g. fuel switching; replacement of essential plant and
machinery.
(c) What is the annual cost burden of being part of the EU ETS?
For example, monitoring, verification and transaction costs; the
cost of buying permits or reducing emissions.
If the manager does not understand the question:
Imagine your installation was not part of the EU ETS this year,
what cost saving would your firm do?
number
percentage
Absolute number
Or percentage of annual operating cost
6. EU ETS management
Ask only multi-plant firms:
Is EU ETS compliance managed on the production site or
elsewhere?
site, other site, national firm,
european firm, dk, rf, na

Questions Values Coding description
7. ETS trading
(a) In March of this year (i.e. before the compliance process),
what was your allowance position on this site?
(b) Were you short or long in allowances?
long, short, balanced, dk, rf, na
text If the manager happens to mention the detailed number of allowances,
make a note of it in this field.
(c) Before the compliance process in April, did you buy or sell
allowances on the market or over the counter from other
firms?
(d) If not, why not?
buy, sell, both, no: only trading
during compliance period, no: no
need, no: image concerns, no:
transaction costs, no: other, dk, rf,
na
(e) If yes, how frequently? daily, weekly, monthly, quarterly,
bi-annual, yearly, dk, rf, na
(f) In April this year, what was your position after
the compliance process?
If answers "long": Did you bank permits for future
years? Why?
banking to emit more in following
years, banking to sell at a higher
ETS permit price in future, banking
dk why, long for pooling, dk, rf, na
Banking reason.
If answers "balanced/compliant" or "short": Did you
borrow permits from next year's allowance? Why?
borrowing to emit less in following
years, borrowing to buy at a lower
ETS permit price in future,
borrowing to be compliant,
borrowing dk why, rf, dk, na
Borrowing reason. Note: Only choose "borrowing to be compliant" if the
manager is very short sighted and doesn't seem to understand he will
eventually have to either emit less or buy permits
If answers "short": Why did you remain short? short for pooling, short and paid
fine, other, rf, dk, na
Short reason.
text If “other”: why?
(g) Has this site exchanged emission permits with other
installations belonging to your company that are part of the EU
ETS? (pooling)
yes, no, rf, dk, na
8. Rationality of market behaviour
(a) How do you decide how many permits to buy or sell or
trade at all?
(b) Did you base this decision on any forecast about prices
and/or energy usage?
1-5, dk, rf, na Low Take their permit allocation as a target to be met as such and do not
take into account the price of permits or the cost of abatement. Just
sell if there is a surplus or buy if there is a deficit.
Mid Are in the process of learning how the market works and in the first
Questions Values Coding description
(c) Did you trade permit revenue off against emission reduction
costs in your planning on this issue?
years did not have any market driven attitude, but now have
someone in charge of managing the ETS so as to minimize
compliance cost. This person has experience in financial markets and
sometimes interacts with the production manager.
High Company has a thorough understanding of the site-specific CO2
abatement cost curve. Trading is used as a tool to reduce compliance
cost and to generate extra revenues from excess abatement.
Moreover, company forms expectations about permit price and re-
optimizes abatement choice if necessary. Trader resorts to futures
and derivatives to manage ETS permits as a financial asset.
9. Anticipation of phase III
(a) Do you expect to be part of the EU ETS from 2012 onwards?
If not, continue with question 10
yes, no, dk, rf, na
(b) How stringent do you expect the next phase of the EU ETS
(from 2012 to 2020) to be?
(c) Will it be tough for your firm to reach such a target? Can you
describe some of the measures you would have to put in place?
(d) Do you believe the allowances will be distributed through
an auctioning mechanism?
(e) Is it likely that sanctions for non-compliance will become
more stringent?
1-5, dk, rf, na Low Cap for phase III is anticipated to be comparable to business as usual.
The manager believes there will be no additional sanctions and that
they will receive the permits for free.
Mid Phase III is likely to trigger some adjustments, however nothing that
will lead to fundamental changes in practices. Only a small part of
permits will be auctioned and sanctions are not expected to be very
high.
High The presence of strong sanctions, extensive use of auctioning and
more stringent targets in Phase III is anticipated. It is likely to imply
the adoption of measures which will lead to fundamental changes in
production processes. It might also imply the closure of the plant, or
redundancy of more than 20% of employment.
(f) Do you expect to transfer unused (banked) ERUs or CERs
from Phase II to Phase III ?
Note: ERUs are Emission Reduction Units stemming from Joint
Implementation projects. CERs are Certified Emission
Reductions
stemming from Clean Development Mechanism projects.
EUAs, ERUs, CERs, EUAs and ERUs,
EUAs and CERs, ERUs and CERs, all
three, no, dk, rf, na

Questions Values Coding description
10. Awareness
(a) Are climate change topics discussed within your business?
Can you give examples?
(b) Are climate change related issues formally discussed in
management meetings? Can you give examples?
(c) Do your strategic objectives mention climate change?
(d) Did you commission reports or studies on how climate
change will affect your business?
1-5, dk, rf, na Note: Give minimum score of 3 to ETS firms and probe directly for 4 or 5,
skipping (a) and (b).
Low Don't know if threat or opportunity. No awareness.
Mid Some awareness backed up by evidence that this is being
formally discussed by management.
High Evidence that climate change is an important part of the
business strategy.
Mentioned positive impact: yes, no
III. Prices
11a Energy price expectations
By how many percent do you expect energy prices to go up or
down by 2020?
percentage, dk, rf
percentage, dk, rf
percentage, dk, rf
Expected price change in percent of today's price.
Note: This price includes the effect of current and future climate change
policies on the energy price.
Upper bound on expected price change – record only if interviewee
mentions it.
Lower bound on expected price change – record only if interviewee
mentions it.
11b Carbon price expectations
(a) As you might know, the EU has committed to reducing
greenhouse gas emissions by 20%-30% over the next decade.
What price do you expect to pay for emitting one tonne of CO2
in 2020?
percentage, dk, rf Expected price in Euros per ton of CO2.
percentage, dk, rf Or expected price change in percent of today's price.
yes, no, rf, dk Knows today's price of CO2.
(b) What price do you expect in the worst-case scenario? Upper bound in Euros per ton of CO2.
(c) What price do you expect in the best-case scenario? Lower bound in Euros per ton of CO2.
12. Future impact of carbon pricing
(a) Do you expect that government efforts to put a price on
carbon emissions will force you to outsource parts of the
1-5, dk, rf Low No impact of this kind.
Mid Significant reduction (>10%) in production/employment due to
outsourcing.
Questions Values Coding description
production of this business site in the foreseeable future, or to
close down completely?
High Complete close-down.
(b) What carbon price do you associate with this scenario?
(Assume that you would have to pay for all allowances.)
Note: The price relates to the scenario given under (a). If
answered "no impact" under (a), skip this question.
number, dk, rf, na Euros per ton
(c) How would your answer to the previous questions change, if
you received a free allowance for 80% of your current
emissions?
Note: If answered "no impact" under (a), skip this question.
1-5, dk, rf, na Low No impact of this kind.
Mid Significant reduction (>10%) in production/employment due to
outsourcing.
High Complete close-down.
(d) Note: Only ask if answered "no impact" under (a).
At what carbon price level would you be forced to close your
plant down?
If the manager has no idea or says it would need to be very
high, try different prices, starting high, for example: If you had
to pay
200 Euros/ton of carbon, would you need to close down?
number, dk, na Euros per ton
(e) How did you reach this conclusion?
(f) How concrete are the plans for outsourcing or closure?
1-5, dk, rf, na Low Gut feeling of the manager.
Mid Response is based on a plausible argument. For example, interviewee
discusses available technological options and associated cost and
relates them to profit margins.
High Commissioned a detailed study of abatement options and associated
cost (in-house or external).
(g) What fraction of an energy price or carbon price increase
can you pass on to your customers?
percentage, dk, rf
IV. Competition and customers
13. Competitors
(a) Can you tell me the number of firms in the world which
compete with you in one or more local markets?
Note: For multi-product multi-plant firms refer to the market
for the products created on the current site referred to during
number, dk, rf

Questions Values Coding description
this interview. For instance, for multi-plant firms start the
question with "For the products produced at the production
site, can you tell me ..."
(b) How many of them are located within the EU? number, dk, rf
(c) How many of them are located in your country? number, dk, rf
(d) Location of main competitor (country) list of countries, dk, rf, na
(e) Do you know in which country your main competitor does
most of its production?
same, EU, non-EU, list of countries,
dk, rf, na
14. Location of Customers
(a) Share of sales exported (to the EU and the rest of the world) percentage, dk, rf
(b) Share of sales exported to EU countries percentage, dk, rf
(c) Are your products sold mainly to consumers or to other
businesses?
B2B, final customer, dk, rf
15. Customer pressure
(a) Are your customers concerned about your GHG emissions?
(b) How do they voice this concern?
(c) Do your customers require hard data on your carbon
emissions?
1-5, dk, rf Low "B2C" - Not aware that emissions performance is of significant
concern to consumers of their product.
"B2B" - Not aware that businesses they supply to are concerned
about the emissions of the plant; quality and price are the only
considerations.
Mid "B2C" - The business is aware of the importance of climate-change
issues in general and so are conscious that their customers may
consider GHG performance to be important, although they do not
expect or require data as proof.
"B2B" - Customers set ISO 14001 as a precondition to suppliers.
Evidence of environmental compliance is requested, but details of
emissions figures are not required.
High "B2C" - Being seen to reduce GHG emissions is thought to be
important in the purchasing decisions of the firm's consumers. This
has been determined by market research or consumers have voiced
their concern through other means. Customers also ask for certified
data on emissions during production or usage. A customer-friendly
system to
Questions Values Coding description
recognize the best products in terms of energy efficiency is often
available in the market (e.g. EU energy efficiency grade for home
appliances).
"B2B" - Customers ask for evidence of external validation of GHG
figures. Customers request information on carbon emissions as part
of their own supply chain carbon auditing. Customers conform to PAS
2050 or other national standard in carbon foot-printing and so
require detailed information on a regular basis.
16 Climate change related products
16.1 Existing climate change related products
(a) Do you currently produce climate change related products at
your production site? (Products that help your customers
to reduce GHG emissions or adapt to climate change)
(b) Can you give examples?
(c) How important are these products as a source of
revenue within your plant?
1-5, dk, rf Low
Mid
High
No climate change related products and no plans to introduce any.
Some climate change related products. These products are however
not the main profit or revenue source of the firm.
The majority of the firm's output can be considered a climate change
related product.
16.2 Climate change related product innovation
(a) Globally, is your company currently trying to develop new
products that help your customers to reduce GHG emissions?
(b) Can you give examples?
(c) What fraction of your Research & Development funds are
used for that? (Less than 10%, more than 10%?)
1-5, dk, rf Low No efforts to develop climate change related
products.
Mid Some efforts but it is not the main objective of
the firms R&D efforts.
High The firm is focusing all product R&D efforts
on climate change.

Questions Values Coding description
V. Measures
17. Energy monitoring
(a) How detailed is your monitoring of energy usage?
(b) How often do you monitor your energy usage? Since when?
(c ) Describe the system you have in place.
1-5, dk, rf Low No monitoring apart from looking at the energy bill.
Mid Evidence of energy monitoring as opposed to looking at the energy
bill, i.e. there is some consciousness about the amount of energy
being used as a business objective. However, discussions are
irregular and not part of a structured process and are more frequent
with price rises. Not more than quarterly monitoring of energy.
High Energy use is measured and monitored constantly and is on the
agenda in regular production meetings. Energy use in the plant is
divided up in space (by production line, machine or similar) and
monitored over time (daily, hourly or continuously). The amount of
energy rather than the cost is focused on.
2000 and earlier, list of years
2001-2010, dk, rf, na
Start date (put “na” if score is “1”)
18. Targets on energy consumption for management
(a) Do you have any targets on energy consumption which
management has to observe? (e.g. kWh of electricity)
no targets, relative quantity
targets, absolute quantity targets,
absolute and relative quantity
targets, only expenditure targets,
dk, rf
Type
(b) Can you describe some of the challenges you face in
meeting the targets?
(c) How often do you meet these targets? Do you think they are
tough?
Note: If the manager replies they have EU ETS/CCA targets, ask
"have these been translated into internal targets for
management?"
1-5, dk, rf Low No targets.
Mid Targets exist but seem easy to achieve.
High Evidence that targets are hard to achieve. Detailed.
(d) By approximately how much does this require reducing your
current energy consumption in the next 5 years (10%, 25%,
50%)?
percentage, dk, rf, na
number, dk, rf, na Horizon (number of years)
Questions Values Coding description
Note the timetable for the target (e.g. 5 years or other number
given by interviewee).
(e) Since when do you have these targets? 2000 and earlier, list of years
2001-2010, dk, rf, na
19. GHG monitoring
(a) Do you explicitly monitor your GHG emissions? Since when?
(b) How do you estimate your GHG emissions?
(c) Are your GHG estimates externally validated?
1-5, dk, rf Low No specific GHG monitoring.
Mid Detailed energy monitoring with clear evidence for carbon
accounting (at least firm level). Manager is aware that energy figures
need to be scaled by carbon intensity.
High Carbon accounting of both direct and indirect emissions (supply
chain emissions). External validation of GHG figures.
2000 and earlier, list of years
2001-2010, dk, rf, na
Start date (put “na” if score is “1”)
20. Targets on GHG emissions for management
(a) Do you have any targets on GHG emissions which
management has to observe?
no targets, direct emissions,
indirect and direct, dk, rf
(b) Can you describe some of the challenges you face in
meeting the targets?
(c) How often do you meet these targets? Do you think they are
tough?
Note: If the manager replies they have EU ETS/CCA targets, ask:
Have these been translated into internal targets for
management?
1-5, dk, rf Low No targets for GHG emissions.
Mid There is some awareness of the contribution of different energy
sources and production processes to emissions, but this is a
secondary consideration to cost focused energy targets. There is
some degree of difficulty in the targets.
HIgh There are separate targets for GHGs, distinct from energy use. GHG
emissions are a KPI (Key Performance Indicator) for the firm. The
contribution of each energy source and the production process to
GHG emissions is known and suggested improvement projects for the
production are assessed on their potential impact on carbon as well
as energy efficiency.
(d) By approximately how much do these targets require you to
reduce your emissions in the next 5 years (10%, 25%, 50%)
compared their current level?
percentage, dk, rf, na
number, dk, rf, na Horizon (number of years)

Questions Values Coding description
Note the timetable for the target (e.g. 5 years or other number
given by interviewee)
(e) When did you start having targets on GHG emissions? 2000 and earlier, list of years
2001-2010, dk, rf, na
21. Target enforcement
(a) What happens if energy consumption or GHG emission
targets are not met?
(b) Do you publicize targets and target achievement within the
firm or to the public? Can you give examples?
(c) Are there financial consequences in case of non-
achievement?
(d) Is there a bonus for target achievement?
1-5,dk,rf Low No targets or missing targets do not trigger any response.
Mid Both target achievement and non-achievement are internally and
externally communicated.
High Target non-achievement leads to financial consequences internally
and/or externally; including penalties, e.g. staff does not get bonus.
22. Emission-reducing measures
(a) Can you tell me what measures you have adopted in order
to reduce GHG emissions (or energy consumption) on this site?
DO NOT PROMPT with the list if doesn't have an idea, rather
ask: Have you bought any new equipment, or have you
changed the way you produce?
List of tickboxes I. Heating and cooling:
1- Optimised use of process heat
2- Modernisation of cooling/refrigeration system
3- Optimisation of air conditioning system
4- Optimisation of exhaust air system and/or district heating system
II. More climate-friendly energy generation on site:
1- Installation of combined heat and power (CHP) plant / cogeneration
2- Biogas feed-in in local combined heat and power plant or domestic gas
grid
3- Switching to natural gas
4- Exploitation of renewable energy source
III. Machinery:
1- Modernisation of compressed air system
2- Other industry-specific production process optimisation/machine upgrade
3- Production process innovation
IV. Energy management:
1- Introduction of energy management system
2- Submetering / upgrade of an existing energy management system
Questions Values Coding description
3- (External) Energy audit
4- Installation of timers attached to machinery
5- Installation of (de-)centralised heating systems
V. Other measures on production site:
1- Modernisation of lighting system
2- Energy-efficient site extension/improved insulation/introduction of
building management
3- Employee awareness campaigns and staff trainings
4- Non-technical reorganisation of production process
5- Installation of energy-efficient IT-system
6- Improved waste management/recycling
VI. Beyond production on site:
1- Introduction of climate-friendly commuting scheme
2- Consideration of climate-related aspects in investment and purchase
decisions
3- Consideration of climate-related aspects in distribution
4- Customer education programme
5- Participation in carbon offsetting schemes
(b) Which one of these measures achieved the largest carbon
saving?
measure code Fill in the code corresponding to the measure in (a) (e.g. II-4 for “Exploitation
of renewable energy source”).
(c) By how much did this measure reduce your total energy
consumption?
percentage, dk, rf, na
(d) By how much did this measure reduce your total GHG
emissions?
percentage, dk, rf, na
(e) What motivated the adoption of these measures? EU ETS, energy cost saving / high
profitability, pollution reduction,
reputation, customer pressure,
employee initiative, public
investment support, compliance
with regulation, compliance with
expected future regulation, other,
dk, rf, na
Main motivation (select only ONE)
text Other motivation (if not in tick boxes, or second)

Questions Values Coding description
(f) How did you learn about this measure? consultant, government,
customer, supplier, employee,
R&D project, competitor, other,
dk, rf, na
Tick more than one option, if different sources mentioned
(g) When did you implement this measure? 2000 and earlier, list of years
2001-2010, dk, rf, na
VI. Innovation, barriers to investment and management
23. Climate change related process innovation
(a) Do you dedicate staff time and/or financial resources to
finding new ways of reducing the GHG emissions at your
facility? Did you commission any studies for that purpose?
(b) Can you give examples?
(c) What fraction of your firm's global Research & Development
funds are used for that? (less than 10%, more than 10%?)
Note: This does not include expenses for staff trainings or
energy monitoring, but actual innovation.
1-5, dk, rf Low No R&D resources committed to reducing GHG emissions.
Mid Evidence of R&D projects to reduce emissions.
High Evidence that this kind of R&D is an important component in the
company's R&D portfolio (5 or higher).
24. Barriers to adopting energy-efficiency investments
(a) Can you give one example of a measure to enhance energy
efficiency which was considered, but eventually not adopted?
List of tickboxes Same list as for question 22a.
(b) Which payback time was required in the economic
evaluation of this measure?
number, dk, rf, na “Years”; if in months, put equivalent in years, e.g. record 6 months as 0.5.
(c) Is this payback time longer or shorter than the one applied
to non-energy related measures to cut costs?
1-5, dk, rf, na Low Longer, i.e. much less stringent
Mid Equal
High Shorter, i.e. much more stringent
(d) If different: why? text
(e) Was uncertainty about future prices or regulation important
for the decision to reject?
no, yes_prices, yes_regulation,
yes_both, dk, rf, na
Questions Values Coding description
(f) What other factors were influential in the decision? text
(g) Has the current economic downturn affected your
investment criteria for clean technologies? How?
no, favors clean, favours other,
more stringent overall, less
stringent overall, dk, rf, na
25. Further reductions
(a) By how much (in percentage points) could you - at current
energy prices - further reduce your current GHG emissions
without compromising your economic performance? (i.e. how
much more emission reduction could be achieved without
increasing costs)
percentage, dk, rf
(b) If so, why have you not implemented these measures yet? text
(c) What further GHG emission reduction (in percentage points)
would be technologically possible (although not necessarily at
no extra cost)?
percentage, dk, rf Notes: Assuming that production stays constant and that no processes are
being outsourced. This should not include emission reduction achieved by
switching to renewable electricity. Include emissions reductions through
combined heat and power however.
26. Manager responsible for Climate Change issues
(a) At the management level, who is responsible for dealing
with climate change policies and energy and pollution
reduction in the firm nationally? What is the official job title?
Note: If several, ask for highest-ranking. If nobody, put title “no
clear responsibility”.
text Job title of the manager
(b) How far in the management hierarchy is this manager
below the CEO? (figure out through sequential questioning if
necessary)
CEO, number, no clear
responsibility, dk, rf
No of people between CEO and Manager, e.g. if reports directly to CEO, put
0
(c) Has there recently been a change in responsibilities for
climate change issues? When?
(d) How far in the management hierarchy was this manager
below the CEO? (figure out through sequential questioning if
necessary)
no change, list of years 2000-2010,
yes dk year, dk, rf
CEO, number, no clear
responsibility, dk, rf
text Record past manager title if mentioned, but do not prompt for it.

Questions Values Coding description
VI. Firm Characteristics
27. Firm/Plant Details(a) How many people are employed in the firm globally
(including this country)?
Note: If a multinational, ask for the whole group's number.
number, dk, rf
(b) How many people does the firm employ in your country? number, dk, rf
(c) How many people are employed at the current site? number, dk, rf
(d) Annual Energy Bill-Annual: number, dk, rf
percentage, dk, rf, na
percentage, dk, rf, na
Do not ask, but in case interviewee does not know the absolute number and
answers with one of the following:
Energy cost as percentage of turnoverEnergy cost as percentage of costs
(e) Total annual running costs (wage cost + materials, including
energy):
number, dk, rf
Answered (d) and (e) at the site level or at the company level? site, company, na
(f) Does your company purchase renewable power? yes, no, dk, rf Note: Do not include electricity generated on site.
(g) Does this site do any product R & D?
Note: Do not dwell on this question, make a judgement from
first answer.
yes, no, dk, rf
(h) Is Marketing for your products done from this site?
Note: Do not dwell on this question, make a judgement from
first answer.
yes, no, dk, rf
(i) Does this site have an environmental management system
(ISO 14000)?
yes, no, dk, rf
Questions Values Coding description
VII. Country-specific policies
UNITED KINGDOM
UK.1 Participation in voluntary government climate change policies(a) Are you aware of voluntary government schemes to help
businesses reduce GHG pollution?
(b) Which ones?
(c) Are you participating in any?
no, list of years 2001-2009, dk, rf,
na
no, list of years 2001-2009, dk, rf,
na
no, list of years 2001-2009, dk, rf,
na
no, list of years 2001-2009, dk, rf,
na
no, list of years 2001-2009, dk, rf,
na
Carbon Trust Online Tools (Benchmarking Tools, Action Plan Tool) When?
Carbon Trust Energy Audit or Advice? (CTaudit)
Innovation grants from the Carbon Trust? When?
Carbon Trust Standard
Enhanced Capital Allowance scheme? (ECA)
UK.2 Participation in Climate Change agreement(a) Is your company (or parts thereof) subject to a UK Climate
Change Agreement?
(b) Since when?
no, list of years 2001-2009, dk, rf,
na
(c) How stringent is the target imposed by the CCA?
(d) Can you describe some of the measures you had to put in
place to comply with the cap?
1-5, dk, rf, na Low No targets.
Mid Targets exist but seem easy to achieve.
High Evidence that targets are hard to achieve. Detailed description of
serious problems in achieving targets.
((e) Did you buy or sell emission rights via the UK ETS? no because of image concerns, no
because no capacity, no other,
bought, sold, both, dk, rf, na
BELGIUMB.1 Participation in industry agreements (accords de
Branche/Bechmarkconvenanten)
(a) Is your company (or parts thereof) subject to an industry
agreement?
no, list of years 2001-2009, dk, rf,
na

Questions Values Coding description
(b) Since when?
(c) How stringent is the target imposed by the agreement?
(d) Can you describe some of the measures you had to put in
place to comply with the cap?
1-5, dk, rf, na Low
Mid
High
No targets.
Targets exist but seem easy to achieve.
Evidence that targets are hard to achieve. Detailed description of
serious problems in achieving targets.
B.2 Do you benefit from any tax reduction from the Federal
government because of investments that reduce energy
consumption/loss? If yes, when?
no, list of years 2001-2009, yes dk
year. dk, rf, na
B.3 Brussels: Have you had a grant for an energy audit or
advice financed by the Brussels region? If yes, when?
Walloon: Have you had any energy audit (AMURE) or advice
financed by the Walloon region? If yes, when?
Flanders: Have you received any advice or energy audit
financed by VLAO (Vlaams Agentschap Ondernemen)? If yes,
when?
no, list of years 2001-2009, yes dk
year. dk, rf, na
B.4 Brussels: Have you benefited from an investment subsidy
from the Brussels region for improving your building's or
production process's energy efficiency ? If yes, when?
Walloon: Have you had a grant from the energy fund of the
Walloon region for improving your building's or production
process's energy efficiency? If yes, when?
Flanders: Have you received an ecological grant
(Ecologipremeie) of the Flemish region for improving your
building's or production process's energy efficiency? If yes,
when?
no, list of years 2001-2009, yes dk
year. dk, rf, na
B.5 Flanders: Do you have a heat and power certificate from
the Flemish region (warmtekrachtcertificaat)? If yes, since
when?
no, list of years 2001-2009, yes dk
year. dk, rf, na
FRANCEF1. Are you part of the AERES (Association des entreprises pour
la réduction de l'effet de serre) and have signed up to voluntary
GHG emission reductions? If yes, since when?
no, list of years 2001-2009, yes dk
year. dk, rf, na
F2. Have you had a grant for an energy audit or advice financed no, list of years 2001-2009, yes dk
Questions Values Coding description
by ADEME? If yes, when? year. dk, rf, na
F3. Have you benefited from a “FOGIME” guarantee for loans
you have taken to invest into energy efficiency improvements
or emission reductions ? If yes, when?
no, list of years 2001-2009, yes dk
year. dk, rf, na
F4. Have you benefited from a grant from ADEME for improving
your building's or production process's energy efficiency ? If
yes, when?
no, list of years 2001-2009, yes dk
year. dk, rf, na
GERMANY
G.1 Renewable Energy Sources Act(a) In previous year, have you been granted a discount on your
energy cost which reduces the energy cost apportionment
embodied in the Renewable Energy Sources Act?
no, yes, dk, rf, na
(b) Have you applied for the discount (also) in 2009? no, yes, dk, rf, na
(c) Did the certification process require you to upgrade your
energy management system?
Note: Since 2009 the approval of the discount is subject to the
certification of your energy management system by 30 June
2009.
yes, no upgrade necessary, no had
certificate before, dk, rf, na
G.2 Public support programmesHave you participated in public support programs aimed at
saving energy or at reducing GHG emissions?
no, list of years 2001-2009, yes dk
year. dk, rf, na
Climate initiative
no, list of years 2001-2009, yes dk
year. dk, rf, na
ERP Environment and Energy Efficiency Programme
no, list of years 2001-2009, yes dk
year. dk, rf, na
Grant for independent energy audit from fonds for energy efficiency in SME
no, list of years 2001-2009, yes dk
year. dk, rf, na
Provision of cut-rate investment credit from fonds for energy efficiency in
SME to implement identified energy-saving measures
no, list of years 2001-2009, yes dk
year. dk, rf, na
Support scheme of a federal state
text Other

Questions Values Coding description
HUNGARYH1. Have you received government support for any of your
investments to reduce emissions or implement energy
efficiency measures or increase the use of renewables? If yes,
when?
no, list of years 2001-2009, yes dk
year. dk, rf, na
Környezetvédelmi Alap Célelőirányzat
H2.(a) Have you received EU funds to support any of your
investments to reduce emissions or implement energy
efficiency measures or increase the use of renewables? If yes,
when?
(b) If yes, for which Operative Program; which call for
proposal?
no, list of years 2001-2009, yes dk
year. dk, rf, na
KEOP, KIOP, ERFA, dk, rf, na
H3. Have you received funding from the Norwegian Fund for
support? If yes, when?
no, list of years 2001-2009, yes dk
year. dk, rf, na
EGT és Norvég Finanszírozási Mechanizmusok program
POLANDP.1 Do you use the sectoral information brochures published by
the Ministry of Environment that include the information about
the best available technologies for different economic activity?
Since when?
no, list of years 2001-2009, yes dk
year. dk, rf, na
P.2 Have you ever taken a technological credit provided by the
Technological Credit Fund? If yes. when?
no, list of years 2001-2009, yes dk
year. dk, rf, na
P.3 Have you ever been co-financed or have taken a
preferential credit from the National Fund of Environmental
Protection and Water Management, Bank of Environmental
Protection and EkoFund? If yes, when?
no, list of years 2001-2009, yes dk
year. dk, rf, na
P.4 Have you ever benefited from the subventions and tax
reductions from the government for environmental purposes?
If yes, when?
no, list of years 2001-2009, yes dk
year. dk, rf, na
Questions Values Coding description
VIII. Post InterviewInterview duration (mins) number Minutes
Interviewers' impression of interviewee's reliability 1-5, dk, rf Low
Mid
High
Some knowledge about his site, and no knowledge about the rest of
the firm.
Expert knowledge about his site, and some knowledge about the rest
of the firm.
Expert knowledge about his site and the rest of the firm.
Interviewee seemed concerned about climate change 1-5, dk, rf Low
Mid
High
Not concerned.
Somewhat.
Very concerned.
Interviewee seemed skeptic about action on climate change 1-5, dk, rf Low
Mid
High
Not skeptic at all.
Somewhat skeptic.
Very skeptic.
Mentioned other climate change related policies text
Moaned a lot about high energy prices no, a little, a lot
Number of times interview needed to be rescheduled number
Seniority of interviewee Director, VP/General Manager,
Plant/Factory Manager,
Manufacturing/Production
Manager, (Environmental), Health
& Safety Manager, Technician
Age of interviewee
Note: Do not ask, guess!
number
Gender of interviewee male, female
Interview language English, French, German, Dutch,
Hungarian, Polish